protected cultivate sweed peppet inr ari … · au maroc (sasma" researc) anh extensiod...
TRANSCRIPT

PROTECTED CULTIVATED SWEET PEPPER IN ARID ZONE EVALUATION OF WATER REQUIREMENTS AND AMOUNTS PER WATERING
M. Sirjacobs I n s t i t u t Agronomique et Veterinaire Complexe Hort icole d'Agadir B.P. 438 Agadir Morocco
Abstract
Water consumption of protected cul t ivated sweet pepper, dr ip i r r i ga ted , is evaluated by various methods. Evaporation measurements of a "Class A" pan located in p last ic tunnels give the best evaluation The "Class A" pan coe f f i c ien t (Kp) to use in these conditions seems higher than generally proposed. A water regime which gives a s l i gh t water excess with regard to consumption measured at the lysimeter gave best production. Local ETp is largely reduced by the p last ic tunnels.
1. Introduction
With the rapid expansion of p last ic tunnel cu l t i va t ion in ar id regions of Morocco, an evolution of technics has become, necessary.
Control of water management is the f i r s t p r i o r i t y , pa r t i cu la r l y in the event of the use of d r ip i r r i ga t i on .
Previous experiments showed that management of i r r i g a t i o n according to data of a Class A evaporation pan located in p las t ic tunnels seems a re l i ab le method (Sirjacobs and Dada, 1983).
The fol lowing is a presentation of two t r i a l s which compared various evaluation methods of the water consumption of protected cu l t i va t ion of sweet pepper, and the e f fec t of water rat ioning.
2. Tr ia ls
The i r r iga ted area of Massa south of Agadir, Morocco, (9°39';30°261) is situated in an ar id region with a mild winter climate (Graph 1), on sandy so i l (Graph 2) with a water capacity of 12% ( v o l . ) .
Tr ia ls are carr ied out during two consecutive years. Over and above various biocl imat ic measurements, they consist of a comparison of d i f fe ren t water rat ioning.
Culture technigues
Winter crops of sweet pepper (cv. "Esterel") are arranged in 4 double rows in a p las t ic tunnel with a density of 2.4 plants per square meter. The tunnels, 7.7 m wide, are covered with u l t ra v io le t
Acta H o r t i c u l t u r a e , 191 , 1986 Solanacea in Mild Winter
199

polyethylene. Fe r t i l i sa t i on is by usual local methods, applied to the surface of the soi 1.
I r r i ga t i on
I r r i ga t i on hoses are located in the middle of the double rows: - in the f i r s t t r i a l : "NETAFIM" drippers (21/h) spaced every 0.5 m - in the second t r i a l : "BIWALL" perforated hoses (4.51/h/ l inear meter).
Crops are i r r iga ted da i ly .
The tunnels are divided into p lo t s , each one i r r iga ted with a d i f fe ren t amount, computed from maximum évapotranspiration of sweet pepper crops, measured with draining lysimeters located in the p lo t which is over- i r r igated (120% of maximum évapotranspiration) (Table 1).
Observations
Various data are col lected:
* in the tunnels: - a i r temperature and humidity - "Class A" pan evaporation (indoor Ep) - maximum évapotranspiration of sweet pepper crops (ETm) - f r u i t y ie ld
* in the open a i r - global solar radiat ion (Rg) - "Class A" pan evaporation (outdoor Ep)
3. Results and discussion
The p last ic shelters allow a favourable indoor climate for sweet pepper cu l t i va t i on , but a i r humidity values are sometimes very low (Graph 3).
3.1. Evaporation and évapotranspiration
The reducing ef fect of p last ic greenhouses on the water demand of the climate is remarkable (Graph 4) . This observation was par t i cu la r l y noticed during dry wind periods ("chergui") (Sir jacobs, 1985).
The "Class A" pan evaporation data, obtained under greenhouse conditions are the best correlated with water consumption of the crops (Table 2).
During the f r u i t production period, we see that the ETp/Ep ra t i o is equivalent to 1.2 ( f i r s t t r i a l ) and 1.4 (second t r i a l ) (Graph 5). However, l i t e ra tu re data show that the crop coef f i c ien t of sweet pepper (Kc), at th is stage of growth, reaches a maximum of 1.1 (Veschambre, 1980; Doorenbos and Pru i t t , 1976). So, we are led to estimate that the "Class A" pan coef f ic ient is higher than the un i t . Let us not forget that the usual values, proposed by the l i t e ra tu re for th is "Class A"
200
pan coe f f i c ien t , f a l l bt?tween 0.65 and 0.85 (Doorenbos and P r u i t t , 1976).
I t seems tha t , in an ar id cl imate, on l i gh t s o i l , those data have to be adjusted; th i s is also the conclusion reached by Cripps, George and Oakey (1982) a f te r t r i a l s in c l imat ic and soi l conditions s imi lar to ours, but in the open f i e l d .
3.2. Rationing
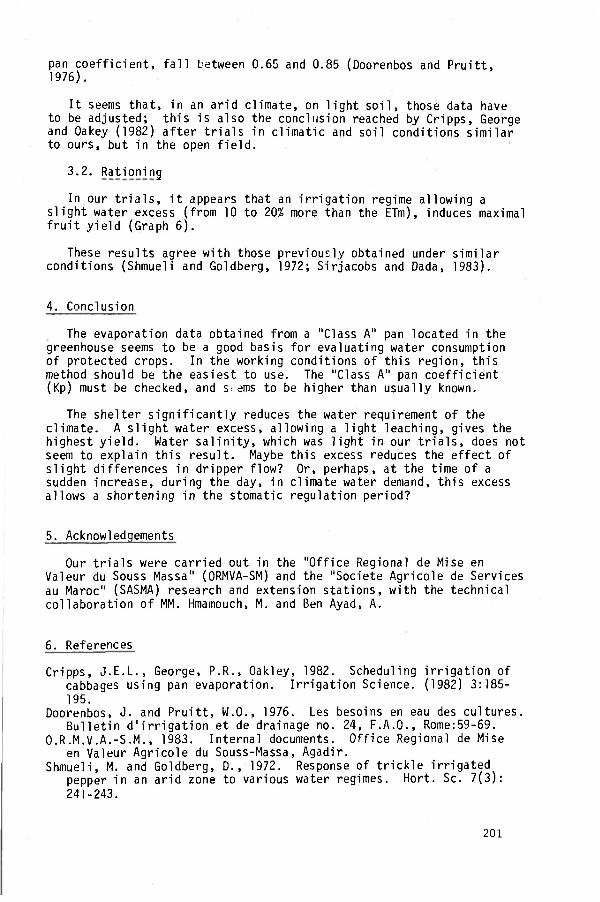
In our t r i a l s , i t appears that an i r r i g a t i o n regime allowing a s l i gh t water excess (from 10 to 20% more than the ETm), induces maximal f r u i t y ie ld (Graph 6) .
These resul ts agree with those previously obtained under s imi lar conditions (Shmueli and Goldberg, 1972; Sirjacobs and Dada, 1983).
4. Conclusion
The evaporation data obtained from a "Class A" pan located in the greenhouse seems to be a good basis for evaluating water consumption of protected crops. In the working conditions of th is region, th is method should be the easiest to use. The "Class A" pan coef f i c ien t (Kp) must be checked, and s ems to be higher than usually known.
The shelter s i gn i f i can t l y reduces the water requirement of the cl imate. A s l i gh t water excess, allowing a l i gh t leaching, gives the highest y i e l d . Water s a l i n i t y , which was l i gh t in our t r i a l s , does not seem to explain th is resu l t . Maybe this excess reduces the ef fect of s l i gh t dif ferences in dripper flow? Or, perhaps, at the time of a sudden increase, during the day, in climate water demand, th is excess allows a shortening in the stomatic regulation period?
5. Acknowledgements
Our t r i a l s were carr ied out in the "Off ice Regional de Mise en Valeur du Souss Massa" (ORMVA-SM) and the "Société Agricole de Services au Maroc" (SASMA) research and extension stat ions, with the technical col laborat ion of MM. Hmamouch, M. and Ben Ayad, A.
6. References
Cripps, J .E.L . , George, P.R., Oakley, 1982. Scheduling i r r i ga t i on of cabbages using pan evaporation. I r r i ga t ion Science. (1982) 3:185-195.
Doorenbos, J. and P r u i t t , W.O., 1976. Les besoins en eau des cul tures. Bu l le t in d ' i r r i g a t i o n et de drainage no. 24, F.A.O., Rome:59-69.
O.R.M.V.A.-S.M., 1983. Internai documents. Off ice Regional de Mise en Valeur Agricole du Souss-Massa, Agadir.
Shmueli, M. and Goldberg, D., 1972. Response of t r i c k l e i r r iga ted pepper in an ar id zone to various water regimes. Hort. Sc. 7(3): 241-243.
201

Sirjacobs, M. and Dada, O.S., 1983. I r r i g a t i o n local isee d'une cul ture de poivrons sous serre en région ar ide. Approche pratique de la gestion des apports d'eau. Bu l l . Rech. Agron. Gembloux. 18 (2):137-148.
Sir jacobs, M., 1985. In tens i f i ca t ion de l ' a g r i c u l t u r e en région aride par les cultures sous abr is. Colloque In ternat ional : "Développe-ment Agricole et Conservation du Patrimoine Naturel dans les Pays du Tiers-Monde". Faculté des Sciences Agronomiques de l ' E t a t , Gembloux, Belgium. 9-11 Oct. 1985.
Veschambre, D. and Vaysse, P., 1980. Memento goutte a goutte. C .T . I .F .L . , I .N.R.A., Paris:117-168.
Table 1 - Presentation of t r i a l s .
Tr ia l 1 Tr ia l 2
Planting date
Beginning i r r i ga t i on t r i a l s
End of t r i a l s
Compared rat ioning (% of ETm lysimeter)
I r r i ga t i on method
15/09/1981
31/11/1981
13/04/1982
100, 110, 120, 130%
NETAFIM drippers (2 1/h)
17/12/1982
12/01/1993
06/05/1983
90, 100, 110, 120, 130%
BI-WALL perforated hoses (4.5 1/h/m)
Table 2 - Correlations ( r ) observed between evaporations (Class A pan and RG/60) and ETm of the crops.
Tr ia l 1 Tr ia l 2
r s ign i f i ca t ion r s ign i f i ca t i on ( V /2) /2)
Indoor Ep 0.83 (0.9995) 0.73 (0.9995)
Outdoor Ep 0.70 (0.9995) 0.48 (0.999)
RG/60 0.62 (0.999) 0.42 (0.99)
202

Graph 1. OMBROTHERMIC DIAGRAM ( Agadir)
Kl O Co

Graph 2. CUMULATIVE GRANULOMETRIC CURVE (Soil of the "Massa" area - ORMVA-SM, 1983)

Dec. Jan. Feb. March Apr. Dec. Jan. Feb. March Two-weekly periods Two-weekly periods
Graph 3. AIR TEMPERATURE AND RELATIVE HUMIDITY IN PLASTIC TUNNEL ( t r i a l 1 )
Abs. Max Aver. Max
Average
Aver, min
Abs. min
/ \
/ \ Absolute /' \ Max
Average Max
Average
Aver, n
-o •r— £ Z3 .C
5

Tr ia l 1 Tr ia l 2 o <T3 S-
Feb. March Apr. May
Graph 4. CUMULATIVE MAXIMAL EVAPOTRANSPIRATION OF THE CROPS EVAPORATION (E pan)
(ETm) AND INDOOR AND OUTDOOR CLASS A PAN

K> o a*
1.5'
£ 1,0-
T r i a l 1
Q-U J
(1,20)
( 0 , 8 5 )
Dec. Jan. Feb.
Periods ( 3 days )
March Apr.
2,0
1,0 e to Q .
E I— UJ
T r i a l 2
Graph 5. RATIOS BETWEEN ETm OF THE CROPS AND INDOOR CLASS A PAN EVAPORATION (E pan)
(1 ,40)
(1 ,03 )
Feb. March Apr.
Periods ( 3 days )
May
r-o o
-1.5
co -ì:
• 1 , 0
100
Tr ia l 1
Total Yield
Export Yield
3,0 c CO Q.
\ en
•o ai
1,0
Tr ia l 2
110 120 130
Rationning ( % ETm )
Graph 6. FRUIT YIELD OBTAINED WITH DIFFERENT WATER RATIONNING
-I— 90
Total Yield
Export Yield
100 110 120 130
Rationning ( % ETm )