prosperity and poverty: livelihood transitions emerging ... · modulkiri province in northeast...
TRANSCRIPT
Prosperity and Poverty: Livelihood Transitions Emerging from
Land Use Change in Two Mondulkiri Communes
So Dane, Hak Sochanny, Oeur Il, and John McAndrew
February 2015
Analyzing Development Issues Centre
2
Prosperity and Poverty: Livelihood Transitions Emerging from Land Use Change in Two Mondulkiri Communes
So Dane, Hak Sochanny, Oeur Il, and John McAndrew
February 2015
Analyzing Development Issues Centre
3
In memory of Rebecca (Pem) Catalla
4
Table of Contents Acknowledgements 5 Abstract 6 Introduction 7
Research Problem 9 Research Focus 9
Conceptual Framework and Methods 11 Livelihood Transitions 11 Land Use Change 14
Data Collection Methods 15 Transitions in Dak Dam and Srae Preah Communes (2003-2012) 19
Land Use Changes 19 Livelihood Transitions 22 Differential Earnings in Diverse Income Groups 33 Land Transactions in Diverse Income Groups 39 Buying and Selling of Labor and Other Products 41
Poverty and Inequality in Dak Dam and Srae Preah Communes (2003-2012) 45 Household Income Inequality 45 Village Income Inequality 48
Conclusions 51 Recommendations 54 References 56 Appendices 59
5
Acknowledgements The research team of the Analyzing Development Issues Centre (ADIC) express our gratitude especially to the Bunong indigenous people in the Mondulkiri communes of Dak Dam and Srae Preah for sharing their experiences of land use change and livelihood transitions with us. The researchers would also like to thank the village, commune and district authorities and the government officials who supported and cooperated in this study. The team received invaluable assistance from the indigenous field researchers, Sra Lonh, Ki Neap, Vaing Samrith, Bunthen Chanthai, and Khan Channy, and their work was highly appreciated. This study was supported by IDRC through the Learning Institute (LI). The ADIC team acknowledges the contributions of LI team members Pech Sithan, Houn Kalyan, Chan Bunnara, and Khut Sreychantheary under the leadership of LI Executive Director Srey Marona. Critical comments made by LI Advisor Jean-Christophe Diepart throughout the study helped immensely to improve the quality of the research. The researchers likewise benefited from peer review comments made by Sarah Milne, Postdoctoral Fellow, College of Asia and the Pacific, Australian National University; and Sango Mahanty, ARC Future Fellow, College of Asia and the Pacific, Australian National University. The interpretations made in the report are those of the researchers alone.
6
Abstract This research focuses on livelihood transitions emerging from land use change in Dak Dam and Srae Preah communes in Mondulkiri province. The study argues that the rapid expansion of the market economy in these communes has resulted in dispossession from land and forest resources, a reliance on cash crops, land commodification, land concentration, social differentiation and economic inequality. The study explores these concerns within the literature on agrarian transitions. The methodological approach is both longitudinal, deriving insights across two points in time, and comparative, examining the disparate effects of land use change and market integration within the two study sites. Surveys based on random samples comprising 25 percent of the households were conducted in the two communes in 2002/03 and in 2012. In 2013, follow-up case study accounts were conducted with individually selected households.
Between the years 2003 and 2012 Dak Dam and Srae Preah households experienced a transition in agricultural production from the cultivation of upland staple crops, mainly for subsistence, to the production of cash crops for the market. As income shares from the cultivation of crops increased, those from forest products, hunting and trapping decreased. Economic growth gave rise to land concentration and high income inequality among households. Farmers who were better off cultivated larger upland areas and earned more from cassava production than did other income groups. Indigenous households in Srae Preah commune retained more access and control over their natural resources and achieved greater participation in the governance of these resources than did their counterparts in Dak Dam commune. The pathway pursued by the Bunong indigenous people in Srae Preah commune, while fraught with threats posed by the cassava boom crop and by economic land concessions and mine development, translated into greater prosperity and less poverty for more households than the pathway taken by the Bunong in Dak Dam commune.
7
Introduction Modulkiri province in Northeast Cambodia is largely inhabited by the Bunong indigenous people who for centuries have effectively exploited the natural resources of their upland forested habitat. Since the 1990s, the opening up of the Cambodian economy has had far reaching consequences for the province. Forest concessions and illegal logging, economic land concessions (ELCs), corporate mining concessions, and the unregulated hunting of wildlife have diminished the rich natural resources of the province. Rapid in-migration has exacerbated the decline. As natural resources become more circumscribed, indigenous people have been forced to make adaptations to preserve their way of life (McAndrew and Oeur 2009).
Mondulkiri’s land size of 14,288 square kilometers makes it the largest province in Cambodia, and its rich natural resources make it a prime attraction for corporate concessions. In January 2002, the government banned logging operations under large-scale forest concessions but not before the Samling Corporation concession in Kratie and Mondulkiri provinces had logged 73,199 hectares of forest (McKenney et al. 2004). Meanwhile the government’s policy to grant ELCs continues unabated.1 In 2012, 21 companies held ELCs covering nearly 148,410 hectares in Mondulkiri primarily for the development of rubber plantations (Appendix 1). In addition, in 2012, 21 mining corporations held mining licenses to explore almost 6,144 square kilometers or 43 percent of the province’s total land area (Appendix 2).
Population growth in Mondulkiri rose exponentially from 32,407 in 1998 to 61,107 in 2008 due mainly to Khmer in-migration. This represents an annual growth rate of 6.34 percent compared with 1.54 percent for Cambodia as a whole during the same years. From 2004 to 2008, 42 percent of the overall migrations in Cambodia took place from rural to rural areas (Chheang and Dulioust 2012). Notably, 29 percent of Mondulkiri’s 2008 population had in-migrated from other areas. The proportion of Khmer residents increased while that of the indigenous inhabitants declined: estimates suggest that the proportion decreased from 71 percent in 1998 and 57 percent in 2004, to 47 percent in 2008 (Asian Development Bank 2000, Backstrom et al. 2007, National Institute of Statistics 2009). Khmer in-migration intensified population pressure on land resources and increased property values which increased the rates of land alienation among indigenous Bunong.
Khmer in-migration in Mondulkiri province and the establishment of ELCs are interlinked. Net out-migrations occur mainly from the central areas of Cambodia where population densities are high and agricultural land is scarce. Government policy encourages displaced and landless
1 On 7th May, 2012, Prime Minister Hun Sen signed Directive 01BB that provisionally suspended the granting of ELCs but subsequent announcements in the Royal Gazette showed that the Directive was being ignored

8
populations to resettle in peripheral provinces such as Mondulkiri and promotes ELCs in these areas as opportunities to generate revenue and create jobs locally. Landless migrant farmers are often contracted upon arrival by agricultural companies to clear land. Many then go on to encroach upon open and degraded forest areas and unused or non-occupied land near the concessions. These areas are invariably located within indigenous domains. Conflicts often arise between the in-migrants and the concessions holders over boundary intrusions. Conflicts also arise between the in-migrants and indigenous people over intrusions into ancestral territories (Chheang and Dulioust 2012).
Substantial investments in ELCs in Northeast Cambodia have taken place in parallel with the conversion of small-holder subsistence farming into crop production for the market. Small-farmer cultivation of rubber, cashew and cassava has in turn precipitated a move away from shifting cultivation to the production of crops on permanent farms (Fox et al. 2008). In Mondulkiri, cassava production increased dramatically in the new millennium from 546 tonnes in 2001 to 89,993 tonnes in 2007. Harvested areas of cassava in the province likewise rose from 52 hectares in 2001 to 5,806 hectares in 2007 (Ministry of Agriculture, Forestry and Fisheries 2008). This upsurge reflected a change in cassava cultivation from a food crop to an industrial crop with multiple uses such as animal feed and ethanol. The high export demand for cassava resulted in rising market prices for the crop locally albeit with some volatility in recent years.
The increased price of cassava was due primarily to a growth in the number of processing factories. This created high market demand and strong competition among the factories in buying cassava root directly from farmers (Sopheap et al. 2011). In 2007, Mondulkiri’s cassava crop was generally processed locally in Kampong Cham province for export to Thailand or Vietnam or it was exported directly to Vietnam for processing there. While cassava became an increasingly important cash crop for Mondulkiri’s upland farmers, cassava processors sought to produce the crop themselves through ELCs, thus bypassing supply problems with local farmers.2
As Bunong indigenous villagers struggle to adapt to the rapid depletion of their natural resource base, progressive legislation enacted in Cambodia since 2000 has provided a legal framework for preventing further decline. The Forestry Law of 2002 recognizes and guarantees the traditional user rights of local communities to collect forest by-products. The Land Law of 2001 enables indigenous communities to gain communal titles to their traditional lands and protects the rights of indigenous communities, formed as legal entities, to use and manage these lands, even before their full ownership rights have been recognized in a communal title. This makes the sale of indigenous land outside the community illegal. However, amid increasing rates of indigenous land alienation, the government has lacked the political will to implement communal land titling (Analyzing Development Issues 2010): by 2012, only three villages in Cambodia had received their communal titles from the government. The situation became further complicated in July 2 For example, the Khaou Chuly Development Corporation planned to invest USD 7 million to grow cassava on 5,000 hectares of land in Mondulkiri. The company also planned to build a factory to process 150,000 tonnes of cassava per year for export to China (Ministry of Commerce, Trade Promotion Department 2011)
9
2012 when the government halted all communal land title processes under Directive 01BB. The Directive intended to expedite the issuance of private land titles and thousands of student volunteers were recruited to demarcate lands in conflict with ELCs. This not only formalized prior alienation and fragmentation, it rendered communal and individual titles mutually exclusive and thereby accelerated land commodification (Milne 2013).
Research Problem In 2003 CIDSE (Coopération Internationale pour le Développment et la Solidarité) Cambodia conducted a study that focused on changes taking place among Bunong indigenous people in two Mondulkiri communes as a result of increased market activity and diminished natural resources (McAndrew et al. 2003). Despite the destruction of forest resources through forest concessions, illegal logging, and unregulated hunting, Bunong villagers in Dak Dam and Srae Preah communes remained largely dependent on forest resources for their subsistence. In attempting to adapt to the decline in natural resources the people had been subsisting on less and further exploiting their diminished resource bases. This led to intensive hunting in Dak Dam and the tapping of young resin trees in Srae Preah. Diminished income from forest resources placed greater importance on the cultivation of crops and the raising of livestock and poultry. However, declining soil fertility and irregular rainfall, which the villagers linked to deforestation, limited crop production. Market demand for cash crops such as cashew nuts had also been less than expected. Meanwhile increased market activity had not transformed the local residents into entrepreneurs or traders, nor had it provided them with remunerative and sustained opportunities as wage workers. Given the inward orientation of household subsistence strategies and the lack of viable short-term alternatives, access to and control over natural resources remained critical for household survival.
This study takes as its baseline the 2003 CIDSE study and assesses how land use change has affected livelihood transitions in Dak Dam and Srae Preah communes over the past nine years. Since 2003, corporate incursions have continued in both communes with the expansion of ELCs and mining exploration. The construction of the national concrete road and bridges from Kratie province to Mondulkiri’s provincial capital of Sen Monorum has likewise accelerated Khmer in-migration and market activity in the two communes. In recent years, cash crop production of cassava and cashew nuts has increased rapidly, particularly in Srae Preah commune, in response to market demand. This in turn has spurred the in-migration of Khmer agricultural laborers in Srae Preah commune and areas nearby (Milne 2013). These developments led the authors to undertake a diachronic study of livelihood transitions and land use change in the two communes from 2003 to 2012.
Research Focus In this research, therefore, we focus on livelihood transitions emerging from land use change in Dak Dam and Srae Preah communes. The rapid expansion of the market economy in these largely indigenous communes has resulted in dispossession from land and forest resources, a

10
reliance on cash crops, land commodification, land concentration, social differentiation and economic inequality. Market integration has likewise transformed Bunong livelihoods providing a measure of prosperity for some while allowing others to remain in, or fall into, poverty. Our study explores these consequences and concerns within the literature on agrarian transitions drawing particularly on research undertaken in Southeast Asia and in Cambodia. The methodological approach is both longitudinal, deriving insights across two points in time, and comparative, examining the disparate effects of land use change and market integration within the two study sites. The research also benefits from a comparison of four household income groups in each commune in 2012, and follow-up case study accounts in 2013 from individually selected households. The study aims to contribute to the understanding of livelihood transitions and market integration taking place among indigenous people in Mondulkiri and to inform government policy making and NGO development programming relating to indigenous groups.

11
Conceptual Framework and Methods
In building the conceptual framework of our study we explore the links between the notions of livelihood transitions and land use change and maintain that participation of indigenous groups in natural resource governance is crucial to ensure household well-being in the transition process.
Livelihood Transitions We use the concept of transitions in our research as a heuristic to describe and explain the iterative process of livelihood and land use change in Dak Dam and Srae Preah communes. Martens and Rotmans (2005) define a transition as “a gradual, continuous process of societal change where the structural character of society (or a complex sub-system of society) transforms…. A transition process is not set in advance, because during a process of change, humans are able to adapt to, learn from and anticipate new situations. Rather, transitions are possible development paths where the direction, size and speed can be influenced through policy and specific circumstances.” This research explores the development paths pursued by households within the two communes as they come to terms with the expansion of the market economy.
Land use transitions in Mondulkiri province are strongly associated with the transformation of swidden farming. Cramb et al. (2009) examine swidden transformations in Southeast Asia within households and communities for whom this method of farming has been integral to their livelihoods but who through choice or necessity have partly or wholly transformed their swidden systems in recent years. Following Ellis (2000), the authors consider that households or communities have a livelihood platform consisting of various assets. Access to these is modified by prevailing social relations, institutions, and organizations in the context of exogenous trends (population growth, new technology and market expansion) and shocks. These circumstances influence the choice of livelihood strategies (intensification, commercialization, migration or diversification) that comprise activities, some based on natural resources (swidden, cash crops or forest collection) and others that are not based on natural resources (non-farm work, trade or remittances).
In Cambodia, policymakers often view swidden farming as an obstacle to more efficient crop production systems such as the plantation model espoused in ELCs (Cramb et al. 2009, Fox et al. 2008). However, Cramb et al. (2009) argue that swidden farmers are not resisting appropriate and supportive forms of development. They note that cash crops often improve household livelihoods even though total reliance on specialized crops exacerbates vulnerability. Nonetheless, the authors maintain that growing differences within and between communities resulting from swidden transformations can leave some groups marginalized and worse off than before. Specifically, they indicate that externally imposed change such as restrictive land use
12
zoning, resettlement and commercial estates can have adverse effects on swidden farmers. They maintain, as do we, that local people need to be actively involved in planning, implementing, monitoring and evaluating development and conservation programs in swidden lands.
We argued in the introduction that livelihood transitions in the two communes have resulted in prosperity for some and impoverishment for others. De Koninck et al. (2012) review a half-century of agrarian transformations in Southeast Asia and ask a question pertinent to this point: What are the conditions that characterize situations where most people have improved, and, likewise, the conditions where people have stagnated or become marginalized? The authors maintain that states of wealth and poverty should be understood as the outcomes of processes of improvement and impoverishment brought about by the interplay of local and specific conditions, but set against a structural context that might be connected to majority-minority relations or to the extraction of natural resources by powerful actors. In Mondulkiri the structural context that provides the backdrop to local interactions involves a nexus of majority Khmer and minority Bunong relations as well as the active pursuit of ELCs and mining exploration by powerful corporate and state actors.
In the cases reviewed by De Koninck et al. (2012) the impoverishment of significant numbers of people involved displacement from land and other productive natural resources in the face of rapid wealth generation. This had been brought about by capital-intensive extractive ventures, combined with displaced people’s lack of access to other agrarian and non-agrarian livelihood opportunities. Vandergeest and Rigg (2012) pursue this discussion and reiterate that where exit options are limited, vulnerability to marginalization and displacement grows as does impoverishment induced by commercialization and resource extraction. Our research in Dak Dam and Srae Preah communes documents how corporate ventures have led to villages being dispossessed of land and forest resources and reveals how the exclusionary effects of market integration inhibit indigenous residents from participating in certain types of wage work and from becoming entrepreneurs and traders. We affirm the position of Vandergeest and Rigg (2012) that where exit options are impeded or of poor quality, the governance and allocation of land and natural resources remain critical. This is particularly the case in upland areas inhabited by indigenous people who have been marginalized in part due to their ethnicity.
In Mondulkiri the widespread adoption of cassava as a cash crop appears to generate wealth sufficient to make it a viable exit option to those dispossessed from ancestral land and forest resources. But this should be viewed with caution in consideration of boom crops and market integration. Li (2012) examines the effects of cacao production as a boom crop in Upland Sulawesi in terms of social differentiation among swidden farmers. Shortly after the transition to cacao, some farmers had accumulated large tracts of land, while many of their neighbors and kin had become landless and jobless, with little demand for their labor. The author argues that indigenous hill tribes who have not previously experienced limitations to their access to agricultural land, likewise have no mechanisms to prevent the accumulation of land by a few, to claim a right to work, or to share the profits. The author maintains that when indigenous groups

13
who have relatively open access to land rapidly adopt boom crops, social differentiation proceeds far too quickly for protective countermeasures or moral arguments against differentiation to arise.
Bunong Livelihood Systems We asserted in the introduction that the rapid expansion of the market economy in the two communes has resulted in land commodification, land concentration and a reliance on cash crops. At this point it will be helpful to review how these developments took place. Prior to French colonialization most Bunong practiced swidden cultivation usually within the territorial limits of Bunong-defined villages, on land cleared by slash and burn. Swidden provided rice, vegetables, corn, plants for dyeing, and textiles such as cotton. After two or three years, the swidden plots were left fallow for five to 20 years, allowing time for the vegetation and soils to regenerate. The Bunong entered the forest to gather the wax of wild bees, tubers and non-timber forest products like rattan wood or wood oil. They also hunted small and large game for food. The forest was considered to be inhabited by spirits that the Bunong respected and feared (Guerin 2007).
At the end of the 20th century swidden cultivation was still the major rice system among indigenous people in Mondulkiri. Forest areas were cleared and planted with rice for two to five years before farmers shifted to new areas. From February to April trees and other plants were cut, left to dry and burned. From April to June seeds were dibbled into the soil. From August to December the rice was harvested depending on the growth duration of the varieties planted. In the mid-1990s Mondulkiri was only one of two Cambodian provinces where upland rice cultivation was the major rice ecosystem. In the 1994/95 crop season, upland rice was cultivated on 2,280 hectares in Mondulkiri, early lowland rice on 920 hectares, medium lowland rice on 750 hectares, and late lowland rice on 1,550 hectares3. Vegetables and fruits were commonly grown in the swidden plots. Some indigenous groups cultivated lowland rice in addition to upland rice (Javier 1997). At the dawn of the new millennium the collection of liquid resin as a non-timber forest product was a valuable income source (Evans et al. 2003, McAndrew et al. 2003). By 2007, the production of cassava as a cash crop had grown rapidly in response to market demand and had become increasingly important to indigenous livelihoods (Sopheap et al. 2011).
Hill-tribe land and forests were traditionally held as communal property. Land was not sold or transferred, but was seen as a resource held in trust by the community for future generations. According to customary law, families had use-rights over the land that they currently worked and over produce from fallowed land that might be farmed again. Village boundaries set limits to swidden cultivation, and indigenous farmers did not cross land that was under cultivation by a 3 By contrast the upland rice ecosystem in Cambodia as a whole was the smallest. In the 1994/95 crop season 354,300 hectares in Cambodia was cultivated to early lowland rice, 721,380 hectares to medium lowland rice, 671,000 hectares to late lowland rice, 169,210 hectares to dry season rice and only 37,910 hectares to upland rice (Javier 1997)

14
neighboring village. In the past, the abundance of land prevented major land conflicts between villages. In recent years these long-held customs have undergone change. The national government has extended its claims to indigenous lands as part of the state’s public land domain. Moreover, the influx of migrants and outside investors has intensified land competition, with land increasingly considered as a market commodity, even by local people (Fox et al. 2008).
Milne (2013) examines the evolution of the land market in O Rona village located near Srae Preah commune in Keo Seima district. The author notes that the process began in the 1990s with logging undertaken first by military groups and later by the Samling Corporation concession when the loss of resin trees induced villagers to rely increasingly on cultivation. The turning point came in 2005/06 when the villagers began to grow cassava after a Vietnamese company helped them to clear land, provided them with seedlings and guaranteed to purchase their harvest. Since then, cassava cultivation has become the most profitable land use option, stimulating the land market. The effects of market integration have appeared to foster the accumulation and concentration of assets and land among a few wealthy individuals. Meanwhile land commodification and land dispossession have been linked as rich and powerful entrepreneurs or state officials from outside the village have purchased or grabbed land while indigenous O Rona villagers have engaged in voluntary land sales as an opportunity to make money.
Land Use Change The concept of transition as defined above by Martens and Rotmans (2005) is useful for understanding the dynamics of land use change. Lambin et al. (2003) argue that land use change is driven by a synergy of factors such as resource scarcity, which intensifies pressure of production on resources, changing opportunities created by markets, and policy intervention from outside. Further factors include the loss of adaptive capacity and increased vulnerability, and changes in social organization, in access to resources and in attitudes. Several factors, such as resource scarcity, increased vulnerability and changes in social organization, are mostly endogenous. Other factors, such as changing market opportunities and policy intervention, are largely exogenous. Transitions in land use are thus seen as multiple and reversible processes with large variability in specific pathways.
Land Use Change in Cambodia In her review of literature on land use change in Cambodia, Taylor (2011) notes that changes in land use acutely affect vulnerable populations, especially indigenous people, and cover a wide spectrum including agriculture, forests, and the fishery sector. Taylor argues that agricultural land use in Cambodia has expanded considerably during recent years as the population has expanded and as ELCs have been awarded for corporate agribusiness. The rapid change resulting from a growing population in particular and economic growth in general has changed land use patterns and land markets and has led to rural migration and land disputes. These factors have all exerted pressure on natural resources, leading to deforestation and forest degradation. Meanwhile
15
ELCs and mining concessions continue to pose a threat to community land holdings and foster an uncertain land tenure environment. Land use trends reviewed by Taylor are all relevant to our research in Dak Dam and Srae Preah communes.
In Cambodia, cash crop production, land commodification, land concentration and social differentiation are linked in ways that resonate with Li’s (2012) study of cacao production in Upland Sulawesi that was discussed earlier. Diepart and Dupuis (2014) have presented case studies from Northwest Cambodia revealing how profit from cash crop production increases land values and develops the land market reinforcing land concentration within the village. Land concentration occurs when indebted smallholders sell and rent-out land to more enterprising farmers. This results in land-poor peasants who rely on agricultural wage labor as a source of income. The influx of new migrants simultaneously increases the pressure on land and decreases wage labor opportunities in the village. Marginalized families are forced to migrate to areas where demand for labor remains high. Land access change thus engenders a process of social differentiation and the polarization of households in relation to agricultural production.
Crucially our review of literature on land use change underscores the importance of upholding indigenous rights in the transition process. McAndrew and Oeur (2009) present case studies from Northeast Cambodia, including those from Dak Dam and Srae Preah communes, that show how the market economy, particularly the market for land, seriously erodes local governance structures and the communal solidarity of indigenous groups. Land sales are seen not only to diminish the natural resources required for sustainable livelihoods but also to debilitate cultural and social resources needed to deal with the exigencies of change itself. The authors argue that hill tribes who retain control over their communal land and forest resources are in a stronger position to adapt to the rapid and inevitable change brought by the market economy than those who do not. This requires that government policies, laws, and practices protect communal land rights and accommodate indigenous peoples in the development of the Northeast.
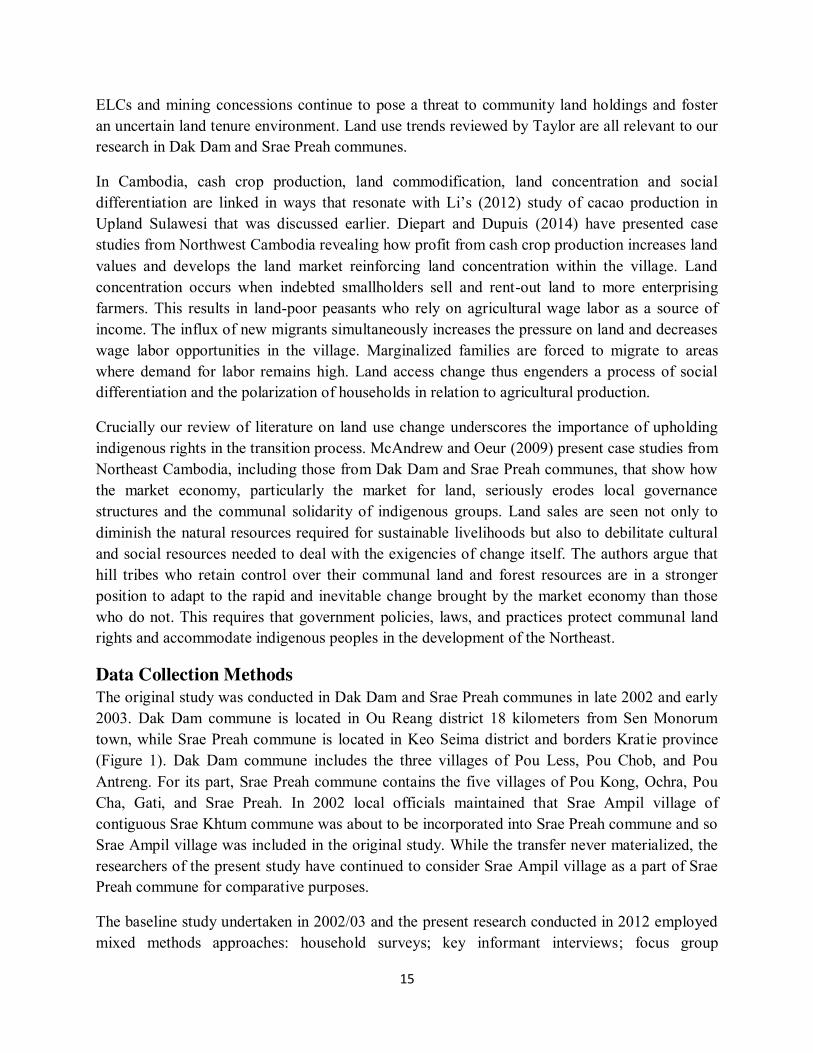
Data Collection Methods The original study was conducted in Dak Dam and Srae Preah communes in late 2002 and early 2003. Dak Dam commune is located in Ou Reang district 18 kilometers from Sen Monorum town, while Srae Preah commune is located in Keo Seima district and borders Kratie province (Figure 1). Dak Dam commune includes the three villages of Pou Less, Pou Chob, and Pou Antreng. For its part, Srae Preah commune contains the five villages of Pou Kong, Ochra, Pou Cha, Gati, and Srae Preah. In 2002 local officials maintained that Srae Ampil village of contiguous Srae Khtum commune was about to be incorporated into Srae Preah commune and so Srae Ampil village was included in the original study. While the transfer never materialized, the researchers of the present study have continued to consider Srae Ampil village as a part of Srae Preah commune for comparative purposes.
The baseline study undertaken in 2002/03 and the present research conducted in 2012 employed mixed methods approaches: household surveys; key informant interviews; focus group
16
discussions; participatory rural assessments (PRAs); and the use of secondary sources. The household survey conducted in 2012 incorporated the questions of the 2002/03 survey on livelihood strategies, earning sources and land transactions. The researchers followed the method used in the original survey and selected a random sample comprising 25 percent of households in each village of the two communes for interview. Household lists requested from the respective commune and village chiefs were validated and updated through a process that included drawing up spot maps to ensure on-the-ground verification. Table 1 presents the household samples and populations of the household surveys conducted in 2002/03 and 2012.
Table 1: Household (HH) samples and populations of household surveys, Dak Dam and Srae Preah communes, 2002/03 and 2012
2002/03 2012 HH Sample HH Population HH Sample HH Population Dak Dam 65 257 85 316 Srae Preah 74 316 106 430 Total 139 573 191 746
Figure 1: Dak Dam and Srae Preah communes, Mondulkiri province
In 2002/03 and 2012 Bunong interviewers were recruited and trained to conduct the household surveys. Of note, two of the Bunong researchers who participated in the 2002/03 survey

17
comprised the core members of the five-person team that conducted the 2012 survey. The Bunong interviewers asked the survey questions primarily in the Bunong language and recorded the responses in Khmer. In both surveys the researchers computed the cash values of subsistence crops and products and then combined these with cash income obtained from goods sold and wages earned in the past year. This allowed them to use income as a proxy indicator for livelihood security. Income sources included those available from crop production, gathering and hunting, and those accessible from wage work and trade.
Cash values for wages earned and for profit realized from goods made and sold (e.g. rice wine, baskets and winnows) and from goods traded (e.g. livestock, resin and honey) were provided directly by the respondents. Average cash values for subsistence crops and products were determined through focus group discussions with key informants conducted in the villages of both communes. The average cash values were used to compute cash equivalents for the subsistence products and crops delineated by the respondents. These cash equivalents were then combined with actual cash earnings to estimate annual household incomes.4 Fieldwork for the present study was conducted in Dak Dam and Srae Preah communes from January to May 2012. In December 2012 the World Bank provided the researchers with poverty line calculations that enabled them to stratify the household survey respondents into groups above and below the poverty line. In June 2013 the researchers returned to Dak Dam and Srae Preah communes and conducted follow-up key informant interviews with households from the various stratified income groups.
In 2012, key informant interviews and small focus group discussions were conducted with local authorities, key leaders, and selected villagers with specific knowledge on issues of livelihood security and land use change. NGO workers in Mondulkiri province were also interviewed. The Khmer researchers were responsible for these interviews although at times they were assisted by the Bunong researchers. In all, the researchers conducted key informant interviews with 26 respondents in Dak Dam commune, 51 respondents in Srae Preah commune, 12 government officials at provincial and district levels, and 7 NGO staff. In addition the researchers conducted 13 small focus group discussions mostly with women. The key informant and small focus group discussions were guided by an approach whereby the researchers jointly collected and analyzedthe data and decided what data to collect next and where to find them (Glaser and Strauss 1967).This approach permitted research problems to be re-conceptualized in response to the data, thus dropping meaningless questions while taking into account new information that had been gathered. In 2012, the researchers conducted PRAs at the village level in each of the six Srae Preah villages and at the commune level in both Dak Dam and Srae Preah communes. The PRA process employed in 2012 generally followed the PRA approach used in 2002/03. In 2002/03 the villagers constructed time lines and identified and analyzed natural resource management issues 4 While the emphasis was on net income earned it was not always possible to factor out costs of production

18
they had encountered over several historical periods. These included the loss of resin tress, the depletion of forest, wildlife, and fishing resources, and the causes and consequences of these outcomes. In 2012, the villagers similarly constructed time lines and analyzed natural resource management issues. In addition they examined changes taking place in crop cultivation and explored the underlying reasons for these changes. Trends such as Khmer in-migration, corporate land encroachments, and the illegal timber trade were likewise identified and discussed. The 2002/03 survey relied on the respondents’ recall of products gathered, hunted, and cultivated, and wages earned in the past year to construct household incomes in the past year. This was an inherent weakness of the 2002/03 survey that was repeated in the 2012 survey. Key informant interviews with villagers in 2002/03 were likewise based on respondents’ perceptions and analyses which were also the case in 2012. The limitations of these methods should be recognized. At the same time the limitations are not insurmountable as data gathered from these methods have been shown to provide reliable estimates and valuable insights (McKenney et al. 2004).

19
Transitions in Dak Dam and Srae Preah Communes (2003-2012)
We argued in the introduction that market integration in the two communes resulted in dispossession from land and forest resources, a reliance on cash crops, land commodification, land concentration, social differentiation and economic inequality. This section presents findings and analysis that support this argument. It starts with an overview of the land use changes that have taken place in Dak Dam and Srae Preah communes from 2003 to 2012. The focus then shifts to households in Dak Dam and Srae Preah communes and examines livelihood transitions from 2003 to 2012, differential earnings and land transactions in diverse income groups, and overall levels of poverty and inequality.
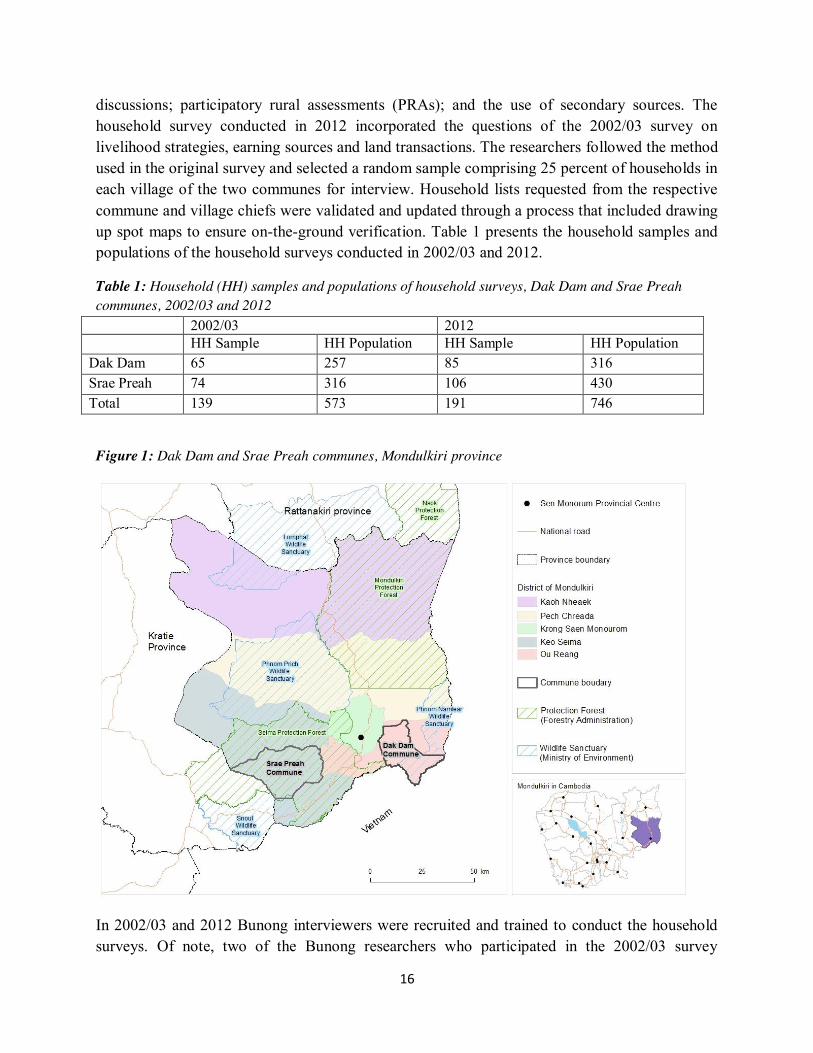
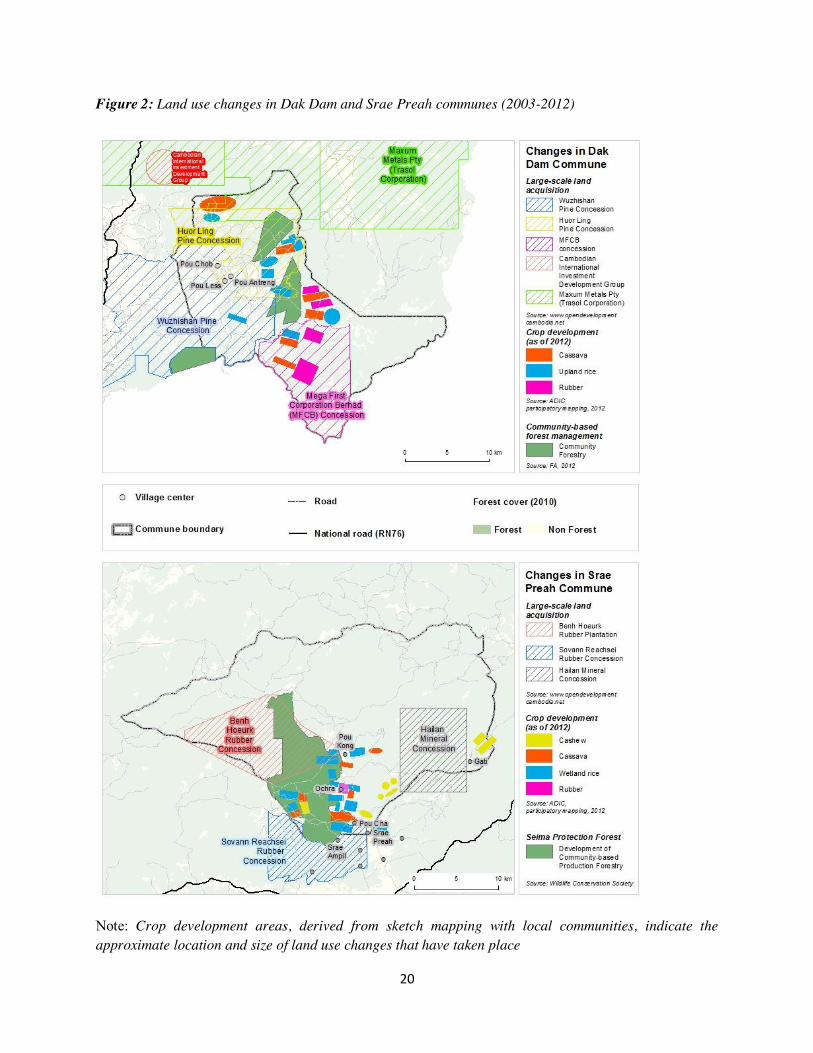
Land Use Changes From 2003 to 2012 a major agricultural transition took place in the two communes as villagers moved from the cultivation of staple crops, mainly for subsistence, to the production of cash crops for the market (Fox et al. 2008). In Dak Dam commune the development of cassava as a cash crop took place primarily in Pou Antreng village. Of note, residents of Pou Chob and Pou Less villages also had upland farms in Pou Antreng village. In Srae Preah commune the development of cassava occurred mainly in Srae Preah and Pou Cha villages, while the development of cashew nut cultivation took place mostly in Gati and Srae Preah villages. In Srae Preah commune the expansion of paddy rice production took place mainly in Srae Ampil and Srae Preah villages (Figure 2). Srae Preah commune residents likewise cultivated upland and lowland farms outside of their own villages.
Parallel to the changes taking place in smallholder cultivation, the establishment of ELCs in the two communes from 2003 posed serious short- and long-term threats to indigenous access to land and forest resources. In Dak Dam commune the Chinese Wuzhishan L.S. Group in 2004 started to develop a 10,000 hectare pine tree plantation which adversely affected grazing areas and the expansion of indigenous farms (McAndrew and Oeur 2009). In 2010 the Chinese Huor Ling (Cambodia) International Insurance Company was granted a concession to develop an 8,400 hectare pine plantation that included areas accessed by Dak Dam residents. In 2012 the Malaysian Mega First Corporation Berhad was awarded a concession of 9,477 hectares in the Namlear Wildlife Sanctuary Zone within Dak Dam commune to develop a rubber plantation.
20
Figure 2: Land use changes in Dak Dam and Srae Preah communes (2003-2012)
Note: Crop development areas, derived from sketch mapping with local communities, indicate the approximate location and size of land use changes that have taken place

21
In Srae Preah commune ELCs posed similar threats to indigenous access to land and forested areas. In 2011 the Sovann Reachsei Company was awarded a 6,525 hectare concession to develop a rubber plantation in the Snoul Wildlife Sanctuary. As part of its initial operations the company cut down an estimated 2,000 resin trees in Srae Ampil village. In 2011 the Vietnamese Benh Hoeurk Kratie Rubber 1 Company Limited was granted an 8,926 hectare concession to develop a rubber plantation within areas of Srae Preah commune which likewise contained resin trees tapped by villagers (Figure 2).
Corporate incursions resulting in resource dispossession in Dak Dam and Srae Preah communes were not limited to ELCs. Since 2003, mine exploration has likewise posed actual and potential threats to indigenous access to land and forest domains. As of 2012, mine exploration in Dak Dam and Srae Preah communes had occasioned some, albeit not major, dispossession for local inhabitants. However, as mineral prospecting proceeds from the initial grassroots and advanced exploration stages on to deposit and mine development, and the start of mine operations, more serious social and environmental impacts are inevitable (Eggert 2010).
From 2006 to 2009, BHP Billiton and Mitsubishi Corporation undertook mining exploration for bauxite in a 996 square kilometer area that included Dak Dam commune. In 2008 Dak Dam villagers, interviewed in an NGO study, mentioned loss of sacred land, and animals falling into exploration pits as issues arising from the company’s mining activities (Beaumont 2008). In 2011, China’s Mongolia Erdos Hongiun Holding Group and its local partner Cambodia International Investment Development Group started bauxite mining exploration in a 360 square kilometer area that covered lands in Dak Dam commune formerly under the BHP Billiton and Mitsubishi concession. The company’s development plans included the establishment of an aluminum refinery. In 2011 The Cambodia Daily reported that more than 369 families in the three villages of Dak Dam commune had raised concerns about the mining project (Hul and Marks 2011). In 2010 Maxum Metal Pty Limited owned by Transol Corporation was granted licenses for mine exploration covering 821 square kilometers that included areas nearby Dak Dam commune (Figure 2).
In Srae Preah commune the Chinese Hai Lan Company in 2006 started to explore for gold in a 20 square kilometer area around Gati village and in 2009 announced that it would extend its exploration activities to the full 80 square kilometer area covered by its license into Pou Cha, Pou Kong and Ochra villages. As of 2010, the initial mining exploration in Gati village had already exerted some adverse effects on the livelihood security of indigenous households. These included a drop in the number of wildlife hunted and trapped, the reduction of resin and other products gathered from the forest, and a dip in fish catches (Analyzing Development Issues 2010). Subsequently, the Hai Lan concession was reportedly transferred to the Alumina Company, a Cambodia-Vietnam joint venture (Figure 2).
Corporate claims to land and forest resources in Dak Dam and Srae Preah communes did not go uncontested. In Dak Dam commune villagers working with the NGO My Village joined with the
22
Forest Administration (FA) in 2008 to establish community forests in the villages of Pou Antreng (1,334 hectares), Pou Chob (904 hectares) and Pou Less (1,573 hectares). In 2009 a Prime Ministerial sub-decree created the 292,690 hectare Seima Protection Forest (SPF) which covered the entirety of Srae Preah commune. The SFP, managed by the FA with support from the NGO Wildlife Conservation Society, was known as the Seima Biodiversity Conservation Area (SBCA) from 2002 to 2009 before changing to its current name (Evans et al. 2013). A Community-based Production Forestry initiative was established within 12,000 hectares of the SPF buffer zone (Figure 2). A REDD (Reducing Emissions from Deforestation and Forest Degradation) pilot project was also initiated in the SPF core zone (Evans et al. 2012). Amid these overarching land use developments, Dak Dam and Srae Preah households experienced changes in their livelihoods.
Livelihood Transitions5 The shift from the cultivation of staple crops for subsistence to the production of cash crops for the market led to a reliance on cash crops in Dak Dam and Srae Preah communes. Meanwhile the loss of forest resources led to a diminished reliance on forest products in both communes (Fox et al. 2008, Taylor 2011). We present here the livelihood transitions that took place separately in each commune and then discuss the comparative pathways pursued by households in the two communes.6
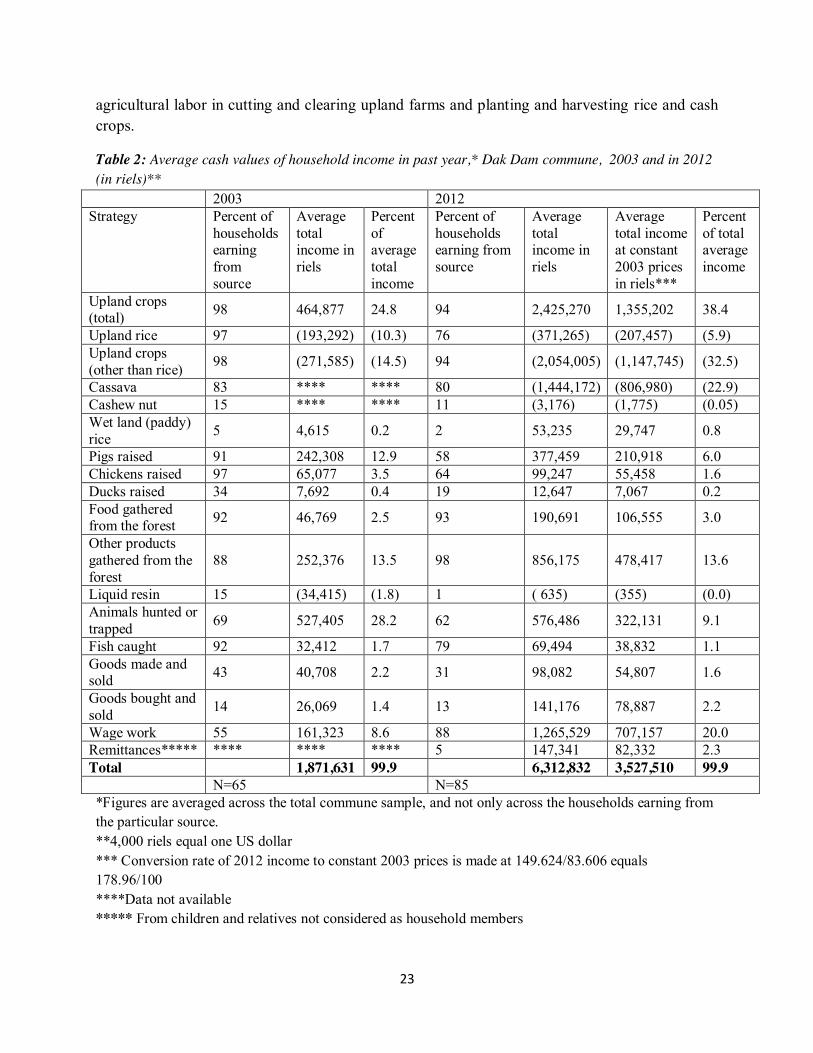
Dak Dam Commune Cash values of household income in Dak Dam commune from 2003 to 2012 reveal important changes taking place within the local economy (Table 2).7 Of major significance, the average annual household incomes of the sample groups increased 3.4 times from 1,871,631 riels (USD 468) in 2003 to 6,312,832 riels (USD 1,578) in 2012.8 Economic growth in Dak Dam commune was due mainly to earnings derived from cash crop production of cassava on upland farms and from wage work principally from agricultural labor on small farms within the commune. High inflation rates during the interim years likewise contributed to the high income increase. Earnings from upland crops increased from 24.8 percent of overall household income in 2003 to 38.4 percent in 2012. Earnings from cassava production alone accounted for 22.9 percent of total household income in 2012. Similarly, earnings from wage work rose from 8.6 percent in 2003 to 20 percent in 2012. Gains in wage work resulted primarily from indigenous involvement in
5 A summary of the major study findings first appeared as So et al. 2012. An abridged version of the study appears as Chapter 5 in Diepart (2015) 6 For details on household participation in specific livelihood pursuits in Dak Dam and Srae Preah communes in 2003 and 2012 see Appendices 3 to 10 7 As explained earlier under data collection methods, cash values of household income include the economic valuation of non-cash crops and products as well as actual cash earnings 8 In constant 2003 prices the 2012 average household income in Dak Dam commune equaled 3,527,511 riels (USD 882) or 1.9 times that of 2003. The conversion rate of 2012 income to constant 2003 prices is made at 149.624/83.606 equals 178.96/100 based on the IMF website: World-economic-outlook.findthedata.org/1/934/Cambodia
23
agricultural labor in cutting and clearing upland farms and planting and harvesting rice and cash crops.
Table 2: Average cash values of household income in past year,* Dak Dam commune, 2003 and in 2012 (in riels)**
2003 2012 Strategy Percent of
households earning from source
Average total income in riels
Percent of average total income
Percent of households earning from source
Average total income in riels
Average total income at constant 2003 prices in riels***
Percent of total average income
Upland crops (total) 98 464,877 24.8 94 2,425,270 1,355,202 38.4
Upland rice 97 (193,292) (10.3) 76 (371,265) (207,457) (5.9) Upland crops (other than rice) 98 (271,585) (14.5) 94 (2,054,005) (1,147,745) (32.5)
Cassava 83 **** **** 80 (1,444,172) (806,980) (22.9) Cashew nut 15 **** **** 11 (3,176) (1,775) (0.05) Wet land (paddy) rice 5 4,615 0.2 2 53,235 29,747 0.8
Pigs raised 91 242,308 12.9 58 377,459 210,918 6.0 Chickens raised 97 65,077 3.5 64 99,247 55,458 1.6 Ducks raised 34 7,692 0.4 19 12,647 7,067 0.2 Food gathered from the forest 92 46,769 2.5 93 190,691 106,555 3.0
Other products gathered from the forest
88 252,376 13.5 98 856,175 478,417 13.6
Liquid resin 15 (34,415) (1.8) 1 ( 635) (355) (0.0) Animals hunted or trapped 69 527,405 28.2 62 576,486 322,131 9.1
Fish caught 92 32,412 1.7 79 69,494 38,832 1.1 Goods made and sold 43 40,708 2.2 31 98,082 54,807 1.6
Goods bought and sold 14 26,069 1.4 13 141,176 78,887 2.2
Wage work 55 161,323 8.6 88 1,265,529 707,157 20.0 Remittances***** **** **** **** 5 147,341 82,332 2.3 Total 1,871,631 99.9 6,312,832 3,527,510 99.9 N=65 N=85 *Figures are averaged across the total commune sample, and not only across the households earning from the particular source. **4,000 riels equal one US dollar *** Conversion rate of 2012 income to constant 2003 prices is made at 149.624/83.606 equals 178.96/100 ****Data not available ***** From children and relatives not considered as household members

24
While the proportional numbers of sample households cultivating upland farms in Dak Dam commune dropped slightly from 2003 to 2012, the absolute numbers did not. In 2003, 64 sample households cultivated upland parcels that averaged 1.3 hectares. By comparison, in 2012, 80 sample households cultivated upland parcels that likewise averaged 1.3 hectares. These figures point to an expansion of upland areas under cultivation, likely resulting from the extended cultivation of cassava. Notably, the expansion of farmlands did not translate into an even distribution of farm sizes. Among the 80 upland cultivators surveyed in 2012, 23 percent cultivated an average 0.5 hectare, 56 percent cultivated an average 1 hectare, and 21 percent cultivated an average 2.9 hectares.
The proportionate increase in the cash value of upland crops is particularly notable because it was accompanied by a proportionate decline in the cash value of upland rice.9 From 2003 to 2012, the cash value of upland rice production decreased from 10.3 percent to 5.9 percent of total household income. This resulted from the low productivity of upland rice cultivation and the proportionate decline in household upland rice cultivators. Moreover, the cash values of upland rice and upland crops (other than rice, cashew nuts and cassava) were much lower than that of cassava. In 2012, in Dak Dam commune the average cash value of upland rice for the 65 upland rice cultivators surveyed was 485,500 riels, the average cash value of upland crops (other than rice, cashew nuts and cassava) for the 77 upland cultivators of these crops surveyed was 669,681 riels, and the average cash value of cassava production for the 68 cassava cultivators surveyed was 1,805,221 riels.
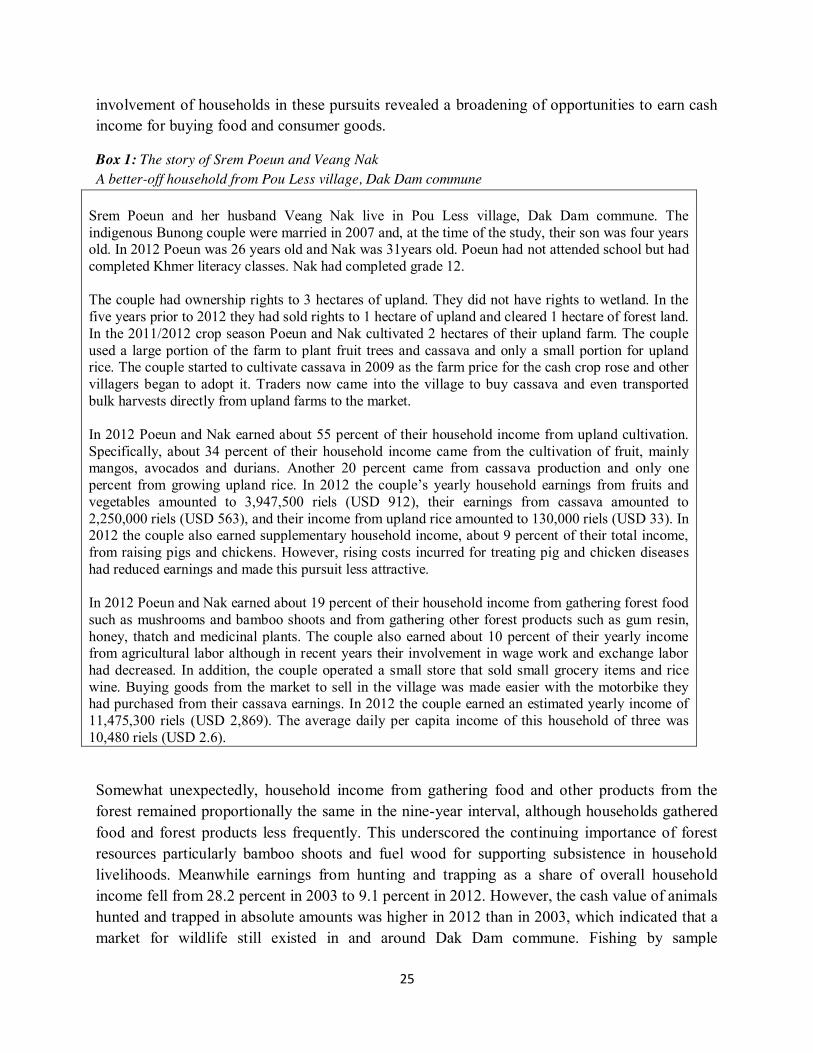
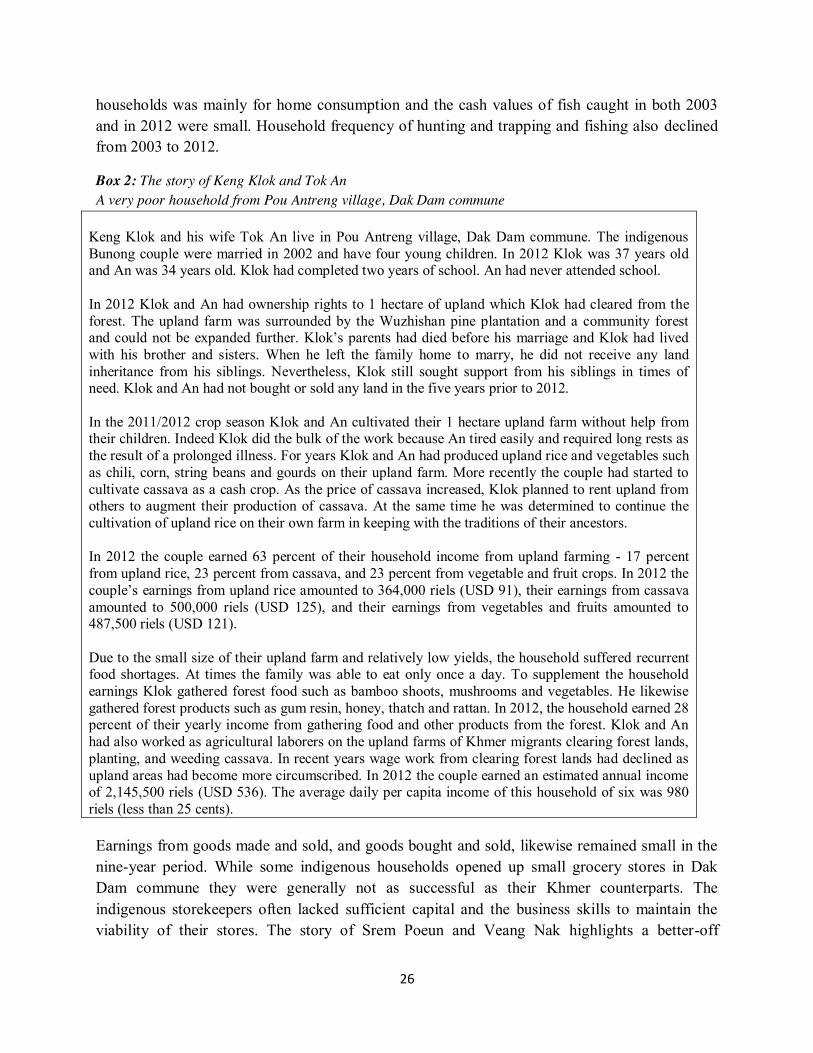
Clearly, high cash returns provided Dak Dam households with an incentive to adopt and expand the cultivation of cassava on their upland farms; an incentive that was reinforced by middlemen who actively promoted cassava cultivation in the commune. At the same time the pursuit of this pathway left households vulnerable to the exigencies of the cassava market. The story of Srem Poeun and Veang Nak illustrates a better-off household in Dak Dam commune and indicates the better returns gleaned from the cultivation of fruits and cassava on their 2 hectare upland farm than from rice (Box 1). By contrast, the story of Keng Klok and Tok An shows a very poor household in Dak Dam commune who devote a major portion of their 1 hectare upland farm to rice cultivation and suffer recurrent food shortages (Box 2).
Household earnings from wetland or paddy rice production were negligible in 2003 and remained so in 2012. Dak Dam commune is located in an area of rolling hills that makes it difficult to convert lands into paddy rice fields and to control the downward flow of water into catchment areas. Earning shares from pig-, chicken- and duck-raising each declined by half or more than half in the same years. Pig- and chicken-raising provided households with food to eat on special occasions as well as products easily sold or bartered for other goods. Diminished
9The method for determining cash values of subsistence crops and products is explained under data collection methods
25
involvement of households in these pursuits revealed a broadening of opportunities to earn cash income for buying food and consumer goods.
Box 1: The story of Srem Poeun and Veang Nak A better-off household from Pou Less village, Dak Dam commune
Srem Poeun and her husband Veang Nak live in Pou Less village, Dak Dam commune. The indigenous Bunong couple were married in 2007 and, at the time of the study, their son was four years old. In 2012 Poeun was 26 years old and Nak was 31years old. Poeun had not attended school but had completed Khmer literacy classes. Nak had completed grade 12. The couple had ownership rights to 3 hectares of upland. They did not have rights to wetland. In the five years prior to 2012 they had sold rights to 1 hectare of upland and cleared 1 hectare of forest land. In the 2011/2012 crop season Poeun and Nak cultivated 2 hectares of their upland farm. The couple used a large portion of the farm to plant fruit trees and cassava and only a small portion for upland rice. The couple started to cultivate cassava in 2009 as the farm price for the cash crop rose and other villagers began to adopt it. Traders now came into the village to buy cassava and even transported bulk harvests directly from upland farms to the market. In 2012 Poeun and Nak earned about 55 percent of their household income from upland cultivation. Specifically, about 34 percent of their household income came from the cultivation of fruit, mainly mangos, avocados and durians. Another 20 percent came from cassava production and only one percent from growing upland rice. In 2012 the couple’s yearly household earnings from fruits and vegetables amounted to 3,947,500 riels (USD 912), their earnings from cassava amounted to 2,250,000 riels (USD 563), and their income from upland rice amounted to 130,000 riels (USD 33). In 2012 the couple also earned supplementary household income, about 9 percent of their total income, from raising pigs and chickens. However, rising costs incurred for treating pig and chicken diseases had reduced earnings and made this pursuit less attractive. In 2012 Poeun and Nak earned about 19 percent of their household income from gathering forest food such as mushrooms and bamboo shoots and from gathering other forest products such as gum resin, honey, thatch and medicinal plants. The couple also earned about 10 percent of their yearly income from agricultural labor although in recent years their involvement in wage work and exchange labor had decreased. In addition, the couple operated a small store that sold small grocery items and rice wine. Buying goods from the market to sell in the village was made easier with the motorbike they had purchased from their cassava earnings. In 2012 the couple earned an estimated yearly income of 11,475,300 riels (USD 2,869). The average daily per capita income of this household of three was 10,480 riels (USD 2.6).
Somewhat unexpectedly, household income from gathering food and other products from the forest remained proportionally the same in the nine-year interval, although households gathered food and forest products less frequently. This underscored the continuing importance of forest resources particularly bamboo shoots and fuel wood for supporting subsistence in household livelihoods. Meanwhile earnings from hunting and trapping as a share of overall household income fell from 28.2 percent in 2003 to 9.1 percent in 2012. However, the cash value of animals hunted and trapped in absolute amounts was higher in 2012 than in 2003, which indicated that a market for wildlife still existed in and around Dak Dam commune. Fishing by sample
26
households was mainly for home consumption and the cash values of fish caught in both 2003 and in 2012 were small. Household frequency of hunting and trapping and fishing also declined from 2003 to 2012.
Box 2: The story of Keng Klok and Tok An A very poor household from Pou Antreng village, Dak Dam commune
Keng Klok and his wife Tok An live in Pou Antreng village, Dak Dam commune. The indigenous Bunong couple were married in 2002 and have four young children. In 2012 Klok was 37 years old and An was 34 years old. Klok had completed two years of school. An had never attended school. In 2012 Klok and An had ownership rights to 1 hectare of upland which Klok had cleared from the forest. The upland farm was surrounded by the Wuzhishan pine plantation and a community forest and could not be expanded further. Klok’s parents had died before his marriage and Klok had lived with his brother and sisters. When he left the family home to marry, he did not receive any land inheritance from his siblings. Nevertheless, Klok still sought support from his siblings in times of need. Klok and An had not bought or sold any land in the five years prior to 2012. In the 2011/2012 crop season Klok and An cultivated their 1 hectare upland farm without help from their children. Indeed Klok did the bulk of the work because An tired easily and required long rests as the result of a prolonged illness. For years Klok and An had produced upland rice and vegetables such as chili, corn, string beans and gourds on their upland farm. More recently the couple had started to cultivate cassava as a cash crop. As the price of cassava increased, Klok planned to rent upland from others to augment their production of cassava. At the same time he was determined to continue the cultivation of upland rice on their own farm in keeping with the traditions of their ancestors. In 2012 the couple earned 63 percent of their household income from upland farming - 17 percent from upland rice, 23 percent from cassava, and 23 percent from vegetable and fruit crops. In 2012 the couple’s earnings from upland rice amounted to 364,000 riels (USD 91), their earnings from cassava amounted to 500,000 riels (USD 125), and their earnings from vegetables and fruits amounted to 487,500 riels (USD 121). Due to the small size of their upland farm and relatively low yields, the household suffered recurrent food shortages. At times the family was able to eat only once a day. To supplement the household earnings Klok gathered forest food such as bamboo shoots, mushrooms and vegetables. He likewise gathered forest products such as gum resin, honey, thatch and rattan. In 2012, the household earned 28 percent of their yearly income from gathering food and other products from the forest. Klok and An had also worked as agricultural laborers on the upland farms of Khmer migrants clearing forest lands, planting, and weeding cassava. In recent years wage work from clearing forest lands had declined as upland areas had become more circumscribed. In 2012 the couple earned an estimated annual income of 2,145,500 riels (USD 536). The average daily per capita income of this household of six was 980 riels (less than 25 cents). Earnings from goods made and sold, and goods bought and sold, likewise remained small in the nine-year period. While some indigenous households opened up small grocery stores in Dak Dam commune they were generally not as successful as their Khmer counterparts. The indigenous storekeepers often lacked sufficient capital and the business skills to maintain the viability of their stores. The story of Srem Poeun and Veang Nak highlights a better-off
27
household in Dak Dam commune who rely on forest food and other products for less than one-fifth of their income. The household members also supplement their income through working as operators of a small grocery store and as agricultural laborers (Box 1). By comparison, the story of Keng Klok and Tok An demonstrates a very poor household in Dak Dam commune who rely on forest food and other products for more than one-fourth of their income. The household members further supplement their income by working as occasional agricultural laborers (Box 2).
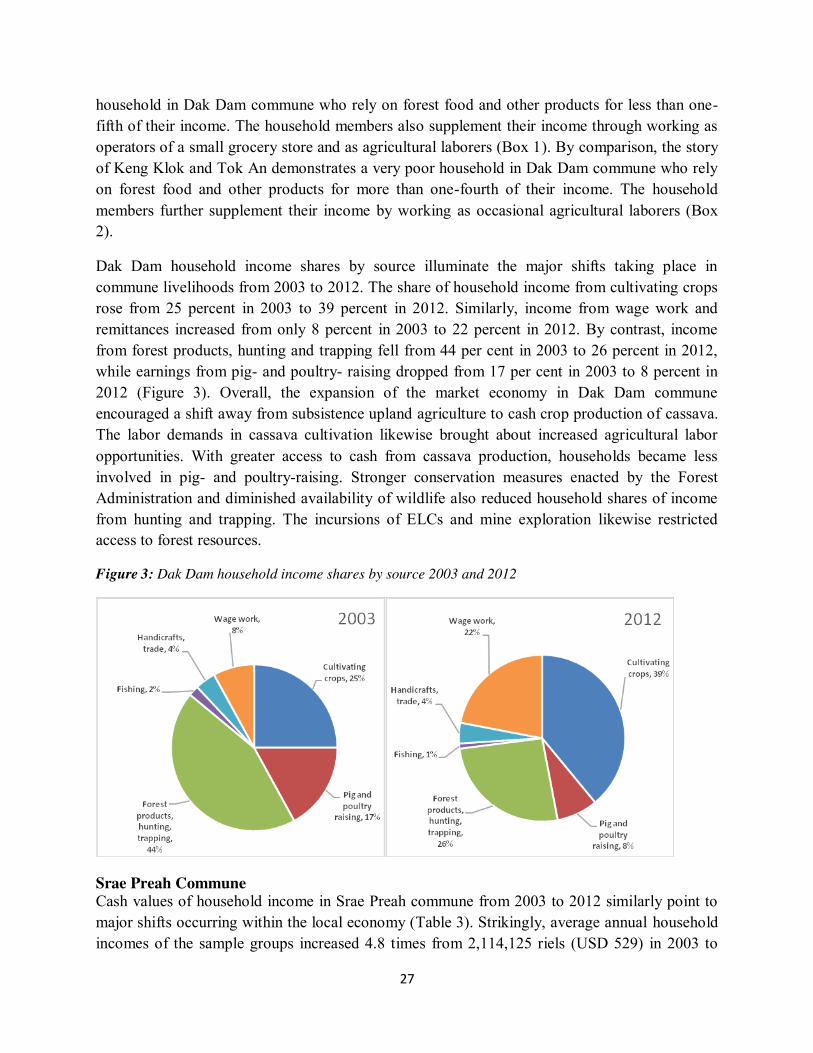
Dak Dam household income shares by source illuminate the major shifts taking place in commune livelihoods from 2003 to 2012. The share of household income from cultivating crops rose from 25 percent in 2003 to 39 percent in 2012. Similarly, income from wage work and remittances increased from only 8 percent in 2003 to 22 percent in 2012. By contrast, income from forest products, hunting and trapping fell from 44 per cent in 2003 to 26 percent in 2012, while earnings from pig- and poultry- raising dropped from 17 per cent in 2003 to 8 percent in 2012 (Figure 3). Overall, the expansion of the market economy in Dak Dam commune encouraged a shift away from subsistence upland agriculture to cash crop production of cassava. The labor demands in cassava cultivation likewise brought about increased agricultural labor opportunities. With greater access to cash from cassava production, households became less involved in pig- and poultry-raising. Stronger conservation measures enacted by the Forest Administration and diminished availability of wildlife also reduced household shares of income from hunting and trapping. The incursions of ELCs and mine exploration likewise restricted access to forest resources.
Figure 3: Dak Dam household income shares by source 2003 and 2012
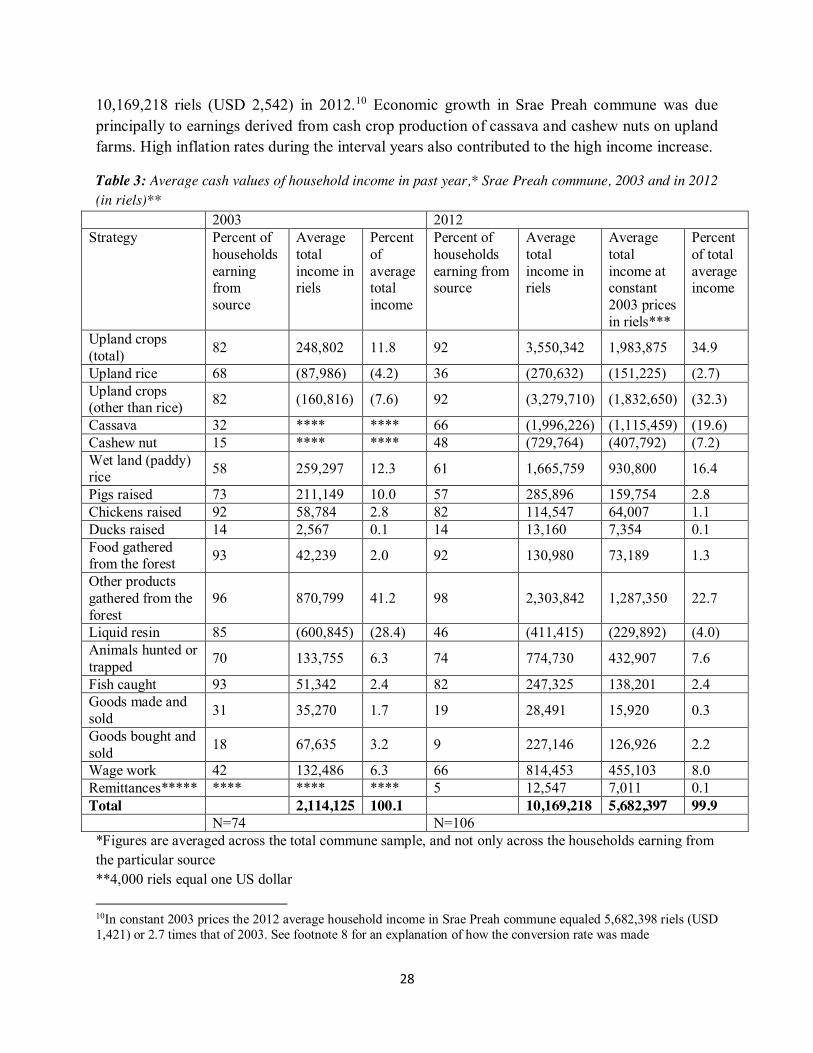
Srae Preah Commune Cash values of household income in Srae Preah commune from 2003 to 2012 similarly point to major shifts occurring within the local economy (Table 3). Strikingly, average annual household incomes of the sample groups increased 4.8 times from 2,114,125 riels (USD 529) in 2003 to
28
10,169,218 riels (USD 2,542) in 2012.10 Economic growth in Srae Preah commune was due principally to earnings derived from cash crop production of cassava and cashew nuts on upland farms. High inflation rates during the interval years also contributed to the high income increase.
Table 3: Average cash values of household income in past year,* Srae Preah commune, 2003 and in 2012 (in riels)**
2003 2012 Strategy Percent of
households earning from source
Average total income in riels
Percent of average total income
Percent of households earning from source
Average total income in riels
Average total income at constant 2003 prices in riels***
Percent of total average income
Upland crops (total) 82 248,802 11.8 92 3,550,342 1,983,875 34.9
Upland rice 68 (87,986) (4.2) 36 (270,632) (151,225) (2.7) Upland crops (other than rice) 82 (160,816) (7.6) 92 (3,279,710) (1,832,650) (32.3)
Cassava 32 **** **** 66 (1,996,226) (1,115,459) (19.6) Cashew nut 15 **** **** 48 (729,764) (407,792) (7.2) Wet land (paddy) rice 58 259,297 12.3 61 1,665,759 930,800 16.4
Pigs raised 73 211,149 10.0 57 285,896 159,754 2.8 Chickens raised 92 58,784 2.8 82 114,547 64,007 1.1 Ducks raised 14 2,567 0.1 14 13,160 7,354 0.1 Food gathered from the forest 93 42,239 2.0 92 130,980 73,189 1.3
Other products gathered from the forest
96 870,799 41.2 98 2,303,842 1,287,350 22.7
Liquid resin 85 (600,845) (28.4) 46 (411,415) (229,892) (4.0) Animals hunted or trapped 70 133,755 6.3 74 774,730 432,907 7.6
Fish caught 93 51,342 2.4 82 247,325 138,201 2.4 Goods made and sold 31 35,270 1.7 19 28,491 15,920 0.3
Goods bought and sold 18 67,635 3.2 9 227,146 126,926 2.2
Wage work 42 132,486 6.3 66 814,453 455,103 8.0 Remittances***** **** **** **** 5 12,547 7,011 0.1 Total 2,114,125 100.1 10,169,218 5,682,397 99.9 N=74 N=106 *Figures are averaged across the total commune sample, and not only across the households earning from the particular source **4,000 riels equal one US dollar 10In constant 2003 prices the 2012 average household income in Srae Preah commune equaled 5,682,398 riels (USD 1,421) or 2.7 times that of 2003. See footnote 8 for an explanation of how the conversion rate was made
29
*** Conversion rate of 2012 income to constant 2003 prices is made at 149.624/83.606 equals 178.96/100 **** Data not available ***** From children and relatives not considered as household members
From 2003 to 2012 the number of Srae Preah sample households cultivating upland farms in the last crop season increased as did the average size of their upland plots. In 2003, the average plot size of the 61 upland household cultivators surveyed was 0.7 hectares. In 2012 the average plot size of the 97 upland household cultivators surveyed was 1.8 hectares. These figures point to an expansion of upland areas under cultivation, which is the likely consequence of expanded household production of cassava and cashew nuts. At the same time, in 2012, the upland farm sizes of the household cultivators varied considerably. Among the 97 upland cultivators surveyed 12 percent cultivated an average 0.5 hectare, 40 percent cultivated an average 1.0 hectare, and 47 percent cultivated an average 2.8 hectares.
Earnings from upland crops as a part of overall household income increased from 11.8 percent in 2003 to 34.9 percent in 2012. Earnings from cassava and cashew nut production alone accounted for 26.8 percent of total household income in 2012. However, from 2003 to 2012, the cash value of upland rice as a proportion of total average income decreased. Meanwhile paddy rice yields increased from 1.2 tonnes per hectare in 2003 to 1.86 tonnes per hectare in 2012 due to the adoption of high-yielding rice varieties. As a consequence of this increased productivity and the expansion of wetland rice farms, from 2003 to 2012 the cash value of paddy rice as a proportion of total average earnings increased. This made paddy rice cultivators less vulnerable to the volatility of the cash crop markets.
The story of Kreun Khan and Svay Sok depicts the prosperity of a better-off household in Srae Preah commune, which combines agricultural earnings from cassava and cashew nut production on 3 hectares of upland with agricultural earnings from wetland rice production on 3 hectares of paddy rice land (Box 3). By comparison, the story of Ngok Senh and Chet Heurt portrays the struggles of a very poor household in Srae Preah commune who derive agricultural earnings solely from the cultivation of a 1 hectare parcel of paddy rice land (Box 4).
Earning shares from pig-raising declined from 2003 to 2012, as did earning shares from chicken-raising albeit less sharply. Overall, household pig- and poultry-raising remained an integral feature of Srae Preah household earning activities although their decline signaled a transition from subsistence activities to more market-oriented pursuits.
In 2003 food and other products gathered from the forest accounted for 43.2 percent of total household income. This underscored the reliance of Srae Preah households on forest resources for their livelihoods. By contrast, in 2012 food and other products gathered from the forest accounted for only 24 percent of total household income. The diminished reliance on forest resources was largely the result of a rapid decline in liquid resin tapping as a major source of

30
household earnings. Resin trees in several Srae Preah villages were over-tapped and unproductive in 2012. In Srae Ampil village alone an estimated 2,000 resin trees were cut down in 2011 by the Sovann Reachsei rubber company under an ELC. Remarkably, total household income from the collection of liquid resin plummeted from 28.4 percent in 2003 to only 4.0 percent in 2012. As a consequence, Srae Preah households no longer had a strong incentive to protect the forest and resin trees, and the trade in illegal timber came to flourish throughout the commune. Indeed many Srae Preah households, including resin tappers, were actively involved in the illegal timber trade.11
Box 3: The story of Kreun Khan and Svay Sok A better-off household from Pou Cha village, Srae Preah commune
Kreun Khan and his wife Svay Sok live in Pou Cha village, Srae Preah commune. In 2012 Khan was 65 years old and Sok was 62 years old. The indigenous Bunong couple had seven married children. Their youngest daughter, her husband and their three children lived as a separate household in the house of her parents. In 2012 Khan and Sok had ownership rights to 3 hectares of upland and 3 hectares of paddy rice land. In the five years prior to 2012 they had not bought, sold or cleared any upland or wetland. They had, however, transferred upland parcels to their children. Khan maintained that there was no more land available in the area for the expansion of upland or wetland farms. For years Khan used his upland farm to cultivate rice and vegetables such as pumpkins, cucumbers and gourds. He also plowed his paddy rice fields with buffaloes and used traditional rice varieties. Khan maintained that their family always had sufficient food to eat and enough to share with other people in need. In recent years Khan and Sok stopped growing upland rice and started to cultivate cash crops such as cashew nuts and cassava. They retained some upland plots, though, to grow vegetables. In 2007 the couple bought a hand tractor for the plowing of their paddy rice fields. Similarly, they adopted high yielding rice varieties that could be harvested in six months. The elderly couple now did less work on their upland and wetland farms although they still transplanted and harvested rice. To meet their labor needs the couple hired their children, and sometimes others, as wage workers to help with the plowing, transplanting and weeding. In 2012 Khan and Sok earned about 77 percent of their household income from upland and wetland cultivation. Specifically, 31 percent of their household income came from cassava production, 19 percent came from cashew nut production, 6 percent came from vegetable production, and 21 percent came from paddy rice production. In 2012 the couple’s estimated earnings from cassava production amounted to 4,000,000 riels (USD 1,000), their earnings from cashew nut production amounted to 2,500,000 riel (USD 625), their vegetable production amounted to 727,000 riel (USD 182), and their paddy rice production amounted to 2,700,000 riels (USD 675). In 2012 the couple raised pigs and chickens to supplement their earnings. They also gathered forest food such as mushrooms and leafy green vegetables and other forest products such as bamboo for
11 While an attempt was made to determine earnings from timber sales in the household survey, anecdotal evidence from key informant interviews indicates that these earnings were generally not acknowledged by households involved in the illegal timber trade
31
making baskets for home use. Khan hunted and trapped wildlife such as squirrels, civet cats, rabbits and wild pigs near his upland farm and sold some of the meat to others. Khan also caught fish for home consumption. In 2012 the couple’s estimated yearly household income amounted to 12,993,000 riels (USD 3,248). The average daily per capita income of this household of two was 17,799 riels (USD 4.4). Of note, from 2003 to 2012, the proportionate cash value for animals hunted or trapped increased slightly. A perception among some households was that the cutting and clearing of forest areas by companies in neighboring areas had decreased the habitat of wildlife making them more accessible to Srae Preah hunters and trappers. However diminished habitats would ultimately have consequences for wildlife populations. At the same time the proportionate cash value for fish caught in these years remained constant. For the Srae Preah households fishing was mainly a subsistence activity that supplemented household diets with an important source of protein. Within the broader shift from subsistence to market-oriented activities fishing endured at least for the moment as a crucial aspect of household livelihood strategies.
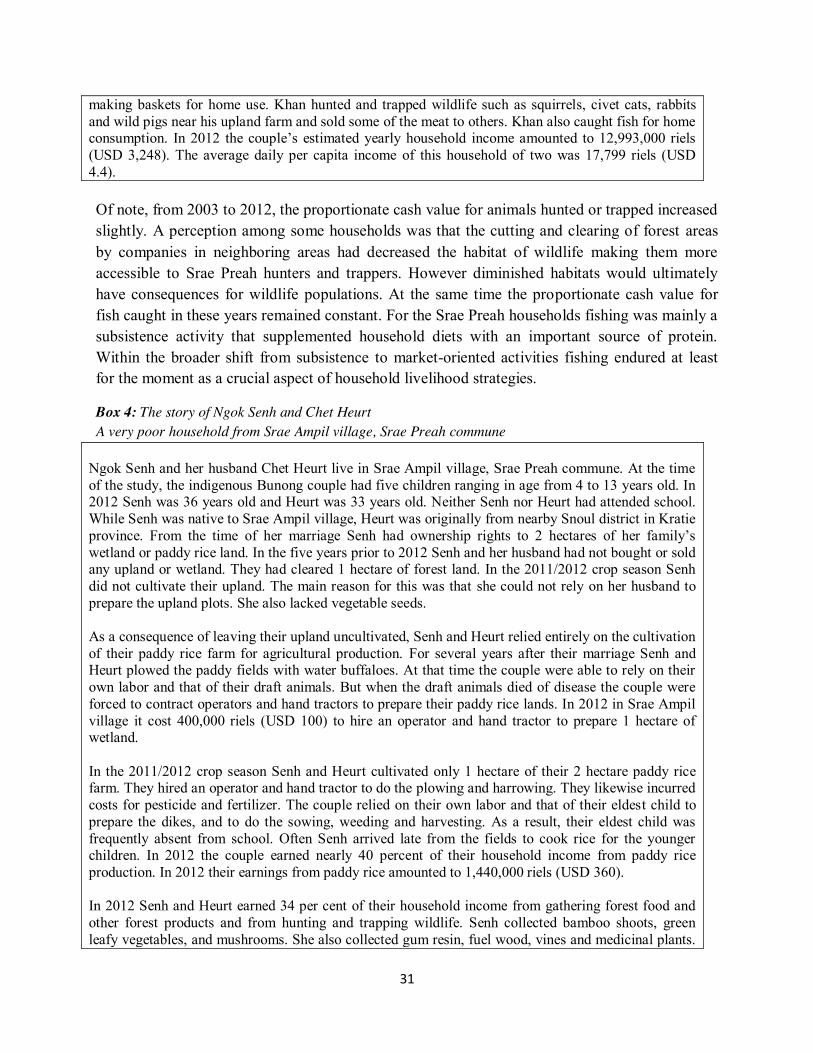
Box 4: The story of Ngok Senh and Chet Heurt A very poor household from Srae Ampil village, Srae Preah commune
Ngok Senh and her husband Chet Heurt live in Srae Ampil village, Srae Preah commune. At the time of the study, the indigenous Bunong couple had five children ranging in age from 4 to 13 years old. In 2012 Senh was 36 years old and Heurt was 33 years old. Neither Senh nor Heurt had attended school. While Senh was native to Srae Ampil village, Heurt was originally from nearby Snoul district in Kratie province. From the time of her marriage Senh had ownership rights to 2 hectares of her family’s wetland or paddy rice land. In the five years prior to 2012 Senh and her husband had not bought or sold any upland or wetland. They had cleared 1 hectare of forest land. In the 2011/2012 crop season Senh did not cultivate their upland. The main reason for this was that she could not rely on her husband to prepare the upland plots. She also lacked vegetable seeds. As a consequence of leaving their upland uncultivated, Senh and Heurt relied entirely on the cultivation of their paddy rice farm for agricultural production. For several years after their marriage Senh and Heurt plowed the paddy fields with water buffaloes. At that time the couple were able to rely on their own labor and that of their draft animals. But when the draft animals died of disease the couple were forced to contract operators and hand tractors to prepare their paddy rice lands. In 2012 in Srae Ampil village it cost 400,000 riels (USD 100) to hire an operator and hand tractor to prepare 1 hectare of wetland. In the 2011/2012 crop season Senh and Heurt cultivated only 1 hectare of their 2 hectare paddy rice farm. They hired an operator and hand tractor to do the plowing and harrowing. They likewise incurred costs for pesticide and fertilizer. The couple relied on their own labor and that of their eldest child to prepare the dikes, and to do the sowing, weeding and harvesting. As a result, their eldest child was frequently absent from school. Often Senh arrived late from the fields to cook rice for the younger children. In 2012 the couple earned nearly 40 percent of their household income from paddy rice production. In 2012 their earnings from paddy rice amounted to 1,440,000 riels (USD 360). In 2012 Senh and Heurt earned 34 per cent of their household income from gathering forest food and other forest products and from hunting and trapping wildlife. Senh collected bamboo shoots, green leafy vegetables, and mushrooms. She also collected gum resin, fuel wood, vines and medicinal plants.

32
Heurt hunted and trapped squirrels, frogs, monitor lizards, rabbits, snakes and mouse deer. Senh and Heurt use to collect liquid resin from their resin trees in the surrounding forest. However, in 2010 these trees and those of other villagers were cut down by a rubber company. Despite the complaints of the resin tappers, the company paid no compensation for the loss of the trees. Senh and Heurt also earned daily wages as agricultural laborers helping others in the village to plant and weed cassava. In 2012 the couple earned 16 percent of their household income from wage work. In 2012 the couple’s estimated annual household income amounted to 3,736,000 riels (USD 934). The average per capita daily income of this household of seven was 1,462 riels (less than 40 cents).
Earnings from goods made and sold, and goods bought and sold, were rather negligible in 2003 and even more so in 2012 despite the further expansion of the market economy. The inability of indigenous households to take advantage of opportunities opening up in the buying and selling of goods involved such factors as lack of access to capital, a dearth of business skills, and indigenous traditions of sharing and exchange which discouraged profit-making. In general Khmer and Vietnamese traders dominated small-scale entrepreneurial activities in Srae Preah commune in 2012. This points to the exclusionary effects of market integration that made it difficult for indigenous households to succeed as entrepreneurs and traders.
Earnings from wage work as a share of total income increased only slightly - from 6.3 percent in 2003 to 8.0 percent in 2012. In 2012, two-thirds of households earned from wage work mainly in the form of agricultural labor. In the nine-year period, households had not come to rely on wage work as a major source of their income. Rather, the generation of wealth from cassava and cashew nut production, amidst the decline of resin tapping, stood out prominently as the major feature of Srae Preah household earning sources from 2003 to 2012.
The story of Kreun Khan and Svay Sok illustrates the situation of a better-off household in Srae Preah commune who earn more than three-fourths of their income from agricultural production and need only to supplement their livelihood with other earning activities (Box 3). By contrast, the story of Ngok Senh and Chet Heurt represents a very poor household in Srae Preah commune who earn only two-fifths of their income from agricultural production and need to gather forest food and other products, hunt and fish, and work as agricultural laborers to ensure their subsistence (Box 4).
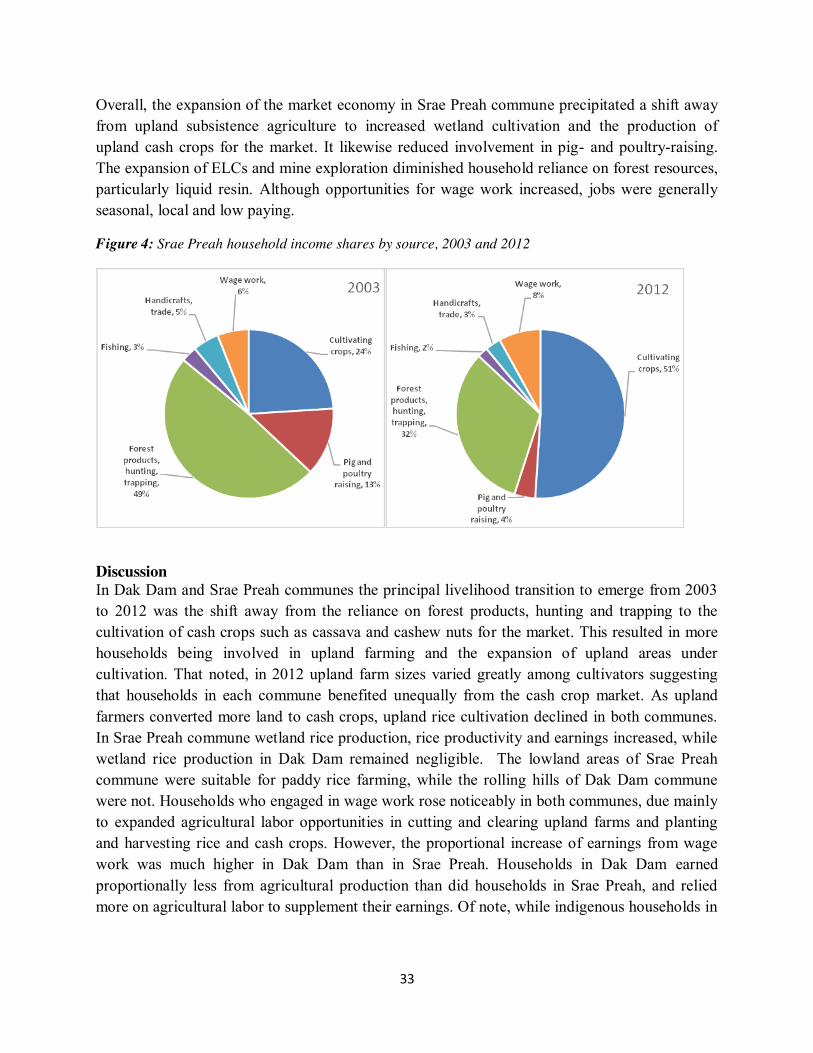
Srae Preah household income shares by source highlight the major shifts taking place in commune livelihoods from 2003 to 2012. In 2003 households made nearly one-half of their income from forest products and hunting and trapping. By 2012 earnings from this source constituted less than one-third of their income. Conversely, in 2003 households earned less than one-fourth of their income from cultivating crops. By 2012 earnings from this source made up more than one-half of their income. Less prominently, shares from pig- and poultry-raising dropped from 2003 to 2012, while shares from wage work rose slightly (Figure 4).
33
Overall, the expansion of the market economy in Srae Preah commune precipitated a shift away from upland subsistence agriculture to increased wetland cultivation and the production of upland cash crops for the market. It likewise reduced involvement in pig- and poultry-raising. The expansion of ELCs and mine exploration diminished household reliance on forest resources, particularly liquid resin. Although opportunities for wage work increased, jobs were generally seasonal, local and low paying.
Figure 4: Srae Preah household income shares by source, 2003 and 2012
Discussion In Dak Dam and Srae Preah communes the principal livelihood transition to emerge from 2003 to 2012 was the shift away from the reliance on forest products, hunting and trapping to the cultivation of cash crops such as cassava and cashew nuts for the market. This resulted in more households being involved in upland farming and the expansion of upland areas under cultivation. That noted, in 2012 upland farm sizes varied greatly among cultivators suggesting that households in each commune benefited unequally from the cash crop market. As upland farmers converted more land to cash crops, upland rice cultivation declined in both communes. In Srae Preah commune wetland rice production, rice productivity and earnings increased, while wetland rice production in Dak Dam remained negligible. The lowland areas of Srae Preah commune were suitable for paddy rice farming, while the rolling hills of Dak Dam commune were not. Households who engaged in wage work rose noticeably in both communes, due mainly to expanded agricultural labor opportunities in cutting and clearing upland farms and planting and harvesting rice and cash crops. However, the proportional increase of earnings from wage work was much higher in Dak Dam than in Srae Preah. Households in Dak Dam earned proportionally less from agricultural production than did households in Srae Preah, and relied more on agricultural labor to supplement their earnings. Of note, while indigenous households in
34
Dak Dam worked on the upland farms of Khmer migrants, in Srae Preah Khmer migrants worked on the upland farms of indigenous households.
Differential Earnings in Diverse Income Groups The literature on land use change reviewed above reveals how the expansion of the market economy accelerates land commodification, land concentration and social differentiation among village households (Li 2012, Diepart and Dupuis 2014, Milne 2013). We examine here differential earnings in 2012 in four income groups (very poor, poor, above-poor and better-off) and explore how the pursuit of cash crop production leads to land concentration and social differentiation among households in the two communes.12 We present findings from each commune separately and then discuss the comparative experiences of market integration in the two communes.
Dak Dam Commune Overall income disparities in Dak Dam commune between the very poor and better-off households are pronounced, and even those between the very poor and poor households are noticeable (Table 4). Comparatively, income inequalities between the poor and above-poor households are less prominent.13 Of note, the average annual income of the nine Khmer households (i.e. households where both the husband and wife were Khmer) in the sample was 12,661,444 riels (about USD 3,165). This was more than double the average annual income of the 76 indigenous and mixed indigenous households in the sample at 5,561,065 riels (about USD 1,390). This difference was due mainly to the Khmer households’ higher average earnings from cassava production.
All four household groups rely heavily on earnings from upland cultivation although their incomes from staple crops versus cash crops vary. Proportionally, the very poor households earn more from upland rice cultivation and less from cassava production than the other three groups. This suggests that the very poor are less integrated into the market economy than the other groups. Conversely, the better-off households earn more proportionally from cassava production and less from upland rice than the other three groups. Moreover, the absolute earnings of the better-off households from upland cultivation are striking in comparison with the other groups. This relates to upland farm size as well as to crops produced. On average, in the 2011/2012 crop season, the better-off households cultivated 3.4 hectares of upland, the above-poor households cultivated 1.0 hectare of upland, the poor households cultivated 1.1 hectare of upland, and the very poor households cultivated 0.9 hectare of upland. Land concentration among the better-off households correlates to their higher earnings from cassava production and their fuller integration within the cash economy.
12 See the asterisked footnote (**) in Table 4 for an explanation of how the household categories were defined 13 Income inequality likewise existed among Dak Dam sample households in 2003: 17 households had annual incomes of less than 1 million riels, 23 households had annual incomes of from 1 million riels to 1.99 million riels, 14 had annual incomes of from 2 million riels to 2.99 million riels, and 11 had annual incomes of 3 million riels or more (McAndrew et al. 2003)

35
Somewhat surprisingly, the better-off households also earn more proportionally from pig-raising and chicken-raising than the other groups. Comparatively, the very poor households earn proportionally more than the other groups from gathering food and other products from the forest, while the better-off households earn less than the other groups from these pursuits. This underscores the importance of the forest as a safety net for the very poor and their acute vulnerability to forest dispossession. Of note, in Dak Dam commune the very poor household of Keng Klok and Tok An (Box 2) relies proportionally more on gathering forest food and other products than does the better-off household of Srem Poeun and Veang Nak (Box 1).
Table 4: Percent of average cash values*of household income in past year by type of household*, Dak Dam commune, 2012 **
Very poor households
Poor households
Above-poor households
Better-off households
Strategy Percent Percent Percent Percent Upland crops (total) 38.5 35.8 31.0 49.1 Upland rice (12.5) (7.3) (4.3) (3.3) Upland crops (other than rice) (26.0) (28.4) (26.7) (45.8) Cassava (13.9) (18.3) (16.2) (38.5) Cashew nut (0) (0.1) (0.0) (0) Wet land (paddy) rice 0 0 2.9 0 Pigs raised 3.2 5.9 5.5 7.7 Chickens raised 1.6 1.4 1.6 1.7 Ducks raised 0.1 0.2 0.4 0.1 Food gathered from the forest 5.2 4.3 2.5 1.2 Other products gathered from the forest
21.4 17.1 13.0 7.0
Liquid resin (0) (0) (0.0) (0) Animals hunted or trapped 11.3 6.9 12.5 7.3 Fish caught 1.8 1.4 1.2 0.4 Goods made and sold 2.6 0.5 1.5 2.4 Goods bought and sold 1.2 0.4 2.6 4.4 Wage work 13.0 25.8 25.4 10.8 Remittances from children and relatives not considered as household members
0 0.3 0 8.0
Total percent 99.9 100.0 100.1 100.1 Total average cash value in riels 2,826,893 5,059,925 6,719,159 21,521,150 N=21 N=34 N=23 N=7 *Cash values in riels. 4,000 riels equal one US dollar. **The World Bank estimates the 2011 poverty line for rural households in Cambodia at 4,422 riels per capita per day (World Bank 2013). Poor households in this table are those with per capita daily incomes below the poverty line of 4,422 riels per day, down to and including those with per capita daily incomes of 2,000 riels. Very poor households are those with per capita daily incomes of below 2,000 riels. Above-poor households are those with per capita daily incomes in the range from 4,422 riels to 8,499 riels per day. Better-off households are those with per capita daily incomes of 8,500 riels and above.
36
The poor and above-poor households earn about one-fourth of their total income from wage work, a much higher proportion than that earned by the very poor and better-off households from wage work. This suggests that the very poor are excluded from certain types of wage work while the better-off households with higher earnings from cash crops are less likely to engage in it. Better-off and above-poor households earn proportionally more from goods bought and sold than do poor and very poor households although the contributions to average incomes from this source are small. Only the better-off households earned much from remittances from migrant family members. This implies that the social networks of the other income groups are weak outside of their own local areas.
Household sizes and dependency ratios likewise have consequences for household livelihood security. The poor, and especially the very poor, have, on average, larger household sizes and higher dependency ratios than the other two groups. In the Dak Dam commune sample very poor households have, on average, 6.1 members and a dependency ratio of 54 percent, while poor households have, on average, 4.6 members and a dependency ratio of 35 percent. Comparatively, above-poor households have, on average, 3.2 members and a dependency ratio of 28 percent, while better-off households have, on average, 4.0 members and a dependency ratio of 33 percent. In Dak Dam commune the better-off household of Srem Poeun and Veang Nak (Box 1) has three members and a dependency rate of 33 percent, while the very poor household of Keng Klok and Tok An (Box 2) has six members and a dependency ratio of 67 percent.
Srae Preah Commune In Srae Preah commune income disparities are striking between all four income groups (Table 5). The average incomes of better-off households are 65 percent higher than those of the above-poor households, while the average incomes of the above-poor households are 57 percent higher than those of the poor households, and the average incomes of the poor households are 122 percent higher than those of the very poor households.14 Notably, the average yearly income of the 92 indigenous and mixed indigenous households sampled at 10,185,178 riels (about USD 2,546) was slightly higher than the yearly income of the 14 Khmer households sampled at 10,064,350 riels (about USD 2,516). Generally indigenous and mixed indigenous households in Srae Preah commune managed to resist dispossession by Khmer migrants.
All four household groups rely on earnings from upland and wetland cultivation for about half of their proportional household incomes. However, within upland cultivation, household earnings from staple crops versus cash crops differ. Proportionally, the better-off and above-poor households earn less than the poor and very poor groups from upland rice. This again suggests that the poor and very poor groups are less integrated within the market economy. Meanwhile, better-off and above-poor households have higher absolute, if not proportional, earnings from 14 Income inequality likewise existed among Srae Preah sample households in 2003: nine households had annual incomes of less than 1 million riels, 35 households had annual incomes of from 1 million riels to 1.99 million riels, 18 had annual incomes of from 2 million riels to 2.99 million riels, and 12 had annual incomes of 3 million riels or more (McAndrew et al. 2003)
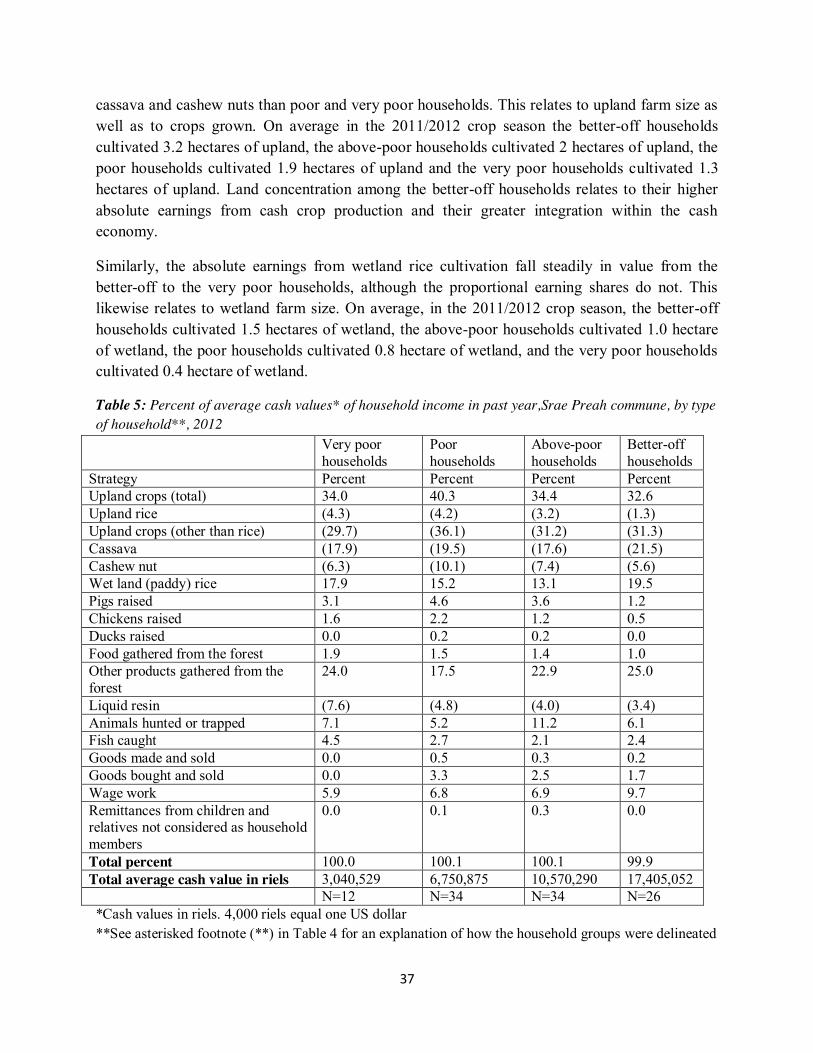
37
cassava and cashew nuts than poor and very poor households. This relates to upland farm size as well as to crops grown. On average in the 2011/2012 crop season the better-off households cultivated 3.2 hectares of upland, the above-poor households cultivated 2 hectares of upland, the poor households cultivated 1.9 hectares of upland and the very poor households cultivated 1.3 hectares of upland. Land concentration among the better-off households relates to their higher absolute earnings from cash crop production and their greater integration within the cash economy.
Similarly, the absolute earnings from wetland rice cultivation fall steadily in value from the better-off to the very poor households, although the proportional earning shares do not. This likewise relates to wetland farm size. On average, in the 2011/2012 crop season, the better-off households cultivated 1.5 hectares of wetland, the above-poor households cultivated 1.0 hectare of wetland, the poor households cultivated 0.8 hectare of wetland, and the very poor households cultivated 0.4 hectare of wetland.
Table 5: Percent of average cash values* of household income in past year,Srae Preah commune, by type of household**, 2012
Very poor households
Poor households
Above-poor households
Better-off households
Strategy Percent Percent Percent Percent Upland crops (total) 34.0 40.3 34.4 32.6 Upland rice (4.3) (4.2) (3.2) (1.3) Upland crops (other than rice) (29.7) (36.1) (31.2) (31.3) Cassava (17.9) (19.5) (17.6) (21.5) Cashew nut (6.3) (10.1) (7.4) (5.6) Wet land (paddy) rice 17.9 15.2 13.1 19.5 Pigs raised 3.1 4.6 3.6 1.2 Chickens raised 1.6 2.2 1.2 0.5 Ducks raised 0.0 0.2 0.2 0.0 Food gathered from the forest 1.9 1.5 1.4 1.0 Other products gathered from the forest
24.0 17.5 22.9 25.0
Liquid resin (7.6) (4.8) (4.0) (3.4) Animals hunted or trapped 7.1 5.2 11.2 6.1 Fish caught 4.5 2.7 2.1 2.4 Goods made and sold 0.0 0.5 0.3 0.2 Goods bought and sold 0.0 3.3 2.5 1.7 Wage work 5.9 6.8 6.9 9.7 Remittances from children and relatives not considered as household members
0.0 0.1 0.3 0.0
Total percent 100.0 100.1 100.1 99.9 Total average cash value in riels 3,040,529 6,750,875 10,570,290 17,405,052 N=12 N=34 N=34 N=26 *Cash values in riels. 4,000 riels equal one US dollar **See asterisked footnote (**) in Table 4 for an explanation of how the household groups were delineated

38
Not surprisingly, the very poor households earn proportionally more than the other groups from gathering food from the forest, and proportionally more than the poor and above-poor households (although not the better-off households) from gathering other product such as liquid resin from the forest. The very poor households likewise earn proportionally more than the other groups from fishing, and proportionally more than the poor and better-off households (although not the above-poor households) from hunting and trapping wildlife. This highlights the importance of forest resources in the livelihoods of the very poor and their vulnerability to forest dispossession. Notably, in Srae Preah commune the very poor household of Ngok Senh and Chet Heurt (Box 4) depends proportionally more on collecting forest food and other products than does the better-off household of Kreun Khan and Svay Sok (Box 3).
By contrast the very poor households earn proportionally less than the other three groups from wage work. Notably, the very poor households earn nothing from goods made and sold, or from goods bought and sold. This points to the exclusionary effects of the market economy with respect to the participation of the very poor in certain types of work and trade activities. Of note, none of the income groups earned importantly from remittances from migrant family workers. This suggests that the social networks of all four income groups are weak outside of their own local areas.
Household sizes and dependency ratios likewise have consequences for household livelihood security. The poor and very poor have, on average, larger household sizes and higher dependency ratios than the other two groups. In the Srae Preah commune sample, very poor households have, on average, 5.6 members and a dependency ratio of 46 percent, while poor households have, on average, 5.8 members and a dependency ratio of 41 percent. Comparatively, above-poor households have, on average, 4.7 members and a dependency ratio of 38 percent, while better-off households have, on average, 3.6 members and a dependency ratio of 31 percent. In Srae Preah commune the better-off household of Kreun Khan and Svay Sok (Box 3) has two members and a dependency ratio of 0, while the very poor household of Ngok Senh and Chet Heurt (Box 4) has seven members and a dependency ratio of 71 percent.
Discussion The expansion of the market economy contributed to land commodification, land concentration and social differentiation in both Dak Dam and Srae Preah communes. On average, the better-off households in both communes cultivated much larger upland parcels and had substantially higher earnings from cash crop production than did the other income groups. By comparison, the very poor households in both communes had the smallest upland farms and the lowest earnings from cash crop production. Similarly the better-off households in Srae Preah commune cultivated larger wetland areas and had higher earnings from paddy rice production than did the other groups. Meanwhile the very poor households in Srae Preah commune had the smallest wetland rice farms and the lowest earnings from paddy rice production. Notably, the very poor households earned proportionally more from gathering forest products and less from wage work

39
than did most other income groups in the communes. This underscored the reliance of the very poor households on forest resources and their limited access to wage work. Not surprisingly, the very poor and the poor households in the two communes had, on average, larger household sizes and higher dependency ratios than did the above-poor and better-off households. In Dak Dam commune, although not in Srae Preah commune, Khmer households earned much more than indigenous and mixed indigenous households. This suggests that indigenous households in Dak Dam were more susceptible to dispossession from land and forest resources than indigenous households in Srae Preah.
Land Transactions in Diverse Income Groups Population increase and economic growth are major determinants of land use change which precipitate land markets and invariably give rise to land commodification and land concentration (Diepart and Dupuis 2014, Milne 2013, Taylor 2011). Notably, land transactions are driven by a synergy of factors that may be mostly endogenous or exogenous (Lambin et al. 2003). In Mondulkiri and other Northeast provinces, the land market is driven mainly by Khmer outsiders although it involves local agents and voluntary sales of indigenous insiders (Fox et al. 2008, McAndrew and Oeur 2009, Milne 2013, Thann et al. 2009). We consider here population growth and land transactions in the two communes from 2003 to 2012 and then proceed to examine land transactions in the five years prior to the surveys in the four income groups. We present findings first from each commune and then discuss comparative experiences.
Dak Dam Commune The household population in Dak Dam commune rose 46 percent from 257 to 376 households from 2003 to 2012, which increased pressure on land resources. In 2003 none of the Dak Dam sample households had sold land in the previous five years and only 5 percent had bought land. By contrast, in 2012, 13 percent of Dak Dam sample households had sold land in the previous five years and 15 percent had bought land. During the years from 2003 to 2012 a land market had begun to develop in Dak Dam commune. Moreover, in 2012, 64 percent of the sample households had reportedly cleared an average 1.38 hectares for cultivation in the previous five years. The opening up of lands mainly for cassava cultivation spurred economic growth albeit at the expense of forest resources.
On average, in Dak Dam the better-off and above-poor households surveyed in 2012 had bought and sold more upland in the previous five years than had the poor and very poor households surveyed (Table 6). Not surprisingly there had been virtually no buying and selling of wetland in the previous five years among the sample households. Of note, very poor and poor households had cleared more forest land in the previous five years than had the above-poor and better-off households. Since the very poor and poor groups were minimally involved in the land sales, it appears that they had acted mainly in response to population pressure.
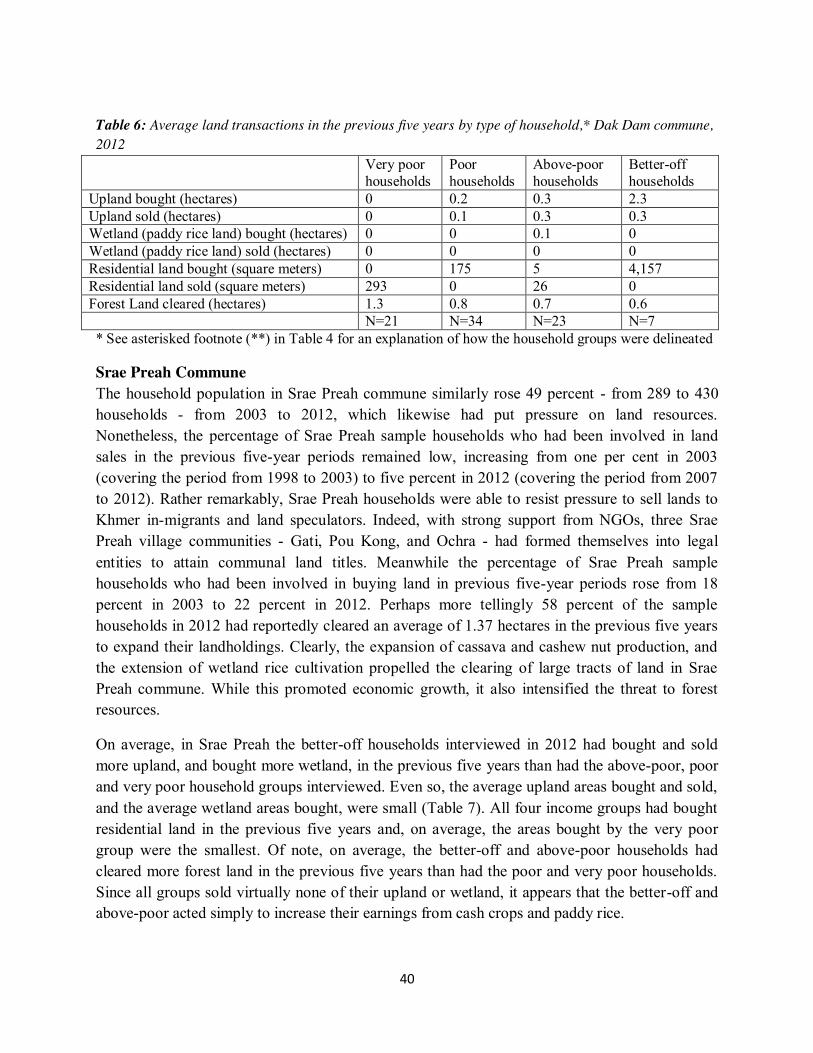
40
Table 6: Average land transactions in the previous five years by type of household,* Dak Dam commune, 2012
Very poor households
Poor households
Above-poor households
Better-off households
Upland bought (hectares) 0 0.2 0.3 2.3 Upland sold (hectares) 0 0.1 0.3 0.3 Wetland (paddy rice land) bought (hectares) 0 0 0.1 0 Wetland (paddy rice land) sold (hectares) 0 0 0 0 Residential land bought (square meters) 0 175 5 4,157 Residential land sold (square meters) 293 0 26 0 Forest Land cleared (hectares) 1.3 0.8 0.7 0.6 N=21 N=34 N=23 N=7 * See asterisked footnote (**) in Table 4 for an explanation of how the household groups were delineated
Srae Preah Commune The household population in Srae Preah commune similarly rose 49 percent - from 289 to 430 households - from 2003 to 2012, which likewise had put pressure on land resources. Nonetheless, the percentage of Srae Preah sample households who had been involved in land sales in the previous five-year periods remained low, increasing from one per cent in 2003 (covering the period from 1998 to 2003) to five percent in 2012 (covering the period from 2007 to 2012). Rather remarkably, Srae Preah households were able to resist pressure to sell lands to Khmer in-migrants and land speculators. Indeed, with strong support from NGOs, three Srae Preah village communities - Gati, Pou Kong, and Ochra - had formed themselves into legal entities to attain communal land titles. Meanwhile the percentage of Srae Preah sample households who had been involved in buying land in previous five-year periods rose from 18 percent in 2003 to 22 percent in 2012. Perhaps more tellingly 58 percent of the sample households in 2012 had reportedly cleared an average of 1.37 hectares in the previous five years to expand their landholdings. Clearly, the expansion of cassava and cashew nut production, and the extension of wetland rice cultivation propelled the clearing of large tracts of land in Srae Preah commune. While this promoted economic growth, it also intensified the threat to forest resources.
On average, in Srae Preah the better-off households interviewed in 2012 had bought and sold more upland, and bought more wetland, in the previous five years than had the above-poor, poor and very poor household groups interviewed. Even so, the average upland areas bought and sold, and the average wetland areas bought, were small (Table 7). All four income groups had bought residential land in the previous five years and, on average, the areas bought by the very poor group were the smallest. Of note, on average, the better-off and above-poor households had cleared more forest land in the previous five years than had the poor and very poor households. Since all groups sold virtually none of their upland or wetland, it appears that the better-off and above-poor acted simply to increase their earnings from cash crops and paddy rice.

41
Table 7: Average land transactions in the previous five years by type of household,* Srae Preah commune, 2012
Very poor households
Poor households
Above-poor households
Better-off households
Upland bought (hectares) 0.2 0.2 0 0.6 Upland sold (hectares) 0 0 0 0.1 Wetland (paddy rice land) bought (hectares) 0 0.1 0.1 0.2 Wetland (paddy rice land) sold (hectares) 0 0 0 0 Residential land bought (square meters) 92 354 114 196 Residential land sold (square meters) 0 34 0 35 Forest Land cleared (hectares) 0.4 0.6 0.8 1.1 N=12 N=34 N=34 N=26 *See asterisked footnote (**) in Table 4 for an explanation of how the household groups were delineated
Discussion Population increase and the expansion of cash crop production spurred the development of land markets in both communes although somewhat more so in Dak Dam than in Srae Preah. In Srae Preah commune indigenous households were able to resist pressure to sell lands to Khmer in-migrants and land speculators. However, in Srae Ampil village indigenous households were less successful in stopping the Sovann Reachsei ELC from cutting down their resin trees. In both communes, better-off households had, on average, bought more upland in the previous five years than had the other income groups. This helps to explain the concentration of land resources among the more wealthy households. The expansion of cash crops had likewise spurred the clearing of large tracts of land in both communes, which had ex acerbated the threat posed to forested areas and household livelihoods reliant on forest resources. Land markets in Mondulkiri have been particular robust along the national road and near market centers (McAndrew et al. 2003, Milne 2013). As land markets expand into more remote areas such as Dak Dam and Srae Preah communes, land transactions will undoubtedly increase.
Buying and Selling of Labor and Other Products From 2003 to 2012 households in Dak Dam and Srae Preah communes, in addition to buying and selling land, were engaged in buying and selling goods and services such as labor, rice, upland crops, livestock, forest products and wildlife.15 Dak Dam Commune From 2003 to 2012 the percentage of households in Dak Dam commune who worked for wages in the past year, and who hired others to work for them, increased sharply. This resulted principally from the increased labor demands brought about by the cultivation of cassava and the need to hire workers to plant, weed and harvest cassava. The cultivation of cassava for the market likewise contributed to an increased percentage of households selling upland crops. Sales 15 For specific details on labor, upland crops, forest products and wildlife bought and sold by households in Dak Dam and Srae Preah communes in 2003 and 2012 see Appendices 10 to 14
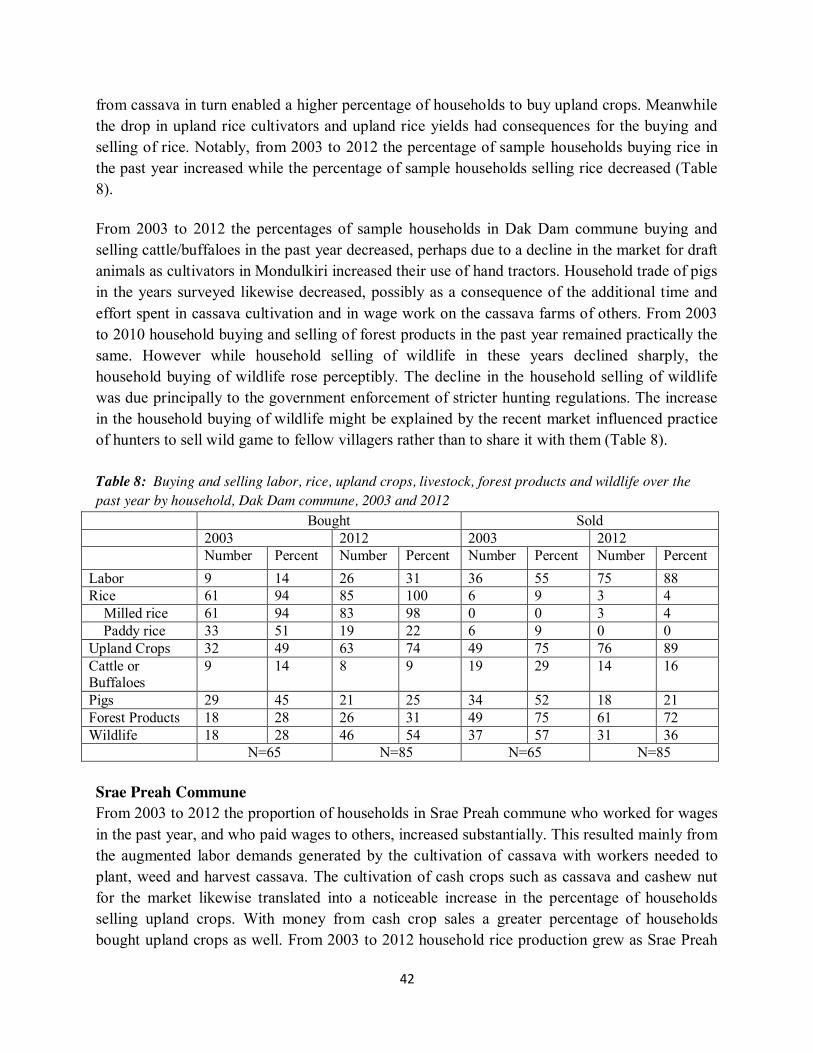
42
from cassava in turn enabled a higher percentage of households to buy upland crops. Meanwhile the drop in upland rice cultivators and upland rice yields had consequences for the buying and selling of rice. Notably, from 2003 to 2012 the percentage of sample households buying rice in the past year increased while the percentage of sample households selling rice decreased (Table 8).
From 2003 to 2012 the percentages of sample households in Dak Dam commune buying and selling cattle/buffaloes in the past year decreased, perhaps due to a decline in the market for draft animals as cultivators in Mondulkiri increased their use of hand tractors. Household trade of pigs in the years surveyed likewise decreased, possibly as a consequence of the additional time and effort spent in cassava cultivation and in wage work on the cassava farms of others. From 2003 to 2010 household buying and selling of forest products in the past year remained practically the same. However while household selling of wildlife in these years declined sharply, the household buying of wildlife rose perceptibly. The decline in the household selling of wildlife was due principally to the government enforcement of stricter hunting regulations. The increase in the household buying of wildlife might be explained by the recent market influenced practice of hunters to sell wild game to fellow villagers rather than to share it with them (Table 8). Table 8: Buying and selling labor, rice, upland crops, livestock, forest products and wildlife over the past year by household, Dak Dam commune, 2003 and 2012
Bought Sold 2003 2012 2003 2012 Number Percent Number Percent Number Percent Number Percent Labor 9 14 26 31 36 55 75 88 Rice 61 94 85 100 6 9 3 4 Milled rice 61 94 83 98 0 0 3 4 Paddy rice 33 51 19 22 6 9 0 0 Upland Crops 32 49 63 74 49 75 76 89 Cattle or Buffaloes
9 14 8 9 19 29 14 16
Pigs 29 45 21 25 34 52 18 21 Forest Products 18 28 26 31 49 75 61 72 Wildlife 18 28 46 54 37 57 31 36
N=65 N=85 N=65 N=85 Srae Preah Commune From 2003 to 2012 the proportion of households in Srae Preah commune who worked for wages in the past year, and who paid wages to others, increased substantially. This resulted mainly from the augmented labor demands generated by the cultivation of cassava with workers needed to plant, weed and harvest cassava. The cultivation of cash crops such as cassava and cashew nut for the market likewise translated into a noticeable increase in the percentage of households selling upland crops. With money from cash crop sales a greater percentage of households bought upland crops as well. From 2003 to 2012 household rice production grew as Srae Preah

43
farmers adopted high-yielding rice technology and expanded their wetland rice farms. As a consequence, the percentage of sample households buying rice in the past year dropped substantially while the percentage of sample households selling rice increased (Table 9). From 2003 to 2012 the percentages of sample households in Srae Preah commune buying and selling cattle/buffaloes in the past year decreased, which might be explained by the increased use of hand tractors in paddy rice production. Household trade in pigs likewise declined in the years surveyed, perhaps as a consequence of households expending additional work in paddy rice and upland cash crop production and in wage work on paddy rice and upland farms. Given the sharp decline in the production and trade of liquid resin, it is not surprising that from 2003 to 2012 household selling of forest products in the past year decreased significantly. Household buying of forest products in the past year remained similar over the same period. Somewhat unexpectedly from 2003 to 2012 household buying of wildlife in the past year rose prominently. This might be explained by the recent market oriented practice of hunters to sell wildlife to fellow villages rather than to share it with them. From 2003 to 2012 household selling of wildlife in the past year remained virtually constant (Table 9). Table 9: Buying and selling of labor, rice, upland crops, livestock, forest products, and wildlife in the past year by household, Srae Preah commune, 2003 and 2012*
Bought Sold 2003 2012 2003 2012 Number Percent Number Percent Number Percent Number Percent Labor 15 20 50 47 31 42 70 66 Rice 69 93 63 59 5 7 25 24 Milled rice 69 93 60 57 0 0 7 7 Paddy rice 20 27 18 17 5 7 23 22 Upland Crops 49 66 98 92 24 32 91 86 Cattle or Buffaloes
13 18 10 9 28 38 27 25
Pigs 39 53 26 25 23 31 31 29 Forest Products 20 27 31 29 67 91 61 58 Wildlife 26 35 90 85 30 41 44 42
N=74 N=106 N=74 N=106 Discussion From 2003 to 2012 households in Dak Dam and Srae Preah communes were involved in the buying and selling of goods and services such as labor, rice, upland crops, livestock, forest products and wildlife. In both communes the percentage of households working for wages and paying wages to others increased noticeably from 2003 to 2012 due to the increased labor demands brought about by the cultivation of cassava. Similarly, the cultivation of cassava for the market contributed to an increase of the percentage of households in the two communes selling upland crops in the nine-year period. In Dak Dam commune, as a consequence of the decline of upland rice farming, the percentage of households buying rice from 2003 to 2012 increased while the percentage of households selling rice decreased. Comparatively in Srae Preah
44
commune, as a result of the adoption of high-yielding rice technology and the expansion of wetland rice farms, the percentage of households buying rice from 2003 to 2012 dropped prominently while the percentage of households selling rice increased. In both communes the percentages of households buying and selling cattle/buffaloes decreased from 2003 to 2012 due perhaps to a drop in the market for draft animals as cultivators increased their use of hand tractors. In Dak Dam commune the percentages of households buying and selling forest products from 2003 to 2012 remained similar. In Srae Preah commune the percentage of households selling forest products in the same years dropped sharply as a result of the decline in the trade of liquid resin. In Dak Dam commune household selling of wildlife declined from 2003 to 2012 due to the government enforcement of stricter hunting regulations. However in both communes household buying of wildlife increased from 2003 to 2012 perhaps due to the prevalent practice of hunters to sell wild game to fellow villagers rather than to share it with them.
45
Poverty and Inequality in Dak Dam and Srae Preah Communes
(2003-2012) In the introduction we identified economic inequality as a consequence of market integration and posited that livelihood transitions in the two communes encompassed prosperity for some and impoverishment for others. Indeed, in Srae Preah commune, economic growth led to a decline in the number of sample households living in poverty, from 63 percent in 2003 to 43 percent in 2012. By contrast, economic growth in Dak Dam commune did not have the same mitigating effects on poverty, as the proportion of sample households living in poverty increased from 54 percent in 2003 to 65 percent in 2012. Poverty levels in 2012 in both communes were much higher than the poverty level of 24 percent calculated by the World Bank for rural households in Cambodia in 2011 (World Bank 2013). Gini coefficients, which measure levels of overall income inequality, were also high in both communes. In 2012 the Gini coefficient for the Dak Dam household sample was 0.43, while that for the Srae Preah household sample was 0.38, both much higher than the Gini coefficient of 0.28 estimated by the World Bank for Cambodia in 2011.16 Overall poverty decline in Srae Preah commune was indicated by the fact that proportionally higher numbers of Srae Preah households enjoyed a degree of prosperity in 2012 than in 2003. Conversely, overall poverty rise in Dak Dam commune indicated that proportionally higher numbers of Dak Dam households were impoverished in 2012 than in 2003. This may be explained partially by the ability of the Srae Preah households to exert their rights over land resources and to resist land sales to Khmer migrants. Households in Dak Dam were not as successful. At the same time, high levels of overall household income inequality in 2012 suggests that economic well-being and deprivation co-existed among households in both communes. This points to the exclusionary effects of the market integration and indicates that exit options are limited for many indigenous households leaving them vulnerable to marginalization and displacement (Vandergeest and Rigg 2012). Household Income Inequality Dak Dam Commune The household survey conducted in Dak Dam commune in 2003 revealed an inequality of income levels among the sample respondents. While 26 per cent of households surveyed earned less than 1,000,000 riels in the past year, 17 per cent earned 3,000,000 riels or more in the past year. By 2012, the average yearly incomes of the sample households had increased 1.9 times at constant 2003 prices. Despite this growth an inequality of income levels persisted among sample households in Dak Dam commune. In 2012, 28 percent of the households surveyed earned less than 2,000,000 riels in the past year (at constant 2003 prices), while 45 percent earned 3,000,000 riels or more in the past year (at constant 2003 prices) (Table 10). 16 Figures for 2003 are based on the poverty line for rural areas of 1,036 riels per capita per day set by the Ministry of Planning, Royal Government of Cambodia and the United Nations World Food Programme (2003). Figures for 2011 are based on World Bank estimates of the poverty line for rural areas of 4,422 riels per capita per day and the Gini coefficient for Cambodia of 0.28 based on the Cambodia Socio-Economic Survey (CSES) 2011 (World Bank 2013)
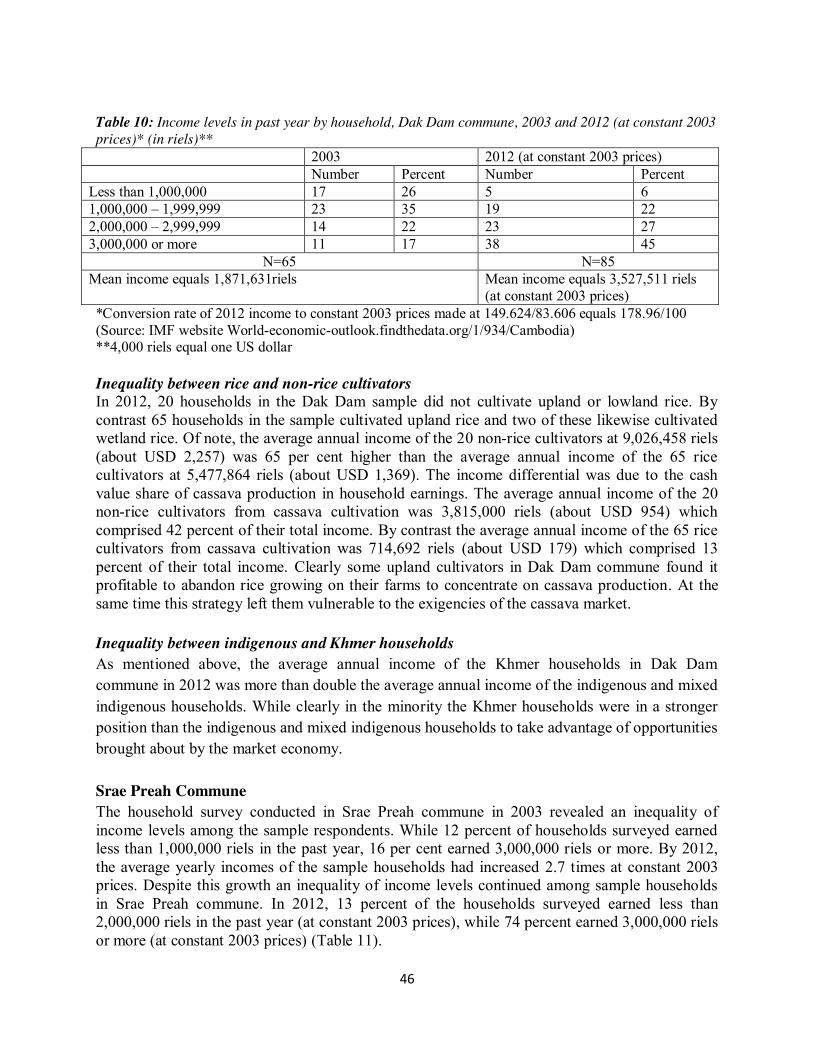
46
Table 10: Income levels in past year by household, Dak Dam commune, 2003 and 2012 (at constant 2003 prices)* (in riels)**
2003 2012 (at constant 2003 prices) Number Percent Number Percent Less than 1,000,000 17 26 5 6 1,000,000 – 1,999,999 23 35 19 22 2,000,000 – 2,999,999 14 22 23 27 3,000,000 or more 11 17 38 45
N=65 N=85 Mean income equals 1,871,631riels Mean income equals 3,527,511 riels
(at constant 2003 prices) *Conversion rate of 2012 income to constant 2003 prices made at 149.624/83.606 equals 178.96/100 (Source: IMF website World-economic-outlook.findthedata.org/1/934/Cambodia) **4,000 riels equal one US dollar Inequality between rice and non-rice cultivators In 2012, 20 households in the Dak Dam sample did not cultivate upland or lowland rice. By contrast 65 households in the sample cultivated upland rice and two of these likewise cultivated wetland rice. Of note, the average annual income of the 20 non-rice cultivators at 9,026,458 riels (about USD 2,257) was 65 per cent higher than the average annual income of the 65 rice cultivators at 5,477,864 riels (about USD 1,369). The income differential was due to the cash value share of cassava production in household earnings. The average annual income of the 20 non-rice cultivators from cassava cultivation was 3,815,000 riels (about USD 954) which comprised 42 percent of their total income. By contrast the average annual income of the 65 rice cultivators from cassava cultivation was 714,692 riels (about USD 179) which comprised 13 percent of their total income. Clearly some upland cultivators in Dak Dam commune found it profitable to abandon rice growing on their farms to concentrate on cassava production. At the same time this strategy left them vulnerable to the exigencies of the cassava market. Inequality between indigenous and Khmer households As mentioned above, the average annual income of the Khmer households in Dak Dam commune in 2012 was more than double the average annual income of the indigenous and mixed indigenous households. While clearly in the minority the Khmer households were in a stronger position than the indigenous and mixed indigenous households to take advantage of opportunities brought about by the market economy. Srae Preah Commune The household survey conducted in Srae Preah commune in 2003 revealed an inequality of income levels among the sample respondents. While 12 percent of households surveyed earned less than 1,000,000 riels in the past year, 16 per cent earned 3,000,000 riels or more. By 2012, the average yearly incomes of the sample households had increased 2.7 times at constant 2003 prices. Despite this growth an inequality of income levels continued among sample households in Srae Preah commune. In 2012, 13 percent of the households surveyed earned less than 2,000,000 riels in the past year (at constant 2003 prices), while 74 percent earned 3,000,000 riels or more (at constant 2003 prices) (Table 11).
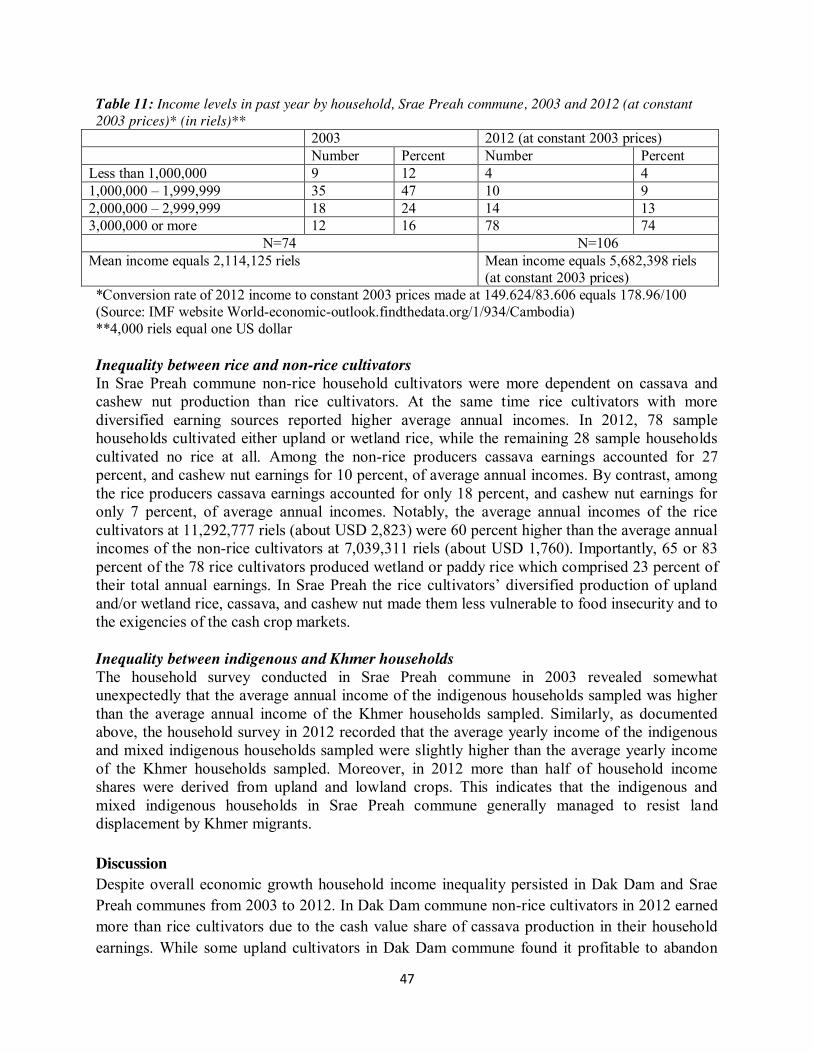
47
Table 11: Income levels in past year by household, Srae Preah commune, 2003 and 2012 (at constant 2003 prices)* (in riels)**
2003 2012 (at constant 2003 prices) Number Percent Number Percent Less than 1,000,000 9 12 4 4 1,000,000 – 1,999,999 35 47 10 9 2,000,000 – 2,999,999 18 24 14 13 3,000,000 or more 12 16 78 74
N=74 N=106 Mean income equals 2,114,125 riels Mean income equals 5,682,398 riels
(at constant 2003 prices) *Conversion rate of 2012 income to constant 2003 prices made at 149.624/83.606 equals 178.96/100 (Source: IMF website World-economic-outlook.findthedata.org/1/934/Cambodia) **4,000 riels equal one US dollar Inequality between rice and non-rice cultivators In Srae Preah commune non-rice household cultivators were more dependent on cassava and cashew nut production than rice cultivators. At the same time rice cultivators with more diversified earning sources reported higher average annual incomes. In 2012, 78 sample households cultivated either upland or wetland rice, while the remaining 28 sample households cultivated no rice at all. Among the non-rice producers cassava earnings accounted for 27 percent, and cashew nut earnings for 10 percent, of average annual incomes. By contrast, among the rice producers cassava earnings accounted for only 18 percent, and cashew nut earnings for only 7 percent, of average annual incomes. Notably, the average annual incomes of the rice cultivators at 11,292,777 riels (about USD 2,823) were 60 percent higher than the average annual incomes of the non-rice cultivators at 7,039,311 riels (about USD 1,760). Importantly, 65 or 83 percent of the 78 rice cultivators produced wetland or paddy rice which comprised 23 percent of their total annual earnings. In Srae Preah the rice cultivators’ diversified production of upland and/or wetland rice, cassava, and cashew nut made them less vulnerable to food insecurity and to the exigencies of the cash crop markets. Inequality between indigenous and Khmer households The household survey conducted in Srae Preah commune in 2003 revealed somewhat unexpectedly that the average annual income of the indigenous households sampled was higher than the average annual income of the Khmer households sampled. Similarly, as documented above, the household survey in 2012 recorded that the average yearly income of the indigenous and mixed indigenous households sampled were slightly higher than the average yearly income of the Khmer households sampled. Moreover, in 2012 more than half of household income shares were derived from upland and lowland crops. This indicates that the indigenous and mixed indigenous households in Srae Preah commune generally managed to resist land displacement by Khmer migrants. Discussion Despite overall economic growth household income inequality persisted in Dak Dam and Srae Preah communes from 2003 to 2012. In Dak Dam commune non-rice cultivators in 2012 earned more than rice cultivators due to the cash value share of cassava production in their household earnings. While some upland cultivators in Dak Dam commune found it profitable to abandon

48
rice growing on their farms to concentrate on cassava cultivation, this choice left them vulnerable to the exigencies of the cassava market. By comparison in Srae Preah commune rice cultivators, most of whom produced paddy rice, had more diversified earning sources and higher average annual incomes in 2012 than non-rice cultivators. Moreover, in Dak Dam commune the average annual income of the Khmer households was more than double that of the indigenous and mixed indigenous households. By contrast, in Srae Preah commune the average yearly income of the indigenous and mixed indigenous households was slightly higher than that of the Khmer households. In Dak Dam commune, albeit not in Srae Preah commune, Khmer households were in a stronger position than indigenous and mixed indigenous households to take advantage of opportunities brought about by the market economy. Village Income Inequality Dak Dam Commune In 2003 and 2012 average household incomes in Dak Dam commune differed according to villages and changed over the interim years. In 2003, sample households in Pou Antreng village recorded higher than average earnings while sample households in Pou Chob and Pou Less villages posted lower than average earnings. By comparison, in 2012 sample households in Pou Chob and Pou Less villages had higher than average earnings while sample households in Pou Antreng village had lower than average earnings (Table 12). Table 12: Average cash value of total household income in past year by village, Dak Dam commune, 2003 and 2012 (in riels)* (with average cash values for hunting and trapping in 2003 and for cassava in 2012)
Village
2003 2012 Average total earnings
Average earnings from hunting and trapping
Percent earnings of hunting and trapping to total
Average total earnings
Average earnings from cassava
Percent earnings of cassava to total
Pou Antreng 2,035,214 709,989 34.9 5,570,594 888,281 15.9 Pou Chob 1,780,388 454,421 25.5 8,279,538 2,934,615 35.4 Pou Less 1,730,417 340,926 19.7 5,298,663 1,667,778 31.5 Dak Dam commune
1,871,631 527,405 28.2 6,312,832 1,444,172 22.9
*4,000 riels equal one US dollar
In 2003, earnings from hunting and trapping contributed substantially to household incomes in Pou Antreng village. With higher than average earnings from hunting and trapping, sample households in Pou Antreng village had higher than average total earnings. By comparison, in 2012 cassava cultivation contributed substantially to the incomes of households in Pou Chob and Pou Less villages. With higher than average earnings from cassava, sample households in Pou Chob and Pou Less villages similarly had higher than average total earnings. For the present the shift away from hunting and trapping to cassava production appeared to benefit households in
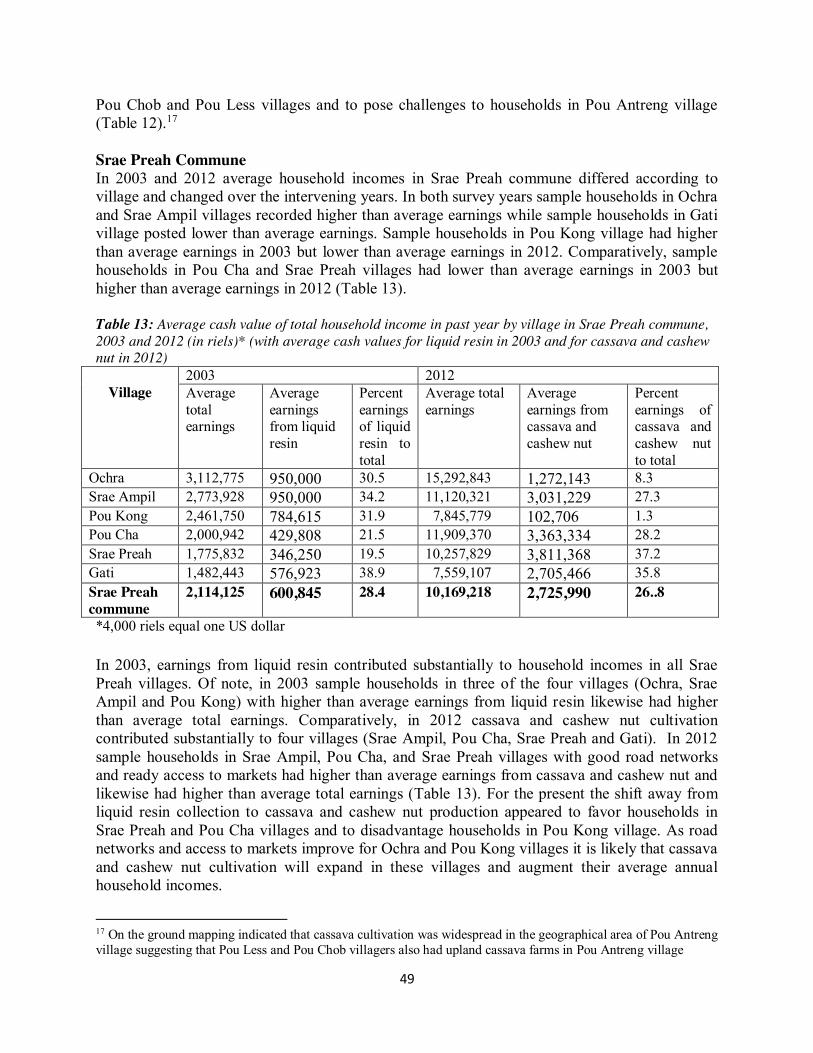
49
Pou Chob and Pou Less villages and to pose challenges to households in Pou Antreng village (Table 12).17 Srae Preah Commune In 2003 and 2012 average household incomes in Srae Preah commune differed according to village and changed over the intervening years. In both survey years sample households in Ochra and Srae Ampil villages recorded higher than average earnings while sample households in Gati village posted lower than average earnings. Sample households in Pou Kong village had higher than average earnings in 2003 but lower than average earnings in 2012. Comparatively, sample households in Pou Cha and Srae Preah villages had lower than average earnings in 2003 but higher than average earnings in 2012 (Table 13). Table 13: Average cash value of total household income in past year by village in Srae Preah commune, 2003 and 2012 (in riels)* (with average cash values for liquid resin in 2003 and for cassava and cashew nut in 2012)
Village
2003 2012 Average total earnings
Average earnings from liquid resin
Percent earnings of liquid resin to total
Average total earnings
Average earnings from cassava and cashew nut
Percent earnings of cassava and cashew nut to total
Ochra 3,112,775 950,000 30.5 15,292,843 1,272,143 8.3 Srae Ampil 2,773,928 950,000 34.2 11,120,321 3,031,229 27.3 Pou Kong 2,461,750 784,615 31.9 7,845,779 102,706 1.3 Pou Cha 2,000,942 429,808 21.5 11,909,370 3,363,334 28.2 Srae Preah 1,775,832 346,250 19.5 10,257,829 3,811,368 37.2 Gati 1,482,443 576,923 38.9 7,559,107 2,705,466 35.8 Srae Preah commune
2,114,125 600,845 28.4 10,169,218 2,725,990 26..8
*4,000 riels equal one US dollar In 2003, earnings from liquid resin contributed substantially to household incomes in all Srae Preah villages. Of note, in 2003 sample households in three of the four villages (Ochra, Srae Ampil and Pou Kong) with higher than average earnings from liquid resin likewise had higher than average total earnings. Comparatively, in 2012 cassava and cashew nut cultivation contributed substantially to four villages (Srae Ampil, Pou Cha, Srae Preah and Gati). In 2012 sample households in Srae Ampil, Pou Cha, and Srae Preah villages with good road networks and ready access to markets had higher than average earnings from cassava and cashew nut and likewise had higher than average total earnings (Table 13). For the present the shift away from liquid resin collection to cassava and cashew nut production appeared to favor households in Srae Preah and Pou Cha villages and to disadvantage households in Pou Kong village. As road networks and access to markets improve for Ochra and Pou Kong villages it is likely that cassava and cashew nut cultivation will expand in these villages and augment their average annual household incomes.
17 On the ground mapping indicated that cassava cultivation was widespread in the geographical area of Pou Antreng village suggesting that Pou Less and Pou Chob villagers also had upland cassava farms in Pou Antreng village
50
Discussion In 2003 and 2012 average household incomes in Dak Dam and Srae Preah communes differed according to villages and changed over the nine-year period. In both communesa village with high average household earnings in 2003 did not necessarily have high average household earnings in 2012 and vice-versa. In villages of Dak Dam commune high average earnings from hunting and trapping in 2003 contributed generally to high average household earnings in 2003 while high average earnings from cassava production in 2012 contributed generally to high average household earnings in 2012. In villages of Srae Preah commune high average earnings from liquid resin tapping in 2003 contributed usually to high average household earnings in 2003 while high average earnings from cassava and cashew nut production in 2012 contributed usually to high average household earnings in 2012. Overall the shifts away from hunting and trapping and liquid resin collection to the cash crop production of cassava and cashew nut appeared to favor households in some villages and to disadvantage households in other villages.
51
Conclusions We have used the concept of transition (Martens and Rotmans 2005) in this study as a heuristic to examine the interplay of livelihood and land use change in Dak Dam and Srae Preah communes. We have further argued that the rapid expansion of the market economy in these communes has resulted in dispossession from land and forest resources, a reliance on cash crops, land commodification, land concentration, social differentiation and economic inequality. We have likewise presented detailed findings and analysis to support this argument.
Between the years 2003 and 2012 Dak Dam and Srae Preah households experienced a transition in agricultural production as they moved from the cultivation of upland staple crops mainly for subsistence to the production of cash crops, specifically cassava and cashew nuts, for the market. Market integration generated economic growth, with mixed outcomes for poverty reduction, as well as high income inequality among sample households. This resulted in prosperity for some and impoverishment for others.
The cultivation of cash crops in the two communes was accompanied by a shift away from swidden agriculture to the cultivation of crops on permanent farms. Establishing permanent farms helped to expand the number of hectares devoted to cash crops and to prevent encroachment on fallow lands. Even so, the clearing of new lands - which is a defining feature of swidden agriculture - persisted. Large tracts of land have been cleared in the past five years in Dak Dam and Srae Preah communes to expand the production of cassava. In Srae Preah commune, lands have also been cleared to extend paddy rice cultivation. The opening up of lands for cash crop production and paddy rice cultivation has spurred economic growth, but at the cost of exacerbating the threat posed to forested areas and household livelihoods reliant on forest resources.
By 2012 livelihood transitions had emerged in the local economies giving rise to substantial increases in average annual household incomes. This extraordinary growth resulted from increases in the cash values of household livelihood pursuits. It likewise reflected high inflation rates during the interim years. In Dak Dam commune growth was due principally to earnings derived from the cash crop production of cassava and from wage work principally in the form of agricultural labor. In Srae Preah commune growth was due primarily to earnings gained from cassava and cashew nut production, and less so from paddy rice cultivation. In both communes household income groups with lower dependency ratios had higher income earnings.
As income shares from the cultivation of crops increased in the two communes, income shares from forest products, hunting and trapping decreased. Specifically, household earnings from hunting and trapping in Dak Dam commune, and from liquid resin tapping in Srae Preah commune, declined sharply from 2003 to 2012. Nonetheless, in 2012, forest products, hunting
52
and trapping still made up one-fourth of household incomes in Dak Dam and nearly one-third of household incomes in Srae Preah. Although forest resources no longer constituted the dominant share of household income that had been the case in 2003, a large majority of Dak Dam and Srae Preah households continued to rely on gathering forest food and other products and on the hunting and trapping of wildlife to supplement their household incomes and livelihoods. Access to and control over forest resources and the conservation of these resources remained as critical for household livelihood security in 2012 as they had been in 2003. Prior to the baseline study in 2003, anarchic and concession logging had posed the principal threats to land and forest resources in the two communes. Since 2003, ELCs, mine exploration and the illegal timber trade had become the major threats to indigenous access to natural resources in the communes.
Meanwhile the rapid adoption of cassava as a boom crop raised concerns of its own. Reliance on cassava production made indigenous households more vulnerable to the exigencies of the market economy. Critically, though perhaps less well understood, the pursuit of cassava cultivation had consequences for social differentiation. In both communes income earned from cassava cultivation was related to upland farm size. Better-off farmers cultivated larger upland areas and earned more from cassava production than did other income groups. In the previous five years, better-off households had likewise augmented their holdings, buying up more upland than other income groups.
The accumulation of land in the hands of better-off households threatened to result in the dispossession of small farm holders potentially to the point of landlessness. While cassava production created opportunities for agricultural labor, very poor households in both communes earned proportionally less from wage work than did most other income groups. Moreover, the very poor households, like the other income groups, earned little or nothing from trading and migrant remittances. This revealed that livelihood opportunities and exit options for the very poor households remained limited. Loss of upland farms and access to forest resources would, no doubt, leave them further displaced and marginalized.
Polarization of households was more evident in Dak Dam than in Srae Preah. In Dak Dam, better-off households earned more, and very poor households earned less, on average, than respective income groups in Srae Preah. In 2012 the Gini coefficient was likewise higher among the Dak Dam sample households than it was among the Srae Preah sample households. Of note, in 2012 Khmer households in Dak Dam commune earned on average more than double that of indigenous and mixed indigenous households. This indicated that polarization in Dak Dam commune was associated in part with ethnicity. By comparison, average earnings of Khmer, indigenous and mixed indigenous households in Srae Preah commune were virtually equal. Indigenous and mixed indigenous households in Srae Preah commune generally managed to resist dispossession by Khmer migrants.
Overall, indigenous groups in Srae Preah commune had retained greater access to, and control over, their natural resources, and had achieved greater participation in the governance of these
53
resources than had indigenous groups in Dak Dam commune. While land markets had begun to develop in both communes, land sales in the previous five years had been higher in Dak Dam than in Srae Preah. Notably, with strong support from NGOs, three Srae Preah village communities had taken steps to attain communal land titles. Importantly, the topography of Srae Preah commune, unlike that of Dak Dam commune, provided Srae Preah villagers with an opportunity to produce paddy rice. As a consequence Srae Preah households were less vulnerable to the exigencies of the cassava market and less reliant on the low returns and seasonality of agricultural labor than were Dak Dam households. The pathway pursued by the Bunong in Srae Preah commune, while fraught with threats posed by the rapid adoption of the cassava boom crop and the incursion of ELCs and mine development, translated into greater prosperity and less poverty for a larger proportion of households than the pathway taken by the Bunong in Dak Dam commune.

54
Recommendations
Our study has considered livelihood and land use change in the broad context of agrarian transitions. This approach dismisses simplistic single-cause explanations in favor of those that integrate multiple causes and their complex interactions. This view likewise cautions against applying generalizations uncritically to local experience (De Koninck et al. 2012, Lambin et al. 2003, Martens and Rotmans 2005). Our research has shown that similar transition processes can have different livelihood outcomes for local communities, households and individuals. Rather than proposing a set of prescriptions to be rigorously enacted, the researchers present a few principles and lessons learned from the study to guide participation and policy implementation in the transition process.
A recent volume on land dilemmas in Southeast Asia cites the case of Cambodia to underscore the extent and rapidity of change in the region’s land relations. The authors note the active involvement of the Cambodian government, private enterprise, NGOs and the World Bank in shaping the transition process. Importantly, they stress the human agency of the smallholders themselves: “Meanwhile, the smallholders throughout Cambodia were taking their own initiatives to consolidate their claims to land for livelihood security and also, in some cases, as the means to a decent income from new cash crops. Their goal was not only to defend their land against the state and corporations, but also to respond to the actions of kin and neighbors who were consolidating their own claims, and some of whom were accumulating land” (Hall et al. 2011). Advocates for indigenous people’s rights must acknowledge the human agency and aspirations at work among the people they wish to support. Otherwise the natural resource projects they propagate may mirror the top-down projects they intend to replace.
This study has demonstrated that land constitutes a critical livelihood resource and that indigenous groups with access to land are better off than those without it. The authors have likewise argued that indigenous people’s participation in land use governance is critical in ensuring livelihood security in the transition process. Efforts of indigenous groups to obtain the full benefits of communal land titles in the Srae Preah villages of Gati, Pou Kong and Ochra must be sustained and the government’s resistance to communal land tenure overcome. Similarly, efforts of indigenous groups to acquire private land titles in other study villages of Srae Preah and Dak Dam communes must be supported. Security of land tenure is critical especially for vulnerable and marginalized groups who lack opportunities outside of agriculture. While remedial action pursued through communal land titling and private land titling counteract threats posed by corporate incursions such as ELCs and mine exploration, they nonetheless entail their own exclusionary dilemmas. Understanding the diverse implications that exclusion in land use schemes have for disparate stakeholders enables indigenous people, NGOs and policymakers to make better informed choices (Hall et al. 2011).
55
The Cambodian government’s ratification and adoption of progressive legislation in recent years with respect to indigenous people’s access to land and forest resources provides a legal framework for preventing the further impoverishment and marginalization of these groups. These laws are a necessary first step towards recognizing indigenous people as full Cambodian citizens and accommodating their livelihood systems and aspirations into the national development agenda. Laws promulgating indigenous rights must be fully implemented. For the foreseeable future efforts to enhance indigenous access to land and forest resources will remain paramount as livelihood transitions continue to emerge from land use change. But, inevitably, populations will increase and access to land and forest resources will diminish further. Efforts to secure the access indigenous people have to resources should now be encompassed within a broader context that seeks to expand the options these people have and to reduce their current, almost total, reliance on agriculture and forests.
56
References Analyzing Development Issues (2010) The Expansion of Mining Activities and Indigenous
Peoples’ Rights in Mondulkiri Province: Case Studies of Gati Village, Keo Seima District and Pou Rapeth Village, Pechreada District, Phnom Penh: Cooperation Committee for Cambodia.
Asian Development Bank (2000) Health and Education Needs of Ethnic Minorities in the Greater Mekong Sub-Region. Cambodia Country Report, Manila: Asian Development Bank.
Backstrom, M., Ironside, J., Paterson, G., Padwe, J. and Baird, I. G. (2007) Indigenous Traditional Legal Systems and Conflict Resolution in Ratanakiri and Mondulkiri Provinces, Cambodia. Phnom Penh: United Nations Development Programme.
Beaumont, P. (2008) Extractive Industry Mining Study, Social and Environmental Impacts, Ratanakiri & Mondulkiri, Phnom Penh: Development and Partnership in Action.
Chheang, V. and Dulioust, J. (2012) Rural – Rural Migrations in Cambodia Policy paper, Supreme National Economic Council and Agence Francaise de Développement.
Cramb, R. A., Colfer, C. J. P., Dressler, W., Laungaramsri, P., Quang Trang, L., Mulyoutami, E., Peluso, N. L. and Wadley, R. L. (2009) Swidden Transformations and Rural Livelihoods in Southeast Asia. Human Ecology, 37, pp. 323-346.
De Koninck, R., Rigg, J. and Vandergeest, P. (2012) A Half Century of Agrarian Transformations in Southeast Asia, 1960-2010. in Rigg, J. and Vandergeest, P., (eds.) Revisiting Rural Places: Pathways to Poverty and Prosperity in Southeast Asia, Honolulu: University of Hawai’i Press. pp. 25-37.
Diepart, J.-C., ed. (2015) Learning for resilence: Insights from Cambodia’s rural communities, Phnom Penh: The Learning Institute.
Diepart, J.-C. and Dupuis, D. (2014) The peasants in turmoil: Khmer Rouge, state formation and the control of land in northwest Cambodia. Journal of Peasant Studies, 41(4), pp. 445-468.
Eggert, R. (2010) Mineral Exploration and Development: Risk and Reward. in Paper Presented to the International Conference on Mining: Staking a Claim for Cambodia, 26-27 May 2010, Phnom Penh.
Ellis, F. (2000) Livelihoods and Diversity in Developing Countries, Oxford: Oxford University Press.
Evans T. D., O’Kelly H. J., Men S., Nut Meng H., Pet P., Sorn P., and Pollard E. H. B. (2013) Seima Protection Forest. in Sunderland T. C. H., Sayer J., and Minh-Ha H. (eds.) Evidenced-based Conservation: Lessons from the Lower Mekong, New York, Routledge, 157-186.
57
Evans T., Arpels, M.., and Clements T. (2012) Pilot REDD Activities in Cambodia are Expected to Improve Access to Forest Resource Use Rights and Land Tenure for Local Communities. in Naughton-Treves, L. and Day, C., (eds.) Lessons about Land Tenure, Forest Governance and REDD+: Case Studies from Africa, Asia and Latin America, Madison, Wisconsin: UW-Madison Land Tenure Center. pp. 73-82.
Evans, T. P., Hout, P., Phet, P. and Hang, M. (2003) A Study of Resin-Tapping and Livelihoods in Southern Mondulkiri, Cambodia, with Implications for Conservation and Forest Management, Phnom Penh: Wildlife Conservation Society.
Fox, J. M., McMahon, D., Poffenberger, M. and Vogler, J. (2008) Land for My Grandchildren: Land-Use and Tenure Change In Ratanakiri: 1989-2007, Community Forestry International (CFI) and the East West Center.
Glaser, B. G., and Strauss, A. L. (1967) The Discovery of Grounded Theory: Strategies for Qualitative Research, Chicago: Aldine Publishing Company.
Guerin, M. (2007) Highlanders of Central Vietnam and Cambodia: Economic and Socio-Cultural Changes between 1975 and 2007. in Paper Presented to the Conference on Socio-Cultural issues of Champa 175 years after its Disappearance, San Jose.
Hall, D., Hirsch, P. and Li, T. M., (eds.) (2011) Powers of Exclusion: Land Dilemmas in Southeast Asia, Honolulu: University of Hawai’i Press.
Hul, R. and Marks, S. (2011) B Kak Firm Seeks Bauxite in Mondulkiri. The Cambodia Daily, 4 August.
Javier, E. L. (1997) Rice ecosystems and varieties. in Nesbitt, H. J., (ed.) Rice production in Cambodia, Manila: Cambodian IRRI Australian Project. pp. 39-81.
Lambin, E. F., Geist, H. J. and Lepers, E. (2003) Dynamics of land-use and land-cover change in tropical regions. Annual Review of Environment and Resources, 28, pp. 205-241.
Li, T. M. (2012) Why So Fast? Rapid Class Differentiation in Upland Sulawesi. in Rigg, J. and Vandergeest, P., (eds.) Revisiting Rural Places: Pathways to Poverty and Prosperity in Southeast Asia, Honolulu: University of Hawai’i Press. pp. 193-210.
Martens, P. and Rotmans, J. (2005) Transitions in a Globalizing World. Futures, 37, pp. 1133-1144.
McAndrew, J., Mam, S., Hong, K. and Ly, B. (2003) Indigenous Adaptation to a Decline in Natural Resources: The Experience of Two Phnong Communes in Northeast Cambodia, Phnom Penh: CIDSE Cambodia.
McAndrew, J. and Oeur, I. (2009) Access to Natural Resources: Case Studies of Cambodian Hill Tribes. in Perera, J., (ed.) Land and Cultural Survival:The Communal Land Rights of Indigenous Peoples in Asia, Manila: Asian Development Bank. pp. 93-124.
58
McKenney, B., Yim, C., Prom, T. and Evans, T. (2004) Focusing on Cambodia's High Value Forests: Livelihood and Management, Phnom Penh: Cambodian Development Resources Institute and Wildlife Conservation Society.
Milne, S. (2013) Under the Leopard’s Skin: Land Commodification and the Dilemmas of Indigenous Communal Title in Upland Cambodia. Asia Pacific Viewpoint, 5, pp. 323-339.
Ministry of Commerce (2011) Cassava Plans for Mondulkiri. in Phnom Penh: Ministry of Commerce, Trade Promotion Department.
Ministry of Agriculture Forestry and Fisheries (2008) Book of Agricultural Statistic and Research Planning. in Phnom Penh: Ministry of Agriculture Forestry and Fisheries, Department of Planning and International Cooperation.
Ministry of Planning - Royal Government of Cambodia and the United Nations World Food Programme (2003) Poverty and Vulnerability Analysis Mapping in Cambodia: Mapping Poverty, Malnutrition, Educational Need, and Vulnerability to National Disasters in Cambodia. in Phnom Penh: Ministry of Planning - Royal Government of Cambodia and the United Nations World Food Programme
National Institute of Statistics (2009) Demographic Census 2008 (final results). in Phnom Penh: Ministry of Planning - Royal Government of Cambodia.
So D., Hak S., Oeur I., and McAndrew J. (2012) Prosperity and Impoverishment: Bunong Livelihoods in Transition in Two Mondulkiri Communes. Cambodia Development Review, 16, (4) pp. 10-14.
Sopheap, U., Patanothai, A. and Aye, T. M. (2011) Farmers’ Perceptions on Cassava Cultivation
in Cambodia. Khon Kaen Agricultural Journal, 39, pp. 279-294.
Taylor, J. (2011) Food Security, Climate Change and Natural Resources Management in Cambodia. A Overview of the Literature and Source Book. Phnom Penh: Learning Institute and IDRC.
Thann, S., Hak, S., Oeur, I. and McAndrew, J. (2009) Negotiating Tenure Conflict in Indigenous Villages of Ratanakiri Province. in CBNRM Learning Institute, (ed.) Emerging Trends, Challenges and Innovations: Community Based Natural Resource Management (CBNRM) in Cambodia, Phnom Penh: CBNRM Learning Institute.
Vandergeest, P. and Rigg, J. (2012) The Restudy “Problem”and Agrarian Change: Revisiting Rural Places in Southeast Asia. in Rigg, J. and Vandergeest, P., (eds.) Revisiting Rural Places: Pathways to Poverty and Prosperity in Southeast Asia, Honolulu: University of Hawai’i Press. pp.1-24.
World Bank (2013) Where Have All The Poor Gone? Cambodia Poverty Assessment 2013, Washington, DC: Work Bank.
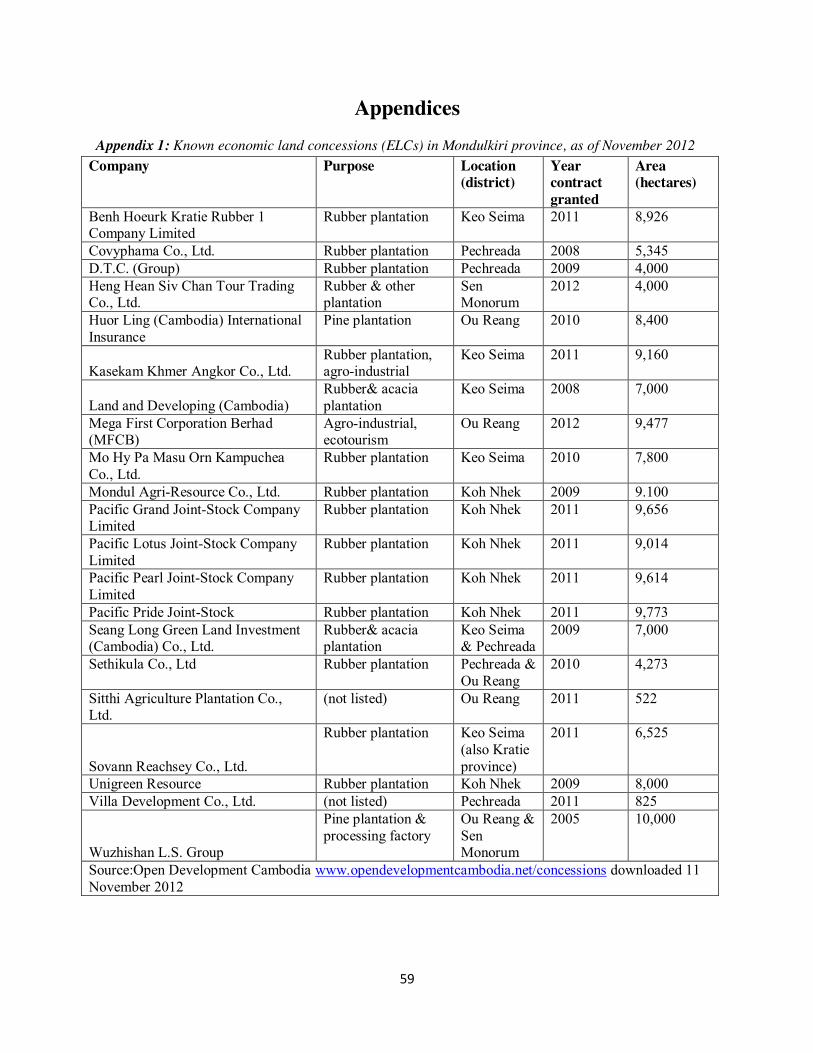
59
Appendices Appendix 1: Known economic land concessions (ELCs) in Mondulkiri province, as of November 2012
Company Purpose Location (district)
Year contract granted
Area (hectares)
Benh Hoeurk Kratie Rubber 1 Company Limited
Rubber plantation Keo Seima 2011 8,926
Covyphama Co., Ltd. Rubber plantation Pechreada 2008 5,345 D.T.C. (Group) Rubber plantation Pechreada 2009 4,000 Heng Hean Siv Chan Tour Trading Co., Ltd.
Rubber & other plantation
Sen Monorum
2012 4,000
Huor Ling (Cambodia) International Insurance
Pine plantation Ou Reang 2010 8,400
Kasekam Khmer Angkor Co., Ltd. Rubber plantation, agro-industrial
Keo Seima 2011 9,160
Land and Developing (Cambodia) Rubber& acacia plantation
Keo Seima 2008 7,000
Mega First Corporation Berhad (MFCB)
Agro-industrial, ecotourism
Ou Reang 2012 9,477
Mo Hy Pa Masu Orn Kampuchea Co., Ltd.
Rubber plantation Keo Seima 2010 7,800
Mondul Agri-Resource Co., Ltd. Rubber plantation Koh Nhek 2009 9.100 Pacific Grand Joint-Stock Company Limited
Rubber plantation Koh Nhek 2011 9,656
Pacific Lotus Joint-Stock Company Limited
Rubber plantation Koh Nhek 2011 9,014
Pacific Pearl Joint-Stock Company Limited
Rubber plantation Koh Nhek 2011 9,614
Pacific Pride Joint-Stock Rubber plantation Koh Nhek 2011 9,773 Seang Long Green Land Investment (Cambodia) Co., Ltd.
Rubber& acacia plantation
Keo Seima & Pechreada
2009 7,000
Sethikula Co., Ltd Rubber plantation Pechreada & Ou Reang
2010 4,273
Sitthi Agriculture Plantation Co., Ltd.
(not listed) Ou Reang 2011 522
Sovann Reachsey Co., Ltd.
Rubber plantation Keo Seima (also Kratie province)
2011 6,525
Unigreen Resource Rubber plantation Koh Nhek 2009 8,000 Villa Development Co., Ltd. (not listed) Pechreada 2011 825
Wuzhishan L.S. Group
Pine plantation & processing factory
Ou Reang & Sen Monorum
2005 10,000
Source:Open Development Cambodia www.opendevelopmentcambodia.net/concessions downloaded 11 November 2012

60
Appendix 2: Known metal mining concessions in Mondulkiri province, as of May 2012
Company Location (district) Year license granted
Area (square kilometers)
Cambodia Hai Lan Mineral Company Limited
Keo Seima 2008 80
Cambodia Tonle Sap International Investment Co., Ltd
Keo Seima 2010 208
Liberty Mining International Pty Ltd
Keo Seima 2010 62
Maxum Metals Pty Ltd Keo Seima, Sen Monorum, Pechreada Ou Reang
2010 2010 2010
295 253 273
Summer Gold Investment Pvt., Ltd
Pechreada 2009 136
Sun Hill Minerals Co., Ltd Pechreada 2009 216 Z. Takry Mining Joint Stock Ltd
Keo Seima 2008 120
Anquing (Cambodia) Invest Company Ltd
Keo Seima 2011 216
ALEX Corporation Pechreada 2009 66 PSM Global Trading Co., Ltd Keo Seima (also Kratie
Province) 2009 191
Oz Minerals (Cambodia) Limited
Keo Seima
2011 2011
191 202
Southern Gold (Cambodia) Ltd Keo Seima
2012 2012
247 241
Gold Metal Group Co., Ltd Pechreada
2011 2011
134 173
General Gold Metal Group Plc. Pechreada 2009 208 Sinh Yi Co., Ltd Keo Seima (also Kratie
Province) 2008 176
Alumina (Cambodia Vietnam) Co., Ltd
Keo Seima, Ou Reang, Sen Monorum, & Pechreada
2009 1,254
Rong Cheng Industrial Investment (Cambodia) Co., Ltd
Keo Seima 2010 28
CIID Erdos Hong Jun Aluminum Industry Co., Ltd
Ou Reang & Sen Monorum 2011 360
POH Resources (Cambodia) Ltd
Koh Nhek & Pechreada
2010 2010
252 252
Bun Long Investment Company Ltd
Koh Nhek (also Steung Treung & Kratie Provinces)
2011 198
Cambodian Yu Fung Corporation (Group) Ltd
Keo Seima 2011 112
Source: Provincial Department of Industry, Mining and Energy, Mondulkiri Province, 22 May 2012. Note: Some concession areas may overlap.

61
Appendix 3: Crops harvested on upland plots in last cultivation season by household, Dak Dam and SraePreah communes, 2003 and 2012
Dak Dam Srae Preah 2003 2012 2003 2012 # % # % # % # % Rice 63 97 65 76 50 68 38 36 Ginger 61 94 64 75 10 14 4 4 Corn 60 92 65 76 51 69 69 65 Chili 60 92 55 65 45 61 68 64 Eggplant 59 91 63 74 47 64 61 58 Bottle gourd 58 89 68 80 10 14 22 21 Katiem 57 88 66 78 1 1 0 --- Lemon grass 56 86 70 82 52 70 74 70 Cucumber 56 86 60 71 31 42 55 52 Cassava 54 83 68 80 24 32 70 66 Pineapple 54 83 61 72 20 27 38 36 Sponge gourd 53 82 61 72 53 72 72 68 Banana 53 82 67 79 45 61 53 50 Taro 49 75 45 53 14 19 26 25 Turmeric 47 72 53 62 40 54 62 58 Papaya 46 71 35 41 37 50 38 36 Sugar cane 46 71 42 49 25 34 6 6 Pumpkin 44 68 56 66 34 46 76 72 Tobacco 38 58 27 32 9 12 14 13 Sringbean 33 51 35 41 9 12 24 23 Sweet Potato 32 49 32 38 10 14 20 19 Wing bean 27 42 44 52 16 22 27 25 Great galangal 24 37 50 59 29 39 65 61 Basil, mint 24 37 15 18 14 19 19 18 Andatchakai 21 32 19 22 3 4 35 33 Jackfruit 16 25 31 36 12 16 37 35 Leaf onion 16 25 11 13 6 8 14 13 Bean (pigeon pea) 14 22 2 2 5 7 4 4 Watermelon 14 22 7 8 1 1 5 5 Mango 12 18 28 33 11 15 49 46 Cashew nut 10 15 9 11 11 15 51 48 Black Sesame 10 15 3 4 4 5 10 9 Wax gourd 8 12 10 12 8 11 11 10 Lemon 8 12 11 13 8 11 21 20 Hyacinth bean 7 11 14 16 1 1 15 14 Coffee 7 11 4 5 0 --- 0 --- Pepper 5 8 5 6 0 --- 0 --- Pamelo 3 5 5 6 2 3 3 3 Local bamboo 3 5 0 --- 1 1 0 --- Coconut 3 5 2 2 1 1 15 14 N=65 N=85 N=74 N=106
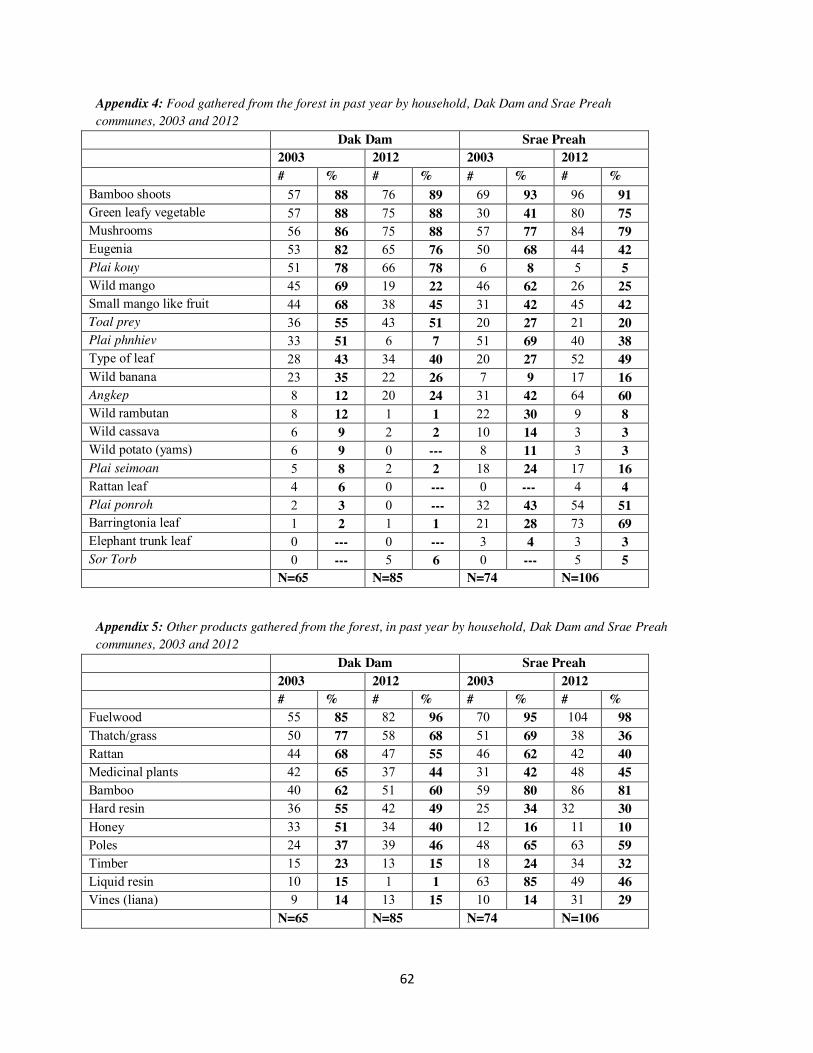
62
Appendix 4: Food gathered from the forest in past year by household, Dak Dam and Srae Preah communes, 2003 and 2012
Dak Dam Srae Preah 2003 2012 2003 2012 # % # % # % # % Bamboo shoots 57 88 76 89 69 93 96 91 Green leafy vegetable 57 88 75 88 30 41 80 75 Mushrooms 56 86 75 88 57 77 84 79 Eugenia 53 82 65 76 50 68 44 42 Plai kouy 51 78 66 78 6 8 5 5 Wild mango 45 69 19 22 46 62 26 25 Small mango like fruit 44 68 38 45 31 42 45 42 Toal prey 36 55 43 51 20 27 21 20 Plai phnhiev 33 51 6 7 51 69 40 38 Type of leaf 28 43 34 40 20 27 52 49 Wild banana 23 35 22 26 7 9 17 16 Angkep 8 12 20 24 31 42 64 60 Wild rambutan 8 12 1 1 22 30 9 8 Wild cassava 6 9 2 2 10 14 3 3 Wild potato (yams) 6 9 0 --- 8 11 3 3 Plai seimoan 5 8 2 2 18 24 17 16 Rattan leaf 4 6 0 --- 0 --- 4 4 Plai ponroh 2 3 0 --- 32 43 54 51 Barringtonia leaf 1 2 1 1 21 28 73 69 Elephant trunk leaf 0 --- 0 --- 3 4 3 3 Sor Torb 0 --- 5 6 0 --- 5 5 N=65 N=85 N=74 N=106
Appendix 5: Other products gathered from the forest, in past year by household, Dak Dam and Srae Preah communes, 2003 and 2012
Dak Dam Srae Preah 2003 2012 2003 2012 # % # % # % # % Fuelwood 55 85 82 96 70 95 104 98 Thatch/grass 50 77 58 68 51 69 38 36 Rattan 44 68 47 55 46 62 42 40 Medicinal plants 42 65 37 44 31 42 48 45 Bamboo 40 62 51 60 59 80 86 81 Hard resin 36 55 42 49 25 34 32 30 Honey 33 51 34 40 12 16 11 10 Poles 24 37 39 46 48 65 63 59 Timber 15 23 13 15 18 24 34 32 Liquid resin 10 15 1 1 63 85 49 46 Vines (liana) 9 14 13 15 10 14 31 29 N=65 N=85 N=74 N=106

63
Appendix 6: Wild game hunted or trapped in past year by household, Dak Dam and Srae Preah communes, 2003 and 2012
Dak Dam Srae Preah 2003 2012 2003 2012 # % # % # % # % Porcupine 39 60 16 19 25 34 18 17 Civet cat 29 45 25 29 13 18 23 22 Mouse deer 28 43 18 21 27 36 47 44 Jungle fowl 27 42 25 29 11 15 20 19 Frog 26 40 23 27 44 59 75 71 Barking deer 26 40 21 25 9 12 25 24 Wildboar/pig 24 37 30 35 9 12 40 38 Monitor lizard 19 29 3 4 33 45 33 31 Hare 19 29 8 9 7 9 10 9 Python /snakes 14 22 0 --- 18 24 9 8 Pangolin 14 22 2 2 8 11 3 3 Bird 14 22 10 12 3 4 7 7 Bintuong 14 22 4 5 0 --- 2 2 Small turtle 13 20 5 6 29 39 25 24 Squirrels 13 20 23 27 9 12 21 20 Monkey 13 20 18 21 5 7 10 9 Rodents 13 20 28 33 5 7 15 14 Otter 11 17 2 2 0 --- 0 --- Sambar deer 8 12 0 --- 2 3 0 --- Hill myna 7 11 1 1 3 4 0 --- Black giant tortoise 6 9 3 4 12 16 13 12 Pheasant 4 6 1 1 0 --- 6 6 Mongoose 4 6 6 7 0 --- 5 5 Banteng 2 3 1 1 1 1 11 10 Black soft shelled turtle 0 --- 2 2 0 --- 9 8 N=65 N=85 N=74 N=106
Appendix 7: Fish caught in past year by household, Dak Dam and Srae Preah communes, 2003 and 2012
Dak Dam Srae Preah 2003 2012 2003 2012 # % # % # % # % Trei Chanva 54 83 45 53 58 78 75 71 Catfish 36 55 32 38 60 81 80 75 Smith barb (whitefish) 27 42 27 32 36 49 30 28 Chevron Snakehead 23 35 6 7 47 64 60 57 Tawes (whitefish) 15 23 25 29 4 5 24 23 Tire track eel 14 22 0 --- 47 64 0 --- Trei Chalang 12 18 6 7 47 64 64 60 Trei Kagnchos 7 11 0 --- 29 39 30 28 Trei Ksa 3 5 0 --- 6 8 0 ---

64
TreiPtourk 3 5 0 --- 0 --- 1 1 TreiKsan 2 3 0 --- 0 --- 1 1 Climbing perch 1 2 2 2 41 55 47 44 Crab 0 --- 14 16 0 --- 28 26 Trey Kching 0 --- 0 --- 0 --- 11 10 Trei Chhlat 0 --- 0 --- 0 --- 6 6 N = 65 N=85 N = 74 N=106
Appendix 8: Goods made and sold in past year by household, Dak Dam and Srae Preah communes, 2003 and 2012
Appendix 9: Goods bought and sold in past year by household, Dak Dam and Srae Preah communes, 2003 and 2012
Dak Dam Srae Preah 2003 2012 2003 2012 # % # % # % # % Livestock (cows, buffaloes, pigs) 5 8 4 5 4 5 1 1
Forest products (resin, honey, etc.) 4 6 4 5 6 8 3 3
Poultry (chickens and ducks) 3 5 4 5 1 1 0 --- Goods from the market 1 2 0 --- 7 9 1 1 Wildlife 1 2 2 2 2 3 0 --- Fish 1 2 1 1 1 1 2 2 Rice wine 0 --- 1 1 1 1 1 1 Rice 0 --- 1 1 0 --- 2 2 Vegetables 0 --- 4 5 0 --- 1 1 N = 65 N=85 N = 74 N=106
Dak Dam Srae Preah 2003 2012 2003 2012 # % # % # % # % Rice wine 15 23 9 11 18 24 14 13 Baskets 15 23 16 19 6 8 5 5 Winnows 7 11 7 8 5 7 7 7 Gourds 7 11 3 4 0 --- 0 --- Fishing implements (bamboo traps, nets, hooks, etc.) 4 6 1 1 1 1 3 3
Mortar and pestle 3 5 1 1 1 1 2 2 Musical instruments 1 2 0 --- 0 --- 0 --- Hunting implements (traps, bow and arrow, etc.)
1 2 0 --- 0 --- 0 ---
N = 65 N=85 N = 74 N=106
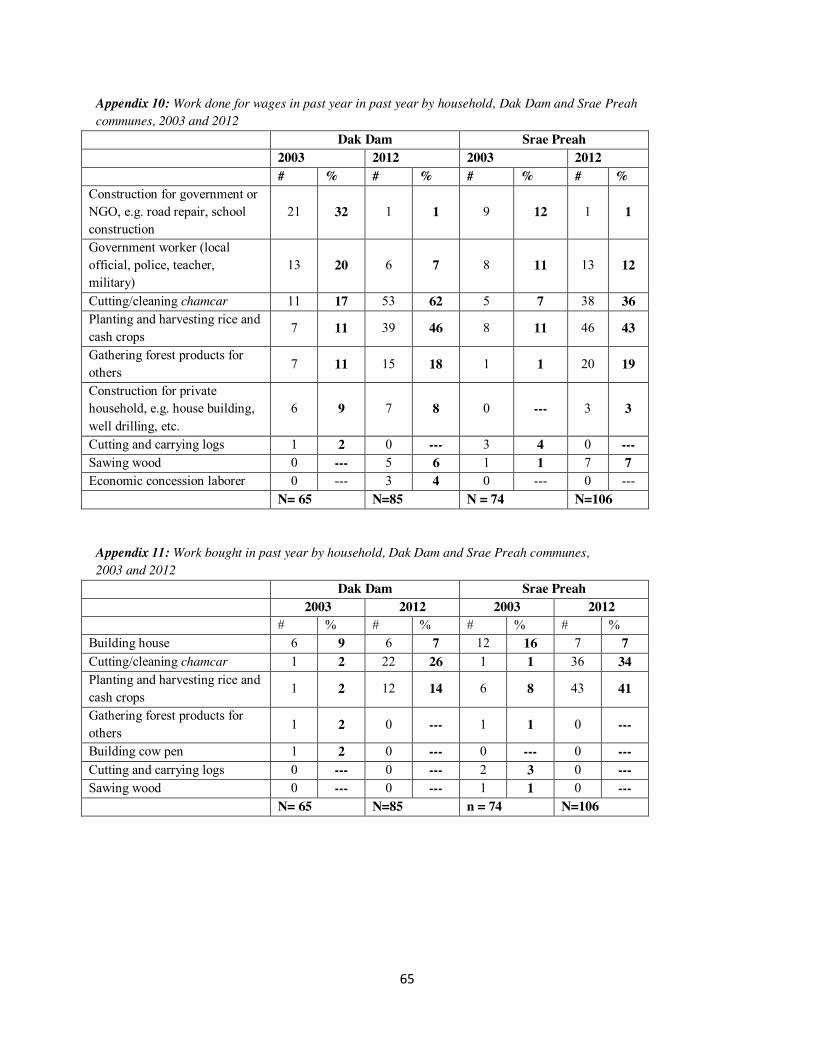
65
Appendix 10: Work done for wages in past year in past year by household, Dak Dam and Srae Preah communes, 2003 and 2012
Dak Dam Srae Preah 2003 2012 2003 2012 # % # % # % # % Construction for government or NGO, e.g. road repair, school construction
21 32 1 1 9 12 1 1
Government worker (local official, police, teacher, military)
13 20 6 7 8 11 13 12
Cutting/cleaning chamcar 11 17 53 62 5 7 38 36 Planting and harvesting rice and cash crops
7 11 39 46 8 11 46 43
Gathering forest products for others 7 11 15 18 1 1 20 19
Construction for private household, e.g. house building, well drilling, etc.
6 9 7 8 0 --- 3 3
Cutting and carrying logs 1 2 0 --- 3 4 0 --- Sawing wood 0 --- 5 6 1 1 7 7 Economic concession laborer 0 --- 3 4 0 --- 0 --- N= 65 N=85 N = 74 N=106
Appendix 11: Work bought in past year by household, Dak Dam and Srae Preah communes, 2003 and 2012
Dak Dam Srae Preah 2003 2012 2003 2012 # % # % # % # % Building house 6 9 6 7 12 16 7 7 Cutting/cleaning chamcar 1 2 22 26 1 1 36 34 Planting and harvesting rice and cash crops
1 2 12 14 6 8 43 41
Gathering forest products for others 1 2 0 --- 1 1 0 ---
Building cow pen 1 2 0 --- 0 --- 0 --- Cutting and carrying logs 0 --- 0 --- 2 3 0 --- Sawing wood 0 --- 0 --- 1 1 0 --- N= 65 N=85 n = 74 N=106
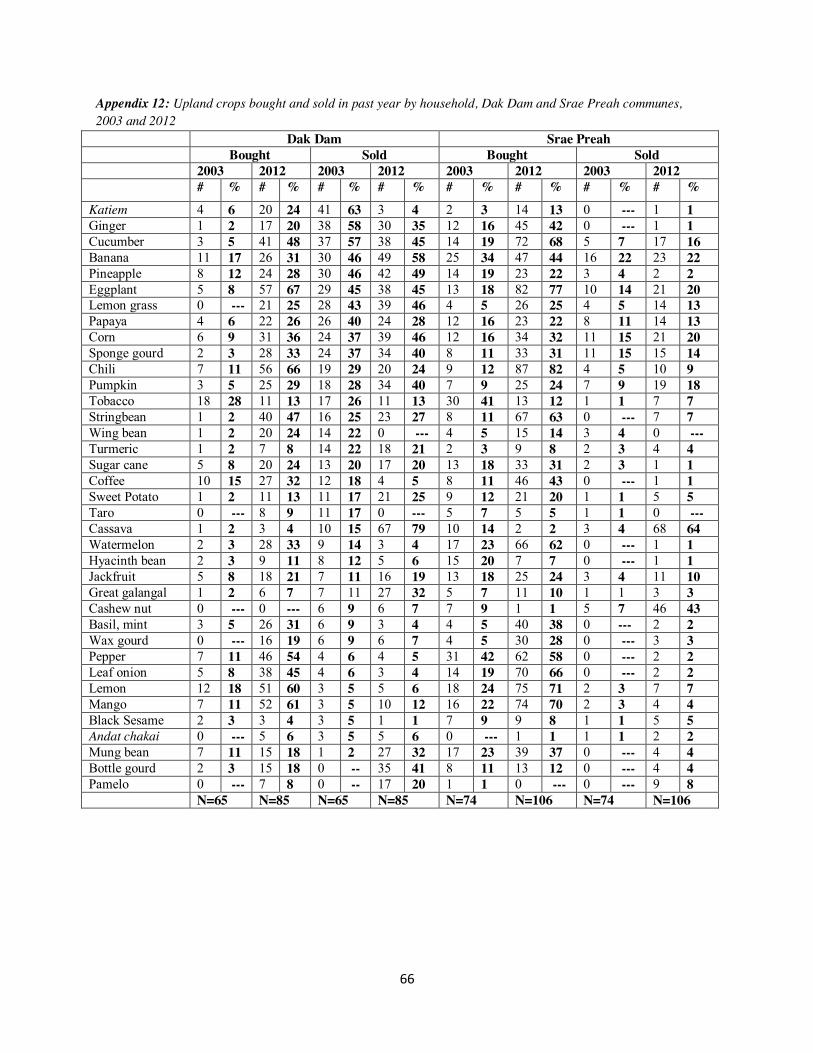
66
Appendix 12: Upland crops bought and sold in past year by household, Dak Dam and Srae Preah communes, 2003 and 2012
Dak Dam Srae Preah Bought Sold Bought Sold 2003 2012 2003 2012 2003 2012 2003 2012 # % # % # % # % # % # % # % # % Katiem 4 6 20 24 41 63 3 4 2 3 14 13 0 --- 1 1 Ginger 1 2 17 20 38 58 30 35 12 16 45 42 0 --- 1 1 Cucumber 3 5 41 48 37 57 38 45 14 19 72 68 5 7 17 16 Banana 11 17 26 31 30 46 49 58 25 34 47 44 16 22 23 22 Pineapple 8 12 24 28 30 46 42 49 14 19 23 22 3 4 2 2 Eggplant 5 8 57 67 29 45 38 45 13 18 82 77 10 14 21 20 Lemon grass 0 --- 21 25 28 43 39 46 4 5 26 25 4 5 14 13 Papaya 4 6 22 26 26 40 24 28 12 16 23 22 8 11 14 13 Corn 6 9 31 36 24 37 39 46 12 16 34 32 11 15 21 20 Sponge gourd 2 3 28 33 24 37 34 40 8 11 33 31 11 15 15 14 Chili 7 11 56 66 19 29 20 24 9 12 87 82 4 5 10 9 Pumpkin 3 5 25 29 18 28 34 40 7 9 25 24 7 9 19 18 Tobacco 18 28 11 13 17 26 11 13 30 41 13 12 1 1 7 7 Stringbean 1 2 40 47 16 25 23 27 8 11 67 63 0 --- 7 7 Wing bean 1 2 20 24 14 22 0 --- 4 5 15 14 3 4 0 --- Turmeric 1 2 7 8 14 22 18 21 2 3 9 8 2 3 4 4 Sugar cane 5 8 20 24 13 20 17 20 13 18 33 31 2 3 1 1 Coffee 10 15 27 32 12 18 4 5 8 11 46 43 0 --- 1 1 Sweet Potato 1 2 11 13 11 17 21 25 9 12 21 20 1 1 5 5 Taro 0 --- 8 9 11 17 0 --- 5 7 5 5 1 1 0 --- Cassava 1 2 3 4 10 15 67 79 10 14 2 2 3 4 68 64 Watermelon 2 3 28 33 9 14 3 4 17 23 66 62 0 --- 1 1 Hyacinth bean 2 3 9 11 8 12 5 6 15 20 7 7 0 --- 1 1 Jackfruit 5 8 18 21 7 11 16 19 13 18 25 24 3 4 11 10 Great galangal 1 2 6 7 7 11 27 32 5 7 11 10 1 1 3 3 Cashew nut 0 --- 0 --- 6 9 6 7 7 9 1 1 5 7 46 43 Basil, mint 3 5 26 31 6 9 3 4 4 5 40 38 0 --- 2 2 Wax gourd 0 --- 16 19 6 9 6 7 4 5 30 28 0 --- 3 3 Pepper 7 11 46 54 4 6 4 5 31 42 62 58 0 --- 2 2 Leaf onion 5 8 38 45 4 6 3 4 14 19 70 66 0 --- 2 2 Lemon 12 18 51 60 3 5 5 6 18 24 75 71 2 3 7 7 Mango 7 11 52 61 3 5 10 12 16 22 74 70 2 3 4 4 Black Sesame 2 3 3 4 3 5 1 1 7 9 9 8 1 1 5 5 Andat chakai 0 --- 5 6 3 5 5 6 0 --- 1 1 1 1 2 2 Mung bean 7 11 15 18 1 2 27 32 17 23 39 37 0 --- 4 4 Bottle gourd 2 3 15 18 0 -- 35 41 8 11 13 12 0 --- 4 4 Pamelo 0 --- 7 8 0 -- 17 20 1 1 0 --- 0 --- 9 8 N=65 N=85 N=65 N=85 N=74 N=106 N=74 N=106
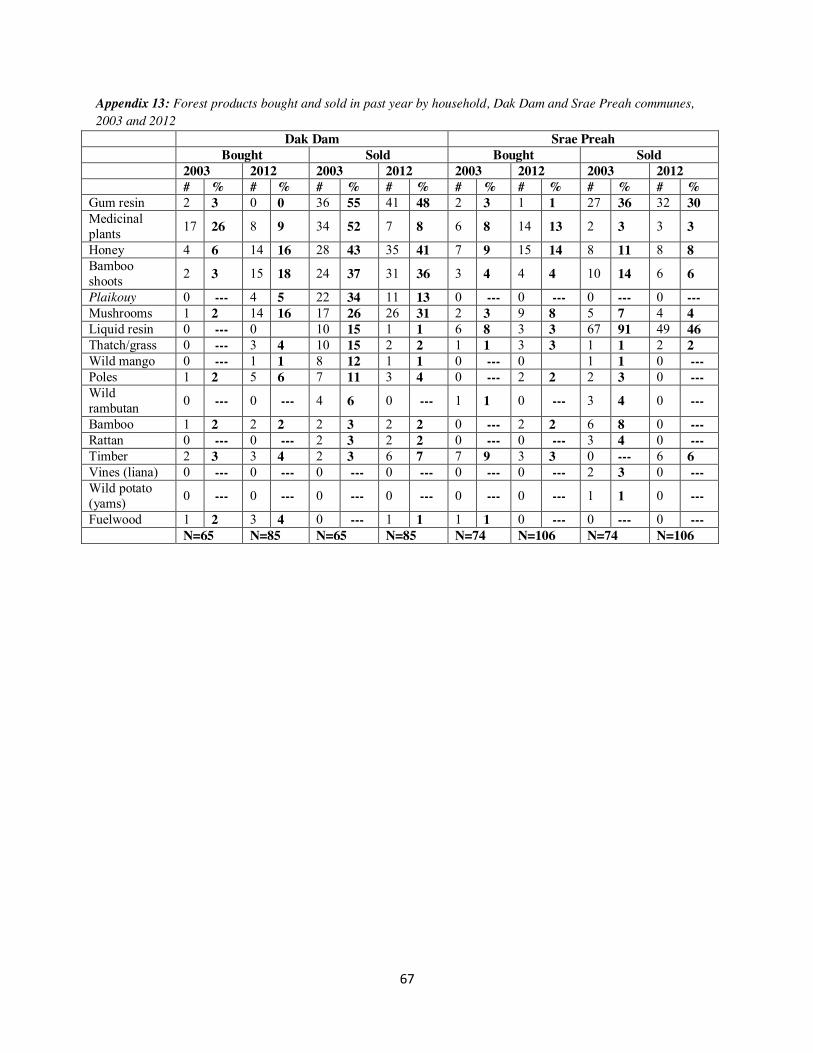
67
Appendix 13: Forest products bought and sold in past year by household, Dak Dam and Srae Preah communes, 2003 and 2012
Dak Dam Srae Preah Bought Sold Bought Sold 2003 2012 2003 2012 2003 2012 2003 2012 # % # % # % # % # % # % # % # % Gum resin 2 3 0 0 36 55 41 48 2 3 1 1 27 36 32 30 Medicinal plants 17 26 8 9 34 52 7 8 6 8 14 13 2 3 3 3
Honey 4 6 14 16 28 43 35 41 7 9 15 14 8 11 8 8 Bamboo shoots 2 3 15 18 24 37 31 36 3 4 4 4 10 14 6 6
Plaikouy 0 --- 4 5 22 34 11 13 0 --- 0 --- 0 --- 0 --- Mushrooms 1 2 14 16 17 26 26 31 2 3 9 8 5 7 4 4 Liquid resin 0 --- 0 10 15 1 1 6 8 3 3 67 91 49 46 Thatch/grass 0 --- 3 4 10 15 2 2 1 1 3 3 1 1 2 2 Wild mango 0 --- 1 1 8 12 1 1 0 --- 0 1 1 0 --- Poles 1 2 5 6 7 11 3 4 0 --- 2 2 2 3 0 --- Wild rambutan 0 --- 0 --- 4 6 0 --- 1 1 0 --- 3 4 0 ---
Bamboo 1 2 2 2 2 3 2 2 0 --- 2 2 6 8 0 --- Rattan 0 --- 0 --- 2 3 2 2 0 --- 0 --- 3 4 0 --- Timber 2 3 3 4 2 3 6 7 7 9 3 3 0 --- 6 6 Vines (liana) 0 --- 0 --- 0 --- 0 --- 0 --- 0 --- 2 3 0 --- Wild potato (yams) 0 --- 0 --- 0 --- 0 --- 0 --- 0 --- 1 1 0 ---
Fuelwood 1 2 3 4 0 --- 1 1 1 1 0 --- 0 --- 0 --- N=65 N=85 N=65 N=85 N=74 N=106 N=74 N=106

68
Appendix 14: Wildlife bought and sold in past year by household, Dak Dam and Srae Preah communes, 2003 and 2012
Dak Dam Srae Preah Bought Sold Bought Sold 2003 2012 2003 2012 2003 2012 2003 2012 # % # % # % # % # % # % # % # % Porcupine 6 9 24 28 25 38 12 14 5 7 10 9 10 14 11 10 Wild pig 16 25 45 53 21 32 26 31 16 22 87 82 4 5 32 30 Barking deer 14 22 37 44 20 31 17 20 12 16 77 73 3 4 17 16 Pangolin 0 --- 0 --- 14 22 1 1 0 --- 0 --- 7 9 3 3 Monitor lizard 2 3 1 1 14 22 2 2 8 11 21 20 16 22 17 16 Jungle fowl 3 5 12 14 14 22 9 11 3 4 5 5 1 1 4 4 Python/snake 0 --- 1 1 13 20 0 --- 2 3 0 --- 14 19 4 4 Mouse deer 5 8 18 21 13 20 4 5 12 16 58 55 6 8 24 23 Binturong 6 9 6 7 10 15 3 4 1 1 1 1 0 --- 0 --- Frog 4 6 9 11 9 14 2 2 7 9 22 21 11 15 27 25 Sambar deer 8 12 19 22 9 14 2 2 7 9 63 59 0 --- 4 4 Otter 1 2 0 --- 7 11 1 1 0 --- 0 --- 0 --- 0 --- Turtles 3 5 1 1 5 8 2 2 3 4 5 5 18 24 13 12 Birds 2 3 2 2 4 6 0 --- 3 4 1 1 2 3 1 1 Monkeys 0 --- 2 2 3 5 2 2 0 --- 1 1 1 1 0 --- Rabbit 5 8 2 2 3 5 1 1 0 --- 0 --- 0 --- 0 --- Myna birds 0 --- 0 --- 3 5 0 --- 0 --- 1 1 0 --- 0 --- Rogni 0 0 --- 2 3 0 --- 0 --- 0 --- 0 --- 0 --- Banteng 2 3 0 --- 1 2 0 --- 4 5 0 --- 1 1 2 2 N=65 N=85 N=65 N=85 N=74 N=106 N=74 N=106