proposed improve steering committee response to comments on the downsizing plan presented to the...
Post on 20-Dec-2015
218 views
TRANSCRIPT

Proposed IMPROVE Steering Committee Response to
Comments on the Downsizing Plan
Presented to the IMPROVE Steering Committee
September 26, 2006

Introduction/Overview• Reason for the plan
– EPA’s FY2007 budget that supports air quality monitoring (including IMPROVE) may be cut by as much as15%
– 15% budget shortfall for the 110 site IMPROVE Network ~ $535,800 ≈ 30% IMPROVE site reduction
• Development of the plan in 3 steps by 3 committees of states, FLM, and EPA representatives – 1. Site-specific information committee – RPO monitoring
representatives – work completed in June– 2. Plan development/implementation committee – State &
FLM representatives – work completed in July– 3. Plan review committee – IMPROVE Steering Committee
– public review completed in August, response to review drafted for IMPROVE S.C. consideration in September

Overview of Step 2 Plan Approach -Principles-
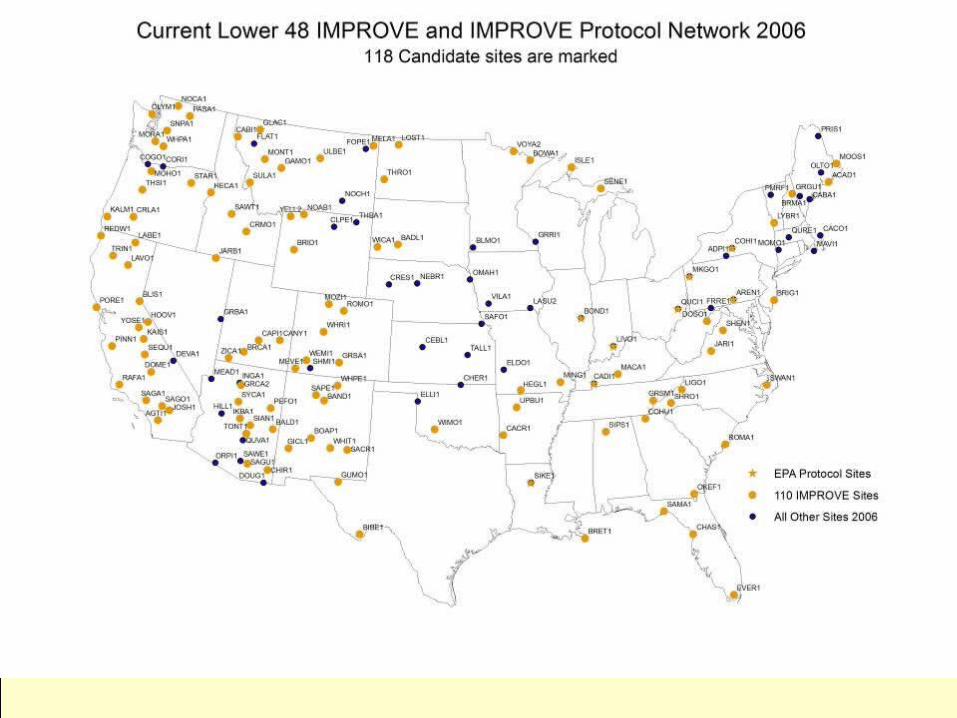
• Only the 118 IMPROVE and EPA Protocol sites are eligible for decommissioning
• All visibility-protected class I areas need to have representative monitoring
• Data redundancy is the primary characteristic for selecting sites for decommissioning
• The priority-ordered list should be generated by a data/information-driven process (i.e. a set of rules) uniformly applied to all eligible sites

Plan Approach -Process-
• Step 1 – Identification of data redundant site-groups or regions (candidates)– Data from all IMPROVE & Protocol sites’ are included
in the assessment, but only 118 site are possible candidates
– Nitrate concentration selected as the parameter to test for data redundancy though many were considered
– Correlation between site-measured and neighboring-sites predicted nitrate values selected as the redundancy metric
– Candidate sites with high redundancy metric values were identified and became the nuclei for groups of redundant sites
– Groupings were refined by comparisons to sulfate and nitrate EOF analysis site groupings

Component Fractional Error Contour Maps
Sulfate fractional error map
• Low fractional errors (FE<0.4) over most of the country
• Many sites are redundant if sulfate is the only concern
Nitrate fractional error map
• Low fractional errors (FE<0.4) in several small regions and in the center of the country
• Most regions have sites that are more unique with respect to nitrates

Organic fractional error map
• Low fractional errors (FE<0.4) over much of the center and eastern U.S. and in southern AZ
• Some regions in the west are highly unique (smoke impact areas?), while other regions are less unique (secondary biogenic impacts?)
Elemental Carbon fractional error map
• Low fractional errors (FE<0.4) over much of the center and eastern U.S.
• Compared to the organic map, the west has larger regions of uniqueness (maybe because there is no secondary elemental carbon)
Component Fractional Error Contour Maps

Component Fractional Error Contour Maps
Fine Soil fractional error map
• Low fractional errors (FE<0.4) over the center of the country and a few small regions
Coarse Mass fractional error map
• Low fractional errors (FE<0.4) in a few small regions in the center of the country and northeast
• As would be expected with coarse mass, many of the site’s data are unique

Composite Parameter Fractional Error Contour Maps
Site-maximum component fractional error map
• This map treats each component equally by displaying the components largest fractional error
• Shows the center of the country, regions in the northeast, AZ and MT as having redundant sites
Aerosol extinction fractional error map (note the different scale)
• This map weights the components by their contribution to light extinction
• Because haze is dominated in the east by sulfate, which is the most spatially uniform component, more of the eastern sites are redundant
• Also show parts of AZ & MT as having redundant sites

Correlation of Estimated and Measured Concentrations
NO3 Sulfur
ECNote that the color shades are opposite to those for relative error maps in the earlier slides, because a high degree of data redundancy corresponds to high correlation coefficient values and to low relative error values.

Site Selection Decommissioning Regions

First Two Sites Selected Not Using the Process
• Two sites were pre-selected outside of the process, but are included on the priority list– Hawaii Volcano National Park IMPROVE site
will be mothballed until sulfate from the erupting volcano no-longer dominates its worst haze days
– Connecticut Hill EPA Protocol site in NY will be shut down this year as redundant with Addison Pinnacles state-Protocol site located about 30 miles away

Step 2 Plan Approach-Process-
• Step 2 – Priority site selection among the candidate sites in each group– Site-Specific Redundancy Metric
• Highest of the correlation coefficient (r value) between the nitrate data from a site and that of other sites in each region
• Was used to prioritize the regions– Redundancy Metric Adjustments
• Reduce the metric by 0.2 for sites with 15 years or more of data and 0.1 for site with 10 years or more of data (to give sites with long data records some protection against being shut down)
• Reduce the metric for the non-selected sites in a region by 0.1 for each time a site is selected from the region (prevents the same region from having two or more sites sequentially listed)
– Process Steps• Selection is based on the adjusted metric among all candidate sites • In case of identical metrics for two eligible sites in a region (rare), other
factors (e.g. collocated measurements) are used to pick the less important of the two site for listing
• With each selection, the potentially orphaned class I areas are typically assigned to the monitoring site in the region with the highest nitrate correlation to the selected site, after which the caretaker site is ineligible for future selection


Summary Description of Step 2 Results
Current Network Sites Listed Remaining Sites
RPO CIA IMPROVE Sites Sites/CIA Protocol IMPROVE Sites IMPROVE Sites Sites/CIA
WRAP 117 77 66% 0 21 56 48%
CENRAP 10 10 100% 0 3 7 70%
MRPO 2 2 100% 2 1 1 50%
VISTAS 18 15 83% 1 4 11 61%
MANE-VU 8 6 75% 1 2 4 50%
Total 155 110 71% 4 31 79 51%
Current Listed Fraction
FS 48 19 40%
FWS 18 4 22%
NPS 44 8 18%
EPA 8 4 50%
Total 118 35 30%
Table 1. Numbers of class I areas (CIA) and sites and ratios of IMPROVE sites to CIAs currently, listed for removal, and remaining by Regional Planning Organization (RPO). Also shown is the number of EPA Protocol sites listed by RPO.
Table 2. Number of sites currently, listed for removal, and the fraction of sites listed for removal by federal agency.

Rank Site ID Site Name State Site Type Affiliation
1 COHI1 Connecticut Hill NY PROTOCOL EPA
2 HAVO1 Hawaii Volcanoes HI IMPROVE NPS
3 MELA1 Medicine Lake MT IMPROVE FWS
4 HEGL1 Hercules-Glades MO IMPROVE FS
5 SAGU1 Saguaro AZ IMPROVE NPS
6 ISLE1 Isle Royale MI IMPROVE NPS
7 GRGU1 Great Gulf NH IMPROVE FS
8 LIVO1 Livonia IN PROTOCOL EPA
9 COHU1 Cohutta GA IMPROVE FS
10 SYCA1 Sycamore Canyon AZ IMPROVE FS
11 SAMA1 St. Marks FL IMPROVE FWS
12 CACR1 Caney Creek AR IMPROVE FS
13 ZICA1 Zion Canyon UT IMPROVE NPS
14 VOYA2 Voyageurs MN IMPROVE NPS
15 LOST1 Lostwood ND IMPROVE FWS
16 KAIS1 Kaiser CA IMPROVE FS
17 WICA1 Wind Cave SD IMPROVE NPS
18 HECA1 Hells Canyon OR IMPROVE FS
Rank Site ID Site Name State Site Type Affiliation
19 SAPE1 San Pedro Parks NM IMPROVE FS
20 QUCI1 Quaker City OH PROTOCOL EPA
21 WHPA1 White Pass WA IMPROVE FS
22 WHRI1 White River CO IMPROVE FS
23 TRIN1 Trinity CA IMPROVE FS
24 MOOS1 Moosehorn ME IMPROVE FWS
25 SIAN1 Sierra Ancha AZ IMPROVE FS
26 CADI1 Cadiz KY PROTOCOL EPA
27 BLIS1 Bliss CA IMPROVE FS
28 NOAB1 North Absaroka WY IMPROVE FS
29 SAGA1 San Gabriel CA IMPROVE FS
30 CAPI1 Capitol Reef UT IMPROVE NPS
31 KALM1 Kalmiopsis OR IMPROVE FS
32 MOHO1 Mount Hood OR IMPROVE FS
33 LIGO1 Linville Gorge NC IMPROVE FS
34 DOSO1 Dolly Sods WV IMPROVE FS
35 LABE1 Lava Beds CA IMPROVE NPS
Step 2 Priority Order List of IMPROVE and EPA Protocol Site for Decommissioning


Rank SiteID Class I Area #1Alternate Site to Represent Class I Area #1 - Site Code Class I Area #2
Alternate Site to Represent Class I Area #2 - Site Code
Class I Area #3
Alternate Site to Represent Class I Area #3 - Site Code
1 COHI1 ADPI1
2 HAVO1 Hawaii Volcanoes HALE1
3 MELA1 Medicine Lake FOPE1
4 HEGL1 Hercules-Glades UPBU1
5 SAGU1 Saguaro SAWE1
6 ISLE1 Isle Royale SENE1
7 GRGU1 Great Gulf BRMA1 Presidential Range - Dry River BRMA1
8 LIVO1 MACA1
9 COHU1 Cohutta GRSM1
10 SYCA1 Sycamore Canyon GRCA2
11 SAMA1 St. Marks OKEF1
12 CACR1 Caney Creek UPBU1
13 ZICA1 Zion BRCA1
14 VOYA2 Voyageurs BOWA1
15 LOST1 Lostwood FOPE1
16 KAIS1 Kaiser YOSE1 Ansel Adams HOOV1 John Muir SEQU1
17 WICA1 Wind Cave BADL1
18 HECA1 Hells Canyon STAR1
19 SAPE1 San Pedro Parks BAND1
20 QUCI1 DOSO1
21 WHPA1 Goat Rocks MORA1 Mount Adams MORA1
22 WHRI Maroon Bells Snowmass MOZI1 Eagle's Nest MOZI1 West Elk WEMI1
23 TRIN1 Marble Mountain REDW1 Yolla Bolly - Middle Eel LAVO1
24 MOOS1 Moosehorn ACAD1 Roosevelt Campobello ACAD1
25 SIAN1 Sierra Ancha TONT1
26 CADI1 MACA1
27 BLIS1 Desolation HOOV1
28 NOAB1 North Absaroka YELL2 Washakie YELL2
29 SAGA1 San Gabriel SAGO1 Cucamonga SAGO1
30 CAPI1 Capitol Reef CANY
31 KALM1 Kalmiopsis REDW1
32 MOHO1 Mount Hood THSI1
33 LIGO1 Linville Gorge SHRO1
34 DOSO1 Dolly Sods FRRE1 Otter Creek
35 LABE1 Lava Beds LAVO1 South Warner LAVO1
State/Tribal Protocol Sites are Highlighted Yellow
Step 2 Reassignment of class I areas to “Caretaker” monitoring sites

Public Review of the Step 2 Plan
• Plan methodology and results were widely distributed to states, RPOs, FLMs, EPA, and others in mid-July
• Comments were receive during a nominal one month comment period (July 15th to August 15th)
• Comments were organized by region, compiled, summarized and became the basis of the proposed IMPROVE Steering Committee response and step 3 plan for IMPROVE downsizing in response to reduced budget

Step 3Overview of Comments
• General comments received from 18 states, 5 RPOs, 4 EPA Regions, numerous FLMs
– its premature (with regard to the RHR process) to shut down any of the 110 sites – SIPs not yet complete; need to ensure progress by trends tracking; some sites with only a few complete years of data; don’t know the fate of other protocol sites that would be caretakers
– reducing the number of sites effectively diminishes the number of visibility-protected areas since the RHR uses monitoring data to define the pace of progress and document its performance
– IMPROVE Steering Committee is not the appropriate body to make decisions since they can’t balance it against other air program needs
– other approaches to reduce cost should be considered, instead of shutting down sites
– the methodology of using current data to make decisions about redundancy is flawed for a 60-year trends program where emissions will undoubtedly change significantly
– concerns that depending on a state or tribal protocol site for RHR tracking is vulnerable to changing priorities of the sponsor
– No written comments were received supporting the reduction of IMPROVE monitoring network

Site-Specific Comment
• Principally indicated why we shouldn’t shut down specific sites
– helpful in fine-tuning the list of sites– provide information for identifying class I
areas that would lack representative monitoring if certain sites are shut down
– Summarized by site in a spreadsheet (CommentsCompiledBySite.xls)
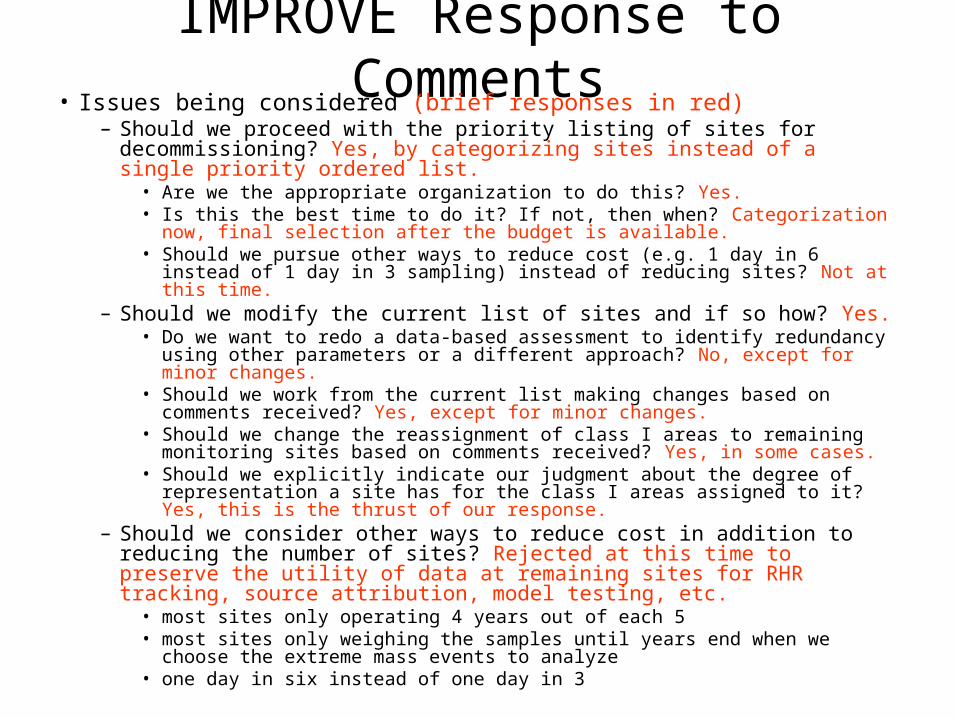
IMPROVE Response to Comments• Issues being considered (brief responses in red)
– Should we proceed with the priority listing of sites for decommissioning? Yes, by categorizing sites instead of a single priority ordered list.
• Are we the appropriate organization to do this? Yes.• Is this the best time to do it? If not, then when? Categorization now, final
selection after the budget is available.• Should we pursue other ways to reduce cost (e.g. 1 day in 6 instead of 1 day
in 3 sampling) instead of reducing sites? Not at this time.– Should we modify the current list of sites and if so how? Yes.
• Do we want to redo a data-based assessment to identify redundancy using other parameters or a different approach? No, except for minor changes.
• Should we work from the current list making changes based on comments received? Yes, except for minor changes.
• Should we change the reassignment of class I areas to remaining monitoring sites based on comments received? Yes, in some cases.
• Should we explicitly indicate our judgment about the degree of representation a site has for the class I areas assigned to it? Yes, this is the thrust of our response.
– Should we consider other ways to reduce cost in addition to reducing the number of sites? Rejected at this time to preserve the utility of data at remaining sites for RHR tracking, source attribution, model testing, etc.
• most sites only operating 4 years out of each 5• most sites only weighing the samples until years end when we choose the
extreme mass events to analyze• one day in six instead of one day in 3
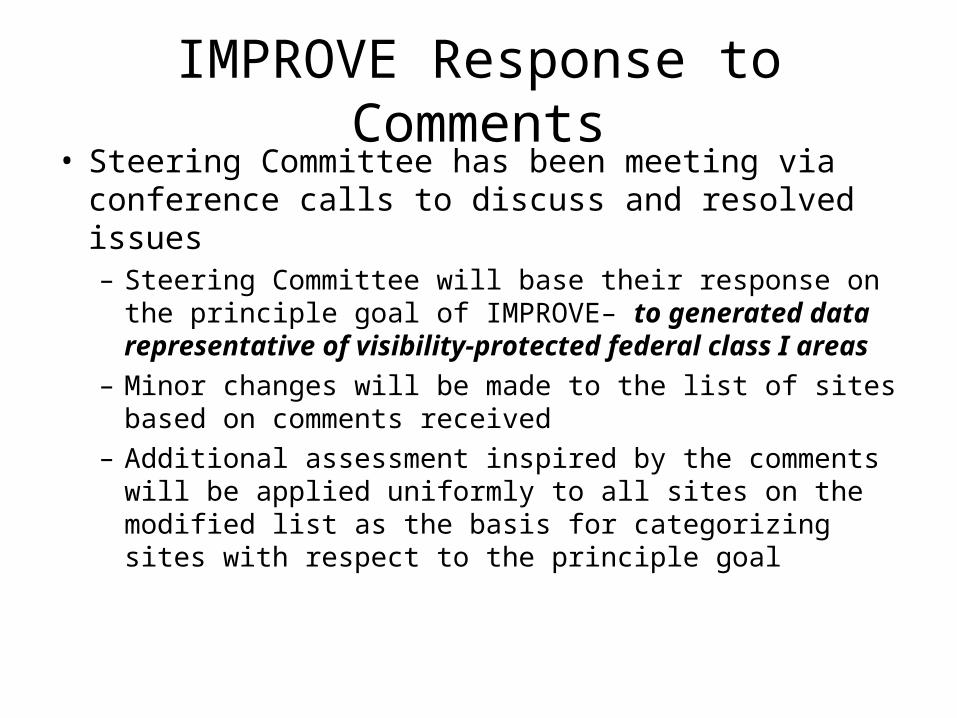
IMPROVE Response to Comments• Steering Committee has been meeting via
conference calls to discuss and resolved issues– Steering Committee will base their response on the
principle goal of IMPROVE– to generated data representative of visibility-protected federal class I areas
– Minor changes will be made to the list of sites based on comments received
– Additional assessment inspired by the comments will be applied uniformly to all sites on the modified list as the basis for categorizing sites with respect to the principle goal

Minor Modification to the List
• Bliss site will be replaced by the Hoover site at the suggestion of California and others
• Protocol sites will not be counted upon for long-term operations so won’t be used as caretaker sites as suggested by many in comments – there were 4 such sites and this does remove a few sites from the list
• All 8 EPA Protocol sites are included (only 4 were on the original list) since none of them are representative of class I areas

Site Categories
• Non-Class I Area Sites – Sites that don't represent class I areas (i.e. the 8 EPA CASTNET sites);
• Replaceable Sites – Sites that if removed would have all of its class I areas monitored by the remaining IMPROVE sites;
• Non-Replaceable Sites – Sites that if removed leave one or more class I areas without representative monitoring; and
• Conditional Sites – Sites where the data sets are too short (1 year or less) to draw reliable conclusions.

Additional Assessments• Used to categorize sites (failure of any test
places a site in the non-replaceable category)– 1. Mean best & worst day total light extinction and
extinction budgets– 2. Seasonality of best & worst day light extinction
budgets– 3. Annual trends of best & worst day light extinction
• Used to help select sites within categories (only after the funding is known)– Number & magnitude of assessment failures (above) – Number of non-represented class I areas – Back-trajectory source areas for worst day light
extinction– Sensitivity to additional particulate concentration– Other factors and consultations

Extinction/Extinction Budget Tests
• Test 1a – largest change in annual mean aerosol light extinction due to the between sites’ difference in one species should not exceed 25% of the aerosol extinction on either hazy or clear days
• Test 1b – change in total annual mean aerosol light extinction between the two sites should not exceed 50% on hazy days

Example of the Aerosol Extinction Budget Test
14.0Mm-1 92.2Mm-1
3.7Mm-1 38.0Mm-1
This site pair fails both test 1a and 1b with values of 98% and -143% respectively. However because there is only one common year of data it will be classified as conditional.
Worst day nitrate caused the failure of test 1a

Example of the Aerosol Extinction Budget Test
22.5Mm-1
19.6Mm-1
4.2Mm-1
3.1Mm-1
This site pair passes both test 1a and 1b with values of 7% and -38% respectively based on 4 years of common complete data.

Seasonality Test
• Test 2a – Monthly frequencies of the haziest days should have an R2 value greater than 0.5 (i.e. variance explained > 50%)
• Test 2b – Monthly frequencies of the clearest days should have an R2 value greater than 0.5 (i.e. variance explained > 50%)

• The cumulative number of worst days in each month (for paired complete years of data) are shown for the paired sites in the plots
• Correlation analysis is done and the test requires R2 > 0.5 for replaceable sites
• Of these examples only SIAN and TONT fail with R2 = 0.40; the frequency of hazy days increases through the fall months at TONT, but decreases for SIAN
R2 = 0.95
R2 = 0.70
R2 = 0.40
Example of the Seasonal Test

Annual Trends Test
• Test 3a – Differences between the two sites’ annual trends should be less than 1 deciview for clear days
• Test 3b – Differences between the two sites’ annual trends should be less than 1 deciview for hazy days

site Year aerosol_bext dv
ADPI1 2002 185.92 29.04
ADPI1 2003 168.76 28.18
ADPI1 2004 159.49 27.67
COHI1 2002 183.16 28.79
COHI1 2003 152.2 27.43
COHI1 2004 148.14 27.17
dv trend ADPI
dv trend COHI
delta trend
-0.86 -1.36 0.50
-0.51 -0.26 -0.25
Worst Day Trends for Addison Pinnacles & Connecticut Hills

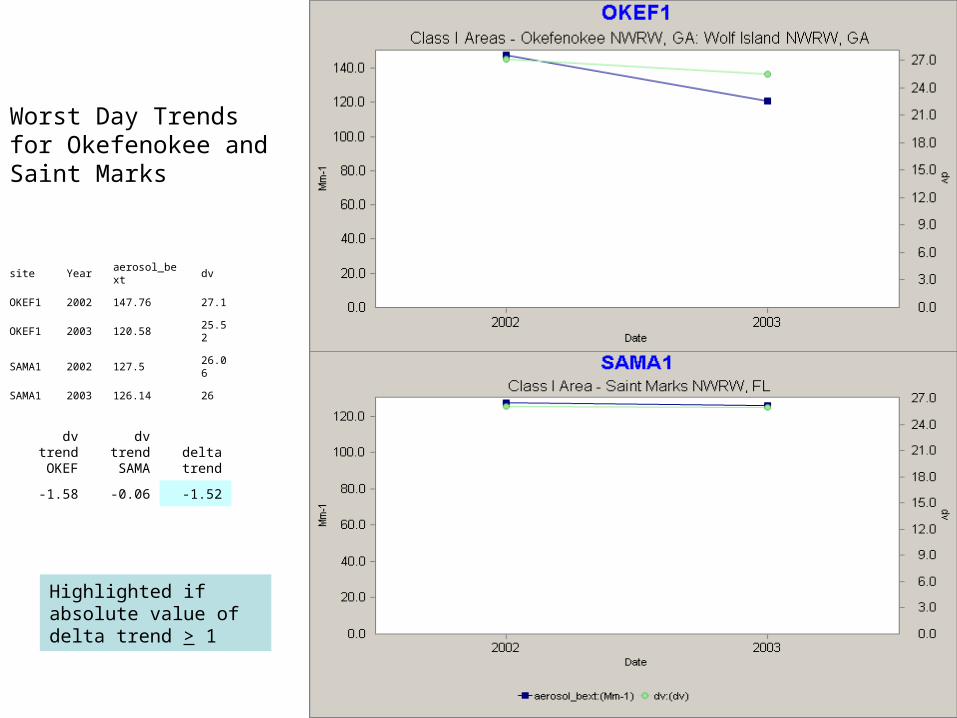
site Year aerosol_bext dv
OKEF1 2002 147.76 27.1
OKEF1 2003 120.58 25.52
SAMA1 2002 127.5 26.06
SAMA1 2003 126.14 26
dv trendOKEF
dv trend SAMA
delta trend
-1.58 -0.06 -1.52
Highlighted if absolute value of delta trend > 1
Worst Day Trends for Okefenokee and Saint Marks


site Year aerosol_bext dv
BADL1 2000 52.49 18.14
BADL1 2001 48.32 17.63
BADL1 2002 40.28 16.18
BADL1 2003 50.53 17.81
BADL1 2004 39.25 15.94
WICA1 2000 41.94 16.07
WICA1 2001 38.09 15.33
WICA1 2002 45.29 16.57
WICA1 2003 41.05 16.12
WICA1 2004 37.32 15.11
dv trend BADL
dv trend WICA
delta trend
-0.51 -0.74 0.23
-1.45 1.24 -2.69
1.63 -0.45 2.08
-1.87 -1.01 -0.86
Worst Day Tends for Badlands and Wind Caves


Example Section of the Results Worksheet Summarizing the Replaceability Test Results
Candidate Site for Removal
Replacement Site
Number of Valid Years
Clear & Hazy Extinction Budget Difference Test 1a
Percent Difference in Hazy Aerosol Extinction Test 1b
Seasonal Hazy R-Squared Test 2a
Seasonal Clear R-Squared Test 2b
Annual Clear Day Trend Difference Test 3a
Annual Hazy Day Trend Difference Test 3b
< 2 is automatic "Conditional"
> 25% is Not Representative
> 50% is Not Representati
ve
< .50 is Not Representative
< .50 is Not Representative
>1 is Not Representative
>1 is Not Representative Status
COHI1 ADPI1 3 6% -5% 0.91 0.75 -0.5 0.7 Pass
SYCA1 GRCA2 3 14% 33% 0.71 0.77 1.1 0.7 Fail Test 3a
SAMA1 OKEF1 2 4% 0% 0.35 0.17 -1.0 -1.2 Fail Test 2a
ZICA1 BRCA1 1 9% 3% 0.06 0.67 Conditional
KAIS1 YOSE1 2 30% -29% 0.66 0.82 0.1 1.7 Fail Test 1a
KAIS1 HOOV1 2 15% 25% 0.94 0.96 0.2 0.0 Pass
KAIS1 SEQU1 1 98% -143% 0.03 0.82 Conditional
HOOV1 BLIS1 2 11% 6% 0.63 0.73 0.6 1.3 Fail Test 3b
WICA1 BADL1 5 14% -15% 0.77 0.92 -0.9 -2.3 Fail Test 3b
HECA1 STAR1 3 16% 2% 0.92 0.21 1.1 2.0 Fail Test 2b
SAPE1 BAND1 4 6% -15% 0.48 0.56 0.9 -0.8 Fail Test 1b
QUCI1 DOSO1 3 4% 9% 0.85 0.62 0.4 1.4 Fail Test 3b
WHPA1 MORA1 3 55% -100% 0.73 0.80 -0.9 -0.7 Fail Test 1a
WHRI1 MOZI1 4 7% -14% 0.71 0.90 -0.8 0.6 Pass
WHRI1 WEMI1 4 2% -5% 0.89 0.70 0.4 2.7 Fail Test 3b
HAVO1 HALE1 4 60% 52% 0.22 0.01 0.7 -1.6 Fail Test 1a
TRIN1 REDW1 3 29% 11% 0.39 0.59 0.4 1.8 Fail Test 1a

AREN1 Arendtsville PA EPA
BOND1 Bondville IL EPA
CADI1 Cadiz KY EPA
COHI1 Connecticut Hill NY EPA
LIVO1 Livonia IN EPA
MKGO1 MK Goddard PA EPA
QUCI1 Quaker City OH EPA
SIKE1 Sikes LA EPA
CACR1 Caney Creek AR FS UPBU1
COHU1 Cohutta GA FS GRSM1
VOYA2 Voyageurs MN NPS BOWA1
CAPI1 Capitol Reef UT NPS CANY1
DOSO1 Dolly Sods WV FS SHEN1
GRGU1 Great Gulf NH FS LYBR1
HAVO1 Hawaii Volcanoes HI NPS HALE1
HECA1 Hells Canyon OR FS STAR1
HEGL1 Hercules-Glades MO FS UPBU1
HOOV1 Hoover CA FS BLIS1
ISLE1 Isle Royale MI NPS SENE1
KALM1 Kalmiopsis OR FS REDW1
LABE1 Lava Beds CA NPS LAVO1
LIGO1 Linville Gorge NC FS SHRO1
MELA1 Medicine Lake MT FWS LOST1
MOHO1 Mount Hood OR FS THSI1
MOOS1 Moosehorn ME FWS ACAD1
NOAB1 North Absaroka WY FS YELL2
SAGA1 San Gabriel CA FS SAGO1
SAMA1 St. Marks FL FWS OKEF1
SAPE1 San Pedro Parks NM FS BAND1
SIAN1 Sierra Ancha AZ FS TONT1
SYCA1 Sycamore Canyon AZ FS GRCA1
THRO1 Theodore Roosevelt ND NPS LOST1
TRIN1 Trinity CA FS REDW1/LAVO1
WHPA1 White Pass NM FS MORA1
WHRI1 White River CO FS MOZI1/WEMI1
WICA1 Wind Cave SD NPS BADL1
KAIS1 Kaiser CA FS YOSE1/SEQU1/HOOV1
ZICA1Zion Canyon UT NPS BRCA1
Not Representative of class I areas (8)
Replaceable Sites (3)
Conditional Sites (2)
Non-Replaceable Sites (25)
DRAFT Categorization of the Sites for Submission/Approval of IMPROVE Steering Committee

Other Considerations
• Sites within each categories will be listed alphabetically, not by priority
• IMPROVE’s interest is in maintaining as much representative monitoring of class I areas as possible so Non-Class I Area and Replaceable Site Categories are lower priority than Conditional and Non-Replaceable Site Categories
• Specific site recommendations will be made in consultation with state, FLMs, RPOs, & EPA only after the budget is determined
• Our goal is to submit the four site category lists and documentation of the process prior to the IMPROVE Steering Committee meeting (Sept 26 – 28, 2006)

Additional Analysis
Will be helpful in selecting sites from the non-replaceable category
if required

Back Trajectory Test:
Are similar locations upwind of target and replacement sites on
haziest 20% Days?
Use CATT tool (http://datafedwiki.wustl.edu/index.php/CATT) to Calculate “Weighted Hazy Day Upwind Probability Fields” for worst 20% DV days For years 2000-2004 (or longest period of common sampling at paired sites).
4/day ATAD back trajectory endpoints aggregated in 1x1 degree grid cells, endpoint counts weighted by haziness in DV and converted to probability by dividing by total in all grid cells.
Test Metric is correlation (R2) of gridded probability values at paired sites, Excluding (very high) values in receptor grid squares and excluding (large numbers of) zeros (typically about half of the 2400 grid cells have no trajectories).


Start at: http://datafed.net/ . Select “ViewEdit” on left; pull-down “File”, “Open Page”; Select “CATT”, “RichP”, “IMPhiDVprob.page” (or for incremental probability by Mark Green Method, select “IMP_IP_MGM.page”). Change sites using pull-down “Location” menu.
To export gridded results, select “Service Program”, “Evaluate”, “Service Output” and “Session Export”.
Correlation of Paired Sites Hazy Day Upwind Probability Values, 2000-2004 (or less)

Deciview sensitivity to an increase of 1 µg/m3 of inorganic material on the best 20% haze days.

Deciview sensitivity to an increase of 1 µg/m3 of inorganic material on the worst 20% haze days.

Budget Summary Information

IMPROVE and Protocol Monitoring Network 2006 Funding Estimates
Type #Sect 103
Sect 105
FLM1 Total
IMPROVE 110 $2,340k $1,232k ~$800k $4,371k
State 28 $966k $0 $0 $966k
CASTNET2 7 $241k $0 $0 $241k
Urban Collocated2 5 $172 $0 $0 $172k
Tribal2 9 ? ? $0 $315k
FLM 9 $0 $0 ~$382k $382k
Total 168 $3,719k $1,232k $1,182k $6,447k
1. FLMs pay site operators at all IMPROVE sites, and both the operators and their sites’ contractor costs for all FLM Protocol sites.
2. CASTNET, Urban Collocated, and Tribal costs don’t include site operators’ costs.

Budget Assessment
• IMPROVE network budget consists of – Site-specific cost ~$2,200/site/year– Sample-specific cost ~$13,300/site/year
(~$9,800 is for sample composition analysis)– Network-wide cost ~$18,500/site/year for the
current network (175 sites). For the purpose of this assessment these cost will be held constant. [Network-wide cost cover quality assurance, data processing, methods and procedures evaluation and refinement, communications, etc.]

Summary/comparison of cost savings and cost per site are shown using three IMPROVE Network budget reduction approaches.