proposal for calculating cumulative salvage index values...
TRANSCRIPT
1
Proposal for Calculating Cumulative Salvage Index Values Used For Estimating Take Likely to Occur under the USFWS Old and Middle River Flow RPA for Adult Delta Smelt Metropolitan Water District September, 19 2014 Draft Purpose The objectives of this paper are to provide a rationale why the United States Fish and Wildlife Service (USFWS) Incidental Take Statement should include more years in its calculation of anticipated incidental take of adult delta smelt under the 2008 Biological Opinion with the Reasonable and Prudent Alternative (RPA) action to avoid jeopardy to the species and adverse modification of critical habitat and provide a statistical method by which this can be achieved. Background In their 2008 Biological Opinion, the U.S. Fish and Wildlife Service (USFWS) determined that the coordinated operations of the State Water Project (SWP) and Central Valley Project (CVP) would likely jeopardize the continued existence of delta smelt (Hypomesus transpacificus) and result in adverse modification of critical habitat. In concordance with the jeopardy determination, the USFWS developed a Reasonable and Prudent Alternative (RPA) to avoid the likelihood of jeopardizing the continued existence of the species and the destruction or adverse modification of critical habitat. Components 1 and 2 of the RPA require reduced exports, as indexed by Old and Middle River flows (OMR), when entrainment risk of delta smelt increases. Entrainment risk is assessed on a weekly basis by the Smelt Working Group (SWG). The SWG consists of representatives from the USFWS, California Department of Fish and Wildlife, California Department of Water Resources, and the U.S. Bureau of Reclamation. TheSWG evaluates multiple real-time metrics such as: physical data, river inflows, exports, and smelt distribution in order to provide an OMR recommendation to USFWS for consideration when implementing the RPA. OMR recommendations can range from -1250 cfs to -5000 cfs, and OMR cannot go more negative than -5000 cfs once component 1 of the RPA is triggered. The Biological Opinion contains an Incidental Take Statement (ITS) which determines the amount of annual adult and juvenile delta smelt incidental take anticipated under the operations of the SWP and CVP with the implementation of the RPA. Salvage1 is a quantifiable form of take of individuals and is used in both calculating and measuring the annual Incidental Take Limit (ITL). If the take exceeds the ITS, US Bureau of Reclamation (Reclamation) and Department of Water Resources (DWR) must reinitiate with the USFWS to determine appropriate measures for protecting smelt while operating the projects . The ITS for adult delta smelt was developed with the objective of estimating the amount of take expected for the RPA action under Component 12. Through an examination of historical salvage trends, the USFWS selected a subset of years (2006, 2007, 2008) as the basis for what should be expected under the RPA using the cumulative salvage index approach (CSI; see below for details). These years were selected because they represented years when OMR flows were similar to the RPA threshold (-5000 cfs) and the population abundance index was similar to levels observed in the post- Pelagic Organism Decline era (Sommer et al. 2007). Since the Biological Opinion was released, new investigations, statistical models, and information have tremendously improved both the knowledge of factors that affect entrainment and increased predictability of adult delta smelt salvage patterns (timing
1 Salvage represents the total number of fish collected at the Skinner Fish Facility (SWP) and Tracy Fish Collection
Facility (CVP). 2 USFWS Biological Opinion Page 287
2
and magnitude) at the SWP and CVP (Grimaldo et al. 2009; Sommer et al. 2011; Murphy et al. 2013). In light of this new information, Metropolitan Water District of Southern California (MWD) reviewed the three years used to generate the ITS to determine if they appropriately captured variability in conditions that can generate the highest entrainment risk or salvage. Based on this review, MWD concludes that the three years selected do not adequately capture high entrainment risk conditions. Specifically, three years selected do not represent the variability observed during first flush events (following the first storms of the season) that often result in high salvage events (Grimaldo et al. 2009). First flush conditions are characterized as periods following the first rainfall that measurably increase Delta outflow3 (~25,000 to 75,000 cfs) and elevate turbidities throughout the Delta. During and after first flush events, delta smelt move upstream and are broadly distributed. Years with first flush conditions typically present high entrainment risk conditions and are years when the RPA for adult delta smelt would be triggered and in effect for the duration of the RPA actions4. Thus, not including the CSIs from these years for inclusion in the ITS could underestimate take expected in these year types, even if the RPA is implemented at more conservative targets (i.e., OMR more positive than -5000 cfs). The rationale provided in the Biological Opinion5 for not using CSIs from all the historical years, including years that had first flush conditions, was that these years had OMR flows that were more negative than -5000 cfs and high salvage numbers (see detailed explanation below). Thus, CSIs from these years were not considered for inclusion in the ITS calculation because salvage and OMR flows were not representative of levels anticipated under the RPA. The objective of this paper is to demonstrate an approach for incorporating CSIs from years with high entrainment risk conditions as a more robust way to estimate adult delta smelt take expected under the RPA. Ultimately, this information could be used to revise the adult delta smelt ITS to more accurately reflect take expected under variable hydrodynamic conditions that affect smelt distributions and entrainment. Note, the proposed approach only applies for adult delta smelt take, not juvenile smelt take. How is the ITL calculated? To estimate take with implementation of the RPA, the USFWS scaled cumulative adult salvage (CS) to abundance using the estimates provided by the prior year’s Fall Mid-Water Trawl (FMWTt-1) index6. This scaling was termed the cumulative salvage index (CSI): (a) Where SWPt,j and CVPt,j are expanded salvage estimates7 for day j in the period from December 1 of year t−1 through March 31 of year t. USFWS then averaged the three CSI values for 2006-2008 to produce a multiplier (ϒT) for determining the allowable incidental take (IT) take for the projects each year (ITt):
3 Delta outflow is the sum of river flow from the watershed that exits the Delta. See
http://www.water.ca.gov/dayflow/documentation/dayflowDoc.cfm 4 See Actions 1 (page 329) and 2 (page 352) of the Biological Opinion
5 USFWS Biological Opinion Pages 385-386
6 The FMWT is the monitoring survey conducted by Department Fish and Wildlife. The FMWT is used to gauge
annual abundance trends. 7 Salvage counts are made every few hours (typically every 4 hrs.) and expanded to a count for the day. See methods
section from Grimaldo et al. 2009 for how this is calculated.
CSIt = CSt = Ʃj (SWPt,j + CVPt,j) FMWTt-1 FMWTt-1

3
ITt= ϒT FMWTt−1 (b)
Where ϒT is multiplied against the FMWT index value for year t, the result yields the Incidental Take Limit for year t+ 1. The CSI values averaged to generate ϒT for the Biological Opinion (pgs. 384-5) were 8.3 (2006), 0.88 (2007), and 12.6 (2008), which yielded a multiplier of 7.25. ϒT was subsequently corrected to 8.63 after a math error was found in the original computation8. Thus the incidental take calculation is:
ITt = 8.63 * FMWTt-1 (c)
Do the three years used for the CSI produce a multiplier representative of low risk and high risk entrainment conditions? Environmental conditions during the onset of winter storms and fish behavior influence the distribution and subsequent entrainment risk of adult delta smelt (Grimaldo et al. 2009). Pre-spawn fish that move into the south Delta (Figure 1) will face an elevated entrainment risk; this risk increases exponentially with increased reverse OMR flow. Whether delta smelt continue towards the south Delta pumps depends on a number of factors including hydrodynamics and habitat conditions. Under very high Delta outflow (~ 75,000 cfs or above), adult delta smelt often remain downstream of the Delta, presumably because they can find suitable freshwater spawning habitat in the Suisun Bay area and Napa River (Figure 1). Under extremely dry conditions, adult delta smelt distribution is less variable, either they remain in the lower Sacramento River and/or move into the Cache Slough Complex. A hypothesized mechanism for this response in dr ier years is that delta smelt actively avoid moving into the south Delta during dry years unless there is a gradient of higher turbidities and perhaps other water quality conditions (Burau and Bennett 2014). Thus, during extreme wet and critically dry water types, entrainment risk is very low (see Figure S7 from Biological Opinion9). Entrainment risk is highest in the in-between years where Delta outflow averages between 25,000 and 75,000 cfs, especially during years when there are pronounced first flush (i.e., winter run-off) event (Grimaldo et al. 2009). Note, however, that hydrology and transport is complex. Short term events may create a “turbidity bridge” even in dry years
As previously mentioned, the years selected for the basis of the CSI multiplier deserve further
attention because two of the years do not represent conditions when entrainment risk is an issue. In
fact, they represent low entrainment risk periods when the RPA would not be triggered or ramped off
altogether10. In 2006, the delta smelt population was largely distributed in Suisun Bay and the west
Delta (Figure1) and Delta outflow was high (Figure 2). Salvage was relatively low as well (Figure 2).
Overall, 2006 would be considered a very low entrainment risk year and the RPA would have been
temporarily suspended due to the high outflows even though OMR flows were on average negative for
the four month averaging period (Dec-Mar; Figure 2). In effect, the 2006 CSI (8.3) is what can be
8 http://www.fws.gov/sfbaydelta/documents/memorandum_ocap_incidental_take_statement_correction_2013-02-
22.pdf 9 FWS Biological Opinion Page 162
10 FWS Biological Opinion Pages 339-340, 352-354

4
expected under a wetter year hydrology, which has only occurred in approximately 4 of the 20
historical years (1997,1998, 2006, and 2011) for which we have reliable delta smelt salvage data11.
Figure 1. Distribution of adult delta smelt (females in pink, males in blue, and unknowns in yellow) over a 4 day period in the
Suisun Bay/Delta region from the Spring Kodiak Survey #1 2006.The size of the circles represent relative catch at each site.
Sites with no catch are represented by red stars.
11
FWS Biological Opinion Page 204

5
Figure 2. Old and Middle River flows (OMR) for 121 days since December 1st
2006. The red line represents the -5000 cfs
Reasonable and Prudent Alternative (RPA). Total outflow (cfs), Clifton Court Forebay turbidity (NTU) and salvage for both
State Water Project and Central Valley Project. The shaded area represents when conditions would have warranted
suspension of the RPA.
In contrast, 2007 was a critical dry year with low Delta outflow, low turbidity and low salvage (Figure
3). The adult population was mostly distributed in Suisun Bay and Cache Slough Complex, far away
from the SWP and CVP zone of influence12 (Figure 4). Turbidity was well below the 12 NTU trigger,
suggesting the RPA may not have been triggered until March. The 2007 CSI was representative of
what happens under extreme dry conditions; similar dry years have occurred in approximately 4 of the
20 historical years (1994,2007, 2013, and 2014) to date.
12
Zone of influence is the area where exports directly affect net flow (and fish within the water) towards the SWP
and CVP facilities
RPA suspended

6
Figure 3. Old and Middle River flows (OMR) for 121 days since December 1st
2007. The red line represents the -5000 cfs
Reasonable and Prudent Alternative (RPA). Total outflow (cfs), Clifton Court Forebay turbidity (NTU) and salvage for both
State Water Project and Central Valley Project. The shaded area represents when conditions would have warranted
suspension of the RPA.
RPA not triggered
7
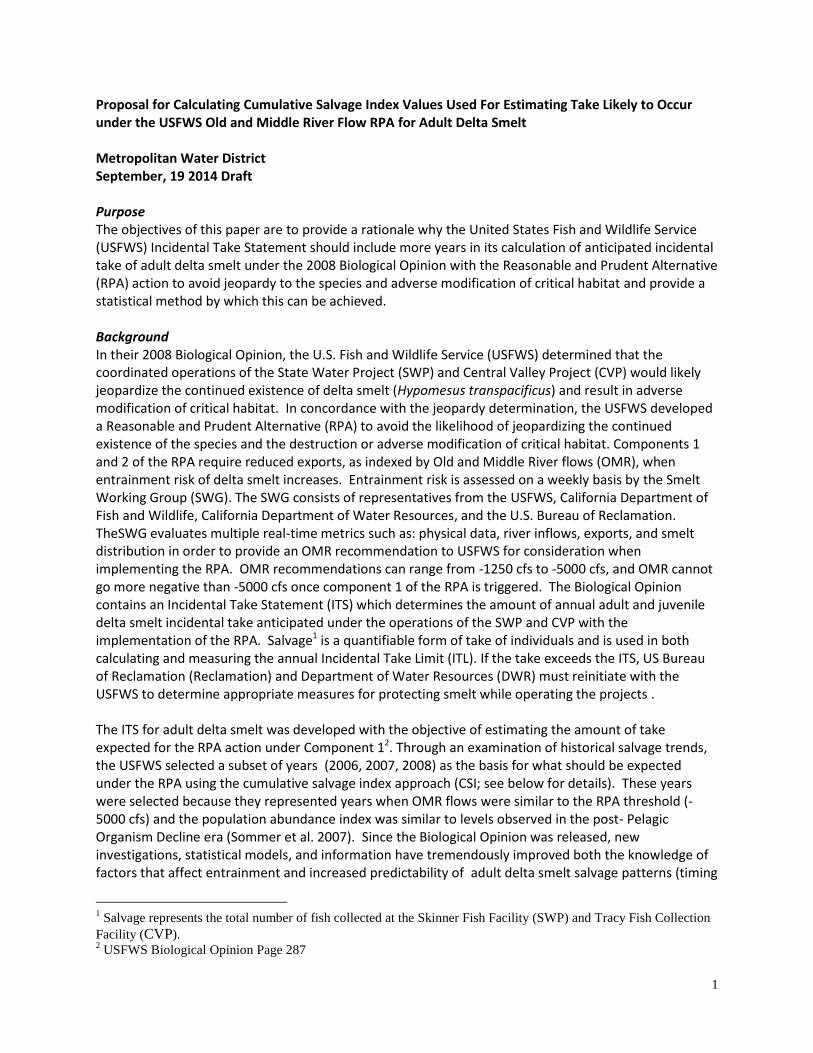
Figure 4. Distribution of adult delta smelt (females in pink, males in blue, and unknowns in yellow) over a 4 day period in the
Suisun Bay/Delta region from the Spring Kodiak Survey #3 2007.The size of the circles represent relative catch at each site.
Sites with no catch are represented by red stars.
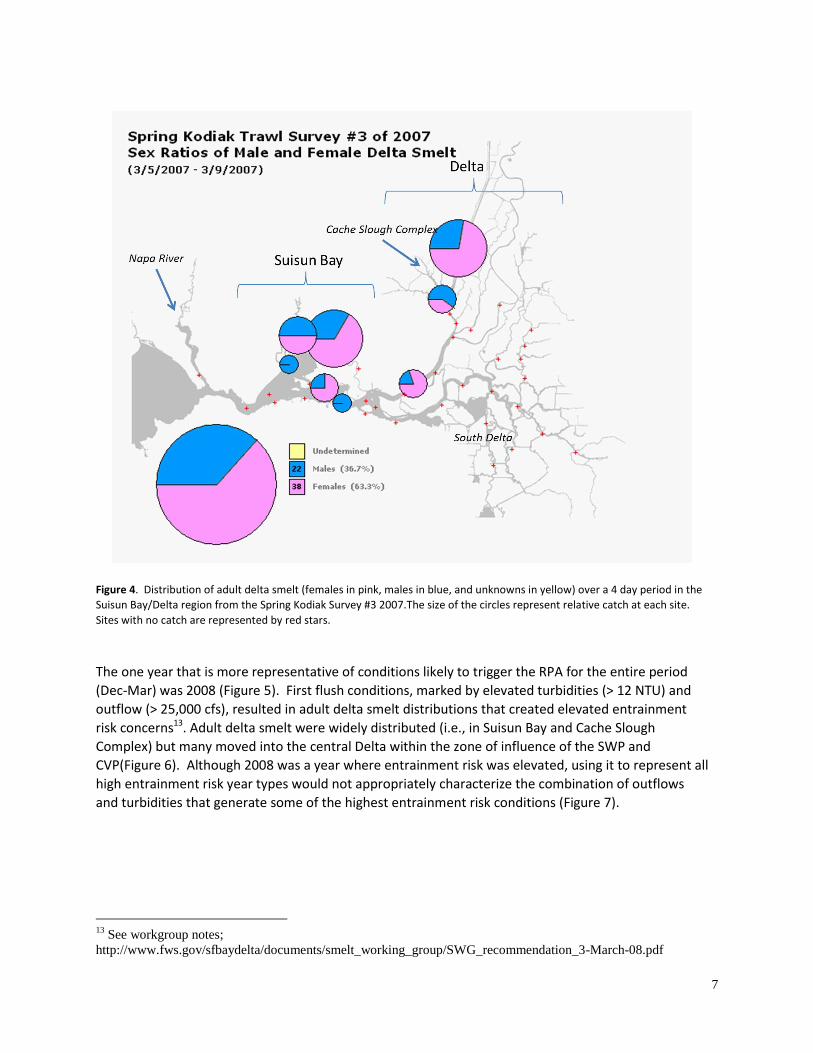
The one year that is more representative of conditions likely to trigger the RPA for the entire period
(Dec-Mar) was 2008 (Figure 5). First flush conditions, marked by elevated turbidities (> 12 NTU) and
outflow (> 25,000 cfs), resulted in adult delta smelt distributions that created elevated entrainment
risk concerns13. Adult delta smelt were widely distributed (i.e., in Suisun Bay and Cache Slough
Complex) but many moved into the central Delta within the zone of influence of the SWP and
CVP(Figure 6). Although 2008 was a year where entrainment risk was elevated, using it to represent all
high entrainment risk year types would not appropriately characterize the combination of outflows
and turbidities that generate some of the highest entrainment risk conditions (Figure 7).
13
See workgroup notes;
http://www.fws.gov/sfbaydelta/documents/smelt_working_group/SWG_recommendation_3-March-08.pdf

8
Figure 5. Old and Middle River flows (OMR) for 121 days since December 1st
2008. The red line represents the -5000 cfs
Reasonable and Prudent Alternative (RPA). Total outflow (cfs), Clifton Court Forebay turbidity (NTU) and salvage for both
State Water Project and Central Valley Project. The shaded area represents when conditions would have warranted
suspension of the RPA.
9
Figure 6. Distribution of adult delta smelt (females in pink, males in blue, and unknowns in yellow) over a 4 day period in the
Suisun Bay/Delta region from the Spring Kodiak Survey #3 2008.The size of the circles represent relative catch at each site.
Sites with no catch are represented by red stars.
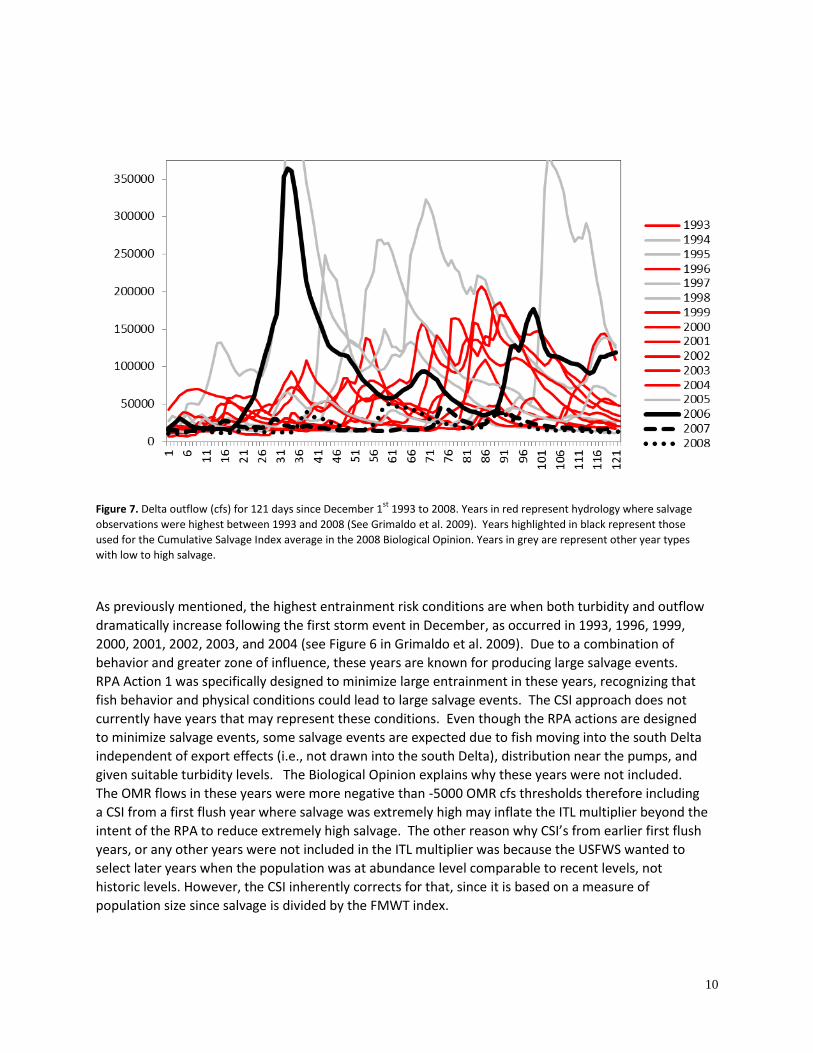
10
Figure 7. Delta outflow (cfs) for 121 days since December 1st
1993 to 2008. Years in red represent hydrology where salvage
observations were highest between 1993 and 2008 (See Grimaldo et al. 2009). Years highlighted in black represent those
used for the Cumulative Salvage Index average in the 2008 Biological Opinion. Years in grey are represent other year types
with low to high salvage.
As previously mentioned, the highest entrainment risk conditions are when both turbidity and outflow
dramatically increase following the first storm event in December, as occurred in 1993, 1996, 1999,
2000, 2001, 2002, 2003, and 2004 (see Figure 6 in Grimaldo et al. 2009). Due to a combination of
behavior and greater zone of influence, these years are known for producing large salvage events.
RPA Action 1 was specifically designed to minimize large entrainment in these years, recognizing that
fish behavior and physical conditions could lead to large salvage events. The CSI approach does not
currently have years that may represent these conditions. Even though the RPA actions are designed
to minimize salvage events, some salvage events are expected due to fish moving into the south Delta
independent of export effects (i.e., not drawn into the south Delta), distribution near the pumps, and
given suitable turbidity levels. The Biological Opinion explains why these years were not included.
The OMR flows in these years were more negative than -5000 OMR cfs thresholds therefore including
a CSI from a first flush year where salvage was extremely high may inflate the ITL multiplier beyond the
intent of the RPA to reduce extremely high salvage. The other reason why CSI’s from earlier first flush
years, or any other years were not included in the ITL multiplier was because the USFWS wanted to
select later years when the population was at abundance level comparable to recent levels, not
historic levels. However, the CSI inherently corrects for that, since it is based on a measure of
population size since salvage is divided by the FMWT index.

11
Estimating CSI values for historical years which did not conform to the current RPAs. It is now recognized that year to year variability in adult smelt entrainment is influenced by factors other than OMR flows alone given that salvage has been documented under a range of positive and negative OMR conditions (Grimaldo et al. 2009; ). Incorporating turbidity or other appropriate surrogates (e.g., Sacramento River inflow, FMWT Secchi depth) with OMR flow can improve the variability explained in the salvage patterns. The Metropolitan Water District of Southern California (MWD) developed a statistical model that largely explained observed CSI values and then used this model to estimate what CSI’s would have been in historical years if OMR had been limited as specified in the adult delta smelt RPA from December 20th through the end of March each year. December 20th was selected because that is the normal date upon which the adult smelt RPA actions can commence (though there are provisions in the RPA for earlier actions if necessary). The steps in the analysis were as follows: 1. Conceptual model and examine available data sources to determine what variables best predict CSIs
values 2. Examine differences between predicted and observed CSIs 3. Use the regression generated from this analysis to predict CSIs under RPA threshold. 4. Make a recommendation to the USFWS to use these CSIs as a more robust and representative way
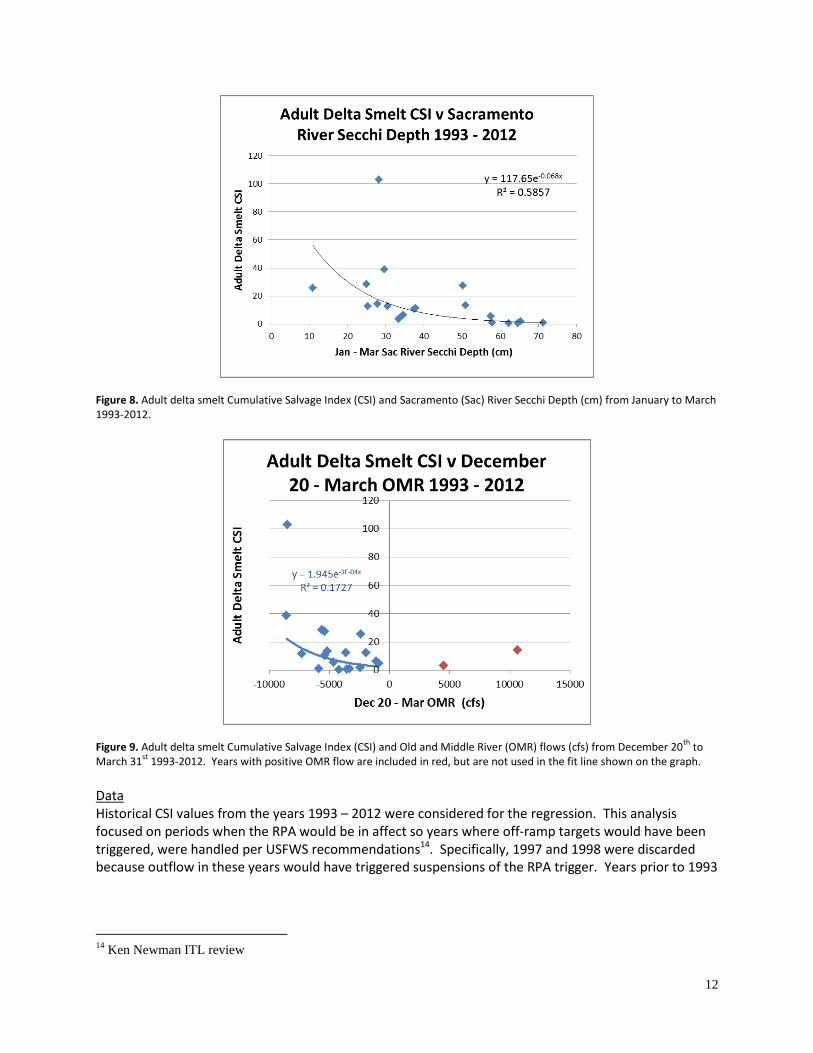
to characterize expected take under the RPA for a range of environmental conditions. 1. Background Conceptual Model and Available Data Sources. It is now widely believed that delta smelt adult salvage is related to both OMR levels and turbidity (Grimaldo et al. 2009). In particular, salvage increases as OMR becomes more negative and salvage increases as the Delta becomes more turbid, particularly if that source of turbidity is the Sacramento River (Figure 8). The combination of high negative OMR and a continuous turbidity gradient originating in the Sacramento River and extending to the export pumps represents conditions where salvage will probably be highest. By contrast, if south Delta turbidity originates from the Cosumnes or Mokelumne or San Joaquin Rivers and no turbidity gradient is formed, salvage is likely to be lower. Years in which OMR is positive (1997 and 1998, shown in red in Figure 9) also can have significant levels of salvage. However, the mechanisms by which salvage occurs during 1997 and 1998 are probably different than the mechanisms in operation when OMR is negative. Moreover, years with high positive OMR are largely beyond the control of SWP and CVP. For this reason, positive OMR years were excluded from the analysis to focus on periods when OMR was in a range when the RPA would be triggered and implemented. Given the relationships between salvage and (1) OMR and (2) Secchi depth (Figures 5 and 6), data taken from Table 1, the following model was developed:
Log (CSI) = a*OMR + b*Secchi depth + ε Equation 1
12
Figure 8. Adult delta smelt Cumulative Salvage Index (CSI) and Sacramento (Sac) River Secchi Depth (cm) from January to March 1993-2012.
Figure 9. Adult delta smelt Cumulative Salvage Index (CSI) and Old and Middle River (OMR) flows (cfs) from December 20
th to
March 31st
1993-2012. Years with positive OMR flow are included in red, but are not used in the fit line shown on the graph.
Data Historical CSI values from the years 1993 – 2012 were considered for the regression. This analysis focused on periods when the RPA would be in affect so years where off-ramp targets would have been triggered, were handled per USFWS recommendations14. Specifically, 1997 and 1998 were discarded because outflow in these years would have triggered suspensions of the RPA trigger. Years prior to 1993
14
Ken Newman ITL review

13
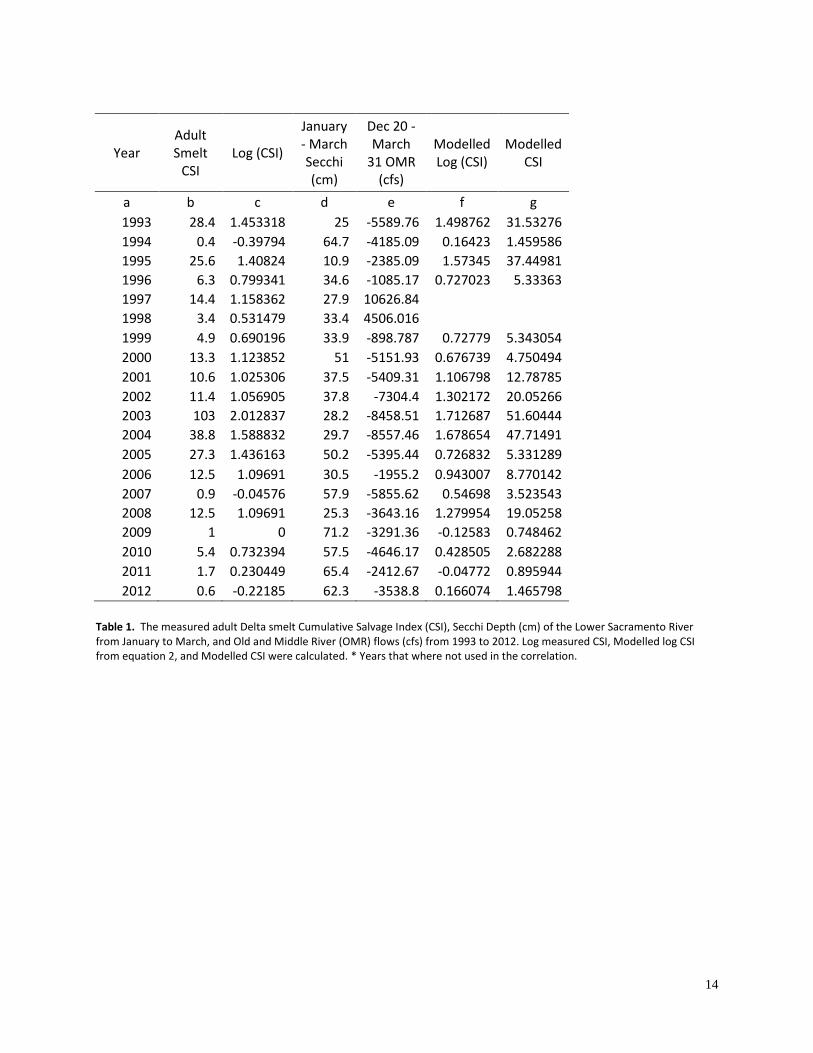
were not analyzed because USFWS considered species15 identification to be unreliable (USFWS 2008 page 204). Raw data for the analyses are included in Table 1. In the Conceptual Model, Delta smelt movement behavior changes in response to turbidity. During Delta smelt prespawn behavior, smelt in Suisun Bay will move to increasing turbidity such as from a first flush event into the Delta. Turbidity data from Freeport and from south Delta were examined but they had inherent problems as turbidity from Freeport is derived from suspended sediment and is not appropriate for delta smelt and the south Delta is too close to the water projects and is correlated with exports. Sediment from the Sacramento is dominant contributor to sediment loading into the Delta, it is measured as Secchi Depth which is optically appropriate for Delta smelt and due to its distance from the water projects Sacramento Secchi Depth is largely independent of OMR. Therefore turbidity represented by Secchi Depth from January to March at the Lower Sacramento River was included in the regression analysis. Values for Secchi depth were available for the years 1993 – 2001 from the FMWT dataset and for the years 2002 through 2012 from the Spring Kodiak Trawl (SKT) dataset. Because the SKT has fewer stations than the FMWT, only FMWT stations that are also recorded in the SKT were averaged. These stations are: 704 – 707, 711 – 713, 715 – 716, and 724. December values for Secchi depth were not used because the FMWT is nearly always completed before the first major turbidity increase of the season. OMR values were obtained from Paul Hutton (Hutton 2008). These flows will be term “historical” OMR flows in the document though it is acknowledged that these flows were generated using an OMR model. Flows at Rio Vista and Vernalis were taken from Dayflow. 2. Modeling CSI Values Using the regression approach, Log (CSI) was modeled with Sacramento River Secchi Depth and OMR using Excel. The data used were columns c, d, and e in Table 1. The years 1997 and 1998 were excluded since OMR was positive. The regression analysis resulted in the equation: Log (CSI) = 1.641 - .0298 * Secchi depth (cm) - 0.00011 * OMR (cfs) + ε Equation 2 n = 18 r2 = .75 psecchi < .00001 pOMR = .014 Standard Error = 0.36 The fit of the model outputs was very good (r2 = 0.75). Figure 10 represents the modeled CSI values versus measured Adult Smelt CSI values for historical OMR.
15
USFWS Biological Opinion, page 149
14
Year Adult Smelt
CSI Log (CSI)
January - March Secchi (cm)
Dec 20 - March
31 OMR (cfs)
Modelled Log (CSI)
Modelled CSI
a b c d e f g
1993 28.4 1.453318 25 -5589.76 1.498762 31.53276
1994 0.4 -0.39794 64.7 -4185.09 0.16423 1.459586
1995 25.6 1.40824 10.9 -2385.09 1.57345 37.44981
1996 6.3 0.799341 34.6 -1085.17 0.727023 5.33363
1997 14.4 1.158362 27.9 10626.84
1998 3.4 0.531479 33.4 4506.016
1999 4.9 0.690196 33.9 -898.787 0.72779 5.343054
2000 13.3 1.123852 51 -5151.93 0.676739 4.750494
2001 10.6 1.025306 37.5 -5409.31 1.106798 12.78785
2002 11.4 1.056905 37.8 -7304.4 1.302172 20.05266
2003 103 2.012837 28.2 -8458.51 1.712687 51.60444
2004 38.8 1.588832 29.7 -8557.46 1.678654 47.71491
2005 27.3 1.436163 50.2 -5395.44 0.726832 5.331289
2006 12.5 1.09691 30.5 -1955.2 0.943007 8.770142
2007 0.9 -0.04576 57.9 -5855.62 0.54698 3.523543
2008 12.5 1.09691 25.3 -3643.16 1.279954 19.05258
2009 1 0 71.2 -3291.36 -0.12583 0.748462
2010 5.4 0.732394 57.5 -4646.17 0.428505 2.682288
2011 1.7 0.230449 65.4 -2412.67 -0.04772 0.895944
2012 0.6 -0.22185 62.3 -3538.8 0.166074 1.465798
Table 1. The measured adult Delta smelt Cumulative Salvage Index (CSI), Secchi Depth (cm) of the Lower Sacramento River from January to March, and Old and Middle River (OMR) flows (cfs) from 1993 to 2012. Log measured CSI, Modelled log CSI from equation 2, and Modelled CSI were calculated. * Years that where not used in the correlation.

15
Figure 10. Adult delta smelt Cumulative Salvage Index (CSI) for both the measured and modeled historical Old and Middle River flow values (OMR).
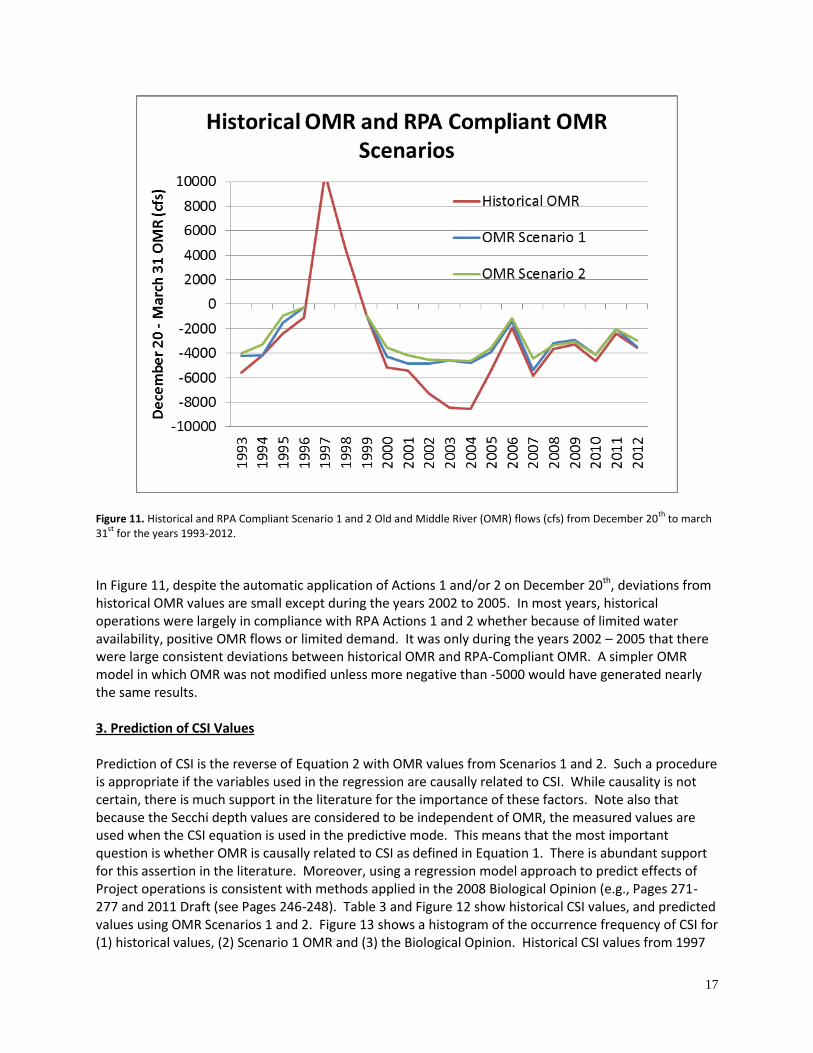
Modeling OMR if RPAs had been applied to all years from 1993 – 2012 Data do not exist that exactly define the operations that would have occurred during 1993 – 2012 if the RPAs had been in place. In particular, the turbidity monitoring stations identified in the RPAs at Prisoners Point, Holland Cut, and Victoria Canal did not all come on line until the summer of 2007. Clifton Court turbidity data was available. However Clifton Court turbidity does not always represent turbidity at the three turbidity trigger stations and Clifton Court turbidity certainly does not identify whether a turbidity bridge exists in Old and Middle Rivers. Therefore, two Scenarios were taken to model RPA compliant OMR for the period 1993 – 2012. For Scenario 1, it was assumed that adult Delta smelt Action 2 was imposed on December 20th every year and applied until March 31. Action 2 limits 14 day average OMR to -5000 cfs and 5 day OMR to -6250 cfs. The assumption could be overly restrictive in some years because the hydrological circumstances which trigger Actions 1 and 2 often do not occur until after December 20th, perhaps long after December 20th. For Scenario 2, it was assumed that Action 1 was on December 20th each year, followed by Action 2 as described in the RPAs. Action 2 requires OMR to be no more negative than -2000 cfs for a period of 14 days. Scenario 2 is more conservative than Scenario 1 in that a limit of -2000 is imposed on December 20th in this scenario. Both Scenario 1 and 2 are probably conservative in that the hydrological conditions that trigger Actions 1 and/or 2 will not occur by December 20th in many years. However, note that such conditions could occur prior to December 20th in some years. Because the estimated RPA-compliant flows under Scenario 1 and Scenario 2 were so close to each other, there was no need to estimate the specific dates on which Actions 1 and/or 2 would have triggered historically.

16
The RPAs suspend Actions 1 and 2 at very high flow levels (90,000 Rio Vista and 10,000 San Joaquin on three day running averages). For this reason, historical OMR values were allowed for any day in which (1) three day Rio Vista flows exceeded 90,000 cfs and (2) three day San Joaquin River flows at Vernalis exceeded 10,000 cfs. There were very few days over the period for which this condition applied. Historical OMR values and projected OMR values under Scenarios 1 and 2 are shown in Table 2 and Figure 11.
Year
Estimated Historical
OMR
OMR Scenario
1
OMR Scenario
2
1993 -5590 -4217 -4005
1994 -4185 -4185 -3281
1995 -2385 -1539 -933
1996 -1085 -247 -247
1997 10627 NA NA
1998 4506 NA NA
1999 -899 -899 -899
2000 -5152 -4260 -3528
2001 -5409 -4865 -4154
2002 -7304 -4840 -4541
2003 -8459 -4582 -4582
2004 -8557 -4783 -4653
2005 -5395 -3886 -3610
2006 -1955 -1400 -1145
2007 -5856 -5359 -4439
2008 -3643 -3195 -3343
2009 -3291 -2925 -3079
2010 -4646 -4141 -4102
2011 -2413 -2048 -2048
2012 -3539 -3500 -2964
Table 2. Historical Old and Middle River (OMR) flows (cfs), Scenario 1 OMR, and Scenario 2 OMR for the years 1993-2012. Flows represent averages for December 20
th through March. 1997 and 1998 were where not used in the correlation therefore
there their values were not modeled.
17
Figure 11. Historical and RPA Compliant Scenario 1 and 2 Old and Middle River (OMR) flows (cfs) from December 20
th to march
31st
for the years 1993-2012.
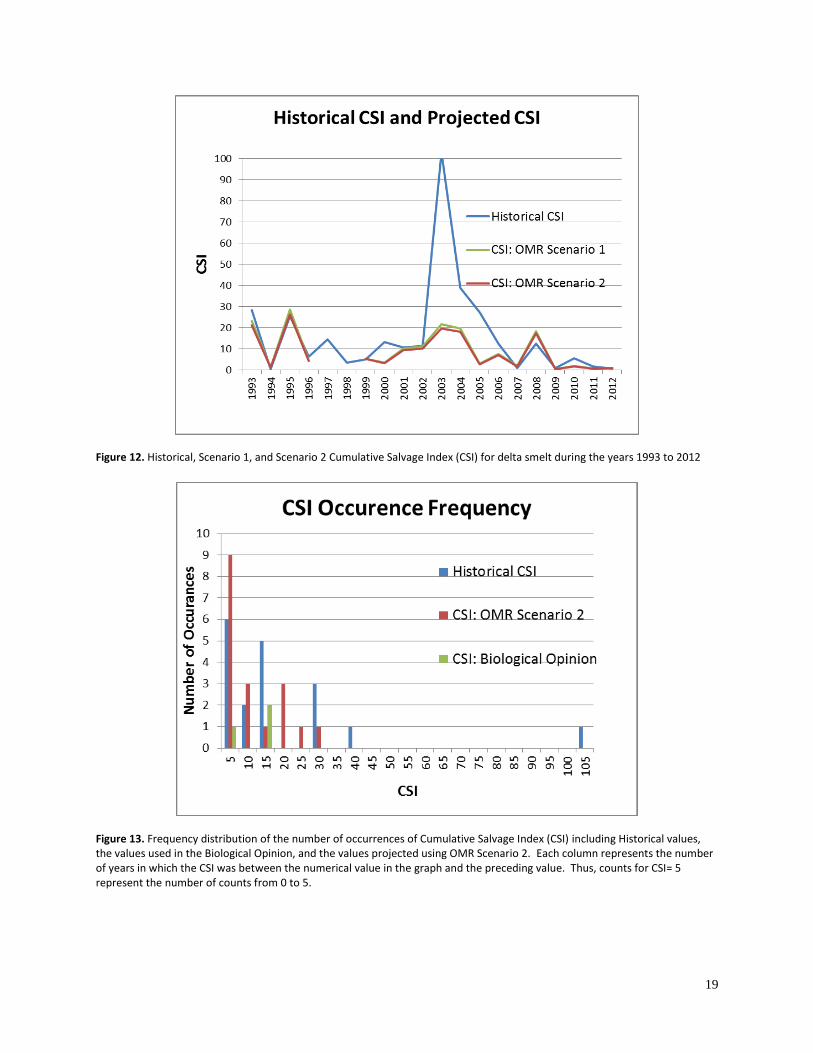
In Figure 11, despite the automatic application of Actions 1 and/or 2 on December 20th, deviations from historical OMR values are small except during the years 2002 to 2005. In most years, historical operations were largely in compliance with RPA Actions 1 and 2 whether because of limited water availability, positive OMR flows or limited demand. It was only during the years 2002 – 2005 that there were large consistent deviations between historical OMR and RPA-Compliant OMR. A simpler OMR model in which OMR was not modified unless more negative than -5000 would have generated nearly the same results. 3. Prediction of CSI Values Prediction of CSI is the reverse of Equation 2 with OMR values from Scenarios 1 and 2. Such a procedure is appropriate if the variables used in the regression are causally related to CSI. While causality is not certain, there is much support in the literature for the importance of these factors. Note also that because the Secchi depth values are considered to be independent of OMR, the measured values are used when the CSI equation is used in the predictive mode. This means that the most important question is whether OMR is causally related to CSI as defined in Equation 1. There is abundant support for this assertion in the literature. Moreover, using a regression model approach to predict effects of Project operations is consistent with methods applied in the 2008 Biological Opinion (e.g., Pages 271-277 and 2011 Draft (see Pages 246-248). Table 3 and Figure 12 show historical CSI values, and predicted values using OMR Scenarios 1 and 2. Figure 13 shows a histogram of the occurrence frequency of CSI for (1) historical values, (2) Scenario 1 OMR and (3) the Biological Opinion. Historical CSI values from 1997
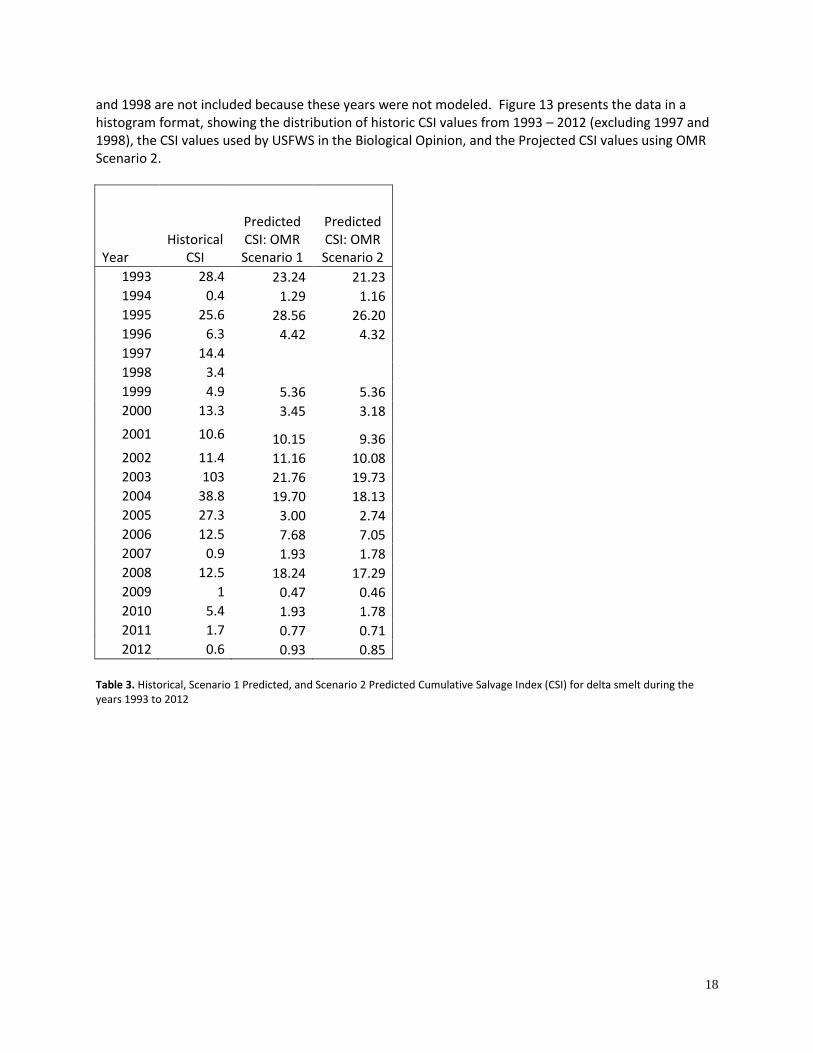
18
and 1998 are not included because these years were not modeled. Figure 13 presents the data in a histogram format, showing the distribution of historic CSI values from 1993 – 2012 (excluding 1997 and 1998), the CSI values used by USFWS in the Biological Opinion, and the Projected CSI values using OMR Scenario 2.
Year Historical
CSI
Predicted CSI: OMR Scenario 1
Predicted CSI: OMR Scenario 2
1993 28.4 23.24 21.23
1994 0.4 1.29 1.16
1995 25.6 28.56 26.20
1996 6.3 4.42 4.32
1997 14.4
1998 3.4
1999 4.9 5.36 5.36
2000 13.3 3.45 3.18
2001 10.6 10.15 9.36
2002 11.4 11.16 10.08
2003 103 21.76 19.73
2004 38.8 19.70 18.13
2005 27.3 3.00 2.74
2006 12.5 7.68 7.05
2007 0.9 1.93 1.78
2008 12.5 18.24 17.29
2009 1 0.47 0.46
2010 5.4 1.93 1.78
2011 1.7 0.77 0.71
2012 0.6 0.93 0.85
Table 3. Historical, Scenario 1 Predicted, and Scenario 2 Predicted Cumulative Salvage Index (CSI) for delta smelt during the years 1993 to 2012
19
Figure 12. Historical, Scenario 1, and Scenario 2 Cumulative Salvage Index (CSI) for delta smelt during the years 1993 to 2012
Figure 13. Frequency distribution of the number of occurrences of Cumulative Salvage Index (CSI) including Historical values, the values used in the Biological Opinion, and the values projected using OMR Scenario 2. Each column represents the number of years in which the CSI was between the numerical value in the graph and the preceding value. Thus, counts for CSI= 5 represent the number of counts from 0 to 5.

20
4. Application of the Predicted CSIs to the ITS The approach provide in this paper to estimate CSIs during years when conditions historically produced high entrainment risk could be used by the FWS to develop a more robust ITS. Specifically, this approach allows for a better estimation of expected take under high entrainment risk conditions when the RPA would be applied. Summary In summary, MWD believes the current ITS is based on too few years and are not fully representative of years where conditions present high entrainment risk periods. MWD provides a statistical approach for estimating CSIs under high entrainment risk conditions and believes these CSIs should be incorporated into the ITS calculation for estimating take levels expected under the RPA. Literature Cited Bennett WA, Burau, JR. 2014. Riders on the storm: Selective tidal movements facilitate the spawning migration of threatened delta smelt in the San Francisco Estuary. Estuaries and Coasts. 1-10. Grimaldo LF, Sommer T, Van Ark N, Jones G, Holland E, Moyle PB, Smith P, Herbold B. 2009. Factors affecting fish entrainment into massive water diversions in a freshwater tidal estuary: Can fish losses be managed? North American Journal of Fisheries Management 29:1253L1270. Hutton P. 2008. A Model to Estimate Old & Middle River Flows. Metropolitan Water District of Southern California. Murphy DD, Hamilton SA. 2013. Eastward mmigration or marshward ddispersal: Exercising ssurvey data to elicit an understanding of seasonal movement of delta smelt. San Francisco Estuary and Watershed Science, 11:1-20. Sommer T, Armor C, Baxter R, Breuer R, Brown L, Chotkowski M, Culberson S, Feyrer F, Gingras M, Herbold B, Kimmerer W,Mueller-Solger A, Nobriga M, Souza K. 2007. The collapse of pelagic fishes in the upper San Francisco Estuary. Fisheries 32:270–277. Sommer T, Mejia F, Nobriga M, Feyrer F, Grimaldo L. 2011. The Spawning Migration of Delta Smelt in the Upper San Francisco Estuary. San Francisco Estuary and Watershed Science 9:1-16. United States Fish and Wildlife (USFWS). 2008. Formal Endangered Species Act Consultation on Proposed Coordinated Operations of the Central Valley Project (CVP) and State Water Project (SWP).