property tax and school funding in...
TRANSCRIPT
Property Tax and School Funding in Utah
Prepared by the Office of Legislative Research and General Counsel for:
Bagels and Briefings
September 17, 2008

Presentation Outline
• Property tax background• Education funding and property tax
– Basic indicators of school funding needs– School funding sources– School property taxes
• Tax base• Tax rates• Tax revenues

Presentation Outline
• Property tax background• Education funding and property tax
– Basic indicators of school funding needs– School funding sources– School property taxes
• Tax base• Tax rates• Tax revenues

Why Discuss Property Taxes Today?
• Property tax is on the mind of many taxpayers– Preliminary property tax statements mailed in July– Truth in taxation hearings in August– Final 2008 property tax rates set by taxing entities after truth in taxation
hearings, then verified and finalized by Tax Commission– Property tax bills mailed to property owners
• Property tax is a major school funding source– Majority of all property tax statewide goes to fund schools– General implications for overall education funding, including state budget
implications– Implications when a new school district is created
• Taxable values have increased rapidly in recent years– Rapid value increases in existing property– Significant value growth from new property development

Three Major State & Local Revenue SourcesIncome, Property, and Sales Tax
$0.0
$0.5
$1.0
$1.5
$2.0
$2.5
$3.0
1982
1983
1984
1985
1986
1987
1988
1989
1990
1991
1992
1993
1994
1995
1996
1997
1998
1999
2000
2001
2002
2003
2004
2005
2006
2007
Bill
ions
of D
olla
rs
Property TaxIndividual Income TaxSales and Use Tax (State and Local)
FY 1982 to FY 2007
Data Source: Utah State Tax Commission, Property Tax Division & Economic and Statistical Unit

Property TaxA Major Component of
Utah’s State and Local Government Tax System
State individual income tax
State, local, and county sales and use tax
Local property tax
Other state taxes (severance, insurance,
cigarette, etc.)
Other local taxes (excise, franchise, and earmarked sales tax)
State corporate taxes (franchise/income, gross receipts)
State transportation taxes
Data Source: Utah State Tax Commission Annual Report, FY 2007
Presentation Outline
• Property tax background• Education funding and property tax
– Basic indicators of school funding needs– School funding sources– School property taxes
• Tax base• Tax rates• Tax revenues

Presentation Outline
• Property tax background• Education funding and property tax
– Basic indicators of school funding needs– School funding sources– School property taxes
• Tax base• Tax rates• Tax revenues

Why Do School Districts Impose Property Taxes?
• To understand property taxes, it is helpful to initially consider why school districts impose the property tax
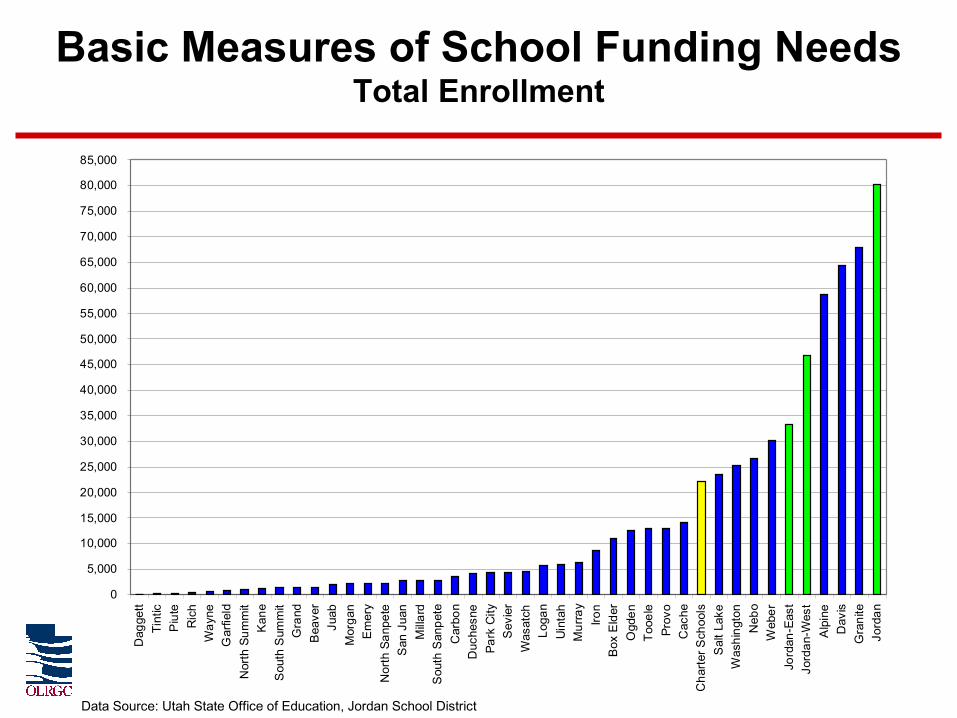
• Basic answer is to provide revenue to meet school funding needs– However, different definitions of funding “needs”
exist– What are some basic measures of funding needs?
0
5,000
10,000
15,000
20,000
25,000
30,000
35,000
40,000
45,000
50,000
55,000
60,000
65,000
70,000
75,000
80,000
85,000
Dag
gett
Tint
icP
iute
Ric
hW
ayne
Gar
field
Nor
th S
umm
itK
ane
Sou
th S
umm
itG
rand
Bea
ver
Juab
Mor
gan
Em
ery
Nor
th S
anpe
teS
an J
uan
Milla
rdS
outh
San
pete
Car
bon
Duc
hesn
ePa
rk C
ityS
evie
rW
asat
chLo
gan
Uin
tah
Mur
ray
Iron
Box
Eld
erO
gden
Tooe
lePr
ovo
Cac
heC
harte
r Sch
ools
Sal
t Lak
eW
ashi
ngto
nN
ebo
Web
erJo
rdan
-Eas
tJo
rdan
-Wes
tA
lpin
eD
avis
Gra
nite
Jord
an
Basic Measures of School Funding NeedsTotal Enrollment
Data Source: Utah State Office of Education, Jordan School District

Basic Measures of School Funding NeedsEnrollment Growth
Data Source: Utah State Office of Education, Jordan School District
(1,000)
(500)
0
500
1,000
1,500
2,000
2,500
3,000
3,500
4,000
4,500
5,000
5,500
Jord
an-E
ast
Gra
nite
Prov
oSa
n Ju
anM
illar
dE
mer
yO
gden
Loga
nM
urra
yS
alt L
ake
Piut
eTi
ntic
Kan
eG
arfie
ldD
agge
ttR
ich
Nor
th S
umm
itN
orth
San
pete
Way
neS
outh
Sum
mit
Bea
ver
Gra
ndC
arbo
nSe
vier
Sou
th S
anpe
teJu
abM
orga
nP
ark
City
Uin
tah
Duc
hesn
eB
ox E
lder
Was
atch
Cac
heIro
nW
eber
Neb
oTo
oele
Was
hing
ton
Dav
isJo
rdan
Jord
an-W
est
Alp
ine
Cha
rter
Sch
ools
1 Year Change in Enrollment3-year-average Change in Enrollment
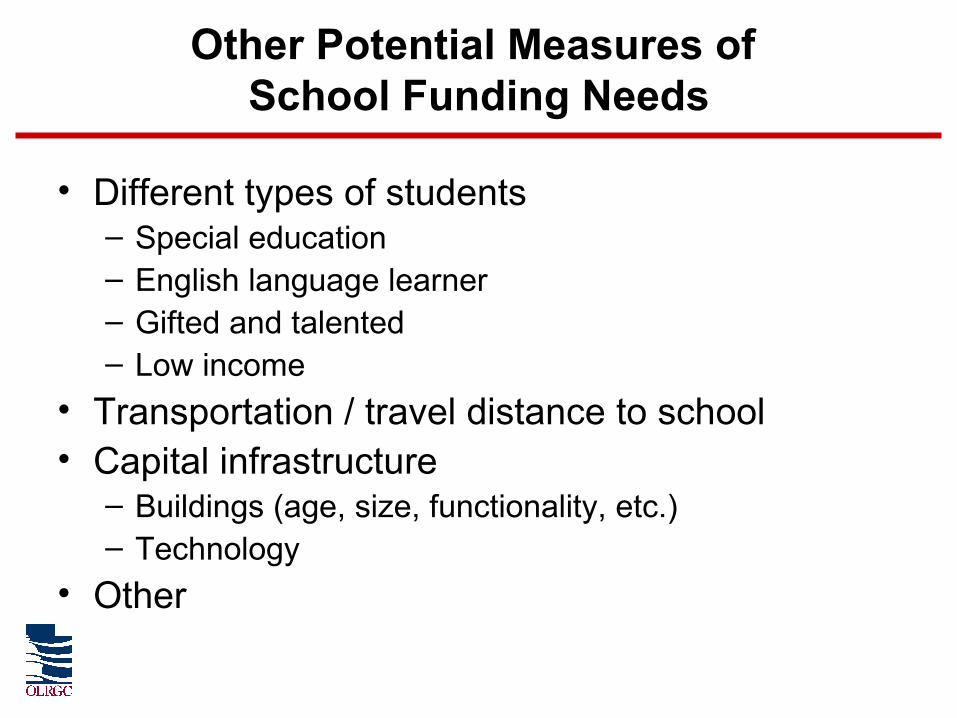
Other Potential Measures of School Funding Needs
• Different types of students– Special education– English language learner– Gifted and talented– Low income
• Transportation / travel distance to school• Capital infrastructure
– Buildings (age, size, functionality, etc.)– Technology
• Other

Distribution of Needs and Tax Bases
• School needs, however defined, are very unlikely to perfectly match up with the tax base of any revenue source on a geographic basis (school-by-school or district-by-district)
• Examples:– Some states allow a local income tax. The distribution of
Utah’s income tax base does not align with the distribution of the student population (one basic measure of school need).
– Utah allows school districts to impose property tax. The distribution of the property tax base is not identical to the distribution of the student population (or of the income tax base).

Presentation Outline
• Property tax background• Education funding and property tax
– Basic indicators of school funding needs– School funding sources– School property taxes
• Tax base• Tax rates• Tax revenues
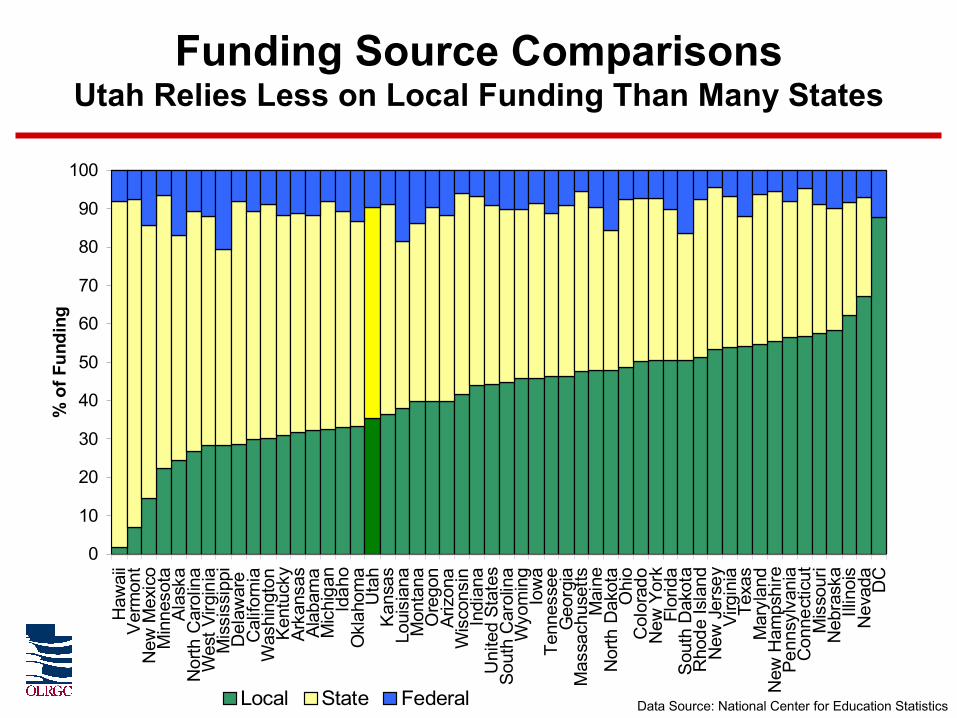
Funding Source ComparisonsUtah Relies Less on Local Funding Than Many States
Data Source: National Center for Education Statistics
0
10
20
30
40
50
60
70
80
90
100
Haw
aii
Ver
mon
tN
ew M
exic
oM
inne
sota
Alas
kaN
orth
Car
olin
aW
est V
irgin
iaM
issi
ssip
piD
elaw
are
Cal
iforn
iaW
ashi
ngto
nK
entu
cky
Arka
nsas
Alab
ama
Mic
higa
nId
aho
Okl
ahom
aU
tah
Kan
sas
Loui
sian
aM
onta
naO
rego
nAr
izon
aW
isco
nsin
Indi
ana
Uni
ted
Stat
esSo
uth
Car
olin
aW
yom
ing
Iow
aTe
nnes
see
Geo
rgia
Mas
sach
uset
tsM
aine
Nor
th D
akot
aO
hio
Col
orad
oN
ew Y
ork
Flor
ida
Sou
th D
akot
aR
hode
Isla
ndN
ew J
erse
yVi
rgin
iaTe
xas
Mar
ylan
dN
ew H
amps
hire
Penn
sylv
ania
Con
nect
icut
Mis
sour
iN
ebra
ska
Illin
ois
Nev
ada
DC
% o
f Fun
ding
Local State Federal

National ComparisonsMajor Education Revenue Sources by Region
Data Source: National Center for Education Statistics

Major Revenue Sources:– Income Taxes ($2.7 billion)– Property Taxes ($1.2 billion)– Federal Funds ($0.3 billion)– Dedicated Credits and Other ($0.06 billion)
Fiscal year 2008-09 estimates
Data source: Office of the Legislative Fiscal Analyst, Utah State Tax Commission
How is Utah Public Education Funded?

Property TaxA Major Component of Utah Public Education Funding
Data Source: Office of the Legislative Fiscal Analyst, State Office of Education
Income Tax
Other
Federal Funds
Property Tax Capital outlay,
debt service, other
Basic levy, voted leeway, board leeway

School Property Taxas a Percent of Total Property Tax
Special Districts 11%
Municipalities 15%
Counties18%
Schools 56%
Data Source: Utah State Tax Commission

School Property Tax Typesas a Percent of Total Property Tax
Special Districts
11%
Schools – Basic Levy (M&O)
12%
Schools – Other M&O
18%
Municipalities15%
Counties18% Schools – Capital Outlay /
Debt Service
24%Schools – Other
2%
Data Source: Utah State Tax Commission, State Office of Education

Property Tax Rates Vary by Location
Data Source: Utah State Tax Commission
-
0.002000
0.004000
0.006000
0.008000
0.010000
0.012000
0.014000
0.016000
0.018000
Kanab (Kane)
Woodruff(Rich)
Park City(Park City)
Circleville(Piute)
Salt Lake(Salt Lake)
Huntsville(Weber)
St. George(Washington)
Smithfield(Cache)
Bountiful(Davis)
Springville(Nebo)
Ogden(Ogden)
Tooele(Tooele)
Prop
erty
Tax
Rat
e
School District City County Special Districts
City (School District)

School Property Taxes as a Percent of Total Property Taxes
Data Source: Utah State Tax Commission
0%
10%
20%
30%
40%
50%
60%
70%
80%
90%
100%
Kanab (Kane)
Woodruff(Rich)
Park City(Park City)
Circleville(Piute)
Salt Lake(Salt Lake)
Huntsville(Weber)
St. George(Washington)
Smithfield(Cache)
Bountiful(Davis)
Springville(Nebo)
Ogden(Ogden)
Tooele(Tooele)
Scho
ol P
rope
rty
Tax
as %
of T
otal
Pro
pert
y Ta
x
School District City County Special Districts
City (School District)
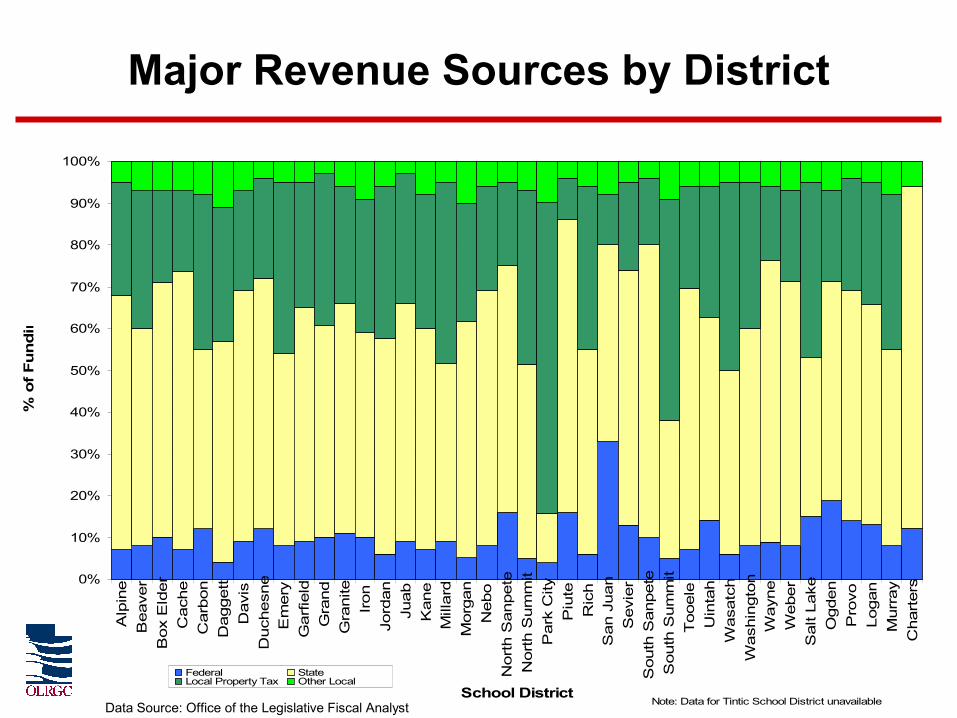
Major Revenue Sources by District
0%
10%
20%
30%
40%
50%
60%
70%
80%
90%
100%
Alp
ine
Bea
ver
Box
Eld
erC
ache
Car
bon
Dag
gett
Dav
isD
uche
sne
Em
ery
Gar
field
Gra
ndG
rani
teIr
onJo
rdan
Juab
Kan
eM
illar
dM
orga
nN
ebo
Nor
th S
anpe
teN
orth
Sum
mit
Par
k C
ityP
iute
Ric
hS
an J
uan
Sev
ier
Sou
th S
anpe
teS
outh
Sum
mit
Too
ele
Uin
tah
Was
atch
Was
hing
ton
Way
neW
eber
Sal
t Lak
eO
gden
Pro
voLo
gan
Mur
ray
Cha
rter
s
School District
% o
f F
un
din
g
Federal StateLocal Property Tax Other Local
Note: Data for Tintic School District unavailableData Source: Office of the Legislative Fiscal Analyst

Presentation Outline
• Property tax background• Education funding and property tax
– Basic indicators of school funding needs– School funding sources– School property taxes
• Tax base• Tax rates• Tax revenues

• Some school districts have greater ability than others to generate revenue through property tax – Measures of school funding needs (such as student populations)
and property values do not align geographically • Why do school district property tax bases vary?
– Overall fair market value differences in different areas– Different mix of property types (commercial, residential, agricultural,
etc.)– Exemption / valuation differences among property types
• Primary residences receive 45% exemption, so 55% of value taxable• Greenbelt agricultural properties valued based on agricultural
production, not parcel fair market value
• Charter schools have no property tax base and cannot impose a property tax
Property Tax Bases Vary

School District Property Tax Base Composition
Data Source: Utah State Tax Commission
0%
10%
20%
30%
40%
50%
60%
70%
80%
90%
100%
Alp
ine
Bea
ver
Box
Eld
erC
ache
Car
bon
Dag
gett
Dav
isD
uche
sne
Emer
yG
arfie
ldG
rand
Gra
nite
Iron
Jord
anJu
abKa
neLo
gan
Mill
ard
Mor
gan
Mur
ray
Neb
oN
orth
.San
pete
Nor
th.S
umm
itO
gden
Par
k C
ityP
iute
Prov
oR
ich
Sal
t Lak
eSa
n Ju
anSe
vier
Sout
h.S
anpe
teS
outh
.Sum
mit
Tint
icTo
oele
Uin
tah
Was
atch
Was
hing
ton
Way
neW
eber
Primary Residential Secondary Residential Commercial / Industrial (includes centrally assessed) Agricultural Vacant Land (non-FAA) Motor Vehicle

District A District B District CTax Base $1,000,000,000 $2,000,000,000 $5,000,000,000
Needed Revenue $1,000,000 $1,000,000 $1,000,000Rate Required to Generate Revenue 0.001000 0.000500 0.000200
Tax impact on $250,000 primary residence $138 $69 $28
Total Enrollment 8,000 4,000 2,000 Tax Base per Enrolled Student $125,000 $500,000 $2,500,000
Suppose 3 school districts each need to raise $1 million per year. The districts each have a different tax base from which to generate the $1 million. To generate the same amount of total revenue, a taxpayer with an identically valued home in District A will pay five times the amount of tax the taxpayer in District C pays, because District C is able to generate the same revenue at a lower tax rate due to its larger tax base.
Because school districts have different sized tax bases and varying numbers of students to serve, it can be difficult to directly compare taxing capacity among school districts. One method of comparison is to compute the tax base per enrolled student.
Impact of Property Tax Baseon Property Tax Revenues

$0
$250,000
$500,000
$750,000
$1,000,000
$1,250,000
$1,500,000
$1,750,000
$2,000,000
$2,250,000
$2,500,000
Cha
rter S
choo
lsTi
ntic
Sout
h S
anpe
teTo
oele
Neb
oD
avis
Cac
heO
gden
San
Juan
Nor
th S
anpe
teW
eber
Sev
ier
Box
Eld
erA
lpin
eJo
rdan
- W
est
Piut
eLo
gan
Juab
Duc
hesn
eG
rani
teS
tate
wid
e Av
erag
eBe
aver
Prov
oJo
rdan
Mor
gan
Way
ne Iron
Was
hing
ton
Mur
ray
Jord
an -
Eas
tG
arfie
ldU
inta
hC
arbo
nM
illar
dW
asat
chEm
ery
Gra
ndSa
lt La
keN
orth
Sum
mit
Sou
th S
umm
itK
ane
Ric
hD
agge
ttPa
rk C
ity
Prop
erty
Tax
Bas
e pe
r Stu
dent
Taxable Property Tax Base per Student
Data Source: Utah State Office of Education

• Operations Levies– Basic levy– Voted leeway– Board leeway– K-3 reading
• 10% of basic levy– 10% of basic levy can be
used both for certain operations purposes (textbooks and supplies) and for capital outlay / certain debt service purposes
• Capital Outlay & Debt Service Levies– Debt service– Capital outlay– Voted capital outlay (not
currently imposed)
• Other Levies– Special transportation– Recreation– Judgment– Tort Liability– Public Law 874 - Federal
impact aid / Title VII (not currently imposed)
School District Property Tax Levies

0.000000
0.001000
0.002000
0.003000
0.004000
0.005000
0.006000
0.007000
0.008000
0.009000
0.010000
Tin
ticT
ooel
eS
outh
San
pete
Ogd
enN
ebo
San
Jua
nD
uche
sne
Juab
Loga
nD
avis
Alp
ine
Bea
ver
Jord
anS
evie
rG
arfie
ldW
asat
chS
outh
Sum
mit
Cac
heN
orth
San
pete
Uin
tah
Box
Eld
erC
arbo
nM
illar
dW
ashi
ngto
nW
eber
Em
ery
Gra
nite
Nor
th S
umm
itIr
onM
orga
nP
rovo
Mur
ray
Sal
t Lak
eP
iute
Par
k C
ityG
rand
Dag
gett
Way
neR
ich
Kan
e
Tota
l Tax
Rat
e
Total Other Tax RatesTotal Capital Outlay & Debt Service Tax RatesTotal Maintenance & Operations Tax Rates
Utah School District Property Tax RatesTax Year 2007
Data Source: Utah State Office of Education

Property Tax Base per Student and Total Tax Rate
Data Source: Utah State Office of Education

Current School Funding Equalization
• Basic Program – Utah’s basic program (WPU) in the operations portion of the public education
budget is often seen nationally as a model of an equitable education funding system
– Similar students meeting qualifying characteristics are funded similarly• Districts with different property tax base receive same funding level
– Different student characteristics yield different funding amounts• Kindergarten student generates less funding than other grades (0.55 WPU)• Special education student generates more funding
– Each school district imposes the basic levy – an identical tax rate statewide– Because of the equalized basic program, a large portion of the maintenance and
operations budget for schools is equalized• Other Funding
– Schools can generate additional revenue by imposing certain property tax levies authorized by statute
• Some state funding minimally equalizes certain other property tax levies (voted leeway / board leeway guarantee) but not equalized near the extent of the basic program equalization
– School Building Program• Foundation Program• Enrollment Growth Program
– Non-WPU driven programs (“below-the-line”) funded with income taxes collected on an equal basis statewide

Basic Program (WPUs),
$1,840,119,735
Voted and Board Leeway,
$359,913,204
Related to Basic Program,
$857,278,121
One-time programs and Other,
$62,820,000
Components of the Minimum School Program
Data source: Office of the Legislative Fiscal Analyst, Public Education Budget Guide

Basic Levy History
$0
$50,000,000
$100,000,000
$150,000,000
$200,000,000
$250,000,000
$300,000,000
1980
1981
1982
1983
1984
1985
1986
1987
1988
1989
1990
1991
1992
1993
1994
1995
1996
1997
1998
1999
2000
2001
2002
2003
2004
2005
2006
2007
2008
e
Year
Basi
c Le
vy R
even
ue
0.000000
0.000500
0.001000
0.001500
0.002000
0.002500
0.003000
0.003500
0.004000
0.004500
0.005000
Basi
c Le
vy R
ate
Basic Levy RevenueBasic Levy Rate
Data source: Utah State Office of Education

The Weighted Pupil Unit (WPU)
• The WPU is not total per-pupil spending• The WPU is used to determine the cost of the basic
school program on a uniform basis for each student– 1 WPU = 1 student in average daily membership (ADM)– Students in Kindergarten receive 0.55 WPUs– Specific programs generate additional WPUs, generally based
on student qualifications (special education, technology education, etc.)
• The Legislature establishes the WPU value annually– FY 2009 WPU Value = $2,577– Districts and charter schools receive basic program funding
based on their total number of WPUs• Hypothetical example:
1,000 WPUs x $2,577 = $2,577,000 (total basic program funding)

How is the Basic Program Equalized?
Hypothetical District 1,000 WPUs x $2,500 per WPU = $2,500,000 basic program amount Property tax base = $1,500,000,000 x basic levy (.001500) = $2,250,000 property tax revenue $250,000 Income Tax (Uniform School Fund)
$250,000
$2,250,000 $2,500,000
Property Tax
Income Tax $250,000

Basic ProgramTwo Hypothetical School Districts
District A District BValue of WPU $2,500 $2,500WPUs 1,000 1,000 Basic program statutory entitlement $2,500,000 $2,500,000
Net Taxable Value (Property Tax Base) $1,500,000,000 $500,000,000Basic levy (Tax Rate) 0.001500 0.001500 Basic Levy Yield (Property Tax Revenue) $2,250,000 $750,000
Allocation from Uniform School Fund $250,000 $1,750,000
Income Tax
Income Tax
Property Tax
Property Tax

Basic Levy (Property Tax)
$260 Million
Statewide Basic Program Funding Sources
Uniform School Fund (Income Tax)
$1.580 Billion
Data source: Office of the Legislative Fiscal Analyst, Public Education Budget Guide

Basic Program Amounts
Data source: Utah State Office of Education
$0
$25
$50
$75
$100
$125
$150
$175
$200
$225
$250
$275
$300Al
pine
Bea
ver
Box
Eld
erC
ache
Car
bon
Dag
gett
Dav
isD
uche
sne
Em
ery
Gar
field
Gra
ndG
rani
teIro
nJo
rdan
Juab
Kan
eLo
gan
Mill
ard
Mor
gan
Mur
ray
Neb
oN
orth
San
pete
Nor
th S
umm
itO
gden
Park
City
Piut
ePr
ovo
Ric
hS
alt L
ake
San
Jua
nS
evie
rS
outh
San
pete
Sou
th S
umm
itTi
ntic
Tooe
leU
inta
hW
asat
chW
ashi
ngto
nW
ayne
Web
erC
harte
r Sch
ools
Mill
ions
Estim
ated
Bas
ic P
rogr
am F
undi
ng A
mou
nt Uniform School FundProperty Tax

Basic Program Funding Source
Data source: Utah State Office of Education

Property Tax
$484M
Capital Outlay Foundation Program
$24.4M ongoing
Capital Outlay Enrollment
Growth Program
$2.9M ongoing
FY 2007-08
Statewide School District Capital Outlay Funding Sources
Data source: Utah State Office of Education

School Funding SystemRelies on Accurate Property Valuation
• Failure to accurately and uniformly assess properties at fair market value distorts the allocation of school funds– With the truth-in-taxation certified rate process,
undervaluation of properties in one area causes higher taxes statewide through an increase in the certified rate for the basic levy
– In addition to basic program funding, other state funds are also tied to property tax values per student, including voted/board leeway guarantees and capital outlay foundation program
• So assessment practices by the Tax Commission and assessors in each county impact taxpayers statewide

Property Tax Revenue per Student

2008 General Session School Property Tax Equalization Bills
• HB 1 – Basic Program– Establishes the tax year 2008 basic levy rate (estimated)
• SB 2 – Basic Program and Property Tax Allocations for Charter Schools– Increases the value of the WPU to $2,577– Requires school districts to provide a portion of revenue from certain
property tax levies for charter school students residing within the district boundaries
• SB 48 – School District Capital Outlay – Requires a partial equalization of the capital outlay property tax levy
within Salt Lake County

Theoretical Equalization Continuum
User Fee
Only parents of children in
schools
Secondary school fees
Impact Fee
Owners of new homes
and new businesses
Currently prohibited by
statute
District-wide Equalization
All property owners within school district
Discretionary school property tax levies
(voted leeway, board leeway, debt service levy, capital outlay
levy, etc.)
County-wide Equalization
All property owners within a county
(same as district in all but 7 counties)
Partial capital outlay equalization in county of
the first class
Statewide Equalization
Taxpayers statewide
Basic levy / basic program, educator salary adjustments, state pupil
transportation funds
Who should pay for school costs?

Please feel free to contact staff with any questions:
Office of Legislative Research and General Counsel
(801) 538-1032