promise and paradox: measuring students’ non-cognitive...
TRANSCRIPT

Running head: Promise and Paradox
Promise and Paradox:
Measuring Students’ Non-cognitive Skills and the Impact of Schooling∗
Martin R. West, Harvard Graduate School of Education+
Matthew A. Kraft, Brown University
Amy S. Finn, Massachusetts Institute of Technology
Rebecca Martin, Massachusetts Institute of Technology
Angela L. Duckworth, University of Pennsylvania
Christopher F.O. Gabrieli, Harvard Graduate School of Education and Transforming Education
John D. E. Gabrieli, Massachusetts Institute of Technology
February 2014
Abstract
We used self-report surveys to gather information on a broad set of non-cognitive skills from 1,368 8th-grade students attending Boston public schools and linked this information to administrative data on their demographics and test scores. At the student level, scales measuring conscientiousness, self-control, grit, and growth mindset are positively correlated with attendance, behavior, and test-score gains between 4th- and 8th-grade. Conscientiousness, self-control, and grit are unrelated to test-score gains at the school level, however, and students attending over-subscribed charter schools with higher average test-score gains score lower on these scales than do students attending district schools. Exploiting charter school admissions lotteries, we replicate previous findings indicating positive impacts of charter school attendance on math achievement but find negative impacts on these non-cognitive skills. We provide suggestive evidence that these paradoxical results are driven by reference bias, or the tendency for survey responses to be influenced by social context. Our results therefore highlight the importance of improved measurement of non-cognitive skills in order to capitalize on their promise as a tool to inform education practice and policy.
∗ We thank Susanna Loeb and Jennifer Jennings for helpful comments and the Bill and Melinda Gates Foundation for financial support. Aaron Dow provided outstanding research assistance. Any errors are our own. + Corresponding author: [email protected].
Running head: Promise and Paradox
1
Introduction
Recent evidence from economics and psychology highlights the importance of traits other
than general intelligence for success in school and in life (Almlund et al., 2011; Borghans et al.,
2008; Moffitt et al., 2011). Disparities in so-called non-cognitive skills appear to contribute to
the academic achievement gap separating wealthy from disadvantaged students (Evans and
Rosenbaum, 2008). Further, non-cognitive skills may be more amenable to direct intervention
than cognitive ability, particularly beyond infancy and early childhood (Cunha & Heckman,
2009; Dee & West, 2010; Heckman & Kautz, 2013). Understandably, popular interest in
measuring and developing students’ non-cognitive skills has escalated (see, e.g., Tough, 2012).
Non-cognitive is, of course, a misnomer. Every psychological process is cognitive in the
sense of relying on the processing of information of some kind. Characteristic patterns of
attending to and interpreting information underlie many if not most personality traits (Bandura,
1999; Mischel & Shoda, 1999). Moreover, emotion and personality influence the quality of one’s
thinking (Baron, 1982) and how much a child learns in school (Duckworth & Seligman, 2005).
Why, then, does the term non-cognitive persist? Cognitive in this context is shorthand for
cognitive ability and knowledge, constructs that can be measured by standardized intelligence
and achievement tests (Messick, 1979). Non-cognitive, therefore, has become a catchall term for
traits or skills not captured by assessments of cognitive ability and knowledge. Many educators
prefer the umbrella terms “social and emotional learning” (Durlak et al. 2011) or “21st Century
skills” (National Research Council, 2012), while some psychologists and economists embrace
the moral connotations of “virtue” and “character” (Peterson & Seligman, 2004; Heckman &
Kautz, 2013).
Running head: Promise and Paradox
2
Educators and policymakers are increasingly interested in developing students’ non-
cognitive skills in support of academic success and long-term life outcomes (see, e.g., Yeager et
al., 2013). For example, several high-performing charter management organizations have
implemented comprehensive discipline systems aimed at molding student behavior in and out of
school in pro-social and pro-academic directions (Lake et al., 2012). Some Knowledge Is Power
Program (KIPP) charter schools go so far as to issue a regular “Character Growth Card” for each
student that tracks the development of various non-cognitive skills. Related developments
include efforts to address students’ social and emotional learning needs alongside traditional
academic goals (Durlak et al., 2011). In August 2013, the U. S. Department of Education
approved an application from a consortium of California school districts to implement a new
school accountability metric that weights test-based outcomes as only 60 percent of overall
performance, with the balance assigned to measures of school climate and student social-
emotional development.
As practice and policy race forward, however, research on non-cognitive skills remains in
its infancy. There is little agreement on which skills are most important, how they can be reliably
measured, and their malleability in school settings. Absent consensus on these points, educators
cannot rely on available measures of non-cognitive skills or their underlying theories of personal
development to assess and support individual students or to evaluate the success of schools,
teachers, or interventions. As if to illustrate this dilemma, the California consortium applying to
develop its own accountability system noted only that the specific social-emotional measures
used in school ratings would be determined later.
In this paper, we draw on cross-sectional data from an unusually large sample of students
in the city of Boston to shed light on the potential of schools to impact the development of four

Running head: Promise and Paradox
3
prominent non-cognitive skills, as well as on the ability of extant measures of those traits to
capture school impacts. We used self-report survey instruments to gather information on non-
cognitive skills from more than 1,300 8th-grade students across a wide range of the city’s public
schools and linked this information to administrative data on the students’ demographics and test
score performance. The schools attended by students in our sample include both open-enrollment
public schools operated by the local school district and over-subscribed charter schools that have
been shown to have large positive impacts on student achievement as measured by state math
and English language arts tests (Abdulkadiroglu et al., 2011; Angrist et al., 2013a).
The non-cognitive skills we measured include conscientiousness, self-control, grit, and
growth mindset. Of the many non-cognitive attributes that psychologists have studied in
students, conscientiousness and self-control have arguably the strongest evidence of predictive
power over academic and life outcomes, even when controlling for cognitive ability and
demographics (Almlund et al., 2011; Poropat, 2011; Duckworth & Carlson, 2013). We also
examine two newer measures, grit and growth mindset, because of their current salience among
educators seeking to influence non-cognitive skills to support academic achievement, post-
secondary persistence and completion, and life outcomes. Grit refers to the tendency to sustain
interest in, and effort toward, long-term goals (Duckworth et al., 2007), while growth mindset
measures students’ implicit theory of intelligence—in particular, the extent to which they believe
that their academic ability can improve with effort, rather than being fixed by factors outside of
their control (Dweck, 2006).
Our results highlight both the potential value of these measures in explaining academic
outcomes and a challenging paradox that may be inherent to many available measures of non-
cognitive skills. The promise is illustrated by the fact that our measures of non-cognitive skills
Running head: Promise and Paradox
4
are positively correlated with student attendance and behavior, state test scores, and test-score
gains from 4th to 8th grade. The paradox is that schools in which students on average report
higher levels of conscientiousness, self-control, and grit do not have higher average test-score
gains than do other schools. In other words, the positive student-level relationships between
these self-reported measures of non-cognitive skills and improvements in academic achievement
dissipate when the measures are aggregated to the school level.
This paradox is especially apparent when comparing students attending over-subscribed
charter schools and those attending open-enrollment district schools. Despite making larger test-
score gains than students attending open-enrollment district schools, charter school students rate
themselves lower, on average, on measures of conscientiousness, self-control, and grit.
Exploiting data from school admissions lotteries, we replicate previous quasi-experimental
findings indicating positive impacts of charter school attendance on math achievement within the
students in our sample, but find large and statistically significant negative impacts on these non-
cognitive skills. Finally, we also present longitudinal data showing marked declines in the same
non-cognitive skills over time among students attending two over-subscribed charter middle
schools.
This pattern is puzzling for two reasons. First, evidence gathered in the same study and
reported in Finn et al. (in press) indicates that the test-score gains made by the charter school
students in our data were not accompanied by gains in fluid reasoning skills that are highly
correlated with test-score levels and gains. While this might seem to suggest that these students’
academic progress was supported by improvements in non-cognitive skills, we observe sharp
declines in three non-cognitive skills that are also correlated with academic success. A second
reason is the emphasis that the over-subscribed charter schools in our study, all of which
Running head: Promise and Paradox
5
subscribe to a “no excuses” approach to urban education, place on character development as a
means to foster academic success (Seider, 2012). Indeed, Angrist et al. (2013a) present
compelling evidence that it is this “no excuses” orientation that distinguishes Boston’s charter
schools from their counterparts elsewhere in the state that have neutral or even negative impacts
on student test scores.
Two competing hypotheses could explain this paradox. One is that the measures of non-
cognitive skills are accurate and the charter schools, despite their success in raising test scores,
and contrary to their stated goals, reduce students’ non-cognitive abilities along crucial
dimensions such as conscientiousness, self-control, and grit. An alternative hypothesis is that the
measures, all self-reported by students, are misleading because they are prone to reference bias—
the tendency for survey responses to be influenced by the context in which the survey is
administered. We find suggestive evidence supporting this alternative hypothesis, highlighting
the importance of improved measurement of non-cognitive skills in order to capitalize on their
promise as a tool for education practice and policy.
Measurement of Non-Cognitive Skills and the Perils of Reference Bias
Recognition of the importance of non-cognitive skills has, with few exceptions, preceded
the development of valid and reliable measures thereof. Whereas performance tasks to assess
how well children can read, write, and cipher are widely available, non-cognitive skills are
typically assessed using self-report and, less frequently, informant-report questionnaires. Like
standardized achievement tests, both types of questionnaires have the advantage of quick, cheap,
and easy administration.
Running head: Promise and Paradox
6
Questionnaires also have limitations. Most obviously, they are subject to faking and
therefore to social desirability bias (Paulhus, 1991). When endorsing a questionnaire item such
as “I am a hard worker” a child (or her teacher or parent) might be inclined to choose higher
ratings in order to seem more attractive to observers or to herself. To the extent that social
desirability bias is uniform within a population under study, it can alter the absolute level of
individual responses but not their rank order. If some individuals are more influenced by social
pressure than others, however, their relative placement within the overall distribution of
responses can change.
Less obvious but possibly more pernicious is reference bias, which occurs when
individual responses are influenced by differing implicit standards of comparison. When
considering whether “I am a hard worker” should be marked “very much like me,” a child must
conjure up a mental image of “a hard worker” to which she can then compare her own habits. A
child with very high standards might consider a hard worker to be someone who does all of her
homework well before bedtime and, in addition, organizes and reviews all of her notes from the
day’s classes. Another child might consider a hard worker to be someone who brings home her
assignments and attempts to complete them, even if most of them remain unfinished the next
day.
Reference bias was first documented in cross-cultural psychology, and culturally shared
standards appear to be a primary influence on implicit standards of comparison. In studies of
distinct societies, data from self-report surveys often conflict with the conclusions of cultural
experts (Peng, Nisbett, & Wong, 1997). For instance, despite a widely acknowledged cultural
emphasis on conscientious behavior, individuals in East Asian countries rate themselves lower in
conscientiousness than do individuals in any other region (Schmitt et al., 2007). Heine et al.

Running head: Promise and Paradox
7
(2008) demonstrate that self-reported conscientiousness at the country level (i.e., the average
self-reported conscientiousness rating for citizens of a particular country) is negatively correlated
with several objective proxies for conscientiousness, including postal workers’ efficiency, the
accuracy of clocks in public banks, walking speed, and longevity. Within the United States,
Naumann and John (2013) find that European-American undergraduates at UC Berkeley rated
themselves higher in conscientiousness than did their Asian-American classmates, despite
earning lower GPAs. This paradoxical finding disappeared when both groups were asked to
complete the same questions with the explicit reference point of a “typical Asian-American
Berkeley student.”
Education researchers have documented similarly unexpected patterns in students’
responses to questionnaires administered during international assessments of student
achievement. For example, Kyllonen & Bertling (2013) report that, in the 2003 Programme for
International Student Assessment study, a 5-item scale measuring self-confidence in math is
positively correlated with math achievement among students within the same country but
negatively correlated with math achievement at the aggregate level across countries. That is,
students who are more confident in their abilities than their peers tend to achieve at higher levels,
but students in countries where students are more confident on average tend to achieve at lower
levels. Kyllonen & Bertling (2013) refer to this pattern, which is also evident for scales
measuring interest in math and science, perceptions of teacher support, and general attitudes
toward school, as the “attitude-achievement anomaly.” While there is no logical reason why the
individual-level and aggregate correlations between two variables need point in the same
direction—assuming they must is the “ecological fallacy”—these patterns nonetheless cast doubt
on the validity of cross-cultural comparisons of student attitudes (Van de Gaer et al., 2012).
Running head: Promise and Paradox
8
Apart from national culture or ethnicity, what are likely influences on students’ implicit
frames of reference when responding to surveys designed to gauge their non-cognitive skills?
Because students (like adults) are unable to see the full distribution of human behavior, their peer
groups and other aspects of their immediate social context are likely to shape how they evaluate
themselves. It follows that the school environment in which they spend much of their waking
lives could exert a powerful influence on students’ perspectives on their own attributes and
abilities. We return to this possibility when interpreting our findings below.
Data and Measures Sample We collected data from a large sample of 8th-grade students attending 32 of the 49 public
schools with an 8th-grade cohort in the city of Boston during the spring semester of the 2010-11
school year. The schools that agreed to participate in the study included 22 open-enrollment
district schools, 5 over-subscribed charter schools, 2 test-in exam schools, and 3 charter schools
which were not over-subscribed at the time the students in our study entered middle school.
Within those schools, we sampled all students for whom we obtained parental consent to
participate in the study and who were in attendance on the day we collected our data.
We acquired school enrollment and demographic information, data on attendance and
suspensions, and math and English language arts (ELA) test scores on the Massachusetts
Comprehensive Assessment System (MCAS) from databases maintained by the Massachusetts
Department of Elementary and Secondary Education. MCAS scaled scores were standardized to
have mean zero and unit variance by grade, subject, and year across all tested students in
Massachusetts. We limit our analytic sample to the 1,368 of a total of 1,852 students who

Running head: Promise and Paradox
9
participated in the non-cognitive data collection for whom MCAS math and ELA scores were
available in 2007 (when most students were in 4th grade) and 2011, making it possible to track
their academic progress and school enrollment since they entered middle school.
Table 1 compares the demographic characteristics and academic indicators of students in
our analytic sample to those of all 8th-grade students attending public schools in Boston, as well
as to those of 8th-graders attending schools participating in the study. The sampled students are
quite similar demographically to all 8th-grade students attending public schools in the city and to
8th-graders attending the same schools. However, the 8th-grade test scores of sampled students
are 0.24 standard deviations and 0.21 standard deviations higher than the citywide average in
math and ELA, respectively. Comparing the test scores of the sampled students to those of 8th-
graders attending the same schools indicates that more than half of this difference reflects
positive selection into the study sample within participating schools.
Much of our analysis compares sampled students attending open-enrollment district and
over-subscribed charter schools. Looking separately at these two groups, we see that positive
selection with respect to academic indicators is somewhat more pronounced within the district
schools. Specifically, the 8th-grade test scores of sampled students in district schools exceeded
those of all students by 0.15 (math) and 0.11 (ELA) standard deviations, while the analogous
differences in the over-subscribed charter schools were 0.05 (math) and 0.01 (ELA). This
difference does not stem from substantially higher rates of study participation within the charter
sector; the share of all 8th-graders participating in the study was 63 percent in the over-subscribed
charter schools, as compared with 61 percent in the open-enrollment district schools.
Table 1 also reveals that the 8th-grade test scores of students are considerably higher in
the over-subscribed charter schools than in the open-enrollment district schools. Within our

Running head: Promise and Paradox
10
sample, students in these over-subscribed charter schools exceeded the statewide mean by 0.41
(math) and 0.21 (ELA) standard deviations, while students in open-enrollment district schools
trailed the state average by -0.49 (math) and -0.55 (ELA) standard deviations. The students in
our sample attending over-subscribed charter schools also experienced larger gains in test scores
(relative to the state average) between 4th and 8th grade. Charter students gained 0.79 (math) and
0.63 (ELA) standard deviations relative to the state average over those four years, while their
district peers gained 0.17 (math) and 0.25 (ELA) standard deviations. Sampled students in over-
subscribed charter schools were also 10 percentage points more likely to be white, 16 percentage
points less likely to be Hispanic, and 21 percentage points less likely to be eligible for a free or
reduced price lunch than their counterparts in open-enrollment district schools. They were absent
two-thirds as many days as students in open-enrollment district schools but spent nearly twice as
many days in suspension on average (0.31 vs. 0.16), suggesting greater use of suspensions as a
disciplinary tool in the city’s charter sector.
Measures of Non-cognitive Skills
All students participating in our study completed a battery of questionnaires designed to
measure their non-cognitive skills along various dimensions. These questionnaires, which were
administered in students’ regular classrooms, included items probing students’
conscientiousness, self-control, grit, and growth mindset that have been previously validated.
After scoring student responses to each series of items based on the relevant rubric, we then
standardized the scores to have a zero mean and unit variance within our analytic sample.
To assess students’ conscientiousness, we administered the Big Five Inventory (John &
Srivastava, 1999), a well-established 44-item survey measuring each of the “Big Five”
personality traits: neuroticism, extraversion, openness to experience, agreeableness, and

Running head: Promise and Paradox
11
conscientiousness. Students endorsed items (e.g., “I think I am someone who is a reliable
worker”) using a 5-category Likert scale, where 1= strongly disagree and 5 = strongly agree.
Each student’s conscientiousness score is calculated as the average of their responses to the 9
items that comprise the conscientiousness scale. Among the students in our data, this
conscientious scale had an internal reliability score of 0.76.
Our measure of self-control is based on the Impulsivity Scale for Children, an 8-item
survey developed to measure school-age students’ impulsivity, defined as the “inability to
regulate behavior, attention, and emotions in the service of valued goals” (Tsukayama et al.,
2013, p. 879). This survey asked students to indicate how often during the past school year they
exhibited each of a set of behaviors indicative of a lack of self-control, with 5 response options
ranging from “almost never” to “at least once a day.” Importantly, the use of response categories
specifying objective, discrete time periods was motivated by a desire to “avoid reference bias” in
students’ responses (Tsukayama et al., 2013, p. 881). The survey included 4 items measuring
interpersonal self-control (e.g., “I interrupted other students while they were talking”) and 4
items measuring intrapersonal self-control (e.g., “I forgot something I needed for class”). We
calculated an overall self-control score for each student as the average of their (reverse-coded)
responses to all 8 items. This scale had an internal reliability of 0.83.
Students also completed the 8-item Short Grit Scale (Grit-S) developed by Duckworth
and Quinn (2009) to measure trait-level persistence toward long-term goals.1 Students endorsed
a series of items (e.g., “New ideas and projects sometimes distract me from old ones” and “I
finish whatever I begin”) using a 5-category Likert Scale, where 1 = not like me at all and 5 =
very much like me. Students’ grit scores were then calculated as their mean response across all 8
1 Duckworth and Quinn (2009) demonstrate that adolescents’ Grit-S scores predict future GPA independently of IQ and are inversely related to the number of hours of television watched.

Running head: Promise and Paradox
12
items. This scale had somewhat lower internal reliability (α=0.64) among the students in our
sample than the conscientiousness and self-control scales.
Finally, to probe students’ implicit theory of intelligence, we administered a set of three
items measuring the extent to which students view intelligence as a fixed trait rather than one
which can improved with effort (Dweck, 2006). For example, students were asked to rate their
agreement with the claim that “You have a certain amount of intelligence, and you really can’t
do much to change it.” Following Blackwell et al. (2007), we used a 6-category Likert scale,
where 1 = strongly disagree and 6 = strongly agree. After reverse coding, we calculated each
student’s mean response across these three items to create a scale with an internal reliability of
0.86. We refer to this scale as measuring the extent to which students have a growth mindset (as
opposed to a fixed mindset).2
Student Perceptions of School Climate
The battery of questionnaires students completed also included a set of 10 items probing
their school’s climate at their school. These items were derived from a survey developed by the
Tripod Project for School Improvement to measure various aspects of school or classroom
climate. Each item asked students to respond to a descriptive statement about their school using a
5-category Likert scale, where 1 = totally untrue and 5 = totally true. The overall set included
two items related to each of five dimensions of school climate: high expectations (e.g., “Teachers
at this school demand that students work hard”); teacher strictness (e.g., “Teachers are very strict
here”); clarity of rules (e.g., “Students understand what will happen to them if they break a
rule”); negative peer effects (e.g., “In this school, some students try to keep others from working
hard”); and student input (e.g., “Students in this school have a say in how things work”). We
2 Blackwell et al. (2007) show that adolescent students who exhibit a Growth Mindset have significantly higher rates of math test score growth than students who view intelligence as fixed.

Running head: Promise and Paradox
13
calculated school-level averages of students’ responses to the two items within each pair to
provide a summary measure of the relevant aspect of each school’s climate as perceived by its
students.
Achievement Gains
We also used our administrative data to generate measures of each student’s test score
gains in math and ELA between 4th- and 8th-grade. Specifically, we regressed students’ 8th-grade
MCAS test scores in the relevant subject on a cubic polynomial of their 4th-grade test scores in
both subjects and took the residual from that regression for each student. We use these
residualized gain scores, which capture the extent to which a student’s 8th-grade performance in
math and ELA exceeded expectations based on their performance four years earlier, to examine
the relationship between non-cognitive traits and improvements in test-score performance over
time.
Results
Student- and School-level Correlations of Non-cognitive Traits and Academic Indicators
Table 2 reports student-level Pearson product-moment correlations among the full set of
non-cognitive skills included in our analysis, 8th-grade test scores in math and ELA, and annual
counts of absences and suspensions in 8th grade. Given that conscientiousness, self-control, and
grit are closely related constructs, it is unsurprising that they are highly inter-related, with
correlations ranging from .43 to .66. Growth mindset is also positively and significantly
correlated with each of these measures, but at lower levels ranging from .08 (conscientiousness)
to .18 (grit).
Among the four non-cognitive measures, growth mindset is most strongly related to 8th-
grade test scores, with correlations of .32 (math) and .36 (ELA). Self-control is also significantly

Running head: Promise and Paradox
14
related to test scores, with correlations of .13 (math) and .10 (ELA). The correlations of both
conscientiousness and grit with test-score levels are positive in both subjects but small and
statistically insignificant.
Table 2 also confirms that these non-cognitive measures are related to suspensions and
absences, the two behavioral indicators available in our administrative data. All four non-
cognitive measures are negatively correlated with the total number of suspensions or absences a
student accumulated in 8th grade. All but two of those eight correlations are statistically
significant. Because both absences and suspensions are not normally distributed among the
students in our data, the strength of these relationships is difficult to interpret. Table 3 therefore
compares average absences and suspensions, as well as the percent of students who were
suspended at least once in 8th grade, for students in the top and bottom quartile of each non-
cognitive skill. This analysis confirms the existence of substantively important differences in
both behavioral indicators between students with relatively high and low self-reported non-
cognitive skills. For example, students in the bottom quartile of self-control are absent 2.8 more
days than students in the top quartile, suspended four times as often, and are almost three times
as likely to have been suspended at least once. Noteworthy differences between bottom- and top-
quartile students are also evident for conscientiousness (absences and suspensions), grit
(suspensions), and growth mindset (absences).
Table 4 examines the relationships between the non-cognitive measures and residualized
test-score gains, which capture students’ academic performance in 8th grade relative to
expectations based on their performance in 4th grade. The first column confirms that each of the
four non-cognitive measures is positively correlated with test-score gains in both math and ELA;
all but one of these correlations are statistically significant. The relationships are strongest for

Running head: Promise and Paradox
15
growth mindset, which has correlations with test-score gains of .21 and .17 in math and ELA,
respectively.
The second column of Table 4, however, reveals that the positive relationships between
test-score gains and three of the measures—conscientiousness, self-control, and grit—dissipate
and even reverse when we aggregate the data to the school level. Although none of the six
correlations reported for these variables is statistically significant due to the reduced sample size,
five are negative. In other words, although students who rate themselves higher in these areas
make larger test-score gains, schools with higher average student ratings have, if anything,
smaller average gains in achievement. Importantly, the same unexpected pattern is not evident
for growth mindset. For this non-cognitive measure, school-level correlations with test-score
gains are substantially stronger (0.66 and 0.48 in math and ELA, respectively) than the
analogous student-level correlations.
The final column in Table 4 confirms that the student-level relationships between
conscientiousness, self-control, and grit and test-score gains among students attending the same
school are consistently stronger than the same relationships across the sample as a whole. For
example, the magnitude of the relationship between self-control and test score growth increases
by 60 percent in math and 108 percent in ELA. In contrast, the student-level relationship
between growth mindset and test-score gains is modestly weaker when estimated within schools
rather than across the full sample.
On their own, the divergent student- and school-level correlations we observe for
conscientiousness, self-control, and grit do not establish that these measures are biased by school
context. It could be the case, for example, that teachers within a given school devote more
attention and resources to their most conscientious students at the expense of their least
Running head: Promise and Paradox
16
conscientious students, leading conscientious students to learn more than their same-school
peers. This would generate a positive within-school correlation between conscientiousness and
test-score gains even if the two variables were unrelated at higher levels of aggregation. Yet the
lack of a positive school-level relationship could also reflect a tendency on the part of students in
schools with more demanding academic environments to rate their non-cognitive skills more
critically. To examine this possibility, we turn now to a more focused comparison of students
attending over-subscribed charter and open-enrollment district schools.
Mean Non-cognitive Traits and Test-score gains by School Type
Table 5 compares the mean test-score gains and non-cognitive traits for students
attending the 22 open-enrollment district and 5 over-subscribed charter schools included in our
sample. Consistent with the descriptive statistics in Table 1, mean residualized test-score gains
between 4th and 8th grade are higher among students attending charter schools. The differences
are substantial, at 0.67 standard deviations in math and 0.47 standard deviations in ELA.
Despite the fact that sampled students attending charter schools experienced larger test-
score gains than sampled students in district schools, the same students exhibit markedly lower
average levels of self-control as measured by student self-reports. This statistically significant
difference of -0.23 standard deviations is in the opposite direction of that expected based on the
positive student-level correlations between self-control and test-score gains evident in Table 2.
The average differences between the charter and district students in conscientiousness (-0.09)
and grit (-0.13), although statistically insignificant, run in the same counter-intuitive direction.
Interestingly, the difference in average growth mindset between charter school and
district school students follows a different pattern than the other three non-cognitive skills.
Charter school students score 0.38 standard deviations higher, on average, which is consistent

Running head: Promise and Paradox
17
with the student-level correlation between growth mindset and test-score gains within the sample
as a whole.
Lottery-Based Estimates of the Effect of Charter School Attendance
Simple comparisons of the outcomes of students attending charter and district public
schools, such as those presented in Table 5, capture both any effects of attending a charter school
on those outcomes and selection into charter schools based on characteristics correlated with the
outcome. Although over-subscribed charter schools must admit students via lottery, applicants
who seek to enroll in an academically demanding charter school are likely to differ from those
who do not along both observed and unobserved dimensions. To better isolate the causal effect
of attendance at the five over-subscribed charter schools represented in our sample, we exploit
the lottery admissions process to these schools to restrict our comparisons to students who
entered the admissions lottery of one or more of the over-subscribed charter schools.
We acquired records from the lotteries used to admit the students in our sample directly
from the charter schools and matched these records to state administrative data on all public
school students using names, year, and grade of application. Of 702 verified lottery participants,
497 appeared in the administrative data and had valid demographic data and test scores for both
subjects in 2007 and 2011. A smaller subset of 200 students met those requirements and
participated in the non-cognitive data collection. Although we can produce lottery-based
estimates of charter school impacts on non-cognitive traits only in the latter sample, we present
estimated impacts on test scores for both groups in order to compare the results across samples.
To the extent that our estimated impacts on test scores are similar across the two groups, it
should reduce concerns that our results are biased due to non-random sampling of successful and
unsuccessful applicants.

Running head: Promise and Paradox
18
Table 6 examines whether the demographic characteristics and 4th-grade test scores of
students offered and not offered admission to a charter school were balanced within these two
subsamples of lottery participants. We first note that within both subsamples the share of
applicants who were offered admission (32 percent in the administrative data sample and 29
percent in the non-cognitive sample) is very similar to the share among all lottery applicants (31
percent). F-tests nonetheless reveal that students’ observed characteristics are jointly significant
predictors of whether they were offered a seat in a charter school in both samples.
In the larger sample of students matched to the administrative data, students receiving an
offer are significantly more likely to be male and eligible for a free or reduced price lunch. The
4th-grade test scores of students offered a seat are also modestly lower in both math and ELA,
though these differences are not statistically significant. Within the smaller non-cognitive
sample, the differences in 4th-grade test scores are substantial in both subjects and marginally
statistically significant in math (p<0.09). These differences, which favor students not offered a
charter school seat, may reflect the fact that positive selection into the non-cognitive sample was
less pronounced in over-subscribed charter schools (see Table 1) and should bias our results
against finding positive impacts of charter attendance on test scores. Given the imbalances
between students offered and not offered a seat in a charter in both samples, we control for
students’ observed characteristics and 4th-grade test scores throughout our lottery-based analysis
of the effects of charter school attendance.
Following (Abdulkadiroglu et al., 2011), we implement the lottery-based analysis via a
Two Stage Least Squares (2SLS) regression model in which we first predict charter attendance
for each student based on whether they were offered admission and use those predictions to
Running head: Promise and Paradox
19
generate an estimate of the effect of charter attendance on our outcomes of interest. The first-
stage model is:
𝑌𝐸𝐴𝑅𝑆𝑖 = 𝛾𝑐𝑂𝐹𝐹𝐸𝑅𝑖𝑐 + 𝜃𝐴𝑖,𝑡−4 + 𝜏𝑋𝑖+�𝜌𝑗𝑑𝑖𝑗𝑗
+ 𝜉𝑖𝑠
where 𝑌𝐸𝐴𝑅𝑆𝑖 measures the number of years between 5th and 8th grade student i attended an
over-subscribed charter school and 𝑂𝐹𝐹𝐸𝑅𝑖𝑐 represents a vector of dummy variables indicating
that the student was or was not offered a seat at over-subscribed charter school c. We include as
controls cubic polynomials of lagged 4th-grade scores in math and ELA (𝐴𝑖,𝑡−4) and a vector of
student demographic characteristics (𝑋𝑖) including gender, race, age, free and reduced-priced
lunch status, limited English proficiency, and special education status. The set of indicator
variables 𝑑𝑖𝑗 controls for lottery “risk sets,” or the unique combination of lotteries to which each
student applied, indexed by j.
Within the administrative data sample, students offered a seat in at least one of the five
over-subscribed charter schools spent an average of 2.1 years between 5th and 8th grade in one of
those schools, as compared to 0.39 years among students not initially offered a seat. Among
students in the non-cognitive sample, students offered and not offered a seat spent 2.4 and 0.6
years in charter schools, respectively.3 Appendix Table A1, which presents the first-stage
regression results, confirms that the 𝑂𝐹𝐹𝐸𝑅𝑖𝑐 indicators are relevant instruments for predicting
variation in years of attendance, with joint F-test statistics of 35.5 and 16.0 for the administrative
data and non-cognitive samples, respectively.
We implement the second stage of our 2SLS model as follows:
3 As this result implies, some lottery participants not initially offered admission to a charter school ultimately attend by moving off of a charter school wait list after the time period captured in our data, entering a future lottery for a subsequent grade, or gaining admissions preference as a sibling when a sibling wins a lottery.

Running head: Promise and Paradox
20
𝑌𝑖𝑠 = 𝛽𝑌𝑒𝑎𝑟𝑠� 𝑖+ 𝛼𝐴𝑖,𝑡−4 + 𝜆𝑋𝑖 + �𝛿𝑗𝑑𝑖𝑗𝑗
+ 𝜖𝑖𝑠
where 𝑌𝑖𝑠 represents a given test score or non-cognitive outcome for student i in school s,
𝑌𝐸𝐴𝑅𝑆� 𝑖𝑠 captures each student’s predicted years of charter attendance based on the first-stage
regression, and all other variables are as above. Parameter 𝛽 is the quantity of interest: the effect
of one year’s attendance at any of the five over-subscribed charter schools.
We present the results of these analyses in Table 7. Consistent with Abdulkadiroglu et al.
(2011), the first two columns show that, among the students in the administrative data sample,
each additional year of charter attendance is estimated to increase 8th-grade math scores by 0.13
standard deviations. The estimated effect for ELA scores is positive and of non-negligible
magnitude, but too imprecisely estimated to achieve statistical significance. We replicate these
analyses in our non-cognitive sample and find very similar point estimates in both math and
ELA; the math effect is statistically significant at the p< 0.1 confidence level. The similarity of
results across the two samples suggests that our lottery-based effect estimates on non-cognitive
skills are unlikely to suffer from substantial biased due to non-random sampling of students who
participated in our non-cognitive data collection.
Within that sample, we estimate that one year’s attendance at an over-subscribed charter
school had a statistically significant negative effect on students’ self-reported self-control and
grit and a marginally significant negative effect on self-reported conscientiousness. The
estimated effect sizes are in the opposite direction of the achievement effects and of similar or
even larger magnitude, ranging between -0.12 (grit) and -0.21 (self-control) standard deviations.
These results are consistent with the descriptive patterns in Table 5, which show students in
over-subscribed charter schools making larger achievement gains despite lower scores on these

Running head: Promise and Paradox
21
non-cognitive measures, and suggest that those patterns are not due merely to selection. Rather,
it would appear that attending one of these charter schools adversely affects students’ non-
cognitive abilities along these dimensions as assessed by student self-reports. We discuss our
interpretation of this unexpected finding below.
Intriguingly, we estimate a near zero effect of attending an over-subscribed charter
schools on the degree to which a student in our non-cognitive sample has a growth mindset,
despite the fact that Table 5 showed students in over-subscribed charter schools scoring notably
higher on this measure. Although the estimate is not precise enough to rule out the possibility of
moderate positive (or negative) effects, the null result for this outcome in the lottery analysis
suggests that the descriptive difference favoring charter schools may be an artifact of selection.
In other words, it may be that students who believe that their intelligence can be improved with
effort are more likely to seek out a school with a demanding environment, but that attendance at
such a school has no causal effect on their implicit theory of intelligence.
Longitudinal Trends in Non-Cognitive Skills
We supplement our lottery analysis with longitudinal data tracking one grade cohort of
students in each of two over-subscribed Massachusetts charter schools and in one open-
enrollment district school over three years. Starting in fall 2009, we administered a battery of
questionnaires similar to that used in our main analysis to the entering student cohort at three
middle schools.4 We then re-administered the same battery at the end of that school year and the
two that followed. One of the charter schools and the district school are in Boston and part of our
larger study sample, while the second charter school is located in another school district but has a
“no excuses” orientation similar to that of the over-subscribed charter schools in our sample.
4 The questionnaires used to measure conscientiousness, grit, and growth mindset were identical to those used in the cross-sectional study; for self-control we used the 13-item Brief Self-Control Survey developed by Tangney et al. (2004).

Running head: Promise and Paradox
22
Figure 1 plots average scores for those students in the 2009 entering cohort of each
school for whom we have complete data across four time points.5 Consistent with our lottery-
based estimates of a negative impact of charter attendance on students’ conscientiousness, self-
control, and grit as assessed by self-reports, we observe a steady decline in each of these traits
among students attending the two charter schools as they progress through middle school. The
aggregate declines over three years are substantial, reaching 0.65 standard deviations in
conscientiousness, 0.78 standard deviations in self-control, and 0.59 standard deviations in grit.
Scores on these scales also appear to decline among students attending the open-
enrollment district school, but by a smaller amount; for conscientiousness and grit, the changes
between the first and final time points are statistically insignificant. The statistically significant
0.31 standard deviation decline in average self-control among district school students may reflect
normative, developmental decreases in self-control associated with adolescence (see, e.g.,
Steinberg, 2007). For example, it is very similar to the 0.28 standard deviation decline
Duckworth et al (2010, Table 1) observe over four years among students attending a magnet
middle school. The average changes in self-control in “no excuses” charter schools, as perceived
and reported by the students themselves, are roughly 2.5 times as large.
In contrast with the other three non-cognitive traits, we observe an increase of 0.49
standard deviations in growth mindset among students in over-subscribed charter schools. This
gain is mirrored, however, by a similarly large increase among students at the district school.
This pattern in the longitudinal data is again consistent with our lottery-based estimates, which
showed no impact of charter school attendance on growth mindset.
5 Each non-cognitive skill reported in Figure 1 is standardized to have mean zero and unit variance across all students when sampled at baseline in 2009. Appendix Table A2 reports sample sizes, means, and statistical significance of changes over time for this stable sample; Appendix Table A3 reports the same information using all data available in each year.
Running head: Promise and Paradox
23
Student Perceptions of School Climate by School Type
Our results thus far indicate that students attending over-subscribed charter schools
experience sharp declines in several self-reported measures of non-cognitive skills, both over
time and relative to students in open-enrollment public schools. These apparently adverse effects
of charter school attendance, however, could be an artifact of reference bias. In other words, it
could be that students use a higher bar when assessing their own conscientiousness, self-control,
and grit when they attend schools that establish high expectations for student effort and a “no-
excuses” disciplinary culture. In order to assess the plausibility of this explanation, we examine
whether students’ perceptions of the academic and disciplinary climate in open-enrollment
district and over-subscribed charter schools differ in a way that could influence students’ self-
ratings of their non-cognitive abilities.
Table 8 confirms that students attending over-subscribed charter schools perceive their
schools as having very different academic and disciplinary climates than students attending
open-enrollment district schools. Students in over-subscribed charter schools rate the work ethic
expected of students, teacher strictness, and the clarity of rules in their school substantially
higher than do students in district schools. For example, charter students’ ratings of expectations
exceed those of their district counterparts by 0.57 on the 5-point scale used for these items, or 63
percent of a standard deviation of district students’ responses. The analogous differences
observed for teacher strictness and clear rules are of comparable magnitude. Students in the over-
subscribed charter schools also reported substantially lower levels of negative peer effects and
modestly lower levels of student input in their schools. In sum, the academic and disciplinary
climates of the over-subscribed charter schools in our sample do appear to differ in ways that

Running head: Promise and Paradox
24
could lead their students to use a higher bar when assessing their conscientiousness, self-control,
and grit.
Discussion
Generations of parents have sought to instill in their children the virtues of diligence,
self-discipline, and perseverance. These qualities are at the core of the legends and fables that
societies around the world have developed to cultivate the skills, beliefs, and traits understood to
be essential for human flourishing. In recent decades, scholars have begun to confirm this
common wisdom by developing measures for these non-cognitive skills and examining their
relationship with children’s success in school and in life. We add to this literature new evidence
that four prominent and widely used measures of non-cognitive skills are positively correlated
with achievement gains on standardized tests among a large and diverse sample of 8th-grade
students attending distinctly different types of schools. Measures of conscientiousness, self-
control, grit, and growth mindset were all positively correlated with attendance, behavior, and
math and ELA test score gains from 4th to 8th grade. Higher non-cognitive ability along the
dimensions captured by these measures may help explain why some 8th-grade students attend
school more consistently, are disciplined less, and score better than predicted by their 4th-grade
achievement levels.
However, a paradox emerges when we juxtapose these results with four additional
findings. First, the positive correlation between conscientiousness, self-control, and grit and test-
score gains is not evident at the school-level. Second, students in a set of over-subscribed charter
schools where students make unusually large test score gains report lower average levels of
conscientiousness, self-control, grit than students in open-enrollment district schools. Third,
lottery-based analyses of the causal impact of attending these charter schools indicate negative

Running head: Promise and Paradox
25
effects on these non-cognitive traits as assessed by self-reports. Finally, longitudinal data from
two charter schools indicates marked declines in the same skills over time.
While it is possible that the academic gains posted by these schools occur despite or even
at the expense of adverse effects on important non-cognitive skills, an alternative explanation is
that these paradoxical findings reflect reference bias. More specifically, students attending
academically and behaviorally demanding charter schools may redefine upward their notion of
what it means to demonstrate conscientiousness, self-control, and grit—and thus rate themselves
more critically. In theory, such reference bias could be severe enough to distort the magnitude of
any changes in the underlying traits and even to invert their sign.
We find support for this alternative hypothesis not only in our own data on students’
perceptions of school climate, but also in other recent evaluations of “no excuses” charter middle
schools. Most notably, in a lottery-based study that includes the three charter schools in our
sample with high school grades, Angrist et al. (2013b) show that charter attendance increased
Advanced Placement test-taking and performance and the likelihood of attending a 4-year post-
secondary institution. Though not the exact same schools and sample, these findings are difficult
to reconcile with an authentic reduction in students’ non-cognitive skills. Tuttle et al. (2013) find
large positive effects of attending a KIPP middle school on student test scores and time spent on
homework, but no effects on student-reported measures of self-control and persistence in school.
Similarly, Dobbie and Fryer (2013) find that attending the Harlem Promise Academy reduced
student-reported grit despite having positive effects on test scores and college enrollment and
negative effects on teenage pregnancy (for females) and incarceration (for males). This parallel
evidence from research in similar settings increases our confidence that reference bias stemming
from differences in school climate offers the most likely explanation for our unexpected findings.

Running head: Promise and Paradox
26
Our findings with respect to growth mindset are quite different. We find little evidence
that our measure of this construct is subject to the same paradoxical patterns as the other three
measures. It may be that growth mindset is less susceptible to reference bias than the other three
skills we consider because it is a measure of internal beliefs, rather than behaviors benchmarked
against external ideals. Coming to class prepared, or controlling one’s emotions when provoked,
are desirable behaviors for which students may hold different standards for what is “good
enough.” The items on our questionnaire probing growth mindset, in contrast, ask all students to
report the extent they agree with specific statements of personal belief (e.g., “Your intelligence is
something about you that you can’t change very much”).
Taken at face value, our results suggest that the higher average growth mindset scores
observed among students in Boston’s over-subscribed charter schools are due to selection and
that attendance at a charter school has no impact on students’ academic mindset. Indeed, it seems
plausible that students who already believe that their intelligence can be improved with effort
would be more likely to seek out a rigorous academic environment. Such a pattern of selection
could not account for the strong positive impacts on achievement of attending these schools
documented by lottery-based studies, which make comparisons only among charter school
applicants. It does suggest, however, that those positive impacts could be driven in part by peer
effects resulting from the schools’ success in attracting cohorts of students who share a common
mindset conducive to academic success.
Conclusion
The findings presented in this paper suggest three broad conclusions. First, existing
measures of four prominent non-cognitive skills based on self-reports help to explain the

Running head: Promise and Paradox
27
proximate outcomes of student behavior and test-score gains in middle school. Efforts by schools
to measure and influence those skills may therefore be a promising way to support students’
academic success. To the extent that these skills prove to be malleable in school settings,
interventions that target them may yield improvements in academic outcomes in addition to any
long-term benefits that could accrue if school-induced changes in non-cognitive skills persist into
adulthood.
Second, we have shown that schools can have significant, even if initially surprising,
impacts on students’ non-cognitive skills as assessed through self-reports. If we are correct that
the apparent negative effects of attending a “no excuses” charter school on conscientiousness,
self-control, and grit are due to reference bias, than what these schools influence are the
standards to which students hold themselves when evaluating their behavior. The consequences
of this shift in normative standards for their actual behavior both within and outside the school
environment deserve further research.
Finally, we have shown that findings about school impacts on non-cognitive skills based
on self-reports may be misleading due to reference bias resulting from differences in school
climate. This appears to be particularly true of skills reflected in behaviors readily observed in
one’s peers and may be less of a problem for attributes like growth mindset that reflect internal,
privately held beliefs. The challenges posed by reference bias may grow more severe over time
to the extent that schools work explicitly to change students’ habits and thereby alter their
normative standards.
Our study has several limitations. First, our evidence of the importance of reference bias
is circumstantial rather than direct. Second, we have documented the potential problem posed by
reference bias without offering a solution to overcome it. In particular, we have not examined

Running head: Promise and Paradox
28
whether teacher or parent ratings of students’ non-cognitive skills are less prone to reference bias
than are self-reports. Other possible solutions could include the use of anchoring vignettes within
surveys to establish consistent reference points (King et al., 2004) or the development of
behavioral indicators of non-cognitive skills that render reference points irrelevant (Jackson et
al., 2010; Hitt and Trivitt 20013).6 Additional research to document the conditions under which
reference bias influences the measurement of students’ non-cognitive skills and validate
strategies to correct it is also critical.
The current policy environment demands accountability, and accountability requires
assessment. In the rush to embrace non-cognitive skills as the missing piece in American
education, policymakers may overlook the limitations of extant measures. Our results raise
important questions about the practice of assessing students’ non-cognitive skills based on the
existing instruments that rely on student self-reports. In particular, evaluations of the effects of
teacher, school, and family influences on non-cognitive skills could lead to false conclusions if
the assessments used are biased by distinct frames of reference. Biased measures could similarly
misguide scientific investigation of non-cognitive skills.
If we are correct that these measures show both promise and peril, it is imperative that the
scholars and practitioners seeking to improve non-cognitive skills through schooling develop
new, better measures that are less susceptible to reference bias. Unbiased measures of non-
cognitive skills that are robust across a range of school settings could play a constructive role in
supporting students’ academic and personal growth. We can and should measure students’ non-
cognitive skills, but we should do so in full recognition of the flaws in our measures.
6 Kyllonen and Bertling (2013) show that anchoring-vignette adjustments of student responses can strengthen within-country correlations and reverse paradoxical negative cross-country correlations between test scores and multiple scales included in the background questionnaire of the 2012 Programme for International Student Assessment, suggesting that this may be a promising approach to addressing reference bias in low-stakes settings.
Running head: Promise and Paradox
29
References
Abdulkadiroglu, A., Angrist, J. D., Dynarski, S. M., Kane, T. J., & Pathak, P. A. (2011). Accountability and flexibility in public schools: Evidence from Boston's charters and pilots. Quarterly Journal of Economics 126(2), 699-748.
Almlund, M., Duckworth, A. L., Heckman, J. J., & Kautz, T. D. (2011). Personality psychology and economics. In E. A. Hanushek, S. Machin, & L. Woessmann (Eds.), Handbook of the economics of education. (vol. 4) (pp. 1-181). Amsterdam: Elsevier, North-Holland.
Angrist, J. D., Pathak, P. A., & Walters, C. R. (2013a). Explaining charter school effectiveness. American Economic Journal: Applied Economics 5(4), 1-27.
Angrist, J. D., Cohodes, S. R., Dynarski, S. M., & Pathak, P. A. (2013b). Stand and deliver:
Effects of Boston’s charter schools on college preparation, entry, and choice. NBER Working Paper No. 19275. Cambridge, MA: National Bureau of Economic Research.
Bandura, A. (1999). Social cognitive theory of personality. In L. A. Pervin & O. P. John (Eds.), Handbook of personality psychology (2nd ed.) (pp. 154-196). New York: Guilford Publications.
Baron, J. (1982). Personality and intelligence. In R. J. Sternberg (Ed.), Handbook of human
intelligence (pp. 308-351). Cambridge, Cambridgeshire, and New York: Cambridge University Press.
Blackwell, L. S., Trzesniewski, K. H., & Dweck, C. S. (2007). Implicit theories of intelligence predict achievement across an adolescent transition: A longitudinal study and an intervention. Child Development 78(1), 246-263.
Borghans, L., Duckworth, A. L., Heckman, J. J., & ter Weel., B. (2008). The economics and psychology of personality traits. Journal of Human Resources 43(1), 9722-1059.
Cunha, F. & Heckman, J. J. (2008). Formulating, identifying and estimating the technology of cognitive and noncognitive skill formation. Journal of Human Resources 43(4), 738-782.
Dee, T. S., & West, M. R. (2011). The non-cognitive returns to class size. Education Evaluation and Policy Analysis, 33(1), 23-46.
Dobbie, W. & Fryer Jr., R. G. (2013). The medium-term impacts of high-achieving charter schools on non-test score outcomes. NBER Working Paper No. 19581. Cambridge, MA: National Bureau of Economic Research.
Duckworth, A. L. & Carlson, S. M. (2013). Self-regulation and school success. In B. W. Sokol, F. M. E. Grouzet, & U. Muller (Eds.), Self-regulation and autonomy: Social and

Running head: Promise and Paradox
30
developmental dimensions of human conduct (pp. 208-230). New York: Cambridge University Press.
Duckworth, A. L. & Seligman, M. E. P. (2005). Self-discipline outduels IQ in predicting academic performance of adolescents. Psychological Science 16(12), 939-944.
Duckworth, A. L., Peterson, C., Matthews, M. D., & Kelly, D. R. (2007). Grit: Perseverance and passion for long-term goals. Journal of Personality and Social Psychology 92(6), 1087-1101.
Duckworth, A. L. & Quinn, P. D. (2009). Development and validation of the short grit scale (Grit-S). Journal of Personality Assessment 91(2), 166-174.
Duckworth, A. L., Tsukayama, E., & May, H. (2010). Establishing causality using hierarchical linear modeling: An illustration predicting achievement from self-control. Social Psychological and Personality Science 1(4), 311-317.
Durlak, J. A., Dymnicki, A. B., Taylor, R., Weissberg, R. P., & Schellinger, K. B. (2011). The impact of enhancing students’ social and emotional learning: A meta-analysis of school-based universal interventions. Child Development 82(1), 405-432.
Dweck, C. S. (2006). Mindset: The new psychology of success. New York: Random House.
Evans, G. W. & Rosenbaum, J. (2008). Self-regulation and the income-achievement gap. Early Childhood Research Quarterly 23(4), 504-514.
Finn, A. S., Kraft, M. A., West, M. R., Leonard, J. A., Bish, C. E., Martin, R. E., Sheridan, M. A., Gabrieli, C. F. O., & Gabrieli, J. D. E. (In press). Cognitive skills, student achievement tests, and schools. Psychological Science.
Heckman, J. J., Pinto, R. & Savelyev, P. (2013). Understanding the mechanisms through which an influential early childhood program boosted adult outcomes. American Economic Review 103(6), 2052-2086.
Heckman, J. J. & Kautz, T. (2013). Fostering and measuring skills: Interventions that improve character and cognition. In J. J. Heckman, J. E. Humphries, & T. Kautz (Eds.). The myth of achievement tests: The GED and the role of character in American life (pp. 341-430). Chicago: University of Chicago Press.
Heine, S. J., Buchtel, E. E., & Norenzayan, A. (2008). What do cross-national comparisons of personality traits tell us? The case of conscientiousness. Psychological Science 19(4), 309–313.
Hitt, C. & Trivitt, J. (2013). Don’t know? Or don’t care? Predicting educational attainment using survey response rates and coding speed tests as measures of conscientiousness. EDRE Working Paper 2013-05. University of Arkansas.

Running head: Promise and Paradox
31
Jackson, J. J., Wood, D., Bogg, T., Walton, K. E., Harms, P. D., & Roberts, B. W. (2010). What do conscientious people do? Development and validation of the Behavioral Indicators of Conscientiousness (BIC). Journal of Research in Personality 44(4), 501-511.
John, O. P. & Srivastava, S. (1999). The Big Five trait taxonomy: History, measurement, and theoretical perspectives. In L. A. Pervin & O. P. John (Eds.), Handbook of personality: Theory and research (2nd ed.) (pp. 102-138). New York: Guilford Press.
King, G., Murray, C. J. L., Salomon, J. A., & Tandon, A. (2004). Enhancing the validity and cross-cultural comparability of measurement in survey research. American Political Science Review 98(1), 191–205.
Kyllonen, P. C. & Bertling, J. P. (2013). Innovative questionnaire assessment methods to
increase cross-country comparability. In L. Rutkowski, M. von Davier, & D. Rutkowski (Eds.), Handbook of international large-scale assessment data analysis. London: Chapman and Hall/CRC.
Lake, R., Bowen, M., Demeritt, A., McCullough, M., Haimson, J., & Gill, B. (2012). Learning from charter school management organizations: Strategies for student behavior and teacher coaching. Washington DC: Center on Reinventing Public Education and Mathematica Policy Research.
Messick, S. (1979). "Potential uses of noncognitive measurement in education." Journal of Educational Psychology 71(3), 281.
Moffitt, T. E., Arseneault, L., Belsky, D., Dickson, N., Hancox, R. J., Harrington, H., Houts, R., Poulton, R., Roberts, B. W., Ross, S., Sears, M. R., Thomson, W. M., & Caspi, A. (2011). A gradient of childhood self-control predicts health, wealth, and public safety. Proceedings of the National Academy of Sciences 108(7), 2693-2698.
National Research Council (2012). Education for life and work: Developing transferable knowledge and skills for the 21st Century. Washington, DC: The National Academies Press.
Naumann, L. P. & John, O. P. (2013). Toward a domain-specific approach to cultural differences: The influence of cultural values and reference-group standards on self-reported personality. Unpublished manuscript.
Paulhus, D. L. (1991). Measurement and control of response bias. In J. P. Robinson, P. R. Shaver, & L. S. Wrightsman (Eds.), Measures of personality and social psychological attitudes (pp. 17-59). San Diego: Academic Press.
Peng, K., Nisbett, R. E., & Wong, N. Y. C. (1997). Validity problems comparing values across cultures and possible solutions. Psychological Methods 2(4), 329-344.

Running head: Promise and Paradox
32
Peterson, C. and Seligman, M. E. P. (2004). Character Strengths and Virtues: A Handbook and Classification. Oxford: Oxford University Press.
Poropat, A. E. (2011). “A meta-analysis of the five-factor model of personality and academic performance.” Psychological Bulletin 135(2), 322-338.
Robbins, S. B., Allen, J., Casillas, A., Peterson, C. H., & Le, H. (2006). Unraveling the differential effects of motivational and skills, social, and self-management measures from traditional predictors of college outcomes. Journal of Educational Psychology 98(3), 598-616.
Schmitt, D. P., McRae, R. R., & Benet-Martinez, V. (2007). The geographic distribution of big five personality traits: Patterns and profiles of human self-description across 56 nations. Journal of Cross-Cultural Psychology 38(2), 173-212.
Seider, S. (2012). Character Compass: How Powerful School Culture Can Point Students Toward Success. Cambridge, MA: Harvard Education Press.
Steinberg, L. (2007). Risk taking in adolescence: New perspectives from brain and behavioral science. Current Directions in Psychological Science 16(2), 55-59.
Tangney, J.P., Baumeister, R.F., & Boone, A.L. (2004). High self-control predicts good adjustment, less pathology, better grades, and interpersonal success. Journal of Personality, 72(2), 271–322.
Tough, P. (2012). How Children Succeed: Grit, Curiosity, and The Hidden Power of Character. New York: Houghton Mifflin Harcourt.
Tsukayama, E., Duckworth, A. L., & Kim, B. (2013). Domain‐specific impulsivity in school‐age children. Developmental Science 16(6), 879-893.
Tuttle, C. C., Gill, B., Gleason, P., Knechtel, V., Nichols-Barrer, I., & Resch, A. (2013). KIPP
middle schools: Impacts on achievement and other outcomes. Washington DC: Mathematica Policy Research.
Van de Gaer, E., Grisay, A., Schulz, W., & Gebhardt, E. (2012). The reference group effect: An
explanation of the paradoxical relationship between academic achievement and self-confidence across countries. Journal of Cross-Cultural Psychology, 43(8), 1205-1228.
Yeager, D. S., Paunesku, D., Walton, G. W., & Dweck, C. (2013). How can we instill productive
mindsets at scale? A review of the evidence and an initial R&D agenda. White Paper prepared for the White House meeting on Excellence in Education: The Importance of Academic Mindsets.

Running head: Promise and Paradox
Figure 1. Mean student non-cognitive traits in three middle schools over time
Notes: N=61 for Charter School 1; N=43 for Charter School 2; N=65 for District School. Years cover grades 5-7 in Charter School 1 and grades 6-8 in Charter School 2 and District School. Scores are standardized relative to the full sample in Fall Y1.

Running head: Promise and Paradox
Table 1: Mean student demographic characteristics and academic indicators by school type among all public schools in Boston, sampled schools, and sampled students
Public Schools
in Boston Open-enrollment District Schools
Over-subscribed Charter Schools
All Students
All Students in Sampled
Schools Sampled Students
All Students in Sampled
Schools Sampled Students
All Students in Sampled
Schools Sampled Students
Male 0.52 0.51 0.47 0.53 0.49 0.43 0.43 African-American 0.41 0.40 0.38 0.41 0.39 0.53 0.50 White 0.12 0.12 0.13 0.08 0.08 0.17 0.18 Asian 0.09 0.07 0.09 0.03 0.05 0.02 0.01 Hispanic 0.37 0.39 0.39 0.46 0.46 0.27 0.30 Free/Reduced Price Lunch 0.79 0.78 0.77 0.86 0.87 0.66 0.66 Limited English Proficient 0.12 0.12 0.11 0.17 0.16 0.00 0.00 Special Education 0.22 0.22 0.19 0.27 0.23 0.16 0.18 8th-Grade Math -0.32 -0.24 -0.08 -0.63 -0.49 0.36 0.41 8th-Grade ELA -0.44 -0.36 -0.23 -0.67 -0.55 0.20 0.21 4th-Grade Math -0.47 -0.46 -0.36 -0.74 -0.66 -0.42 -0.38 4th-Grade ELA -0.57 -0.55 -0.46 -0.85 -0.79 -0.45 -0.42 Suspensions 0.25 0.22 0.19 0.19 0.16 0.39 0.31 Absences 11.85 11.03 9.00 12.95 10.61 7.88 7.14 Number of schools 49 32 32 22 22 5 5 Number of students 3151 2121 1368 1483 906 234 148 Note: All samples are restricted to students with valid 2011 and 2007 MCAS scores. Sampled schools are schools participating in non-cognitive trait data collection; sampled students are those with valid data on at least one non-cognitive trait. Math and ELA test scores are standardized to have mean zero and unit variance statewide.

Running head: Promise and Paradox
Table 2: Correlation matrix of non-cognitive skills and academic indicators
Consc. Self-
control Grit Growth Mindset
8th-Grade Math
8th-Grade ELA
Susp. Absences
Conscientiousness 1 Self-control 0.47*** 1
Grit 0.66*** 0.43*** 1 Growth Mindset 0.08** 0.10*** 0.18*** 1
8th-Grade MCAS Math 0.05* 0.13*** 0.03 0.32*** 1 8th-Grade MCAS ELA 0.05* 0.10*** 0.04 0.36*** 0.69*** 1
Suspensions -0.06* -0.14*** -0.12*** -0.04 -0.10*** -0.11*** 1 Absences -0.06* -0.12*** -0.03 -0.10*** -0.30*** -0.25*** 0.13*** 1
Note: ***p<0.001, ** p<0.01, *p<0.05. Sample restricted to students with complete data on each indicator (N=1,340).

Running head: Promise and Paradox
Table 3: Absences and suspensions by non-cognitive skill quartile
Absences Suspensions Percent suspended
Bottom Top Difference Bottom Top Difference Bottom Top Difference
Conscientiousness 9.56 7.76 1.80** 0.20 0.09 0.11* 12.2 7.2 5.0*
(8.63) (8.00) (0.66) (0.68) (0.34) (0.04) (32.8) (25.9) (0.2)
Self-control 10.30 7.42 2.80*** 0.28 0.07 0.21*** 15.8 5.7 10.1***
(9.07) (7.62) (0.66) (0.84) (0.29) (0.05) (36.6) (23.3) (2.4)
Grit 8.99 8.23 0.76 0.28 0.09 0.19*** 15.1 6.2 8.9***
(8.62) (7.92) (0.64) (0.88) (0.38) (0.06) (35.9) (24.1) (2.4)
Growth Mindset 10.48 7.73 2.75*** 0.21 0.14 0.08 13.5 9.0 4.5
(9.88) (7.70) (0.70) (0.74) (0.57) (0.05) (34.2) (28.7) (2.5)
Note: ***p<0.001, ** p<0.01, *p<0.05. Sample restricted to students with complete data on each indicator (N=1,340).

Running head: Promise and Paradox
Table 4: Student- and school-level relationships between non-cognitive skills and test-score gains
Overall,
Student-level Overall,
School-level Within-School, Student-level
4th-8th MCAS Math Gains Conscientiousness 0.106** -0.118 0.154***
(0.030) (0.181) (0.032)
Self-control 0.083* -0.026 0.133***
(0.036) (0.183) (0.030)
Grit 0.120** 0.030 0.166***
(0.033) (0.182) (0.033)
Growth Mindset 0.216*** 0.662*** 0.169***
(0.038) (0.137) (0.043)
4th-8th MCAS ELA Gains
Conscientiousness 0.084** -0.159 0.115***
(0.028) (0.180) (0.030)
Self-control 0.040 -0.063 0.083**
(0.028) (0.182) (0.029)
Grit 0.079* -0.055 0.104*
(0.036) (0.182) (0.039)
Growth Mindset 0.167*** 0.482** 0.165***
(0.041) (0.160) (0.036)
Observations 1,340 32 1,340 Note: ***p<0.001, ** p<0.01, *p<0.05. Each cell presents results from a separate regression. Standard errors reported in parentheses are clustered by 8th-grade school. Within-school regressions include fixed effects for schools. Non-cognitive skills are standardized to have mean zero and unit variance in the study sample.

Running head: Promise and Paradox
Table 5: Mean test-score gains and non-cognitive skills by school type
Open-enrollment District School
Over-subscribed Charter School
Difference
MCAS Math Gain (4th-8th) -0.016 0.656 0.673**
(0.664) (0.654) (0.114)
[906] [148]
MCAS ELA Gain (4th-8th) -0.013 0.453 0.466**
(0.734) (0.751) (0.129)
[906] [148]
Conscientiousness 0.022 -0.069 -0.091
(0.994) (0.981) (0.078)
[890] [145]
Self-control 0.001 -0.225 -0.226*
(1.017) (0.969) (0.116)
[891] [145]
Grit 0.033 -0.101 -0.133
(0.986) (1.009) (0.093)
[888] [145]
Growth Mindset -0.121 0.260 0.381**
(1.016) (0.95) (0.104)
[887] [144]
Note: ** p<0.01, *p<0.05, +p<0.1. Statistical significance is for difference in mean for over-subscribed charter schools and traditional public schools. In the first two columns, standard deviations are reported in parentheses and sample sizes in brackets. Standard errors reported in parentheses in the third column are adjusted for clustering by school. MCAS scores are standardized to have mean zero and unit variance statewide; non-cognitive skills are standardized to have mean zero and unit variance in the study sample.

Running head: Promise and Paradox
Table 6: Balance of observed characteristics in admissions lotteries for over-subscribed charter schools
Administrative Data Sample Non-cognitive Sample
Offer No Offer
Regression-Adjusted
Difference P-value Offer No Offer
Regression-Adjusted
Difference P-value
Male 0.501 0.437 0.100 0.099 0.420 0.368 0.054 0.532 African-American 0.590 0.513 0.013 0.779 0.517 0.544 -0.124 0.145 White 0.100 0.171 0.008 0.828 0.112 0.211 0.001 0.980 Asian 0.009 0.025 -0.016 0.312 0.014 0.018 0.007 0.691 Hispanic 0.277 0.278 -0.016 0.760 0.350 0.228 0.107 0.140 Free/Reduced Price Lunch 0.687 0.563 0.107 0.022 0.657 0.579 0.007 0.926 Limited English Proficient 0.032 0.070 -0.049 0.129 0.021 0.035 -0.022 0.530 Special Education 0.195 0.209 -0.003 0.956 0.140 0.123 0.009 0.884 4th Grade MCAS Math -0.527 -0.415 -0.080 0.306 -0.349 -0.095 -0.187 0.091 4th grade MCAS ELA -0.520 -0.358 -0.127 0.236 -0.356 0.074 -0.300 0.110 Joint F-test statistic
0.003
0.000
Observations 339 158 143 57 Note: Administrative data sample includes all applicants to over-subscribed charter schools matched to valid 2011 and 2007 test scores in the Massachusetts Department of Elementary and Secondary Education state database. Study sample includes students in the administrative data sample with valid data on at least one non-cognitive outcome. The first two columns for each sample provide the mean of each variable for students receiving at least one and no offers of admission to an over-subscribed charter school. Regression-adjusted differences control for fixed effects for lottery applicant risk sets used to estimate charter attendance effects. P-values are for the regression-adjusted difference.

Running head: Promise and Paradox
Table 7: Instrumental variables estimates of the effects of a year's attendance at an over-subscribed charter school
Administrative Data
Sample Non-cognitive
Sample 8th Grade MCAS Math 0.129*** 0.110+
(0.036) (0.057)
8th Grade MCAS ELA 0.046 0.052
(0.043) (0.065)
[497] [200] Conscientiousness
-0.157+
(0.078)
[196]
Self-control
-0.211*
(0.095)
[196]
Grit
-0.119*
(0.054)
[195]
Growth Mindset
-0.030
(0.093)
[195] Notes: ***p<0.001, ** p<0.01, *p<0.05, +p<0.1. Standard errors reported in parentheses are clustered by 8th-grade school. Sample sizes for each outcome are in brackets. Each cell presents results from a separate regression. Administrative data sample includes all applicants to over-subscribed charter schools matched to valid 2011 test scores in the Massachusetts Department of Elementary and Secondary Education state database. Study sample includes students in the administrative data sample with valid data on at least one non-cognitive outcome. All regressions control for student gender, race, age, LEP, SPED, and free/reduced price lunch, cubic polynomials in 4th-grade MCAS ELA and math scores, and fixed effects for lottery applicant risk sets.

Running head: Promise and Paradox
Table 8: Student perceptions of school climate by school type
Open-enrollment District School
Over-subscribed Charter School
Difference
High Expectations 3.929 4.496 0.567**
(0.900) (0.669) (0.149)
[885] [112]
Teacher Strictness 3.526 4.107 0.581*
(0.888) (0.904) (0.211)
[878] [112]
Clarity of Rules 3.789 4.186 0.397*
(0.938) (0.854) (0.154)
[881] [110]
Negative Peer Effects 2.738 2.252 -0.486**
(0.962) (0.796) (0.122)
[878] [112]
Student Input 2.514 2.264 -0.250*
(0.924) (0.851) (0.093)
[882] [111]
Note: ** p<0.01, *p<0.05; statistical significance is of difference in mean for over-subscribed charter and traditional public schools. In the first two columns, standard deviations are reported in parentheses and sample sizes in brackets. Standard errors reported in parentheses in the third column are adjusted for clustering by school.
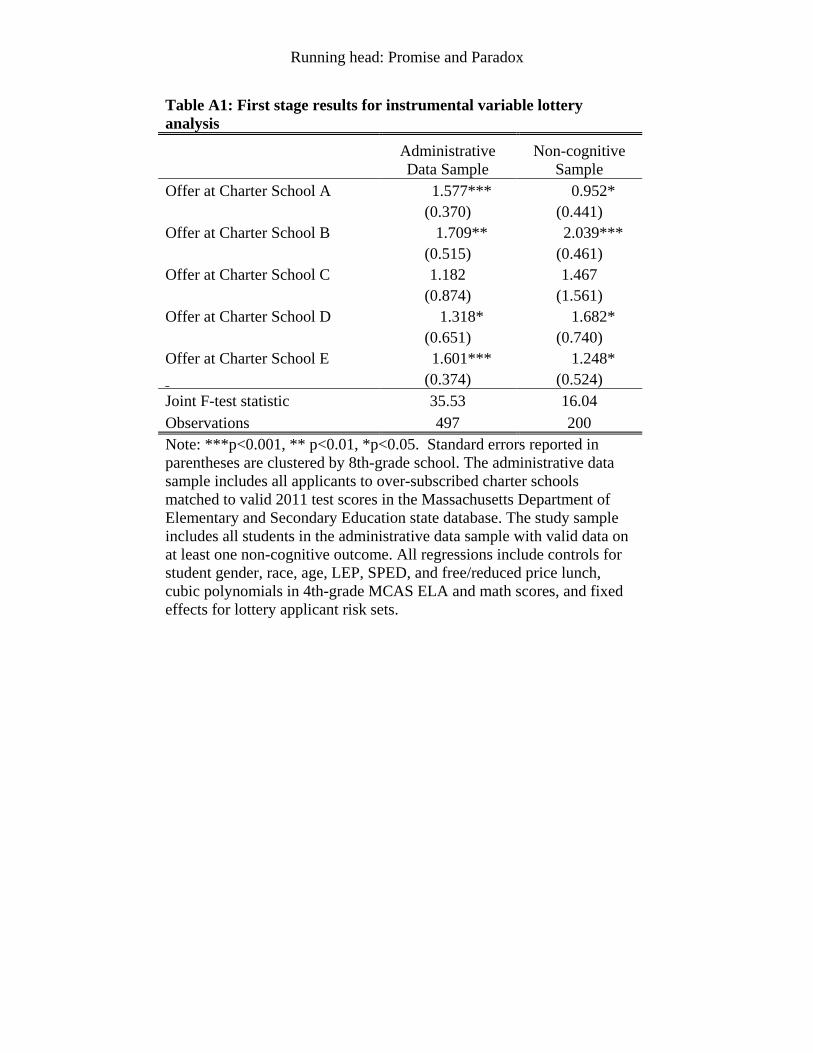
Running head: Promise and Paradox
Table A1: First stage results for instrumental variable lottery analysis
Administrative Data Sample
Non-cognitive Sample
Offer at Charter School A 1.577*** 0.952*
(0.370) (0.441)
Offer at Charter School B 1.709** 2.039***
(0.515) (0.461)
Offer at Charter School C 1.182 1.467
(0.874) (1.561)
Offer at Charter School D 1.318* 1.682*
(0.651) (0.740)
Offer at Charter School E 1.601*** 1.248* (0.374) (0.524) Joint F-test statistic 35.53 16.04 Observations 497 200 Note: ***p<0.001, ** p<0.01, *p<0.05. Standard errors reported in parentheses are clustered by 8th-grade school. The administrative data sample includes all applicants to over-subscribed charter schools matched to valid 2011 test scores in the Massachusetts Department of Elementary and Secondary Education state database. The study sample includes all students in the administrative data sample with valid data on at least one non-cognitive outcome. All regressions include controls for student gender, race, age, LEP, SPED, and free/reduced price lunch, cubic polynomials in 4th-grade MCAS ELA and math scores, and fixed effects for lottery applicant risk sets.

Running head: Promise and Paradox
Table A2: Mean student non-cognitive skills in three middle schools over time, stable sample
Time Point
Fall Y1 Spring Y1 Spring Y2 Spring Y3
Conscientiousness
Charter School 1 0.12 -0.10 -0.33* -0.57*** Charter School 2 -0.08 -0.08 -0.43+ -0.67** District School 0.06 -0.13 -0.18 -0.12
Self-Control Charter School 1 0.10 -0.28+ -0.50** -0.76*** Charter School 2 0.01 -0.15 -0.44* -0.67*** District School 0.08 -0.16 -0.29* -0.23+
Grit Charter School 1 0.22 -0.12+ -0.27* -0.40*** Charter School 2 0.15 -0.06 -0.45** -0.39** District School -0.10 -0.10 -0.26 -0.19
Growth Mindset Charter School 1 0.07 0.44+ 0.62** 0.55* Charter School 2 0.05 0.74*** 0.56* 0.56* District School 0.07 0.47* 0.44* 0.57** Note: ***p<0.001, ** p<0.01, *p<0.05, +p<0.10. Significance levels are for the difference between the mean value of a given non-cognitive skill in Fall Y1 and each subsequent time period. Sample restricted to students with valid data in each year. N=61 for Charter School 1; N=43 for Charter School 2; N=65 for District School. Years 1-3 correspond to grades 5-7 in Charter School 1 and grades 6-8 in Charter School 2 and District School. Scores are standardized relative to the full sample in Fall of Y1. See Appendix Table A3 for data on all sampled students.
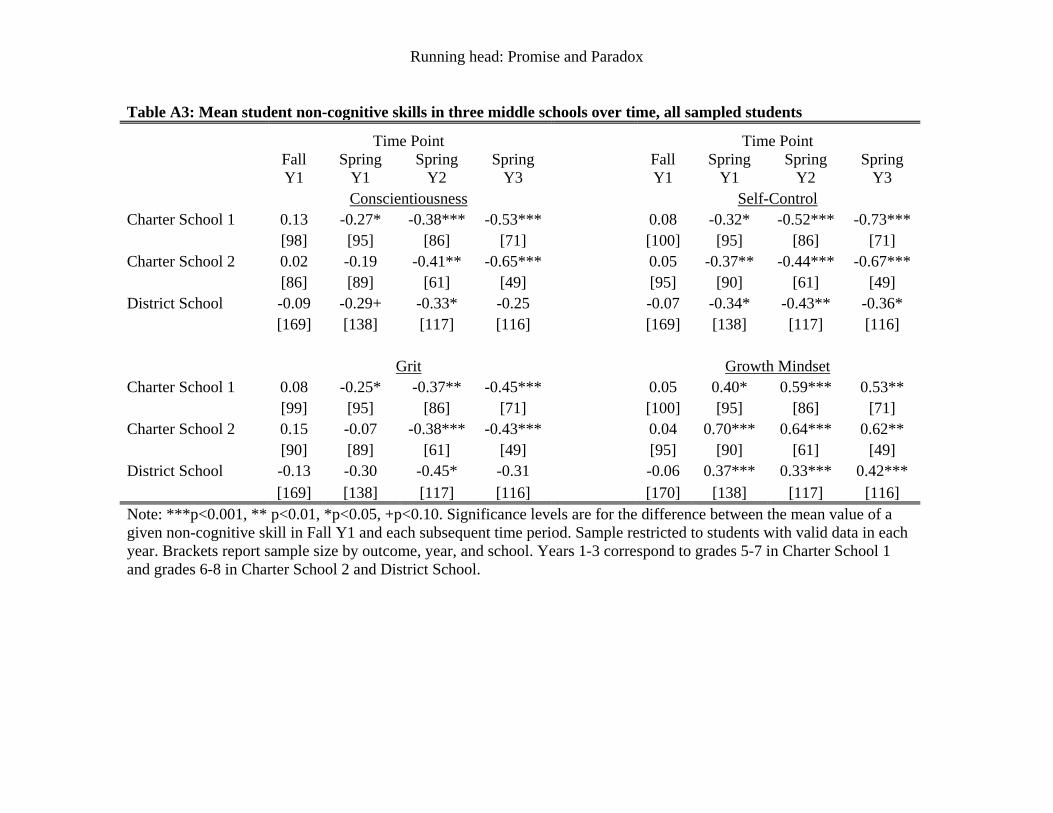
Running head: Promise and Paradox
Table A3: Mean student non-cognitive skills in three middle schools over time, all sampled students
Time Point
Time Point
Fall Y1
Spring Y1
Spring Y2
Spring Y3
Fall Y1
Spring Y1
Spring Y2
Spring Y3
Conscientiousness
Self-Control
Charter School 1 0.13 -0.27* -0.38*** -0.53***
0.08 -0.32* -0.52*** -0.73***
[98] [95] [86] [71]
[100] [95] [86] [71]
Charter School 2 0.02 -0.19 -0.41** -0.65***
0.05 -0.37** -0.44*** -0.67***
[86] [89] [61] [49]
[95] [90] [61] [49]
District School -0.09 -0.29+ -0.33* -0.25
-0.07 -0.34* -0.43** -0.36*
[169] [138] [117] [116]
[169] [138] [117] [116]
Grit
Growth Mindset Charter School 1 0.08 -0.25* -0.37** -0.45***
0.05 0.40* 0.59*** 0.53**
[99] [95] [86] [71]
[100] [95] [86] [71]
Charter School 2 0.15 -0.07 -0.38*** -0.43***
0.04 0.70*** 0.64*** 0.62**
[90] [89] [61] [49]
[95] [90] [61] [49]
District School -0.13 -0.30 -0.45* -0.31
-0.06 0.37*** 0.33*** 0.42*** [169] [138] [117] [116] [170] [138] [117] [116] Note: ***p<0.001, ** p<0.01, *p<0.05, +p<0.10. Significance levels are for the difference between the mean value of a given non-cognitive skill in Fall Y1 and each subsequent time period. Sample restricted to students with valid data in each year. Brackets report sample size by outcome, year, and school. Years 1-3 correspond to grades 5-7 in Charter School 1 and grades 6-8 in Charter School 2 and District School.