projections of the white and nonwhite ... [ \y series p-25, no. 345 july 29, 1966 projections of the...
TRANSCRIPT

t [ \y
Series P-25, No. 345 July 29, 1966
PROJECTIONS OF THE WHITE AND NONWHITE POPULATION
OF THE UNITED STATES, BY AGE AND SEX, TO 1985
,{The projections for all classes were previously published in Current Population Reports, Series P-25, No. 329. The projections in this report are preliminary; revised figures are to be published later this year)
This report presents projections of the white and nonwhite population of the United States by age and sex from 1965 to 1985, which are consistent with the projections of the total population 'by age and sex previous ly published in Current Population Reports, Series P-25, No. 329. These projections are preliminary; they will be modified shortly to take acc.ount of changes recorded for 1965-66.
The accompanying tables show four series of. projections of the white and nonwhite popuJ1ltion from 1965 to 1985, designated A, B, C, and D. The projections relate to the 50 States and the District of Columbia and include Armed Forces abroad. Figures are given annually for the total white and nonwhite population and for ev'ery fifth year for the white and nonwhite popula'tion by age and sex. In the classification of the population as white or nonwhite, the group designated as, nonwhite includes Negroes, American Indians, Japanese, Chinese, .Filipinos, and other J)onwhi te races.
The figures are not offered as predictions of the future size of the population but indicate rather the approximate future level and age, sex, and color composition of our population under given assumptions as to future fertility, mortality, and net immigration.
A "component" method was used to dev'elop the population projections for the total and nonwhite population, and projections of the white population were obtained as' the difference. The component method involves the preparation of separate projections of each of the components of population change--births, deaths, and net immigration--on the basis of certain assumptions, and the combination of the pro,jections of change with estimates of the current population. The benchmark .for the population projections is the current estimates of the population, byage and sex,for July 1, 1965, published in Current Population Reports, Series P~25, No. 321. The projections of components inv'olve the use of projections of age-specific survival rates for mortality, age-specific birth rates for fertility, and an assumption as to the total annual amount and age-sex distribution of net immigration. The four series of projections differ from one another ';rholly with respect to the assumptions employed relating to future fertility. The assumptions employed with regard to future mortality and net immigration are the same in all series.
Fertility and mortality were assumed to folIo';, the general trends previously postUlated for all classes during the projection period but with partial convergence between white and
Bale by the Superintendent of Documents, u..S. Government Printirr,g Office, Washington, D.C., 20402, 15 cents. subscription (Series P-20, P-23, P-25, P-27, P-28 summaries, P-60, and P--65, combined), ·M.OO; foreign mailing, $5.25.

! j
2
nonwhite lev'els. The reduction of the differ-ence between the mortality of whites and nonwhites is in line with past trends spanning many years. The reduction of the difference between the fertility of whites and nonwhites does not follow recent experience, but there is e,ridence to support an assumption of convergence of the ra tes in future years. For examp Ie, the Grovlth of American Families Study for 1960, a national sample survey relating to fertility and family planning in the United States, indicates that, on the average, nonwhite wives in the childbearing ages want fewer children than they have and, in fact, want fewer than white wiv'es; and, further, that the differences existing between nonwhite and white wiv'es are associated with Southern farm background and low educational attainment, the influence of which should diminish in the future.' The projections of fertility for all classes incorporated in the population projections previously published were derived by the cohort method (Le., in terms of assumed cumulative fertility rates for birth cohorts of women); the corresponding projections of nonwhite fertility were derived on the basis of the assumed relation between the age-specific age-specific plied by the
birth rates for nonwhites and the birth rates for all classes im
cohort fertility data.
The specific assumptions underlying the projections are as follows:
1. The rela ti ve difference between the age-specific birth rates for the nomlhi te population and those for all classes observ'ed in the year 1965 would be reduced by 25 percent for Series A, 40 percent for Series B, 60 percent for Series C, and 75 percent for Series D by the year 2000. The extent of convergence of the nonwhite rates with those for whites would be a little more than with those for all classes. The total fertility rates for 1962-65, 1985, and 2000 implied by these assumptions are shown in table A. These figures indicate, for example, that if women bore children throughout their childbearing period at the age-specific birth rates assumed to prevail in 1985, the average white woman would have 2.4 to 3.2 children in her lifetime and the average nonwhite woman would haV'e 2.9 to 403 children, according to whether the Series D or Series A assumption prevailed.
1 Arthur A. Campbell, "Fertility and Family Planning Among Nonwhite Married Couples in the United States," Eugenics Quarterly, Vol. 12, No.3, Sept. 1965.
Table A.--TOTAL FERTILITY RATES, BY COLOR: 1985, Al\'D 2000
(Figures represent the total number of children would be born to 100 women during their lifetime they experienced the birth rates at each age mated or projected for the year or period shown)
Year and series
1962 to 1965 1, ....... , ••
1985
Series A •••..•.••.•••••• Series B ............... . Series C •....•••••..•.•• Series Do ••• oo~ •••• ~~.e~
2000
Series A •••.••••.••.•••• Series B •••••••••••••••• Series CQ'.~.~.OG •••.• " Sel"ies D .. ""." •. a _ •••• d \\I ~
All classes
330
3~0 313 278 2t,J
335 310 278 245
White
315
323 299 268 236
318 298 271 2~2
1 Period extends from July 1, 1962, to June 30,
2. The difference in the year tween age-specific survival rates for the white population and those for all clas would be reduced by 50 percent by the year The v'alues for the expectation of life at bir for 1963, 1985, and 2000 implied by this ass tion are shown in table B. The table shows moderate rise in life expectancy for the white population but indicates only rise for the white population.
Table B.--LIFE EXPECTANCY AT BIRTH, BY COLOR AND SEX: 1963, 1985, AND 2000
Year and sex
MALE
1963 ••••••••••••••••••• 1985 ••••••••••••••••••• 2000 •................ ..•
FEMALE
1963 •••••••••••••••••••• 1985 ••••..•••••..•••••• 2000 .................. .
All classes
66.6 68.0 69.0
73.4 74.6 75.4
White
67.5 68.7 69.6
74.4 75.4 76.1
3. Net immj_gration 'Iwuld 400,000 a year for all classes, approximately to the level estimated
Nonwhite
year July 1, 1965, to June 30, 1966. tribution of immigrants by color, as well as age and sex, would be the same as the estima

average annual dLstribu.tion of net immigration in the period from ,July 1, 1961, to June 30 ,
0(0), adjusted to include the addi·
donal :immigrants (29,000) expected i.n fu·-
ture yeaI's" Th:L s net immigration of
nODwhi tes.
assumption implies an annual 36'7,000 whites a.nd 33,000
Ta.ble 1 presents the projections of the 'Ilhite and nonwhite population for each year from 1965 t;o Table 2 presents 1:11e com .... ponents of populatIon change (Le., births, dea ths, etc.) for the white population for each
3
year from 1950 to 1985. 'J'able 3 presents the same type of figures for the nonwM.te pcpula.tion. Table 4 presents projections of' the white and nonwh:J.te population by 5-year age groups and sex for every £'1fl:h year from 1965 to 19(35.
* * * ThE) figures 1n thj.s report have been
rounded independently to the nearest tholJ.sand from figures computed to the last d:Lgl t; hence the sum of par ts may dLffer from the sota Is shown.

4-
Table l.--ANNUAL ESTIMATES AND PROJECTIONS OF THE POPULATION OF THE UNITED STATES, BY COLOR: 1950 TO 1985
(Numbers in thousands. Figures include Armed F'orces abroad~ For a description of the assumptions underlying the four series of projections, see text)
All classes
Se:ries and Population Net change during Population year (July 1 to June 30) at year at
Amount Per-oent 1 year
1950-1951 •••......•• , •..•. 1.71 1951-l952 ................. 1.73 1952-195.3 •..•......••.••.• 1.67 1953-195L~ ................. . 1.77 1954-1955 ................. 1.78 1955-1956 •••..•.....•••.. , 1956-1957 •..•• , ........... 1957-1953 ................. 1.68 195B-1959 ................. 1.69
1959-1960 ............... "I 1,61
1960-1961 ................. 180,684 3,072 1.70 1961-1962 .................. 183,756 2,900 1.58
""-''''·········· .... · .. 1 186,656 2,760 1.48
1963-1964 ••••••••••••..••• 139,417 2,702 1.43 1964-1965 ................. 192,119 2,465 1.28
PROJECTIONS
I Series A
1965-1966 ................. 1 2194,583 2,426 1.25 2171,442 1966-1967 ••••••.•.••.••••• 197,009 2,699 1.37 173,417 1967-1968 ................. 199,70$ 2,877 1.44 175,614 1968-1969 •••••••.•••.••••. 202,585 3,056 1.51 177 ,956 1969-1970 ................. 205,641 3,232 1.57 180,444 1970-1971 ••••...•.•••.•••• 208,87/, 3,404 1.63 183,074 1971-1972 ................. 212,273 3,571 1.68 185,842 1972-1973 ................. 215,849 3,729 1.73 128,742 1973-1974 ................. 219,577 3,878 1.77 191} 768 1974-1975 ................. 223,455 4,019 1.80 194,910
1975-1976 ................. 227,474 4,154 1.83 198,163 1976-1977 ................. 231,629 4,282 1.85 201,521 1977-1978 ................. 235,911 4,400 1.87 204,978 1978-1979 ................. 240,311 4,508 1.38 208,525 1979-1980 ................. 244,819 4,603 1.88 212,151 1980-1981. ................ 249,421 4,684 1.88 215,847 1981-1982 ................. 254,106 4,750 1.87 219,600 1982-1933 ................. 258,855 4,798 1.85 223,397 1983-1984 ••••.•••••••••••• 263,654 4,831 1.83 227,223 1984-1985 ................. 268,485 4,853 1.81 231,063 1985-1986 ................. 273,338 (NA) (NA) 234,905
Series B
1965-1966 ................. 2194,583 2,277 1.17 1966-1967 ................. 196,860 2,373 1.21 1967-1968 ................. 199,2.33 2,500 ' 0< J...GJ
1968-1969 ................. 201,733 2,631 1.30 1969-1970 ................. 204,364 2,70 1.35 1970-1971 ................. 207,127 2,898 1.40 1971-1972 ••••••.••••..••.• 210,025 3,033 1.44 1972.-1973 .................. 213,058 3,167 1.49 1973-1974 ................. 216,225 3,298 l.53 197/+-1975 • ................ 219,524 3,428 1.56
1975-1976 ..•••• , '" .••••.• 1.59 1976-1977. ~ ............... 1.62 1977-1978 ••••.•••.•••••••• 1.65 1978-1979 ................. 1.67 1979-1980 ................. 1.68
See footnotes at end of table.
White
Net change during year
Amount Per-cent,l
1.65 1.67 1.60 1.70 1.69 1..70 1,7/, J~ .. 59 1.58 J .• 51
1.59 1.47 1.37 1.32 1.18
1,974 1.15 2,197 1.27 2,342 1.33 2,488 1.40 2,630· 1.46 2,768 1.51 2,900 1.56 3,025 1.60 3,142 1.64 3,253 1.67
3,358 1.69 3,457 1.72 3,547 1.73 3,626 1.74 3,696 1.74 3,753 1.74 3,797 1.73 3,826 1.71 3,840 1.69 3,843 1.66
(NA) (NA)
1.08 1.11 1.16 1.21 1.25 1.29 1.34 1.3$ 1.41 1.45
1.48 1.51 1.53 1.55 1~56
Population at
beginning of year
223,141 23,593 24,094 24,629 25,197 25,799 26,436 27,106 27,810 28,545
29,312 30,108 30,933 31,786 32,(;68 33,575 34,506 35,458 36,431 37,423 38,433
223,141 23,568 24,014 24,434 24,978 25,498 26,044 26,618 27,218 27,846
28,500 29,180 29,886 30,618 31,376
Nom/hite
Net change during year
Amount
369 369 385 422 446 461 4'16 1.67 492 1+76
520 501. 491.r 501 471
452 501 535 568 602 636 670 704 736 766
796 825 854 881 907 931 953 973 992
1,010 (NA)
427 446 470 494 520 546 573 601 627 654
680 706 732 757 781
percent 1
2.27 2.22 2.26 2.42 2.50 2.52 2.54 2.43 2.50 2.36
2.52 2.38 2.28 2.26 2.08
1. 95 2.13 2.22 2.31 2.39 2.47 2.54 2.60 2.64 2.68
2.71 2.74 2.76 2.77 2.78 2.77 2.76 2.74 2.72 2.70 (NA)
1.84 1.89 1.96 2.02 2.08 2.14 2.20 2.26 2.31 23.5
2.39 2.42 2.45 2.47 2.49
Percent nonvlhite of total pOpula_ tion
10.7 10.8 10.8 10.9 10.9 11.0 11,1 11.2 n.3 n.3
11.4 n.5 11.6 11. 7 n.8
11.9 12.0 12.1 12.2 12.3 12.4 12.5 12.6 12.7 12.8
12.9 13.0 13.1 13.2 13.3 13.5 13.6 13.7 13.8 13.9 14.1
11.9 12.0 12.1 12.1 12.2 12.3 12.4 12.5 12.6 12.7
12.8 12.9 13.0 13.1 13.2
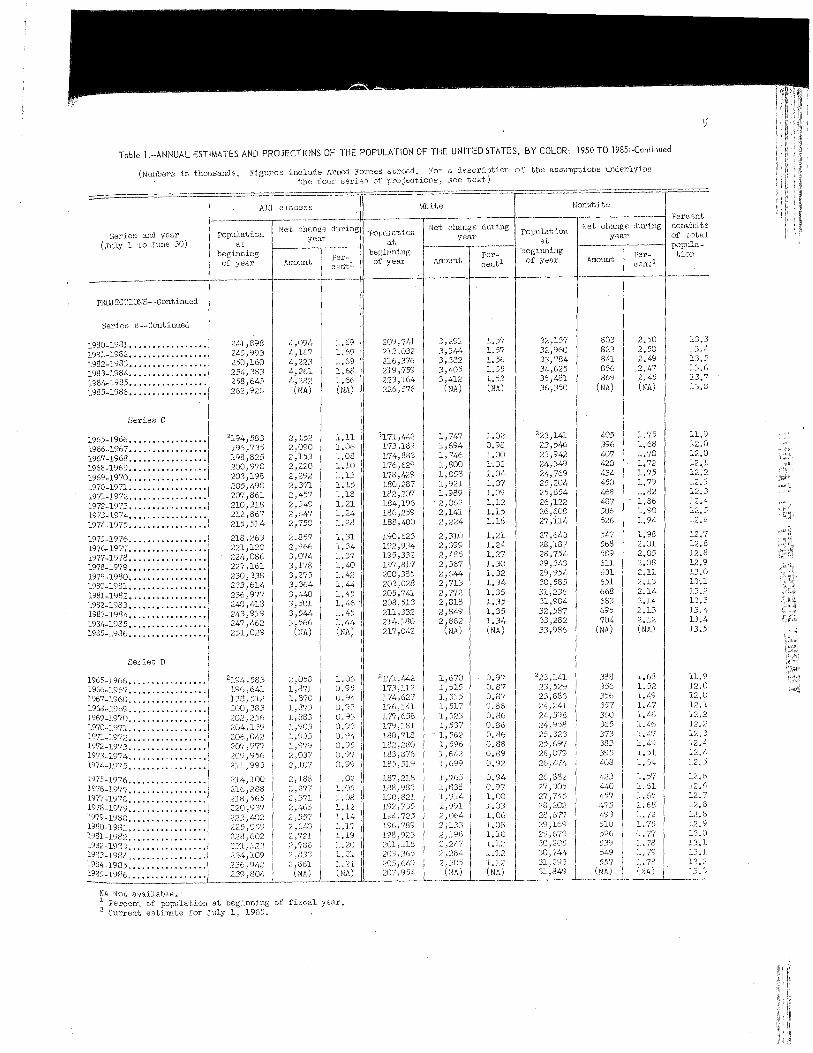
Table l.--ANNUAL ESTIMATES AND PROJECTIONS OF THE POPULATION OF THE UNITED STATES, BY COLOR: 1950 TO 1985 .. Cantinued
(Numbers in 'thollsandu. Figures Lnclude Armed Forces abroad. For a t.he four series of projeQtions)
.serios and year (July 1 to Sune 30)
PROJECT IONS-- Cant :lnued
Series B __ Continued
1980-1981. ••• _. _ •• _ ••••••• 1981-1982 ••••••••••••.•••• 1982-1983 ............... " 1983-198<:,. " ............. . 198<:-1985 ................ . 1985-1986 •••.•••••••.•••.•
Series C
1965-1966 ................ . 1966-1967 ••••••.•••••••••• 1967-1968 •••••••••••.••••• 1968-1969 ••••••.•••.•.•.•• 1969-1970 ••••••••••••.•••• 1970-1971 ................ . 19'71-1972 •••.••.•.••.•••••
1972-1973 •••.• " •.••••... 'j' 1973-1971, •••••..•••••••.•• 1974-1975 ................ .
1975-1976 ................ . 1976-1977 ............... .. 1977-1978 ................ . 1978-1979 ................ . 1979-1980 ................ . 1980-1981. •• , .•••.••.••••• 1981-1982 ••••••••.•• , ••••• 1982-1983 ................ . 1983-1984 ................ . 1984-1985 •••••.•....••.•.• 1985-1986 ............... "
Series D
1965-1966 ................ 'I 1966-1967 ••• , •.• '" .•••• , • ::'967-1'")68 •.••• , ••••••••• "
1968_19f,,9 ................. ) 1969-1970 •....• , .... , ••••• 1970-1971 .••••..•.....•.•• 1971_1972 ••••••.•••••••• " 1972-197.3 ••.•.••.•..•••••• 1 1973-1974 ••.. , ~ ~ ~ ••• ~ .••. "
1'Y74_19,?5,- ................ 'j' 1975-1976 •••• , '" .. , .••••• 1976-1977 ................ . 1977 1972 1978=197~:::::::::::::::: :)
1979-1980 ••••.•..••.•.••• 'I' 1980-19.31 ............... .. 1981_198;2 ............... .. 1ge2-1'X'3 .•.•.•....••.••.• .1983-198~·o. ~""""""" 1ge1,-1'Ji35 ••••••••••••••••• \
~~:-: .. :-'············I NA Not available ~ 1 Per'oerrt of' 2 Current
All ulassef.J
Population
ut
at
;236,91-.2 239 ,Batt
Net change year
Amount
",,094 4,167 4,223 4,261 4,282
(NA)
during
Per-cent1
1.69 1.69 1.69 1.62
of fiElCal yea,!".
population at
year
\illite
Net change year
Amount
1,747 1,694 1,746 1,800 1,858 1,921 1,989 2,062 2,141 2,224
during
Pel'-cent 1
1.57 LSI 1.56 1.55 1.53 (NA)
1.02 0.98 1.00 1.02 1.04 1.07
of the assumptions underlying
population at
year
Nonwhite Percent
Net change during nonwhite year of total
Amount
803 823 841 856 869
(NA)
405 396 4D7 1,20 434 450 468 487 506 526
51t7 568 589 611 631 651 668 683 695 704
(NA)
388 356 356 357 3e,cl 365 373 383 .39:5 1,,08
423 440 457 475 1/)3 )10 526
peI'cent 1
2.50 2.50 2.49 2.47
1.75 1.68 1.70 1.72 1.75 1.79 1.82 1.86 1.90 1,94
1.98 2.01 2.05 2.08 2.11 2.13 2.14 2.11+ 2.13 2.12 (NA)
1.68 1.52 1.49 1./.1 1. !t6 1~!.j6
1.51 1. S!.~
1.5"1 1. 61 1.65 1.68 1.72 1.7'; 1.77 1.78 1.'/9 1.'?H (NJI)
13.3 13.4 13.5 13.6 13.7 13.8
11.9 12.0 12.0 12.1 12.2 12.3 12.3 12.4 12.5 12.6
12.9 13.0 13.1 13,2 13.3 13.4 13.4 13.5
12.1 12.2 12.2 12.3 12.4 120Lt 12.5
12..6 12.6 12.7
12.9 B.O 13.1 U.1 13. ;.~ 13.3

6
Table 2 ... ANNUAL ESTIMA TES AND PROJECTIOFrgROiH1H3N1~~1ES~~~~~:A \~~~ ¢~~ 9~~ ITS COMPONENTS OF POPULATION CHANGE,
(Numbers in tbousands. Figures include Armed Forces abroad. For a description of the assumptions underlying the four series of projections, see text)
Population Net Natural increase Births Deaths
Series and year at (July 1 to June 30) beginning Junount Rate 2 J\Jnount Rate 2 J\Jnount
of year
ESTIMATES
1950-1951. ..................... , 135,984 2,237 1,913 14,0 3,216 23.5 1,303
1951-1952 ....................... 138,221 2,305 1,978 14.2 3,303 23.7 1,325
1952-1953, ...................... 140,526 2,247 2,031 1/,.3 3,375 23.8 1, Jet/r
1953-1954 ....................... 142,773 2,420 2,135 14,8 3,443 23.9 1,307
1954-1955 •.............••......• 145,193 2,1,59 2,167 14.8 3,493 23.9 1,326
1955-1956 •..............•...•... 147,653 2,511 2,139 14.4 3,522 23.7 1,384
1956-1957 •.......•........•...•• 150,163 2,605 2,252 11,.9 3,643 24.0 1,391
1957-1958 •.................. ", • 152,769 2,1,31 2,166 14,1 3,645 23,7 1,1,79
1958-1959, •......•.....•.•...•.• 155,200 2,4.55 2,167 13.9 3,616 23.l 1,4.49
1959-1960 •.........•....... , ... , 157,655 2,378 2,107 13.3 3,599 22.7 1,492
1960-1961 •.....••••....•...•..•• 160,033 2,552 2,177 13,5 660 1,482
1961-1962 •...•..........•. , ....• 162,586 2,396 2,040 12,5 1,5.3iJ.
1962-1963 .....•..........••.•.•• 164,982 2,266 1,920 H.6 21.1 1,583
1963-1964 ...........•..•...•.•.• 167,248 2,201 1,880 11.2 20.5 1,572
1964.-1965 ....................... 169,449 1,993 1,687 9.9 19.3 1,600
PROJECTIONS
Series A
1965-1966 ....................... 3171,442 1,974 1,607 9.3 3,260 18.9 1,653
1966-1967 ....................... 173,417 2,197 1,830 10.5 3,509 20.1 1,678
1967-1968 .•.......•....•.•.••••• 175,614 2,342 1,975 11.2 3,678 20.8 1,703
1968-1969 ....................... 177,956 2,488 2,120 H.8 3,849 21.5 1,728
1969-1970 •..............••....•• 180,/,44 2,630 2,263 12.4 4,016 22.1 1,753
1970-1971 ......••..........•••.. 183,074 2,768 2,401 13.0 4,178 22.7 1,778
1971-1972 ...................... , 185,842 2,900 2,533 13.5 4,335 23.1 1,802
1972-1973 ...................... , 188,742 3,025 2,658 14,0 4,~84 23,6 1,826
1973-1974 •••..........•••..•••.• 191,768 3,142 2,775 14.4 4,624 23,9 1,849
1974-1975, ...................... 194,910 3,253 2,886 14,7 4,757 24.2 1,871
1975-1976 ••.•.•.•••....•••••..•• 198,163 3,358 2,991 15.0 1"S8~. 24.4 1,893
1976-1977, .•..•........• , •.•• , •• 201,521 3,457 3,089 15.2 5,00/, 24.6 1,914
1977-1978 ••......••..... " .....• 204,978 3,547 3,179 15.4. 5,114 24,7 1,935
1978-1979 •.•.•..••.....•••.....• 208,525 3,626 3,259 15.5 5,214 24.8 1,955
1979-1980, ~ ..................... 212,151 3,696 3,328 15.6 5,302 21,.8 1,974
1980-1981 •••..........•.•.....•• 215,847 3,753 3,386 15.6 5,379 24.7 1,993
1981-1982 ....................... 219,600 3,797 3,430 15.5 5,442 24.6 2,012
1982-1983 ••..••.•........•....•• 223,397 3,826 3,458 15.3 5,490 24.4 2,031
1983-1984 ....................... 227,223 3,840 3,473 15,2 5,523 24.1 2,051
1984-1985 ....................... 231,063 3,843 3,475 14.9 5,546 23.8 2,070
1985-1986 •..•..••......•••••.••• 234,905 (NA) (NA) (NA) (NA) (NA) (NA)
Series B
1965-1966 ....................... 3171,442 1,850 1,482 8.6 3,133 18.2 1,651
1966-1967 ....................... 173,292 1,927 1,559 8.9 3,232 18.5 1,673
1967-1968 ••..•..•.....•..•.•...• 175,219 2,030 1,663 9.4 3,360 19.1 1,697
1968-1969 ....................... 177,249 2,136 1,769 9.9 3,489 19.6 1,721
1969-1970 ....................... 179,386 2,2/,3 1,876 10. 1+ 3,621 20.1 1,745
1970-1971 •••••••.••...••...•.•.• 181,629 2,352 1,984 10.9 3,753 20.5 1,768
1971-1972 ••....•..•.......••...• 183,981 2,460 2,093 .11.3 3,885 21.0 1,792
1972-1973 .....•••......•.•....•• 186,441 2,566 2,199 11.7 4,01~· 21.4 1,815
1973-1974 .•.••••.....••..•..•.•• 189,007 2,671 2,303 12.1 4,141 21.8 1,838
1974-1975 ....................... 191,678 2,774 2,406 12.5 4,266 22.1 1,860
1975-1976 ••..•..........•..•.••• 19/,,452 2,875 2,508 12.8 4,390 22.4 1,882
1976-1977 ••..•.••••....•...•.••• 197,327 2,973 2,606 13.1 1,,509 22.7 1,903
1977-1978 ....................... 200,300 3,066 2,698 13.4 4,622 22.9 1,924
1978-1979 .....••.....••...•.•..• 203,366 3,150 2,783 13,6 4,726 23,1 1,943
1979-1980 ....................... 206,516 3,225 2,858 13.7 4,821 23.2 1,963
See footnotes at end of table.

Table 2.--ANNUAL ESTIMATES AND PROJECTIONS OF THE WHITE POPULATION AND OF ITS COMPONENTS OF POPULATION CHANGE, FOR THE UNITED STATES; 1950 TO 1985--Continued
(NwnberG in thOUt38.nds. Figure::; include Armed Forces the four r3(:'.!rieo of
Sel'ieD and year (July to JunG JO)
PROJECT IONS- - Cmrt inued
Series B .... -Continued
1980-1981 ••..•..••.•••....•• 1981-1982 •.•...••••..•••..•. 1982-1983 .................. . 1983-1984 •.•....•••.••..•.•. 1984-1985 .•....••••••.•••... 1985-1986; ................. .
Series G
1965-1966 •••. , .••••.••.••••• 1966-1967 •••.•.••..••••••••• 1967-1968 ••....•••.••.•..•.• 1968-1969 •..•.•..••••....••. 1969-19'10 ••..••..••••••••••• 1970-1971 ••••..•.•• , .•••• , •. 1971-1972 ................... . 1972-1973 •••••.•..••.•••••.. 1973-1974 ...........•....... 1971,-1975 .................. .
1975-1976 ••••.• , •...•.•••••• 1976-1977 •.• , .••••••..••.••• 1977-1978 •••...•.•.••.••.••• 1978-1979 ••.•....•••.••.•.•••. " 1979-19S0 ...................... . J.980-1981 •.••••.••.••.•.••...••• 1981-1982 •••.•••.•••.•••••••.••• 1982-1983 ...................... . 1983-1984 ••••••..•.••••••• , ••••• 1984-1985 ..................... .. 1985-1986 ....................... .
Series D
1965-1966 ....................... , 1966-1967 ........................ . 1967-1968 ....................... . 1968-1969 •••.....•••...••••••••• 1969-1970 •. , .................... . 1970-1971 ...................... . 1971-J.972 ................. ' .••... 1972-1973 •••.•••.•••..•..•.•.•• ,
~~~=i;0~::: :::::::::::::::::::: 1975-1.976 •.•............... , .•.
1 ........... " ........ ,
1980-1981, .. , . .. . .. • . . • •• • ..... .. 981-1982 1982-198.3'" ., ...•.••• , •.• - •.•••
1983-19fl2, .. ••· .... , .. · ...... " ..
i~~~=i~~;,::: ::::::::::::::::::::
Population o.t
beGinning of ,'fear
Net
For a
1,379 1,327 1,J78 1,433 1,/'.91 1,553 1,622 1,695 1,773 1,fl56
1, 1,82S l~ggO
1" 9]'/ L:.9:3g (M)
"".,,,,,·,-r,T.,nn of thE:) asswnptions underly:i.ng
13.9 13.8 13.7 13.5 (NA)
8.0
11.0 11.3 U.5 1].,6 11.7 ll.7 11.6 (NA)
9,A (NA)
17.6 17.2 17.,5
'7
18.3 18.6 1fl.9 19.2 19.5
19.9 20.2
20.9 21.1 21.2 21.2 21.2 21.0 (NA)
1,649 1,668 1,690 1,713 1,736 1,759 1,7131 1,804 1,826 1,847
1, 1,930 1, 9/,9 l,96rl 1,987 2,006 2,026 2)045
(NA.)
Net immigrnti.on for future yeuI'u a8Bwned to be 36'1) OOO~
7
9.6 9.6 9.6 9.6 9.7 9.7 9.7 9.7 9.7 9.7
9.7 9.7 9.7 9.7 9.7 9.6 9.6 9.6 9.5 9.5
(NA)

8
Table 3.,.ANNUAL ESTIMATES AND PROJECTIONS OF THE NONWHITE POPULATION AND OF ITS COMPONHITS OF POPULATION CHANGE FOR THE UNITED STATES: 1950 TO 1985 '
(Numbers in thousands. Figures include Armed Forces abroad. For a four projections, see
Series and year (July 1 to June 30)
ESTIMATES
1950-1951. .....................• 1951-1952 •. , .•••..............•• 1952-1953~. ~ .... ~ ... ~ ...• ~ ~ ....• 1953-1951,· ••••• ••••• , ••••••.••••• 1951,·-1955 •••.••••••••••••••••••• 1955-1956., ................... .. 1956-1957 ..................... .. 195'1-1958 ...................... . 1958-1959 ...................... . 1959-1960 •...•...••..........•..
1960-1961 ..................... .. 1961-1962 ..................... .. 1962-1963 ...................... . 1963-19£,1,. ...................... . 1964-1965 ...................... .
PROJECTIONS
Series A
1965-1966 ..................... .. 1966-1967 ...................... . 1967-1968 ..................... .. 1968-1969 •......•.•...••.••...... 1969-1970 ...................... . 1970-1971 ..................... .. 19'11-1972 ...................... . 1972-1973 ••.•....•.•..•...•..••• 1973-1974 ...................... . 1974-1975 ...................... .
19'15-1976 ..................... .. 1976-1977 ...................... . 1977-1978 ..................... .. 1978-1979 ...................... , 1979-1980 ..................... .. 1980-1981 ...................... . 1981-1982 ••.•.•.•••. : .••..•••.•• 1982-1983 •...•.... : ............ . 1983-1984 ...................... . 1984-1985 ..................... .. 1985-1986 ..................... ..
Series B
1965-1966 ...................... . 1966-1967 ..................... .. 1967-1968 ...................... . 1968-1969 ...................... . 1969-1970 ..................... .. 19'10-1971 ..................... .. 1971-1972 ...................... . 1972-1973 .. ; ....... , .......... .. 1973-1974 ...................... . 1974-1975 ••...•..•...•.••.••.•.•
1975-1976 •..•.•••.•••.•..••••... 1976-1977 ..................... .. 1977-1978 ..................... .. 1978-1979 ..................... .. 1979-1980 ....................... .
See footnotes at end of table.
population at
beginning of year
16,288 16,657 1'1,026 17,1,11 1'1,833 18,279 H~,740 19,215 19,682 20,175
20,651 21,170 21,675 22,169 22,670
323,141 23,593 24,094 24,629 25,197 25,799 26,436 27,106 27,810 28,545
29,312 30,108 30,933 31,786 32,668 33,575 34,506 35,458 36,431 37,423 38,433
323,141 23,568 24,014 24,484 24,978 25,498 26,041. 26,618 27,218 27,846
28,500 29,180 29,886 30,618 31,376
Net change during year'
369 369 385 422 1,46 1.61 1,76 467 492 476
520 504 1,9/, 501 471
,,52 501 535 568 602 636 670 704 736 766
796 825 854 881 907 931 953 973 992
1,010 (NA)
427 ;,1.6 470 494 520 546 573 601 627 654
680 706 732 757 781
Natural :Lncreas e
Amount
390 423 'ti,7 1,58 478 .!~6t'~
484 476
490 476 1,62 ;,71 442
419 469 502 536 570 604 638 671 703 734
763 793 821 848 874 898 920 940 959 977
(NA)
394 414 437 462 1,.87 514 541 568 595 621
61,8 674 699 '/25 749
22 .. 7 22,0 22.7 2.!;.~O
~~I.I'. 8 2/,.7 25.2 2J~9 2/+.3 ;0,3
23.4 22.2 21.1 21,0 19.3
17.9 19.7 20.6 21.5 22.3 23.1 23.8 24.4 24.9 25.4
25.7 26.0 26,2 26.3 26.4 26,4 26.3 26.2 26,0 25.8 (NA)
16.9 1'1.4 18.0 18.7 19.3 19.9 20,5 21.1 21.6 22.1
22.5 22.8 23.1 23.4 23.6
;) of the assumptions underlying
Births
Amount Rate 2
555 556 576 603 626 6/.,-4 669 668 683 680
690 686 683 690 661
651 705 742 780 817 855 893 930 966
1,001
1,034 1,067 1,099 1,130 1,159 1,186 1,211 1,234 1,256 1,278
(NA)
625 61,8 674 702 732 761 792 823 853 883
913 943 972
1,001 1,028
33.7 .33.0 33.5 JL~.2
'7
33.0 32.0
28.9
27.9 29.6 ~0.5
31.3 32.1 32.8 33.4 33.9 34,3 34.6
3<:.8 35.0 35.1 35.1 35.0 34.9 34.6 34,3 34.0 33.7 (NA)
26.8 27.2 27.8 28.4 29.0 29.5 30,1 30.6 31.0 31.4
31.7 31.9 32.1 32.3 32,4
Deaths
AmcJUnt Rate 2
182 185 186 1'79 179 187 191 20', 199 205
200 2CJ9 221 219 219
232 236 240 244 248 252 256 259 263 267
271 275 278 282 285 288 291 294 297 301
(NA)
231 234 237 241 244 2/,8 251 255 258 262
266 269 273 276 279
n.o 11.0 10.8 10.2
9.9 10.1 10.1
10.0
9.6 9.8
10.1 9. '7 9.5
9.9 9.9 9.8 9.8. 9.7 9.6 9.5 9.4 9.3 9.2
9.1 9.0 8.9 8.7 8.6 8.5 8.3 8.2 8,0 7,9
(NA)
9.9 9.8 9.8 9.7 9.7 9,6 9.5 9.5 9.4 9.3
9.2 9.1 9.0 8.9 8.8

9
Table 3.··ANNUAL ESTIMATES AND PROJECTIONS OF THE NONWHITE POPULATION AND OF ITS COMPONENTS OF POPULATION CHANGE, FOR THE UNITED STATES: 1950 TO 1985,·Continued
(Numbers in thousands. Figures include Armed Forces abroad. For a description of the assumptions underlying the four series of projections, see text)
Natural increase Births Deaths Series and year
(July 1 to June 30)
Population at
beginning of year
Net change during yearl Amount Amount Rate 2 Amount l1ate 2
PI10JECTIONS--Continued
Series B--Continued
1980-1981 •••..••.••....••.•••••• 1981-1982 ..................... .. 1982-1983 ••..•.•.••..••.•••.•..• 1983-1984 •••.••••••••••••••••••• 1984-1985 ...................... . 1985-1986 ••••••.•...•••••••...••
Series C
1965-1966 ..................... .. 1966-1967 •••••...•••..•....•.•.• 1967-1968 •••••••••.•.••••••••.•• 1968-1969 ..................... .. 1969-1970 •••.••••.••••.•••.•.•.• 1970-1971 ••...•••••••••.••••.••• 1971-1972 ••••••...••.•.•••••.•.• 1972-1973 ..................... .. 1973-1974 ..................... .. 1974-1975 ..................... ..
1975-1976 •••.••.•.•.•••••••••••• 1976-1977 ..................... .. 1977-1978 ..................... .. 1978-1979 ••••••••••••••••.•••••• 1979-1980 •..••.••••••••••••••••• 1980-1981. ••.••.••••••••.•• , ••.• 1981-1982 ••••.•..••••••.•••••••• 1982-1983 •••..••.••••••••••••••• 1983-1984 •••••••••••••.•••••.••• 1984-198.5 ..................... .. 1985-1986 ...................... .
Series D
1965-1966 ••..••..•••..•..••••.•• 1966-1967 •••.•....•••.•.•.•..••• 1967-1968 •..•••.•..••••.•••••••• 1968-1969 •.•• , ... , •• , .......... . 1969-1970 ...................... . 1970-1971 ..................... .. 1971-1972 •.•.•..•••.•••.•••••.•• 1972-1973 •.•.•.•.•...••..••.••.• 197.3-1974 ......... , ............ . 1974-1975 ................ , ..... .
1975-1976 •.•..••..•..•• , ••..••.• 1976-1977, .•. , •..•• , .••••••••••• 19'77-19'18 .... '" .............. .. 1978-1979 ...................... . 1979-1980 ..................... .. 1980-1981, ..••....•...•...•...•• 1981-1982 •••..•••• , ••.•.••..•. , • 1982-1983 ...................... . 1983_198" 1984_19C;: : : : : : : : : : : : : : : : : : : : : : : =-1986 •.••••••.•..•••.•..••••
32,157 32,960 33,78,. 34,625 35 ,~.81 36,350
323,lItl 23,546 23,942 24,349 24,769 25,204 25,654 26,122 26,608 27,114
27,640 28,187 28,754 29,343 29,954 30,585 31,236 31,904 32,587 33,282 33,986
323,IL,1 23 529 23;886 24,241 24,598
958 25, 25.697
'079
31,
882 30.5
677
6'79 205
29.3
80" 823 841 856 869
(NA)
405 396 ,·07 420 434 450 468 487 506 526
5~7 568 589 611 631 651 668 683 695 704
(NA)
388 356 356 357 360 365 373 383 395 1,·08
',23 !li~O
~-57 475 ,,93 510 526 539 5'.9 557
(NA)
771 791 808 823 837
(NA)
372 364 374 387 402 418 435 454 473 493
514 535 556 578 599 618 636 650 662 671
(NA)
355 32', 323 32L~
32'7 333 340 350 362 :375
391 407 /t2!~
442 ,,·60 il:77 j~93
506 51? S2~·
(NA)
23.7 23,7 23,6 23.5 23.3 (NA)
15.9 15.3 15.5 15.8 16.1 16,4 16.8 17.2 17,6 Hl.O
18.4 18.8 19,2 19.5 19.8 20.0 20.1 20.2 20.1 20.0 (NA)
15.2 13,7 13.4 13.3 13.2 13.2 13.3 U.S 13.8 14.1
15.2 15.5 15.9
16.6 16.7 16.6 (NA)
l,OS3 1,076 1,096 1,114 1,131
(NA)
603 595 609 625 642 661 682 704 726 749
773 798 823 8/+7 871 894 914 931 946 958
(NA)
585 55/~
555 559 565 573 583 595 610 626
62.5 6&: 685 706 727 747 765 7,H 79/, 80/,.
(NA)
32,3 32.2 32.1 31.8 31.5 (NA)
25.8 25.1 25.2 25.4 25.7 26,0 26.3 26.7 27.0 27.4
27.7 28.0 28.3 28.6 28,8 28.9 28.9 28.9 28.7 28.5 (NA)
25.1 23.4 23.1 22.9 22.8 22.8 22.9 23.0 23.2 23.5
23.8 24.1
25.1 25.4 25.5 :25.6 25 .. 6 25.5 (NA)
282 285 288 291 294
(NA)
230 232 235 238 241 244 247 250 253 256
260 263 266 270 273 275 278 281 284· 287
(NA)
230 230 232 235 237 24C 2/,2 2~5 248 251
254 257
266 269 272 275 27? 2BO
(NA)
~_Not available. 2 ~nc1udeG annual net immigration, not shown separately. Net immigration for future years assumed to be 33,000. 3 Rate for 1,000 population at middle of fiscal year.
Current estimate for July I, 1965,
8,7 8.5 8.4 8.3 8.2
(NA)
9.9 9.8 9.7 9.7 9.6 9.6 9.5 9.5 9,4 9.4
9.3 9.2 9.2 9.1 9,0 8.9 8.8 8.7 8.6 8.5
(NA)
9.8 9.7 9.7 9,6 '.l.6 9,5 9.5 9.5 9." 9.4
9.4 9.3 9,3 9.3 9. ~: 9.2 9.1 9.0 8.9 8,9
(NA)

10
Table 4 .•• ESTIMATES AND PROJECTIONS OF THE WHITE AND NONWHITE POPULATION OF THE UNITED STATES, BY AGE AND SEX: 1965 TO 1985
(In thousands. Figures relate to July 1 and include Armed Forces abroad. For a description of the the four series of projections, see text. Figures inside heavy lines represent) in whole or part) years after 1965)
White Nonwhite Series, age, and
sex 1965 1970 1975 1980 1985 1965 1970 1975 1980
BOTH SEXES
Sertes A
All ages ••.....•.•
Under 5 years ••.••••• G
5 to 9 10 to years •.....•• 15 to 19 years ........
Series B
All ages •....•.•••
Under .5 years •.....••• .5 to 9 years ••...•.•.. 10 to 14 years •....... 15 to 19 years .......•
Series C
All age,s ••.•.•••••
Under 5 years •.....••• 5 to 9 years •••...•••• 10 to 14 years ........ 15 to 19 years •....•.•
Series D
All ages ••....•..•
Under 5 years ......... 5 to 9 years ••.•....•. 10 to 14 years ........ 15 to 19 years •.....••
All Series--20 Years Old and Over
20 to 24 years ••.....• 12,026 15,097 16,666 18,014 17,799 1,642 2,165 2,634 2,983 25 to 29 years ........ 9,966 12,230 15,284 16,846 18,187 1,358 1,648 2,165 2,630 30 to 34 years ••.•..•• 9,716 10,080 12,330 15,368 16,922 1,318 1,357 1,643 2,155 35 to 39 years ........ 10,636 9,756 10,118 12,352 15,369 1,348 1,306 1,346 1,628 40 to 44 years ••..•.•• 11,134 10,584 9,718 10,078 12,288 1,314 1,316 1,277 1,318
45 to 49 years •.•••.•• 10,329 10,959 10,423 9,936 1,139 1,264 1,269 1,234 1,276 50 to 54 years •.....•. 9,544 10,030 10,646 9,321 1,033 1,073 1,194 1,203 1,17.2 55 to 59 years ........ 8,321 9,09,j 9,566 10,161 9,680 836 946 986 1,101 1,113 60 to 64 years ••...••. 7,101 7,717 8,445 8,895 9,460 708 7J.!, 834 875 982 65 to 69 years ........ 5,815 6,304 6,865 7,529 7,947 1,83 579 605 694 734 70 to 74 years •••..••• 4,782 4,81,1 5,269 5,758 6,338 407 373 45J. 476 551 75 years and over ••••• 6,158 6,886 7,337 7,906 8,640 511 602 631 700 767

11
Table 4.··ESTIMATES AND PROJECTIONS OF THE WHITE AND NONWHITE POPULATION OF THE UNITED STATES, BY AGE AND SEX; 1965 TO 1985··Continued
thousands. Figures relate to July 1 and include Armed Forces abroad. For a description of the assumptions underlying the four series of projections, see text. Figures inside heavy lines represent, in whole or part, survivors of births for years after 1965)
u
1 1
-
Series, age, and sex
MALE
Series A
All ages ••••.•.•••
nder 5 years •...•.•.• to 9 years ••••.•.•••
o to 14 years ........ 5 to 19 years ........
Series B
All ages ••.....•••
nder 5 years •....•..• U 5 1 1
to 9 years •...•..••• ° to 14 years •.••.••• 5 to 19 years ........
Series 0
All ages ••.•..••••
nder 5 years ......... U 5 1 1
to 9 years ••.••.•.•• o to 14 years ........ 5 to 19 years ••••••••
Series D
All ages ••.•••.•••
der 5 years ......... to 9 years ••.•••••••
Un 5 10 15
to 14 years ........ to 19 years .... : ...
AI 1 Series--20 Years
20 25 30 35 40
45 50 55 60 65 70 75
Old and Over
to 24 years ........ to 29 years ••..•..• to 34 years •••..••• to 39.years ••••..•• to 44 years •.......
to 49 years ........ to 54 years ........ to 59 years ••.••.•• to 64 years ••.••••• to 69 years ........ to 74 years ........ years and over •••••
1965
84,616
8,783 8,939 8,319 7,576
84,616
8,783 8,939 8,319 7,576
84,616
8,783 8,939 8,319 7,576
84,616
8,783 8,939 8,319 7,576
6,062 4,984 e·, 849 5,271 5,452
5,051 4,658 4,017 3,365 2,644 2,099 2,547
White
1970 1975 19S0
90,136 97,510 106,288
9,231 11,282 12,874 (5,(561 9 307 11,352 9,009 8,932 9,377 8,379 9,066 8,989
(;9,396 95,610 103,161
8 491 10,119 11,&42 8,861 8 570 10,192 9,009 <5,932 8,641 8,379 9,066 8,9<59
88,708 93,649 99,723
7 804 8,843 10,159 8,86l 7,886 8,921 9,009 (5,932 7 958 8,379 9,066 8,989
88,142 91,905 96,528
7 238 7,663 8,702 8,861 7 322 7,745 9,009 8,932 7 395 8,379 9,066 8,989
7,636 8,435 9,117 6,131 7,693 8",85 5,036 6,17', 7,724 4,859 5,046 6,173 5,223 4,820 5,005
5,329 5,108 4,718 4,844 5,114 4,905 4,345 4,523 4,780 3,610 3,909 4,075 2,851 3,065 3,328 2,065 2,239 2,419 2,726 2,797 2,966
Nonwhite
1985 1965 1970 1975 1980 1985
115,827 11,259 12,537 14,252 16,352 18,757
13,828 1,649 1,787 2,252 2,668 3,004 12,939 1,487 1,645 1,7S2 2,2',4 2,658 11,417 1,316 1,490 1,648 1 785 2,245
9,433 1,080 1,315 1,4S8 1,645 1,781
111,562 11,259 12,385 13,843 15,638 17,709
12,6S0 1,649 1 635 1,994 2,361 2,665 11,711 1,487 1,645 1 632 1,988 2,353 10,260 1,316 1,490 1,648 1 634 1,990
8,701 1,080 1,315 1,488 1,645 1,632
106,679 11,259 12,237 13,410 14,847 16,519
11,225 1,649 1 487 1,708 2,000 2,263 10,233 1,487 1,645 1,485 1,704 1,994
8,992 1,316 1,490 1,648 1 488 1,707 8,020 1,080 1,315 1,488 1,645 1,486
102,024 11,259 12,113 13,029 14,134 15,443
9,756 1,649 1,364 1,449 1,666 1,896 8,782 1,487 1,645 1 362 1,447 1,663 7,818 1,316 1,490 1,648 1 366 1,450 7,459 1,080 1,315 1,488 1,645 1 361,
9,040 810 1,074 1,307 1,479 1,634 9,162 643 805 1,065 1,294 1,464 8,512 615 638 797 1,05" 1,280 7,711 621 605 629 785 1,037 6,117 618 602 588 612 765
4,901 537 589 576 563 588 4,536 494 500 550 539 529 4,591 404 444 451 498 490 4,313 3',5 347 384 392 434 3,478 227 272 276 307 316 2,639 18e· 165 200 205 231 3,209 231 257 258 282 303

12
Table 4.--ESTIMATES AND PROJECTIONS OF THE WHITE AND NONWHITE POPULATION OF THE UNITED STATES, BY AGE AND SEX, 1965 TO 1985--Continued
(In thousands. Figures relate to July 1 and include Armed Forces abroad. B'or- a the four ser.ies of projections, Dee text~ Figures inside heavy lines :cepreeent, years after 1965)
-
White 2)8ries) age, and
se:x 1970 1')1l0 19[\'5
-----~-".~-
F:EMALE
Serieo A
All ageB •••• ~ ••• ~ .. [j6,826 9;~, 938 100,653 109,559 119,0'/8 11,SB2 - -, IS" Under 5 years .... " .. ~. 8,378 8,'/9.'3 71 :, 2:::)~· 62!,
'j t,() 9 ......... 8,601 fJ,~61 8;8;;; 820 10 to ~lear8 •...... ~ 8,00:; 8,m/,· 8,:i3!,· il 'N,?
9;029 1, J1'7
to 19 yea:rf3., •••• ~ • 7,315 8,088 1:>,616 1,081
SGries B
All ages •.......•• 86,826 92,23J 98,842 106,580 115,015 11,882
Under 5 years ••..•.•.• 8,088 635 11,032 12,063 1,62/, 5 to 9 years .......... 8,461 8;172 9,715 11,158 1,491 10 to 14 years ••.•..•• 8, 67~· 8,)34 8,246 9,787 1,317 15 to 19 years •.....•• 8,088 8,756 8,616 8,329 1,081
Series C
All ages •.....•••. 86,826 91,578 96,974 103,306 110,364 11,882
Under 5 years .... 4 •••• 8,378 7 433 ~:~~~ 9,670 10,681 1,621. 5 to 9 years~ ..•.•...• 8,601 8,461 8,5~ 9,751 1,491 10 to 14 years •...•..• 8,005 8,674 ~,534 7,594 8,577 1,317 15 to 19 years •.•...•• 7,315 $,088 8,616 7,678 1,081
I Series D
IUl ages •.......•. 86,826 91,039 95,313 100,262 105,930 11,882
Under 5 years ••.•...•• 8,373 6 894 7,297 8,284 9,284 1,62/, 5 to 9 years .......... 8,601 8,461 6 982 7,383 8,368 1,491 10 to 14 years ........ 8,005 8,674 8,534 7,057 7,458 1,317 15 to 19 years ........ 7,315 8,088 $,756 -S; 616 7,11,.2 1,081
All Series--20 Years Old and Over
20 to 2~· years ........ 96, 8,231 897 8,758 832 25 to 29 years •.•....• 982 099 7,592 360 9,025 715 30 to 34 years ........ 868 6,157 8,410 703 35 to 39 years ••.....• 365 5,072 7,658 727 40 to 44 years •••...•• 361 4,898 6,1'71 696
45 to 49 years ••..•..• 278 629 315 4,860 034 602 50 to 5~ years •......• 5,227 539 55 to 59 yearG~ ..•... ~ !"JOI, 749 042 5,381 432 60 to 64 years .. _ ...•.• 3,736 536 4,819 363 65 to 69 years •.••..•• 3,171 800 4,201 256 70 to 74 years ........ 2,683 J,339 223 75 years and over •... * 3,611 4,940 281
-
of the assumptions underlYing or part, survivors of births fol'
-= Nomlhite
197'5 1980 1985 -- ------I
1.1 263 15,060 1'1,222 19,675
1,'16:3 '")')0 628 1;62.'1" 1,;61
1 627 l,7M 319 1,6;28 ~~
13,113 11+,657 16,519 18,641
1,613 1,966 2,326 2,625 1,62:; 1,612 1,963 2,321 1, 49:'j
I 1,62"'1 1,616 1,966
1,319 1,497 1,621:> ~
12,967 14,230 15.738 17,467
1 467 j 1,684 1,970 2,228 1,623 1,467 1,683 1,968 1,495
I 1,627 1)~.71 1,686
1,319 1,497 1,628 ~
12,845 13,854 15,035 16,406
1 3~5 1,429 1,6~,2 1,867 1,623 1 346 1,429 1,641 1",95 I 1,627 1 350 1,433 1,319 1,.49'1 1,628 ~
1,090 1,327 ,504 1,636 843 1,100 ,335 1,512 719 8,·6 ,100 1,334 701 717 843 1,094 711,. 689 706 830
675 694 671 68$ 573 6!t/t 664 643 501 535 603 624 386 450 MlJ 548 307 329 386 41$ 208 251 271 321 345 373 418 1,65