project performance measurement - value analysis value ... · addressing cost and schedule concerns...
TRANSCRIPT
1
CRAVECost Risk Assessment + Value Engineering
CSVA 2011 Conference Toronto, OntarioNov 14 -16, 2011
Ken L. Smith, PE, CVS
© HDRINC all rights reserved

2
Topic Overview
marketing statement, what is in it for me, my organization, why should I listen…what the problem was…what I will learn…
What we did…Closing statement…

Addressing Cost and Schedule Concerns
• Risk Identification• Qualitative and Quantitative
Risk Analysis• Value Engineering &Mitigation
Strategies• Risk Monitoring & Control
Analysis Needs
• How much will it cost?• How long will it take?
• Why does it cost that much?• Why does it take that long?
Usual Questions
3

What is CRAVE
CRAVE is used to assist project delivery as well as minimize and mitigate quantified risksCRAVE - innovative unique process – Cost Risk Analysis + Value
EngineeringCombines these two tools to assist with project delivery
Outputs are:– Risk management plan– Value Engineering
recommendations

Why CRAVE
Risk assessment workshops would provide valuable information about what could go wrong with my project but would fall short of providing solutions on what to do about itGreat ideas would come up during risk assessment workshops and would be set aside as potential VE ideas and not recordedValue Engineering could add risk to delivering a project The same team members are required for both process
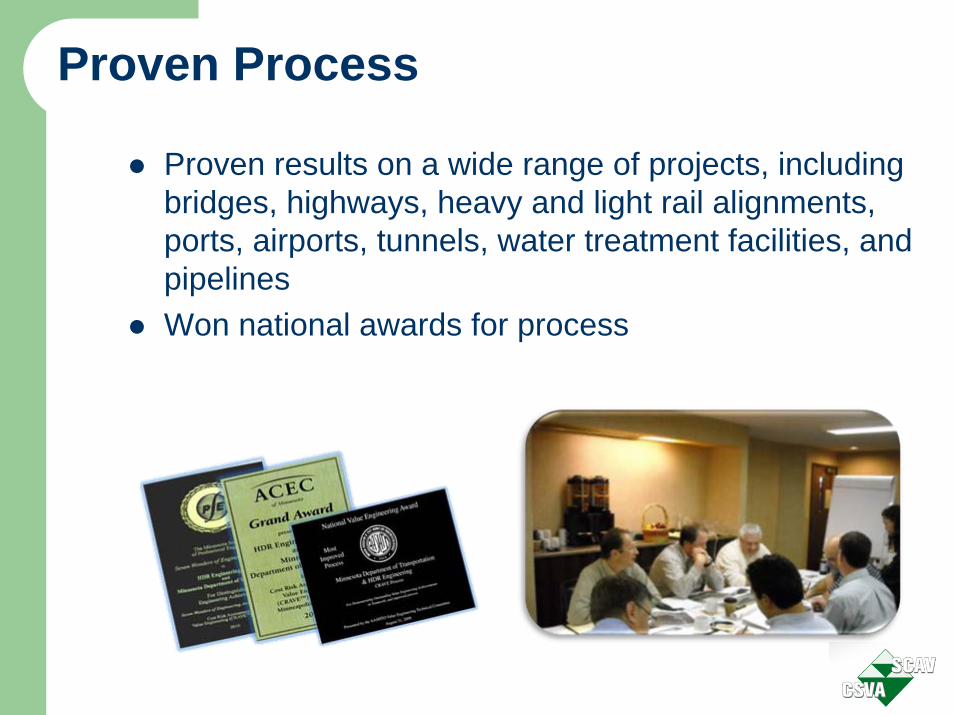
Proven Process
Proven results on a wide range of projects, including bridges, highways, heavy and light rail alignments, ports, airports, tunnels, water treatment facilities, and pipelinesWon national awards for process

CRAVE How it works

Traditional Vs. Risk-Based Approach
Environmental Requirements
30%Project Base
Cost
Geotech20%
Materials40%
Design5%
Project Base Cost
Fixed Contingency %

CRAVE Process: Step 1
30%
Des
ign
100%
Des
ign
Cons
tructi
on
Comp
letion
Perc
enta
ge o
f AB
P B
RID
GE
Pro
ject
Cos
t
Project Development (Time)
Unrecognized Cost
Known butNot Quantified
Known and Quantifiable(can include small uncertainty)
Total Cost at Construction Completion
Total = Conservative Deterministic Estimate (with Allowance)
Contingency
Estimate at any point in
time
Proje
ct Pl
an &
Co
ncep
t
PS&E
> A
d

Need for a Solid Flowchart
Activity A
Start End
Activity C
Activity D
Activity B
$}Identifying where risks reside within the
program/project stages
10

Project Schedule Flowchart
11
In Water Work
Window (July 1 -Oct 31)
In Water Work
Window (July 1 -Oct 31)
In Water Work
Window (July 1 -Oct 31)
In Water Work
Window (July 1 -Oct 31)
In Water Work
Window (July 1 -Oct 31)
Jan-Jun Jul-Dec Jan-Jun
Pile Driving Work
Window (July 10
- Oct 15) --Not to Scale--
Jan-Jun
2011 2012 2013
1. Design (Package A, B, C)
10 months
Flowchart Assumptions1. Construction Contract is CMGC2. Milestone Dates Shown are Calculated Dateswithout Schedule Risk or Float
Base Schedule Project Milestone Assumptions are:
GMP Decision – 4/26/2012Construction NTP – 5/1/2012Project Completion – 12/2016
Design Package A – 60% FoundationsDesign Package B – 90% Foundations, 60% BridgeDesign Package C – 100% Foundations, 90% Bridge, 60% InterchangeDesign Package D – 100% Bridge, 90% InterchangeDesign Package E – 100% Interchange
5. ROW Acquisition13 months
3. Environmental Permitting13 months
23. Bridge Construction (North Half)20 months
8. GMP3 months
9. GMP Decision4/6/2012
26. Project Complete9/20/2016
Jan-Jun Jul-Dec
2014
Jan-Jun Jul-Dec
2015
Jan-Jun Jul-Dec
2016
4. Utility Relocation13 months
FF
FF
FF
2. Stakeholder Endorsement Of B and C4 months
SS + 6 Months
10. NTP4/11/2012
FS + 10 MonthsFF + 12 Months
17. Eastside Civil6 months
FS + 5 Days
11. Mob & Submittals2 months
6. Early Procurement
6 months
SS + 6 Months
FF
24. Demo Existing Bridge
Foundations3 months
22. Demo
Existing Bridge
3 months
25. Remove Work
Bridges2 months
FF
21. Interchange Construction Phase 216 months
Pile Driving Work
Window (July 10
- Oct 15)
12. Work Bridge &
Coffer Dam (South)
1.5 months
13. Work Bridge &
Coffer Dam (North)
1.5 months
14. Bridge Foundation & Stem Part 1
4 months
7. 100% Design (Package D & E)
7 months
Jul-Dec
FS + 10 Months
SS + 3 Months
Jul-Dec
16. Interchange Construction Phase 112 months
FF
18. Landslide12 months
19. Rock Cut6 months
20. Bridge Construction (South Half)20 months
15. Bridge Foundation & Stem Part 2
4 months
Sellwood Bridge Replacement Project
Construction Activities Constrained by In Water Pile Driving Window
Construction Activities Constrained by In Water Work Window
Construction Activities
Pre-Construction Activities
Milestone

Planning ProgrammingPreliminary Design Final Design A/B/A Construct
Comprehensive Risk List at Each Stage
Environment
Right of Way
Governance/Stakeholders
Financing
Civil & Environmental Justice
Multi-modal Systems
Teaming
Options/Alternatives
Geotechnical
Structures
Pavements
Hydraulics
Stormwater
Tunnels
Intelligent Transportation
Permitting
Contracts
Insurance/
Bonds
Construction Methods
MOT
Market Conditions
Disputes
Weather
Security
12
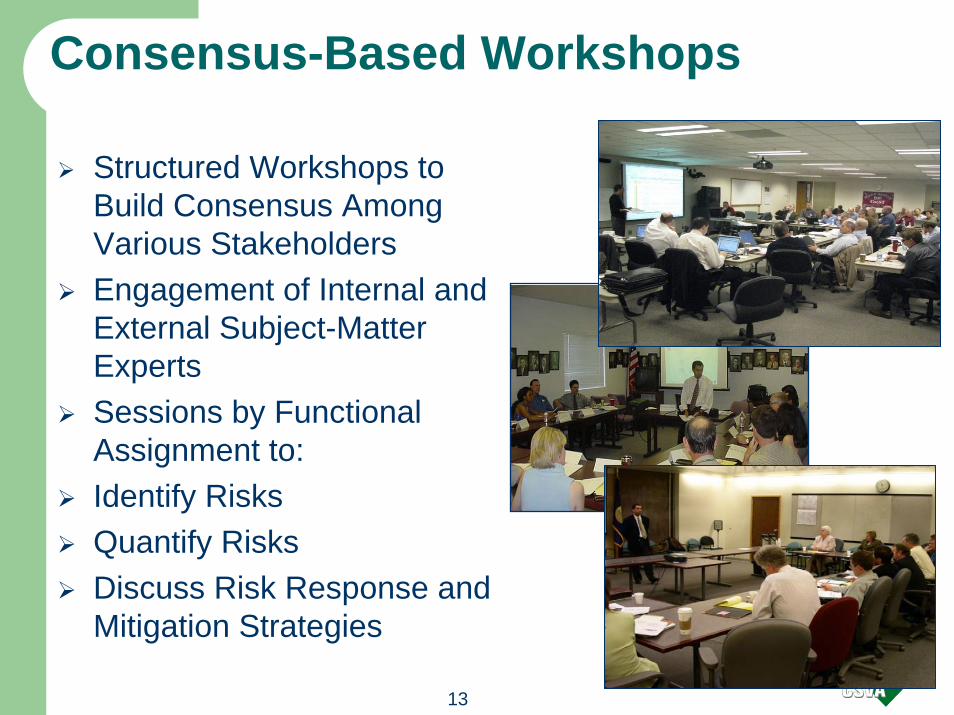
Consensus-Based Workshops
Structured Workshops to Build Consensus Among Various Stakeholders Engagement of Internal and External Subject-Matter ExpertsSessions by Functional Assignment to:Identify RisksQuantify RisksDiscuss Risk Response and Mitigation Strategies
13

Risk Elicitation• Focus on issues that matter• Describe the event properly• What will trigger the event?• How likely is it to occur?• Is the event dependent on or correlated with other
events?• What are the potential impacts (cost/schedule)?• If the event occurs what are the impacts
• on the low end?• on the upper end?• most likely?
14
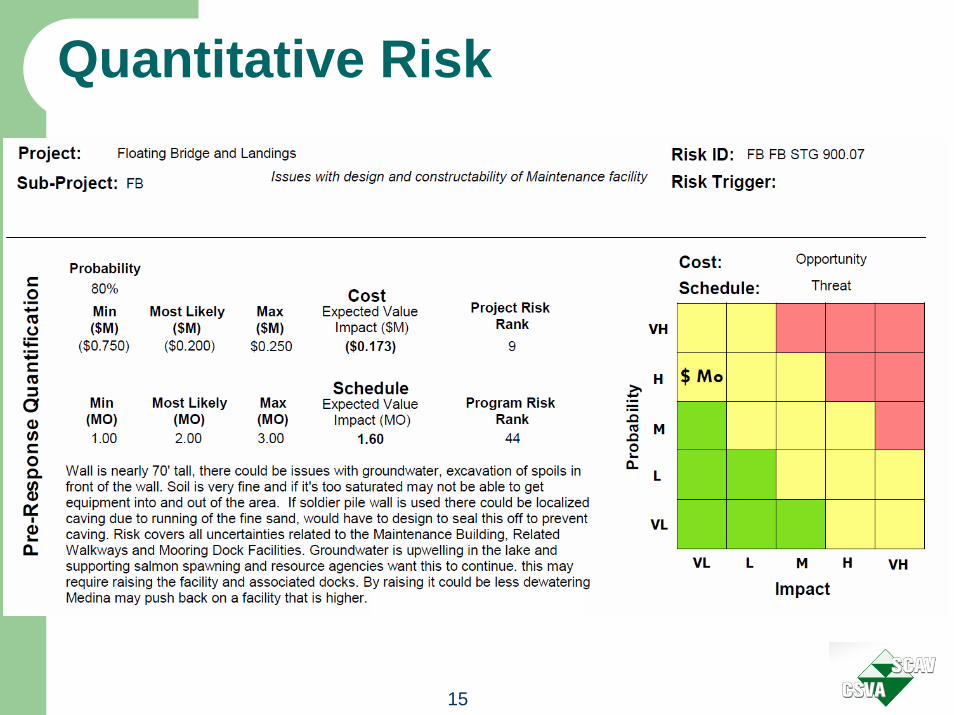
Quantitative Risk
15

CRAVE Process: Step 1Non-Mitigated Risk-Adjusted Cost Estimates
BID PRICE 02/07 ($219 M)
RISK ANALYSIS OF TOTAL PROJECT COSTS
BaselineNon-Escalated
BaselineEscalated
$150.3 $172.8
100%
90%
80%
70%
60%
50%
40%
30%
20%
10%
0%
$135 $155 $175 $195 $215 $235 $255 $275 $295 $315
Total Project Cost ($Millions)
Prob
abili
ty o
f Not
Exc
eedi
ng
$170.9$186.9
$192.3
$195.9
$199.6
$202.7
$209.3
$206.2
$212.0
$214.9
$217.5
$220.5
$223.3
$226.1
$228.9
$232.7
$236.9
$242.0
$247.7$255.1
$281.5

Baseline Risk Assessment Risk-Adjusted Schedule Projection
17

CRAVE Process: Step 1Prioritization of Risks
18

CRAVE Process: Step 2Value Engineering Assessment
Assessment
Recommendations
Project Review
Screening
• High cost areas • Generate ideas
• Evaluate ideas
• Quantify Ideas
Probability of Occurrence
Impact Initial Risk
MANAGED RISK

Value Engineering has traditionally been perceived as an effective means for reducing project costs.
WHAT IS VALUE?
This only addresses one part of the value equation, often times at the expense of
reducing performance.

Establishing the Goals and Objectives of VE Study is critical to its outcome.Defining “Performance Attributes” will give the VE Team a better understanding of the project’s purpose and need.
Typical Highway Performance Attributes • Mainline Operations
• Local Operations• Maintainability
• Construction Impacts• Environmental Impacts
• Project Schedule• Reduce Risk
PERFORMANCE ATTRIBUTES
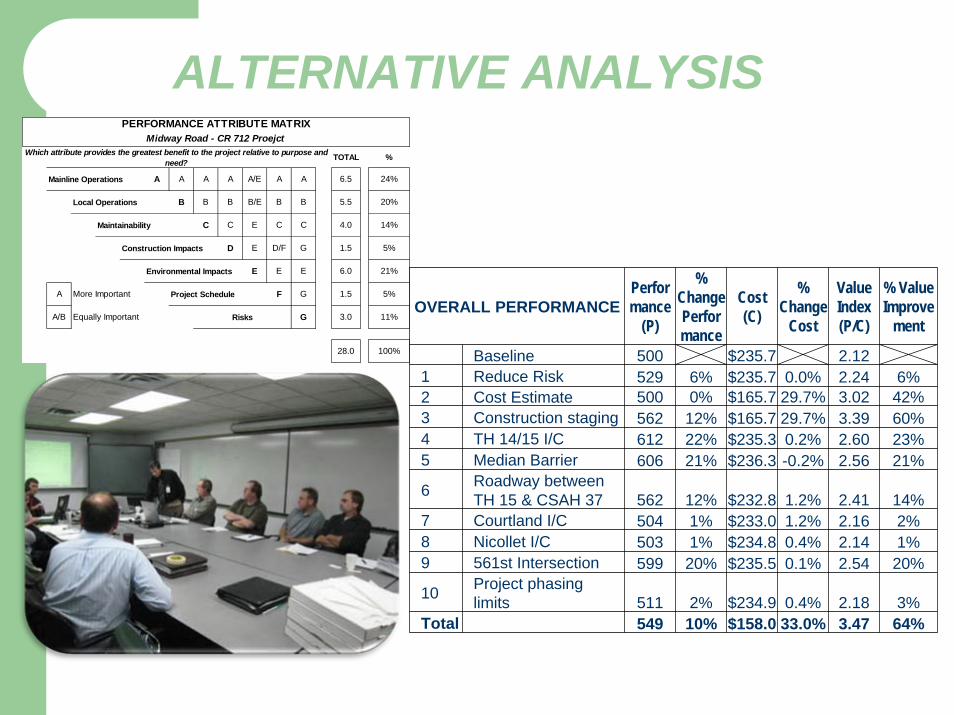
ALTERNATIVE ANALYSIS
A A A A A/E A A 6.5 24%
B B B B/E B B 5.5 20%
C C E C C 4.0 14%
D E D/F G 1.5 5%
E E E 6.0 21%
A F G 1.5 5%
A/B G 3.0 11%
28.0 100%
PERFORMANCE ATTRIBUTE MATRIX
TOTAL %Which attribute provides the greatest benefit to the project relative to purpose and need?
Midway Road - CR 712 Proejct
Mainline Operations
Local Operations
Maintainability
Construction Impacts
Environmental Impacts
Project Schedule
Risks
More Important
Equally ImportantOVERALL PERFORMANCE
Performance
(P)
% ChangePerformance
Cost (C)
% Change
Cost
Value Index (P/C)
% Value Improve
ment
Baseline 500 $235.7 2.121 Reduce Risk 529 6% $235.7 0.0% 2.24 6%2 Cost Estimate 500 0% $165.7 29.7% 3.02 42%3 Construction staging 562 12% $165.7 29.7% 3.39 60%4 TH 14/15 I/C 612 22% $235.3 0.2% 2.60 23%5 Median Barrier 606 21% $236.3 -0.2% 2.56 21%
6 Roadway between TH 15 & CSAH 37 562 12% $232.8 1.2% 2.41 14%
7 Courtland I/C 504 1% $233.0 1.2% 2.16 2%8 Nicollet I/C 503 1% $234.8 0.4% 2.14 1%9 561st Intersection 599 20% $235.5 0.1% 2.54 20%
10 Project phasing limits 511 2% $234.9 0.4% 2.18 3%
Total 549 10% $158.0 33.0% 3.47 64%

CRAVE Process: Step 3Quantification Mitigation for Each Risk
$1.8
$1.9
$1.9
$2.0
$2.5
$2.9
$3.8
$4.0
$6.0
$6.1
$1.2
$0.9
$1.9
$1.2
$0.2
$1.5
$1.9
$2.4
$2.0
$6.1
$0.0 $1.0 $2.0 $3.0 $4.0 $5.0 $6.0 $7.0
C6: Material availability (27)
Ge1: Geotechnical surveys in contaminated area requires contractdrilling (8)
Rw10: Delay to Start of ROW Activities (11)
En33: Cities request upgrade to drainage systems (2)
C3: Defective work results in schedule delay and additional costs (27)
D21: Perched Contaminated water above aquifer may requirealteration of structures and wall foundation design (9)
D4: Delay in bridge site submittal holds up structures design start (9)
Hz4: May need to engage with Water Board and/or DTSC (15, 18)
D15: Changes in structures design (9)
Hz1: Delay of Right of Entry to Sample Site (15,18)
MillionsExpected Increase in Cost
Mitigated Impact
Non-MitigatedImpact

Risk Responses
Avoidance is a change to the project scope to eliminate the impact of a risk. Transference of a risk to another party who is more capable at handling the risk (such as the contractor or insurance company). Mitigation is seeking to lessen the impact of a specific risk items, which may involve the consumption of additional time and/or money. Acceptance is recognition by the project team of a specific risk and decision to not take action to deal with the risk.
24

CRAVE Process: Step 3Quantifying Mitigation Strategies at the Project Level
Mitigation Value

CRAVE Process: Step 4Tracking, Monitoring, and Control
26
Avoiding Denial

CRAVE Process: Step 4Adequate and Continuous Reporting
27Transparency and accountability

CRAVE Process: Step 4Informed Risk Allocation
Contractors do not take
risks They Price it !

Defining Risk Management
Risk Management is the systematic process of identifying, assessing, and responding to risks in order to manage or reduce potential adverse effects on the achievement of program and project goals
Program/Project
Purpose & Needs
Risk Identification
& Assessment
Continuous Iterative Process
Risk Tracking
& Monitoring
Risk Response
& Mitigation Strategies
29

Managing Threats and Opportunities
30
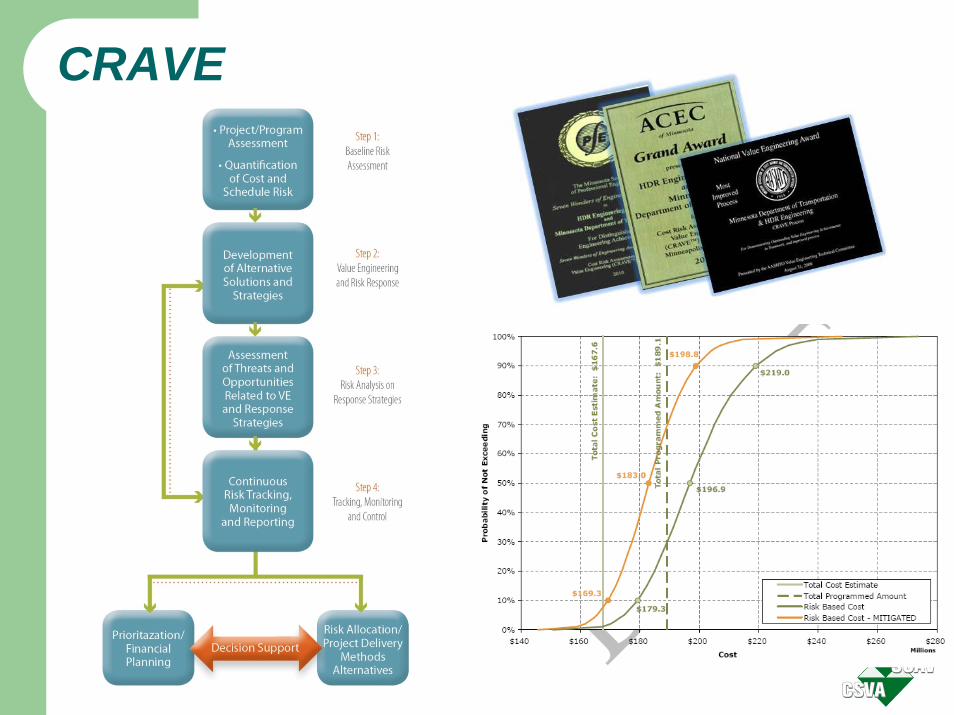
CRAVE

32April 26, 2011
Sellwood Bridge Project
CRAVE
$223
$237
$249
$274
$280
$308
0%
10%
20%
30%
40%
50%
60%
70%
80%
90%
100%
$210 $260 $310 $360
Prob
abili
ty o
f Not
Exc
eedi
ng
Cost Millions
Risk Analysis ResultsTotal Project Cost
Base Cost Estimate (Current Year $'s)
Base Cost Estimate Escalated w/Base Schedule (YOE $'s)
Risk Analysis Results (YOE $'s)
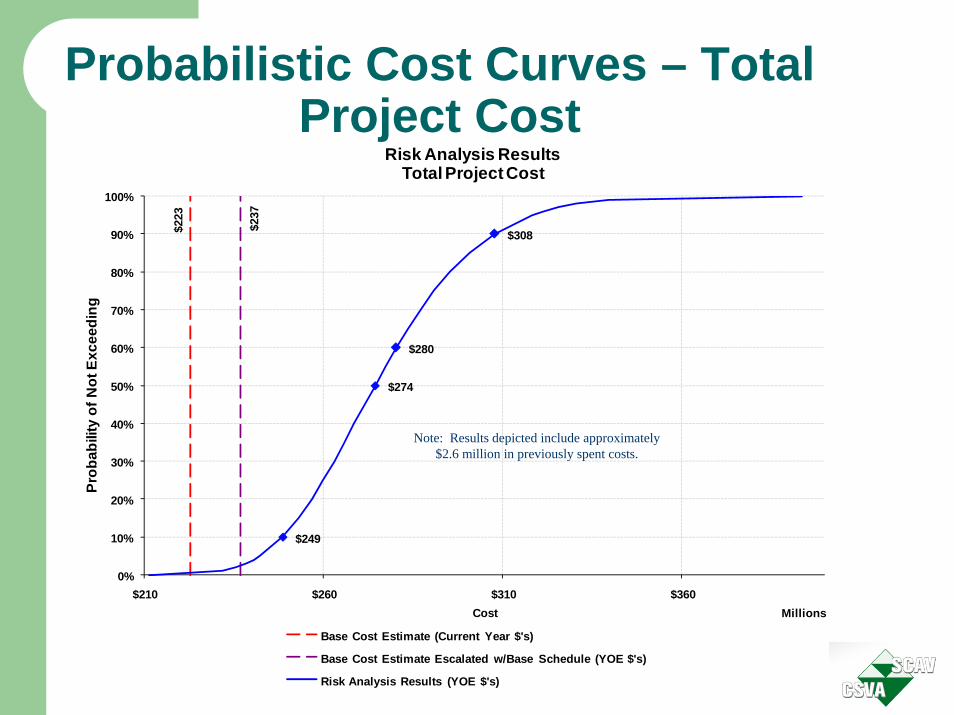
Probabilistic Cost Curves – Total Project Cost
33
Note: Results depicted include approximately $2.6 million in previously spent costs.

Tornado Chart – Top Risks Impacting Project Costs
34
$0.8
$1.4
$1.4
$1.4
$2.8
$3.1
$3.1
$7.1
$9.6
-$19.0
-$25 -$20 -$15 -$10 -$5 $0 $5 $10
DES-6: Design features are added to the bridge (20,23)
STG-3: Stabilize entire landslide (not just bridge) (18)
STG-2: Changing Geotechnical Conditions (Due to New Information) Landslide (18)
CON-14: Other Construction Projects in Region Limit Supply / Cost of Materials (Impact to Non-Steel Materials) (All Construction activities)
CON-19: Meeting Sustainability Goals (All Construction activities)
DES-3: Add scope to the project for North-South Streetcar Project (21)
CON-23: Landslide triggered during excavation in interchange area (14,16)
CON-16: Shortage of DMWESB (All Construction activities)
CON-22: Extraordinary steel price escalation (20,23)
SF-1: Opportunity of a shoo-fly alignment (Split Evenly between 20,23)
Expected Value (Mean) Increase in Overall Project CostMillions
Top Cost Risks
Event Risk Cost Event Risk Cost Markup
Escalation Cost Additional Support Cost

Probabilistic Cost Curves –Project Total Cost
$223
$237
$249
$274
$280
$308
$227
$248
$253
$276
0%
10%
20%
30%
40%
50%
60%
70%
80%
90%
100%
$180 $230 $280 $330 $380
Prob
abili
ty o
f Not
Exc
eedi
ng
Cost Millions
Risk Analysis ResultsTotal Project Cost
Base Cost Estimate (Current Year $'s)Base Cost Estimate Escalated w/Base Schedule (YOE $'s)Pre-Response Cost - Risk Analysis Results (YOE $'s)Post-Response Cost - Risk Analysis Results (YOE $'s)
Note: Results depicted include approximately $2.6 million in previously spent pre-construction
costs.
Budget $260

Value Engineering Study
March 1st-4th, 2010
SR 193 Extension 2000 West
to I-15
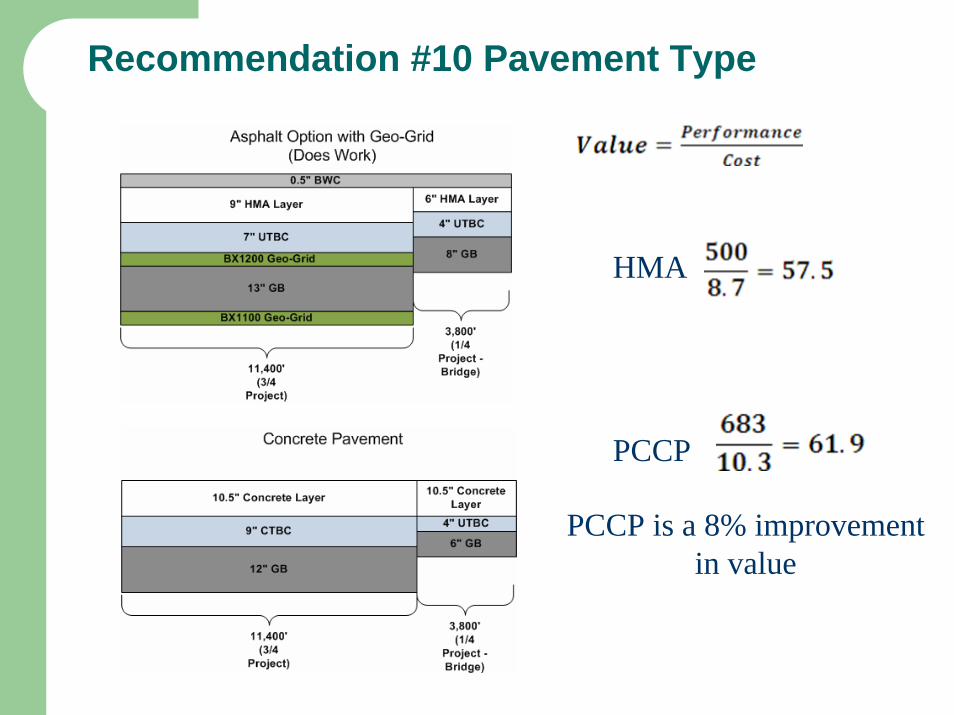
Recommendation #10 Pavement Type
37
HMA
PCCP
PCCP is a 8% improvement in value
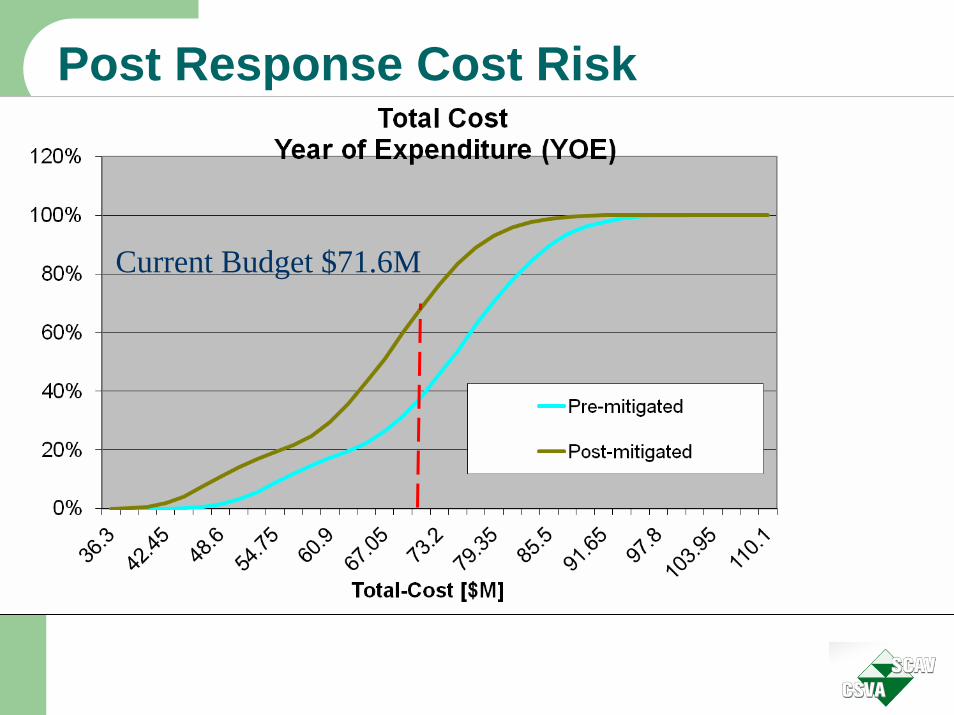
Post Response Cost Risk
38
Current Budget $71.6M

Statistics Pre-mitigated Post-mitigated
Min 41.91 $M 38.15 $M Max 101.93 $M 95.47 $M
Median 73.44 $M 67.87 $M 10% 55.02 $M 49.10 $M 20% 61.95 $M 56.24 $M 30% 67.62 $M 62.09 $M 40% 70.84 $M 65.22 $M 50% 73.44 $M 67.87 $M 60% 75.93 $M 70.10 $M 70% 78.50 $M 72.55 $M 80% 81.26 $M 75.22 $M 90% 85.08 $M 78.72 $M
CRAVE™ Results
39
40 Year pavement with a better than 65% chance of not exceeding current budget

Contact Information
Ken L. Smith, PE, CVS (LIFE)HDR Director of Value Engineering
Additional HDR Certified Value Specialist •Tammy Dow, M.SC.E., P.ENG., CVS•Blane Long, CVS•Don Owings, PE, CVS