project apollo task msc/trw - nasa€¦ · project apollo task msc/trw a.-50 apollo mission ti,...
TRANSCRIPT
TRW NOTE NO. 70-FMT-819
PROJECT APOLLO T A S K MSC/TRW A - 5 0
APOLLO M I S S I O N 1 1 I T E A J E C T O R Y RECONSTi3UCTiON A N D POSTFLIGHT A N A L Y S I S
VOLUME 1
16 MARCH 1970
> /3 3 / (CODE1
g
5
E IPAGESI I : !
ICATEGORYJ
1 0
WASA CR OR TUX OR AD NLIMBPRJ
I
Prepared for MISSION PLANNlNG AND ANALYS!S DIVIS13N
MS. N N ED - SP .-- AC EC RA I; T C E b! T ER Hu t ' b lON, iE/';AS
NAS 9-8165
NATIONAL AERGNKJT~CS AND SFACE AD.911 NISTRATION
REPRODUCEDBY U S DepartmtofCmmem
Naiwnal Technical lltormalnn S e m e Spnnfldd Wrginia 22161
https://ntrs.nasa.gov/search.jsp?R=19700014995 2020-05-22T04:32:56+00:00Z
TRW NOTE NO. 70-FMT-819
PROJECT APOLLO T A S K MSC/TRW A.-50
APOLLO MiSSION TI, TRAJECTORY .RECONSTRUCTION A N D P O S T F L I G H T A N A L Y S I S
V O L U M E 1
16 MARCH 1970
Prepared for
NATIONAL AERONAUTICS AND STACE ADMifNISTRATiON MANNED SPACECRAFT CENTER
MISSION PLANNING AND ANALYSIS DIVISION
N P S 9-81 66
W’ 48 3 %c,k,,.,Cc c >A’ Approved by 9 6? Ah-*=+ Approved by
W. P. Gircd, Manager MSC/TRW Task A-50
J. E. Alexander, Menager Guidance and Control Systems Department
Approved by 5K.z3qw& Approved by H . L. Moore, Manager MSC/TRW Task A-50 Project Manager
D. G. Saile, Assistant
Guidance and Perforrncnce Mission Trajectory Control Program
Approved by Pg@L/v, Approved by yc>>- R. I? Parten, Chief Mission Planning Support Office NASA Manned Spacecraft Center
R. K 1 Petersburg, Mana Systems Evaluation Department
FOREWORD
This r epor t i s submitted t o t h e NASA Manned Spacecraf t Center i n
accordance with MSC/TRWTask A-50 Contract NAS 9-8166.
contains t h e p o s t f l i g h t ana lys i s performed i n conjunct ion wi th t h e
ApoIIo I1 mission and i s issued as supplernent one t o t h e A p o l l o 11 Mission
B e p i - t (XASA/f.ISC Report MSC-09171, Nov. '1969) .
T h i s r epor t
The r epor t i s i ssued i n two volumes. Volume I contains details of
the ana lys i s and r e s u l t s obtained, inc luding appendixes. Vo lume I1
contains a l i s t i n g of t h e 45-day b e s t es t imated t r a j e c t o r y (BET) f o r t h e
Apollo I1 mission i n the NASA Apollo Trajectory (NAT) format. The list- ing i s n o t g e n e r d l y d i s t r ibu ted b u t i s a v a i l a b l e from NASA/MSC upon
request . Requests should be made to:
NASA/MSC Computations and Analysis Division Centra l Metric Data File Code ED-5, B u i l d i n g 12 , Roon 133 Houston, Texas 7 7058
iii

Page Intentionally Left Blank
TABLE OF CONTENTS
7.1 TN'i'RODUCTION AND STJNMARY
7.1.1 A p o l l o 11 Mission
7.1.2 P o s t f l i g h t Analysis
7.2 ORBIT ANALYSIS
7.2.1 Methods of Reconstniction
7.2.2
7.2.3
CSM Best. Estimate of Tra jec tory
LM Best Estimate o f Tra jec tory
7.2.3.1 D e s cent Phzse T r a j e c t o r i e s
7.2.3.2 Rendezvous T r a j ectories
7.3 ONBOARD T U C K I N G DATA ANALYSIS
7.3.1 In t roduct ion
7.3.2 Onboard Measurements
7 . 3 . 3 Evaluation of Onboard Tracking Data
7.4.1 Descent Trajec tor ies
7-, 4.2 Landing P,&r Velocity Residuzls
7.4.3
REFERENCES
Lunar Surface Alti tude Along Groundtrack
APPENDIX A
APPENDIX B
APPEhTDIX c
APPENDIX D
Page
7-1
7-1
7-1
7-7
7-7
7-8
7-9
7-10
7-15
7-15
7-16
7-16
7-63
7-63
7-65
7-75
R- 1
A- 1
B- 1
c-1
D-L
V

Page intentionally Left Blank

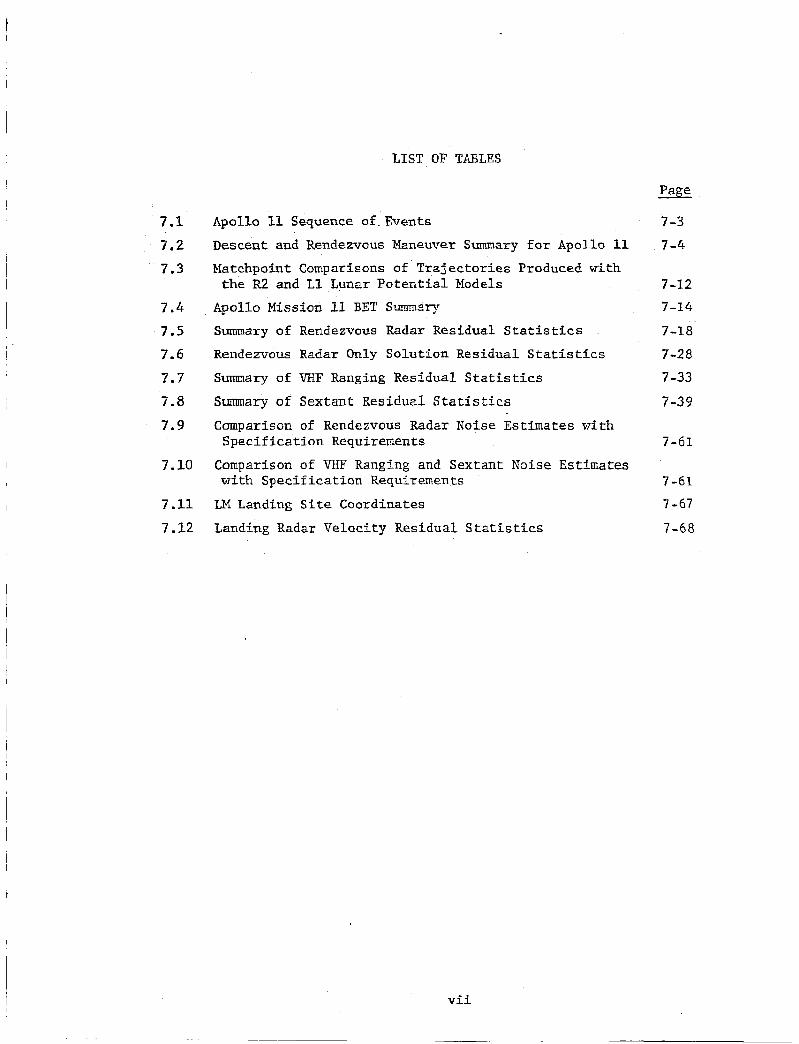
LIST OF TABLES
Page
7.1 7.2
7.3
7.4 7.5
7.6 7.7 7.8
7.9
7.10
7.11
7.12
Apol lo 11 Sequence of. Events
Descent and Rendezvous Mzneuver Summary for Apollo 11
Matchpoint Comparisons of T r a j e c t o r i e s Produced with
Apollo Mission 11 BET S m ~ 2 r y
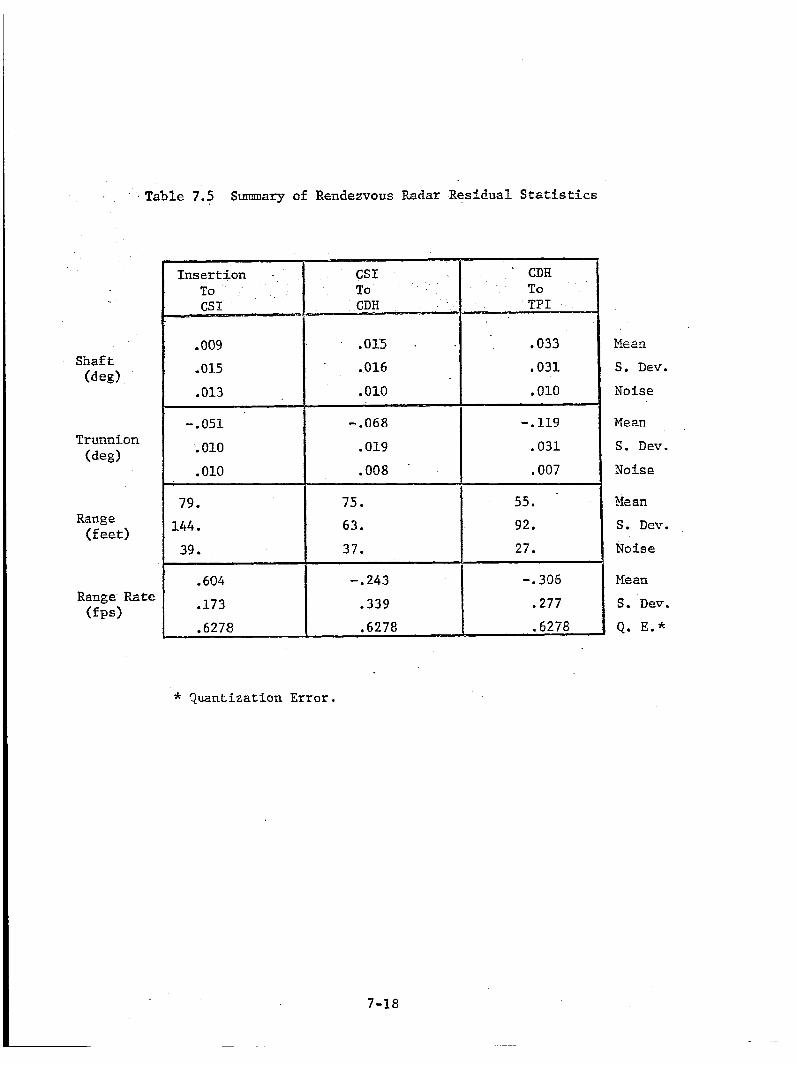
Summary of Rendezvous Radar Residual S t a t i s t i c s
Rendezvous Radar Only Solution Residual Sta t i s t ics
Summary of VHF Ranging Residual S t a t i s t i c s
Sulmnary of Sextant Residual S t a t i s t i c s
the R2 and L1 Lunar P o t e n t i a l Models
Comparison of Rendezvous Radar Noise Estimates with
Comparison of VHF Ranging and Sextant Noise Estimates
LM Landing S i t e Coordinates
Spec i f i ca t ion Requirements
r.7ith Spec i f i ca t ion Kequiremen.ts
Landing Radar Velac i ty Residual Statistics
7 -3
7 -4
7 -12 7-14
7-18.
7-28
7 -33
7-39
7-61
7 -61
7-67
7-68
vii

Page Intentionally Left Blank
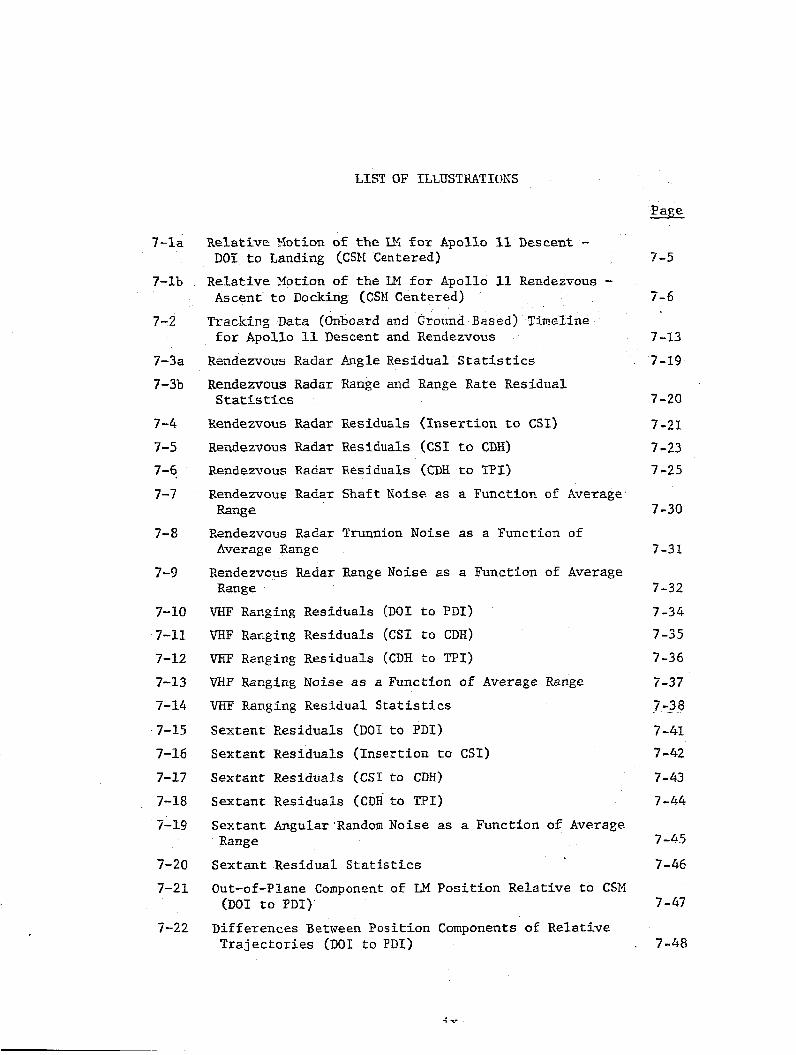
LIST OF ILLUSTRATIOXS
Page
?-la
7-lb
Relative Motion of the Ut €or Apollo I1 Descent -
Rela t ive Xotion of the LM for Apollo 11 Rendezvous -
Tracking Dat2 (Onbcsrd and C-round Eased) Timeline
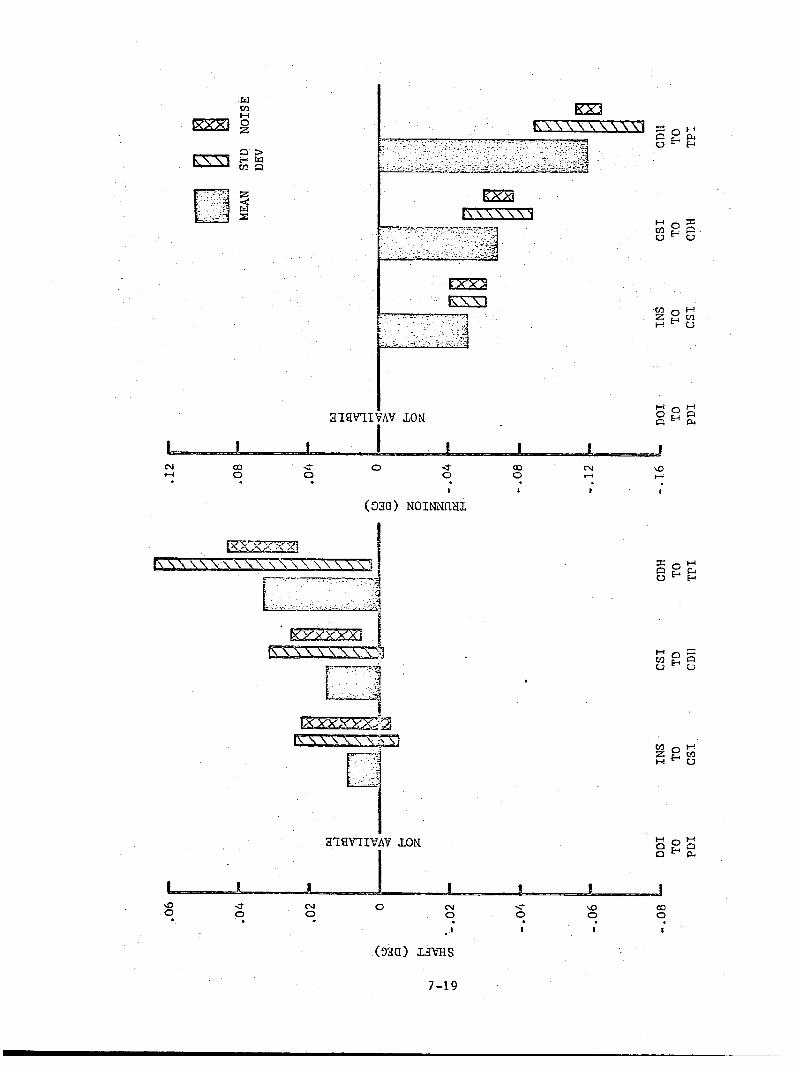
Rendezvous R a d a r Angle Residual S t a t i s t i c s
Rendezvous Radar Range and Range R a t e Residual
DOT t o Landing (CSM Centered)
Ascent to Docking (CSM Centered)
for Apol lo 11 Descent and Rendezvous 7-2
7-3a
7-3b
7-4 Rendezvous Radar Residuals ( I n s e r t i o n to CSI)
7-5 Rendezvous Radar Residuals (CSI t o CDH) 7-6 Rendezvous Radar Residuals (CDH t o PI) 7-7 Rendezvous R a d a r Shaft Noise 2s a Function of Averzge-
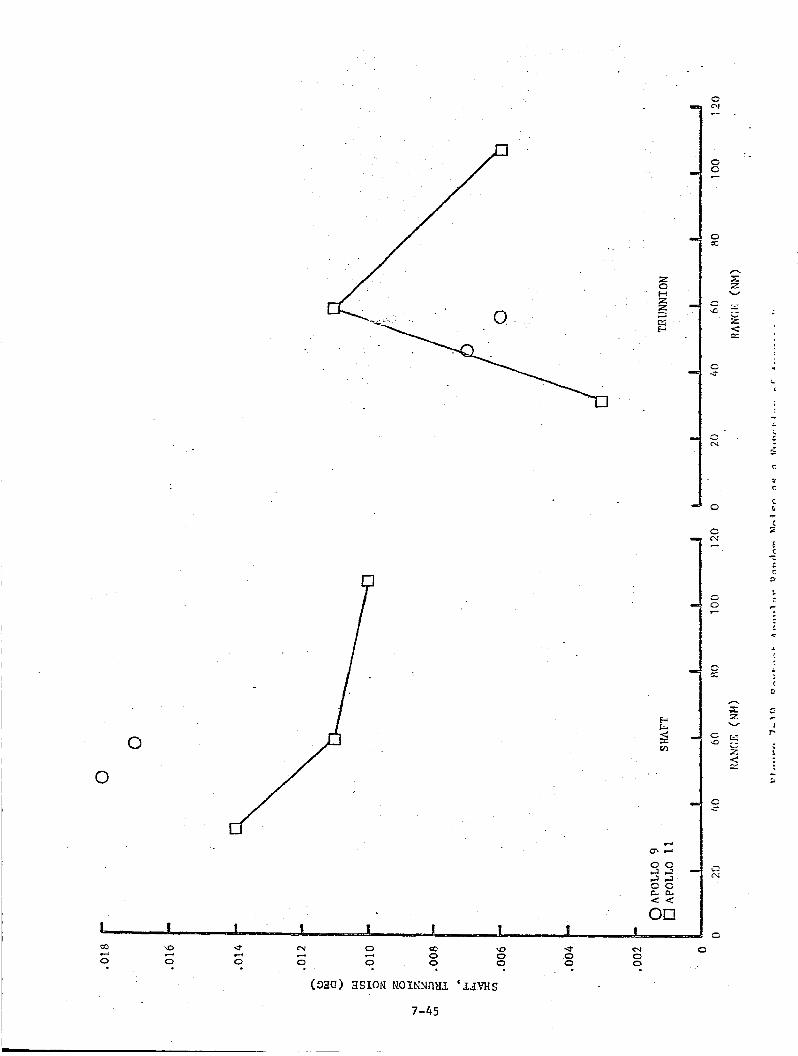
7-8 Rendezvous R a d a r Trunnion Noise as a Function of
Statistics
Range
Average Range
Range 7-9 Rendezvous Radar Eange Noise as a Function of Average
7-10 VHF Ranging Residuals ( D O 1 t o PDI) 7-11 VHF Ranging Residuals (CST t o CDR)
7-12 VRF Ranging Residuals (CDH to PI)
7-13
7-14 VXF Ranging Residual Stat is t ics
7-15 Sextant Residuals (DO1 t o PDI)
7-16 Sextant Residuals ( Inse r t ion t o CSI)
VHF Ranging Noise as a Function of Average Range
7-17 Sextant Residuals (CST to CDH)
, 7-18 Sextant Residuals (CDR’ t o TPI)
7-19
7-20 Sextant Residual Statistics
7-21
Sextant Angular ‘Random Noise as a Function of Average Range
Out-of-Plane Component of LM P o s i t i o n Rela t ive t o CSM
Dif fe rences Between Position Components of Relative
(DO1 to PDI)
T r a j e c t o r i e s (DO1 t o PDL) 7-22
7 -5
/ -6 - 7-13
7-19
7-20
7-21 7 -23 7 -25
7-30
7-31
7-32
7-34
7-35
7-36
7-37
7 -38
7 -41
7 -42
7-43
7-44
7-45
7-46
7-47
7-48
LIST OF TABLES
7.1 7.2
7.3
7 * 4 7.5 7.6 7.7
7.8 7.9
7.10
7.11
7.12
Apollo 11 Sequence of. Events
Descent and Rendezvous Maneuver Summary f o r Apollo 11
Matchpoint Comparisons of T r a j e c t o r i e s Produced w l t h
Apollo Mission 11 BET S u m m a y
Summary of Rendezvous Radar Residual S t a t i s t i c s
Rendezvous Radar Only Solu t ion Residual S t a t i s t i c s
Summary of VHF Ranging Residual Stat is t ics
Sulmnary of Sextant Residual Statistics
Comparison of Rendezvous Radar Noise Estimates with Spec i f i ca t ion Requirements
Comparison of VHF Ranging and Sextant Noise Estimates with Specification Requirements
LEI Landing S i t e Coordinates
Landtng Radar Velacity Residual S t a t i s t i c s
the R2 and L1 Lunar Potential Models
Page
7 -3
7 -4
7-12 7-14
7-18
7-28 7-33
7-39
7-61
7 -61
7 -67
7-68
vii
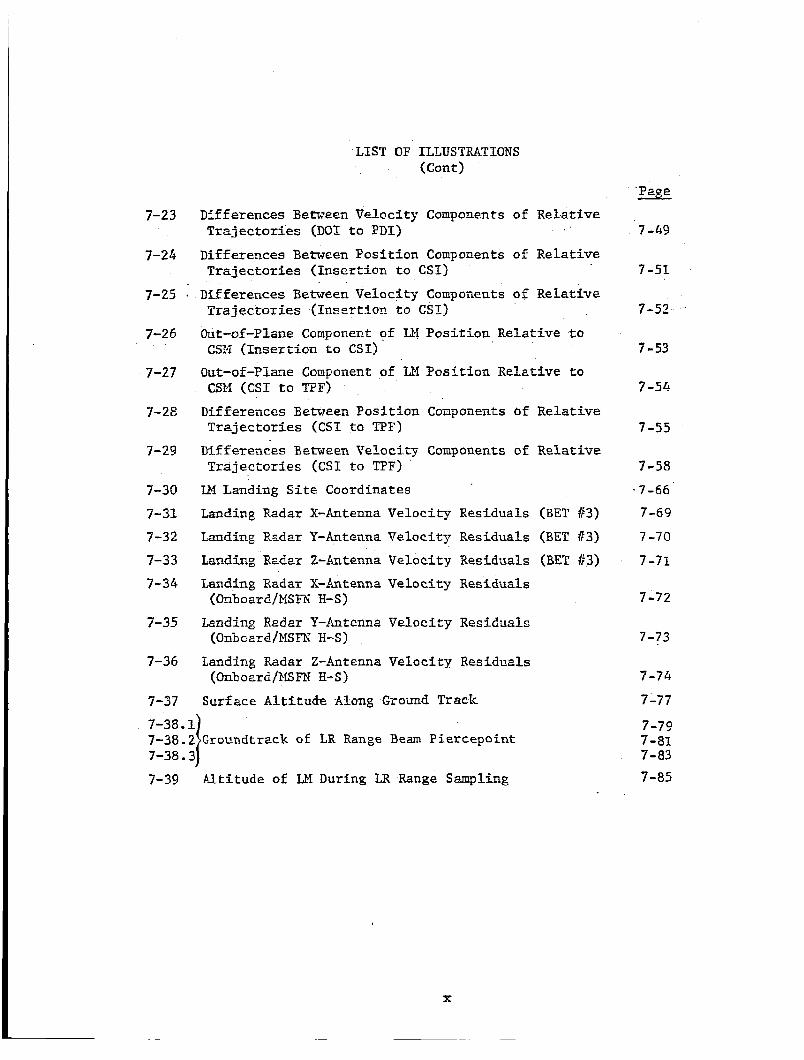
LIST OF ILLUSTPATTONS (cont)
7-23
7-24
7-25
7-26
7-27
7-26
7-29
7-30 7-31 7-32
5-33 7-34
7-35
7-36
7-37
Differences Befween Ve lcc i ty Components of Relative Trajectories (DO1 t o PDI)
Differences Between P o s i t i o n Components of Relative Trajectories (Insertion t o CST)
Differences Between Veloci ty Components of Relative Trajectories ( Inser t lo r ! t o CSZ)
Out-of-Plane Component of Df P o s i t i o n Relative t o CSM ( I n s e r t i o n t o CSI) Out-of-Plane Component of U4 Position Relative t o
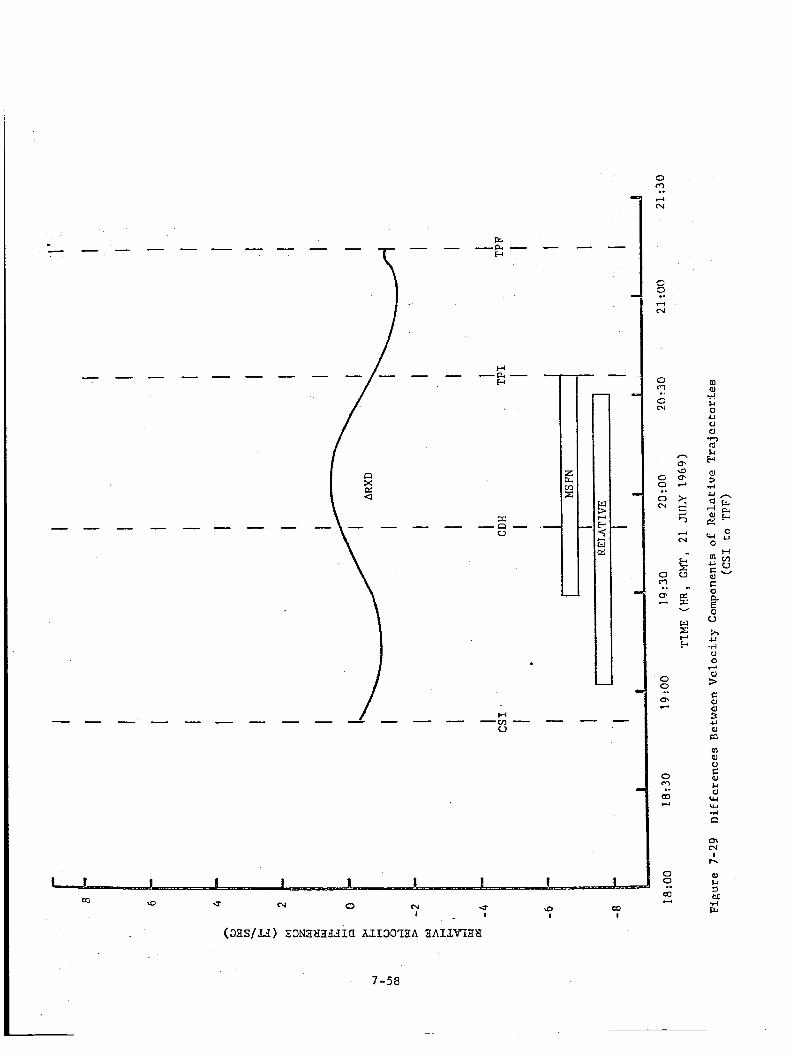
CSEl (CST t o TPF) Differences Between Position Coinponents Of Relative Trajectories (CSI t o QF)
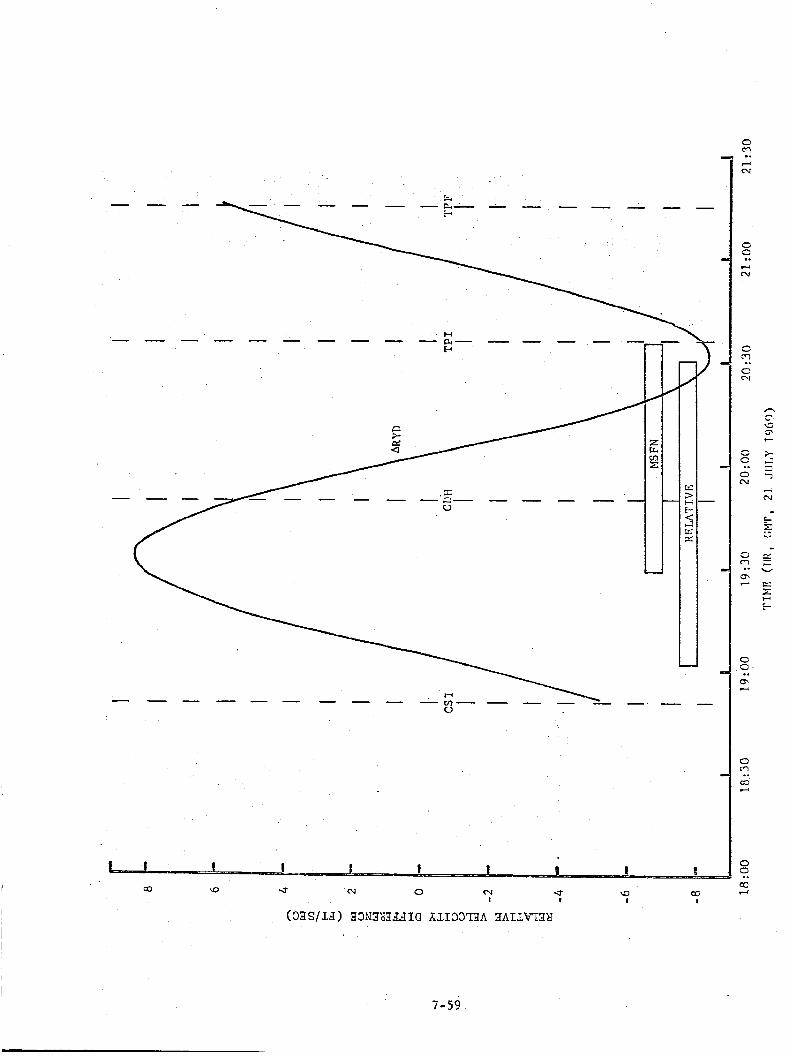
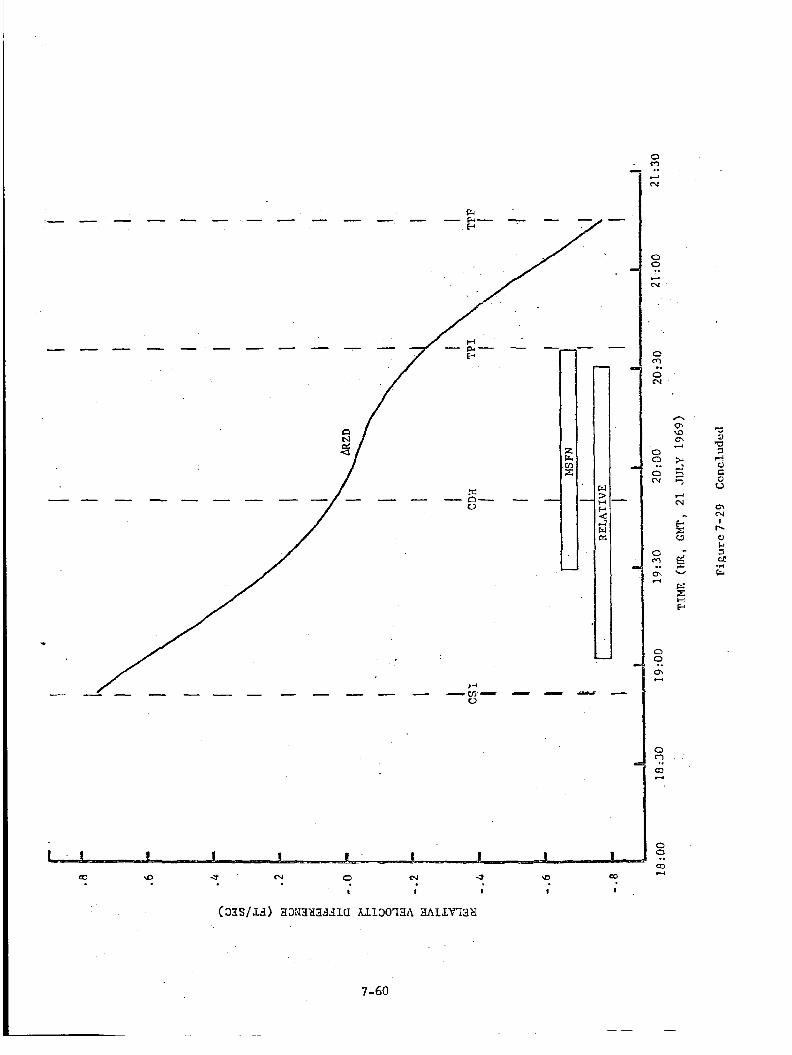
Differences Between Velocity Components of Relative Trajectories (CSI to TPF)
LEI Landing Site Coordinates
Landing Radar X-Anteima Velocity Residuals (BET #3)
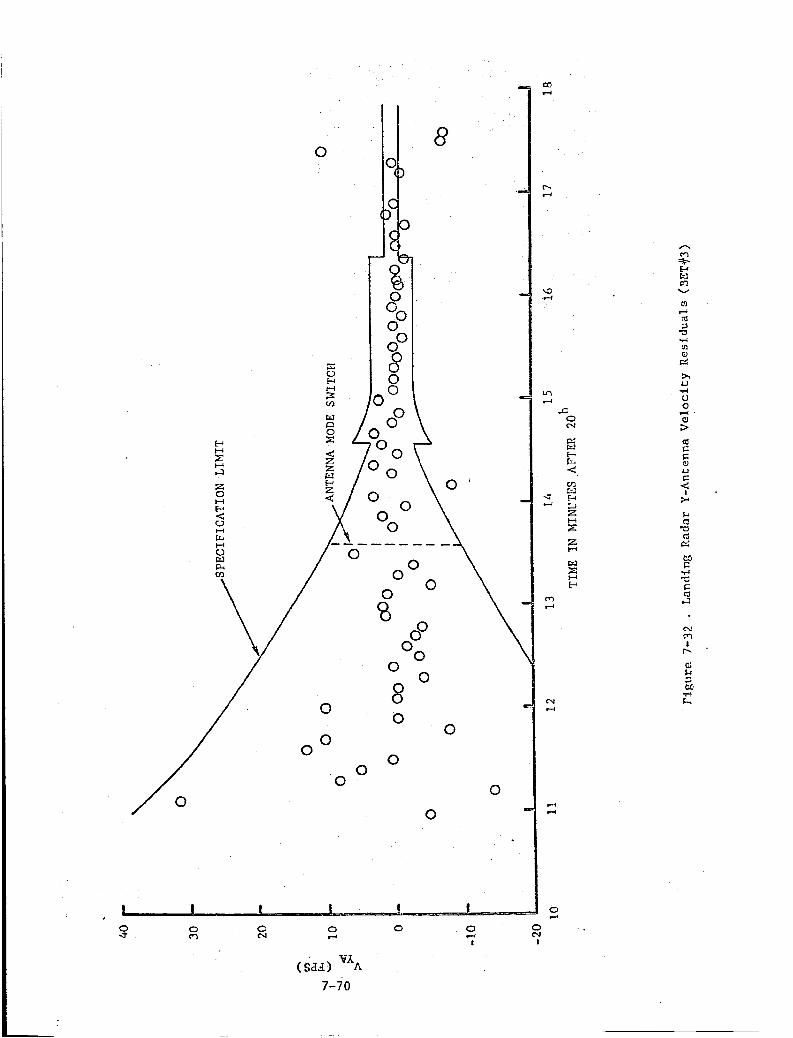
Landing Rsdar Y-Antema Veloci ty Residuals (BET #3)
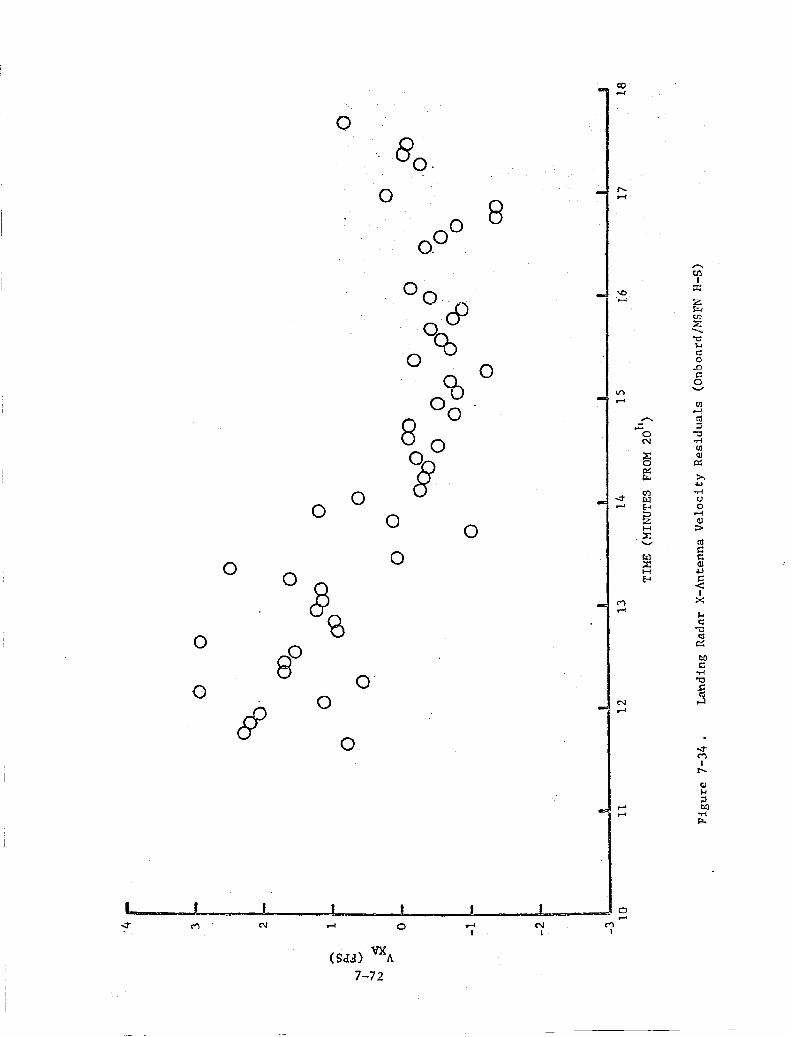
Landing Ikdar Z-Antenna Veloci ty Iiesiduals (BET %3) Landing Radar X-Antenna Veloci ty Residuals
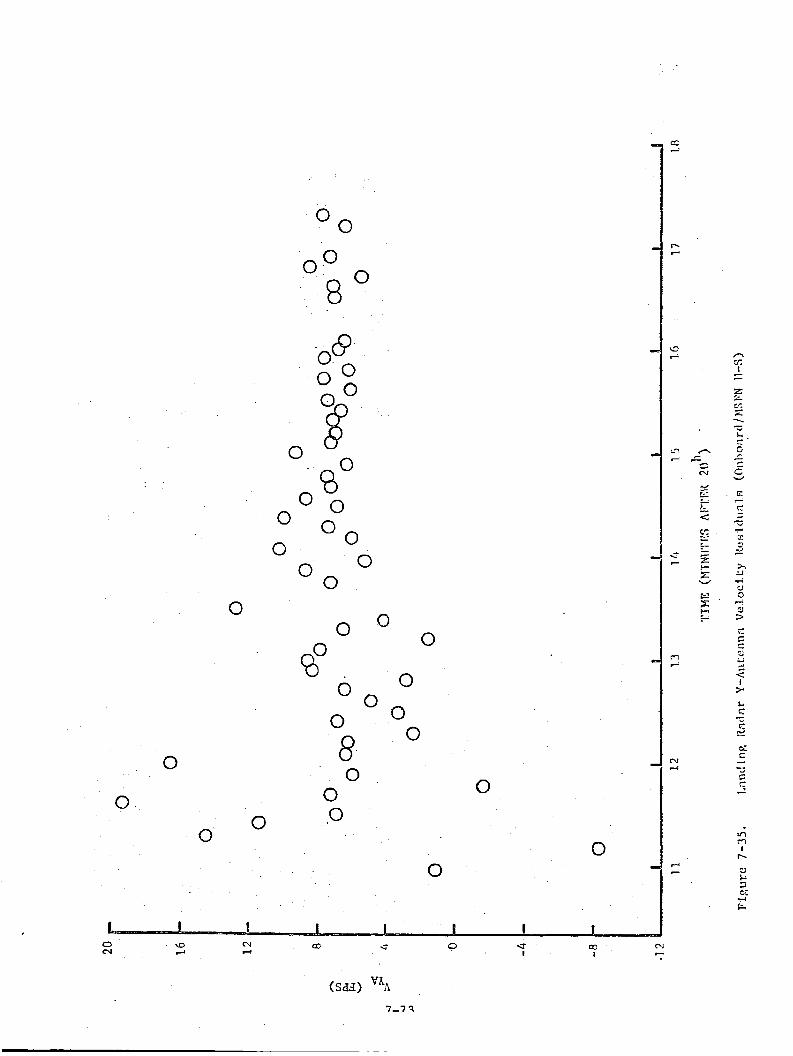
Landing R2dar Y-Antenna Veloc i ty Residuals
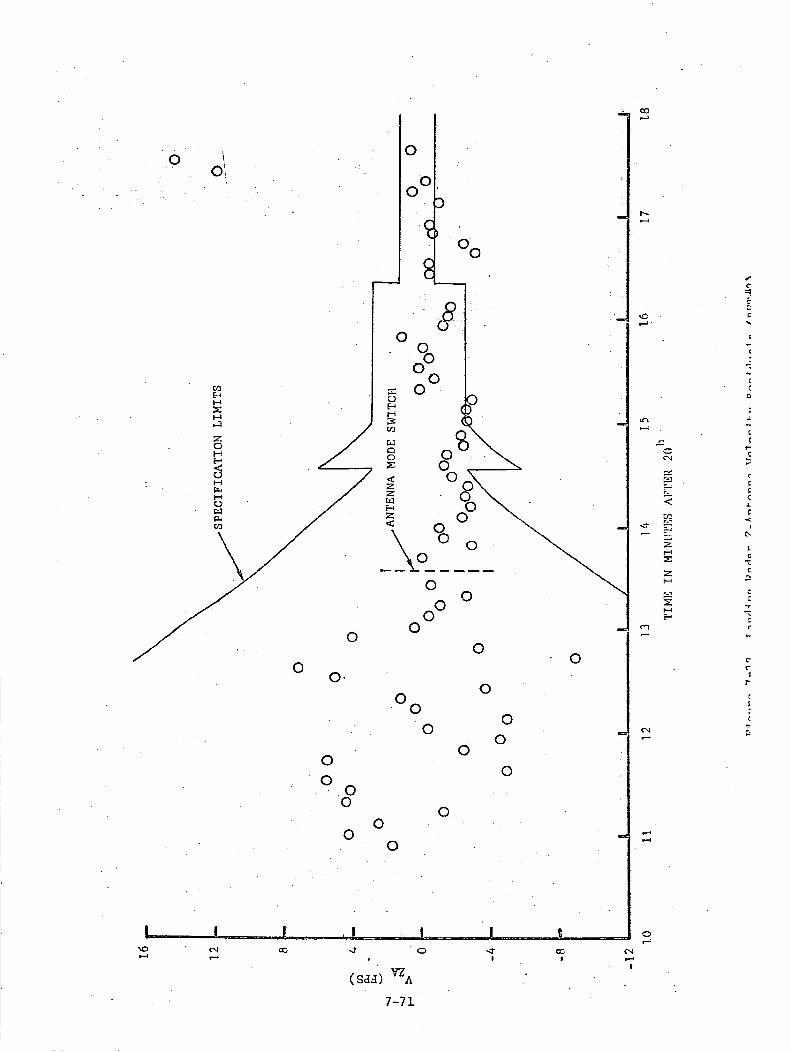
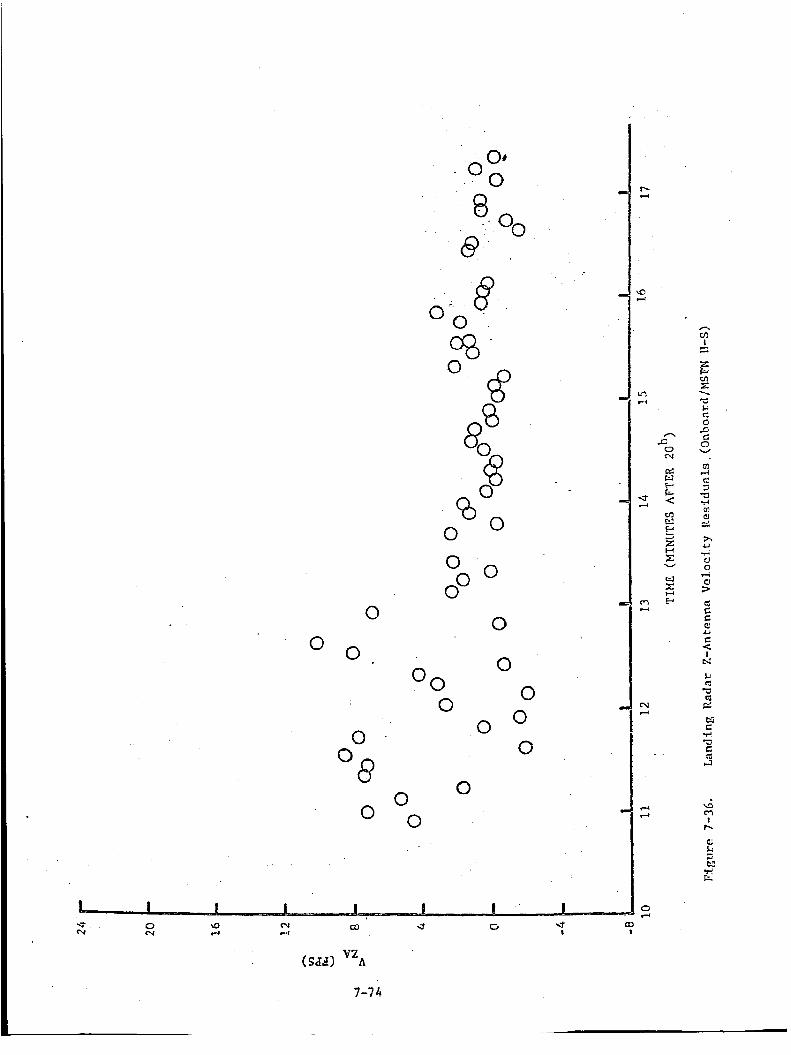
Landing Radar Z-Antenna Velocity Residuals
Surhce Alt i tucte Along Ground Track
(OnhoardlMSFN H-S)
(Onb card / M S W H-S )
(Chi% oerd /MSFT? H- S )
7-38.2 GroEndtrack of LR Range Beam Piercepoint 7-38.1
7-38.3
7-39 1
Al t i t ude of U4 During LR Range Sampling
Page
7 -49
7-51
7-52
7-53
7-54
7-55
7 - 5 8
' 7-66
7-69
7 -70
7-72
7-72
7-73
7-74
7-77
7-79
7-83 7-85
7-81
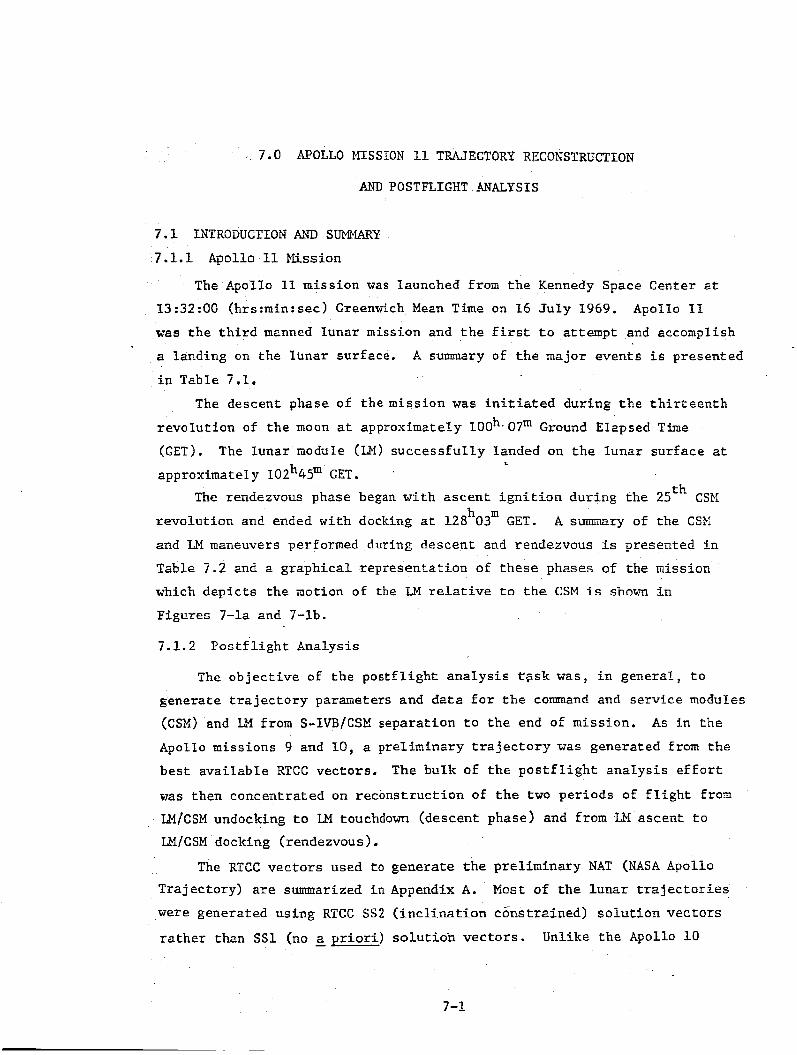
7.0 APOLLO MISSION 11 TRAJECTORY RECONSTRUCTION
AND POSTFTJGHT ANALYSIS
7 . 1 INTRODUCTION A~TD SUMZ.IARY
7 . 1 . 1 Apollo 11 H s s i o n
The P.po110 I1 mission was launched froin t h e Kennedy Space Center at
13:32:00 (hrs:min:sec) Greenwich Mean Time on 26 J u I y 1969. Apoilo I1
was t h e t h i r d manned luna r mission and t h e f i r s t t o a t tempt and accomplish
a landing on the luna r surface.
i n Table 7.1.
A summary of t h e major events i s presented
The descent phase of t h e m i s s i o n was i n i t i a t e d during t h e t h i r t e e n t h
revolu t ion of t he moon a t approximately looh- 07m Ground Elapsed Time
(GET).
approximately 102h45m GET. The lunar module (LM) success fu l ly landed on t h e luna r sur face a t
L
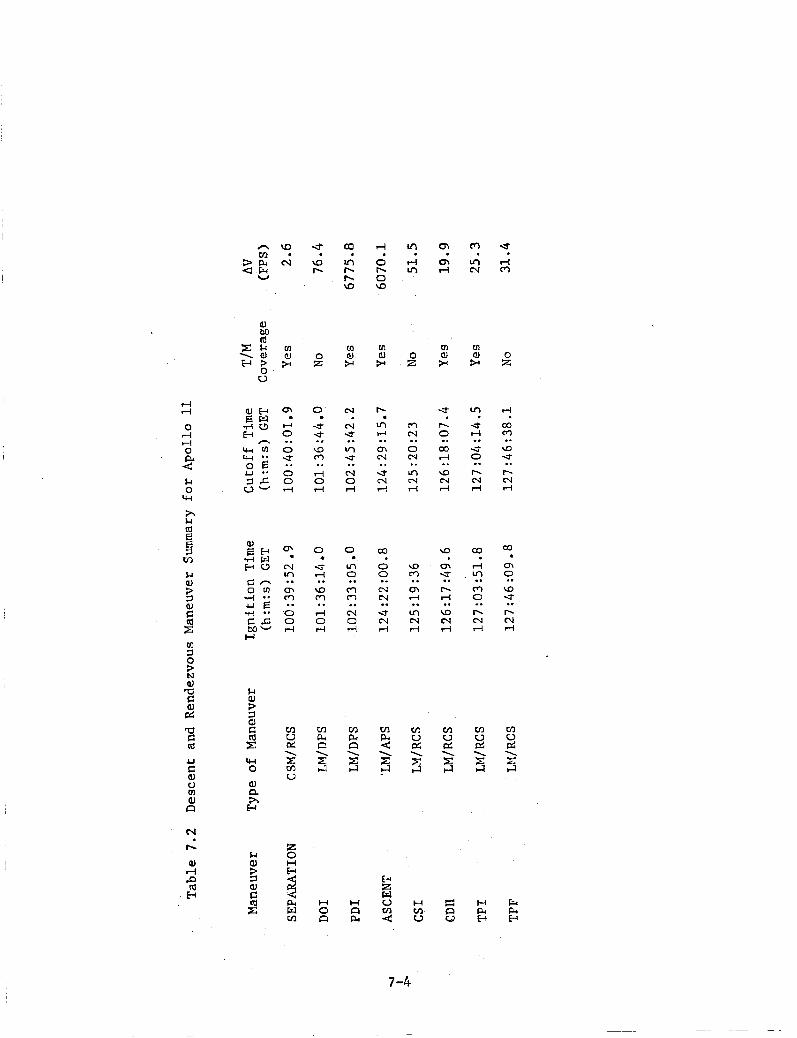
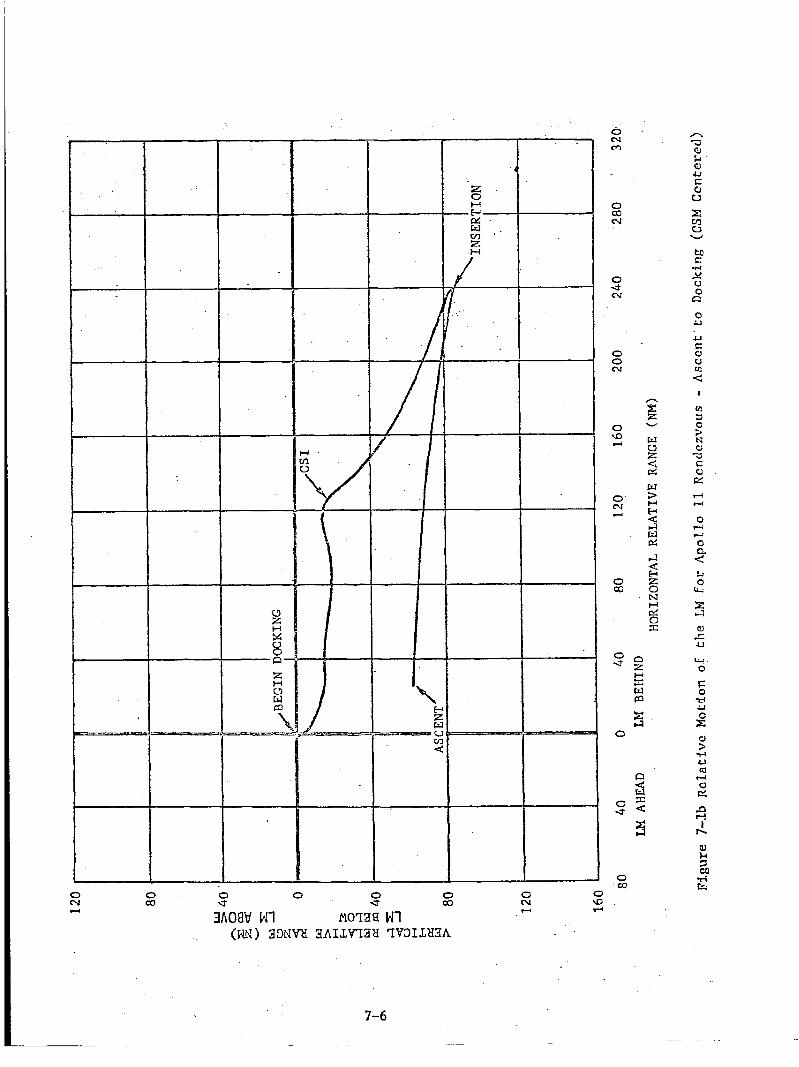
The rendezvous phase began wi th ascent i g n i t i o n during t h e 25th CSM h m revolution and ended with docking a t 128 03 GET. A sumnary of the CSEl
and LM maneuvers performed during descent and rendezvous i s presented i n
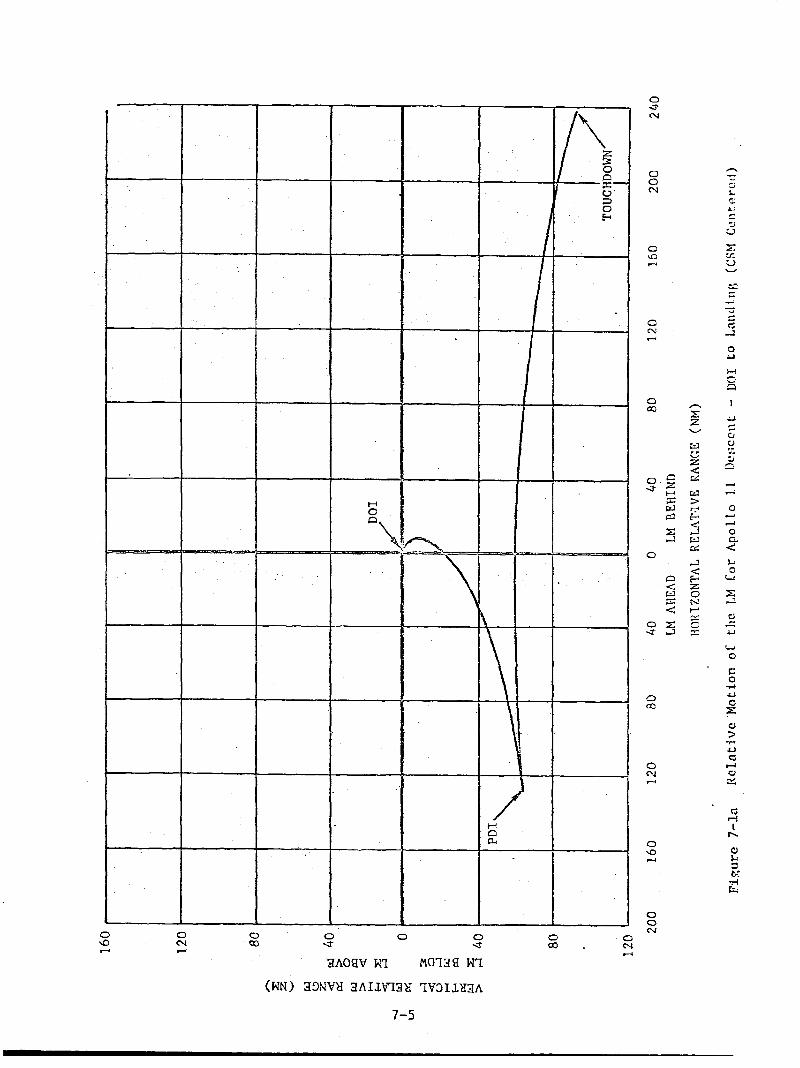
Table 7.2 and a graphical representa t ion of these phases of t h e mission
which dep ic t s t he motion of t h e LM relative t o t h e CSM i s shown i n
Figures 7-la and 7-lb.
7.1.2 P o s t f l i g h t Analysis
The ob jec t ive of the pos t f l i gh t a n a l y s i s rgck w a s , i n genera l , t o
generate t r a j e c t o r y parameters and da ta f o r the comnand and serv ice modu1es
(CSM) and U-1 from S-IVB/CSE separat ion t o t h e end of mission. As i n t h e
Apollo r r iss ions 9 and 10, a prel iminary t r a j e c t o r y was generated from t h e
bes t availabIe RTCC vectors .
was then concentrated on recons t ruc t ion of t h e two per iods of f l i g h t fro2
I;M/CSM undocking t o LM touchdown (descent phase) and from LM ascent t o
LM/CSM docking (rendezvous).
The buIk of t h e p o s t f l i g h t anaLysis e f f o r t
The KTCC vec to r s used t o genera te t h e prel iminary NAT (NASA A p o l l o
Trajectory) are summarized i n Appendix A .
were generated us ing RTCC SS2 ( i n c l i n a t i o n cons t ra ined) solution vectors r a t h e r than SSl (no - a priori) s o l u t i o h vec to r s .
Most of the lunar t r a j e c t o r i e s
Unlike t h e Apol lo 10
7 -1
SS2 vec to r s which w e r e constrained t o the pre-LOl1, rev 18, and rev 29
planes, The A p o l l o 11 SS2 vectors were constrained on a rev t o rev basis.
Each SS2 vector contained two revs of d a t a and was constrained t o the SS1 so lu t ion p lane of one of these two revs (except ions existed a t maneuvers).
This technique prevented the accumulatinn of a large e r r o r fn t h e out-of-
plane component of position. The lunar p o t e n t i a l model used i n the
generat ion of the preliminary NAT and for propagation of RTCC vectors
was the Boeing R 2 model defiaed in Appendix 5. .
Tine final NAT was produced by updating t h e prel iminary NAT to inc lude
reconstruct ions of critical maneuvers f o r which telemetered acce le ra t ion
d a t a was available an6 t o reflect t h e r e s u l t s of t he t r a j e c t o r y reconstruc-
tion efforts perforxed on the descent and rendezvous periods of the mission.
These reconstructions will be discussed i n d r t e i l i n the following sec t ions .
In general , t he postflight ana lys i s was accomplished without difficulty.
Coincldent with the trajectory reconstruction activities, analyses were
performed to determine the quality of the onboard tracking data (ulr rendezvous radar, CSN sextant, CSM V€iF ranging, and TX landing radar).
The results of t hese analyses are also included in this r epor t .
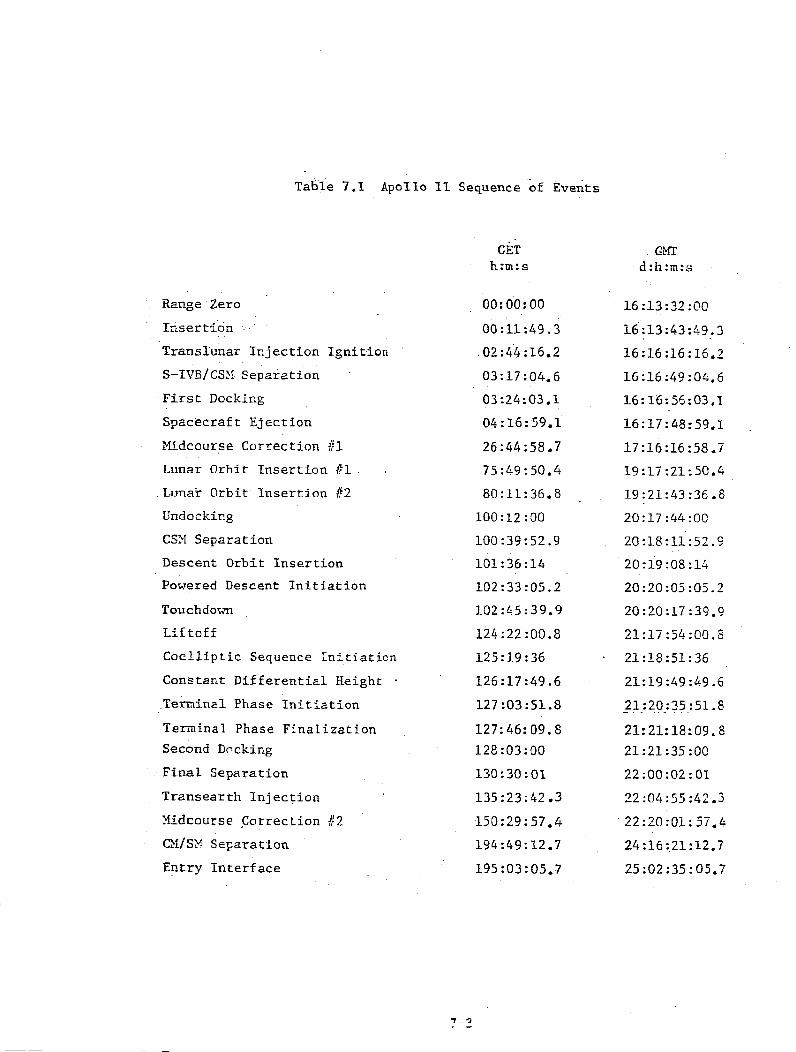
Table 7.1 ApoI10 11 Sequence of Events
Range Zero
IrLsertion
Translunar I n j e c t i o n Ignition
S- IVS / CS >I S e p 2 rat ion
First Docking
Spacecraft Ejec t ion
M2dcourse Correction 81 Lunar Orhi t I n s e r t i o n #l . Lunar O r b i t Insertion f 2
Undocking
CSX Separat ion
Descent Orbi t I n s e r t i o n
Powered Descent I n i t i a t i o n
Touch dobn
L i f t o f f
C o c l l i p t i c Sequence Initiaticn
Constant D i f f e r e n t i a l Height . Terminal Phase I n i t i a t i o n
Terminal Phase Finalization Second Decking
Final Separat ion
Trznsear th I n j e c t i o n
Yidcourse Correction 82
W S ? f Separation
Eotry I n t e r f a c e
GET E:m:s
oo:oo:oo OO:il:49.3
.02 : 44 :16,2
03 :17 :04.6
03 :24:03 . 1 04 : 16: 59.1
26:44:58.7
7 5 : 4 9 : 5 0 . 4
80:11:36.8
100:12 :oo 100 : 39 : 52.9
101 :36 :14
102 :33 :05.2
1-02 : 4 5 : 3 9.9
124 : 22 :OO. 8 125 : 19 : 36
126:17:49.6
127 :03 :51.8
127: 46: 09.8 128 :03: 00
130 : 30 : 01
135 :23 : 42.3
150:29:57.4
194:49:12.7
195:03:05,7
Gm d:h:in:s
16 :13 :32 :@O
16 :13 :43 :49.3
16 :16 :16 : 16.2
16 :16 :49 : 04.6
16: l6:56:03,1
16:17:48:59.1 .
17 :16 :16 :58 ,i 19 :17 :21: 50.4
1 9 : 2 1 : 4 3 : 3 6 . 8
2 0 : 1 7 : 4 4 : 0 0
20 :18 : 11 : 52 .9
20:19 :08 :I5
20 : 20 :05 :05.2
20 : 20 :17 : 39.4
21 : 17 :54 :@O. 5 21:18:5l: 36
21:19:49:49.6
21:20-:35 :S1.8
21: 21:ia:og. 8 21 :21:35 : 00
22:00:@2:07
22:@&:55 : 4 2 . 3
22:20:01: 57.4
24 : 16 : 21 : 12.7
25:02:35:05.7
rl rl
0 d 4 0
2 k 0 w h k (d E 5 cn F-l aJ
W el
rn a w
o\
A 0
0 e 0 0 4
..
..
0
N .
‘R cn F)
‘0 0 4,
..
cn U
\
5 U
2 0 H
2 PI
w cn
m rl m
0 z
m hl
0 N
In N rl
..
..
a ?? r;! a
ul N rl
v: U d \
3
H rn V
e rl m
0 z
fl m rr)
W .. .. I- N rl
co cn . 0 \o .. rn N d
rn W d : 3
E PI E-,
0 0 0 0 0 0 0 N m U U 43 N
v 4 3!\08W Nl HOT38 Nl 4
(W) 33NW 3AILVT3Y ?V3ILtIXh
7-6

7.2 ORBIT ANALYSIS
7.2.1 Methods of Reconstruction
The HOPE Program was used as t h e b a s i c o r b i t deterinination too l .
The program u t i l i z e s a weighted least squares d i f f e r e n t i a l co r rec t ion
technique t o r eg res s on a l a rge set of p a r m e t e r s .
handling two vehic les , and can use both ground based and onboard t rack-
i n g data .
burn option which models t h e Apollo i n e r t i a l measurement u n i t and uses
telemetered acce le ra t ion da ta t o r econs t ruc t maneuvers.
It is capable of
An a d d i t i o n a l capabi l i ty is the IGS ( Iner t ia l Guidance System)
The o r b i t determinat ion was accomplished using f o u r b a s i c f i t tech-
niques.
a)
These techniques are described as fol lows:
MSFN free f l i g h t - regression on t h e state vec to r over f r e e f l i g h t i n t e r v a l s as defined by spacecraft maneuvers using MSFN data.
b) MSE” I G S - regress ion on the state vec to r using, a t maximum, one revolu t ion of MSFN d a t a and incorpora t ing the spacecrafc maneuvers which had t e l e n e t r - coverage by means of t h e HOPE IGS burn model.
Onboard f r e e f l i g h t - r eg res s ion on the state victor over free f l i g h t i n t e r v a l s using a v z i l a b l e onboard t racking d a t a to . cor rec t the LN t r a j e c t o r y wi th r e spec t t o a fixed CSM t r a j e c t o r y (MSFN f i t s ) .
c)
d) Onboard IGS - regression on t h e state v e c t o r using avail- a b l e onboard d a t a t o c o r r e c t the LM tra’jectory wi th r e spec t t o 2 f ixed CSM t r a j ec to ry and incorpora t ion of t h e Di maneu-Jer Ghich had te lemetry coverage)by means of t h e HOPE IGS burn model.
More accura te t r a j e c t o r i e s a re usua l ly produced wi th techniques (b) and
(d) s i n c e they t a k e advantage of longer t racking d a t a arcs.
i s important i n descent and rendezvous t r a j e c t o r y recons t ruc t ion s i n c e
the t racking i n t e r v a l s between sone maneuvers are too s h o r t t o produce
a r ep resen ta t ive t r a j e c t o r y over t he whole segment.
This f a c t o r
1
As a result of the analysis of var ious l u n a r p o t e n t i a l models con-
I t a ined i n Reference 7, and on t h e b a s i s of improved observa t ion r e s idua l s
and propagation cha rac t e r i s t i c s , the L1 model (Langley Node1 1) w a s used
7-7

i n the orbit analysis .
mented by a C33 term.
c h a r a c t e r i s t i c s of t h e L1 over t h e R2 model.
Appendix 3.
This model i s b a s i c a l l y the Boeing R2 model aug-
Table 7.3 shows improvements i n propagation
Both models are def ined i n
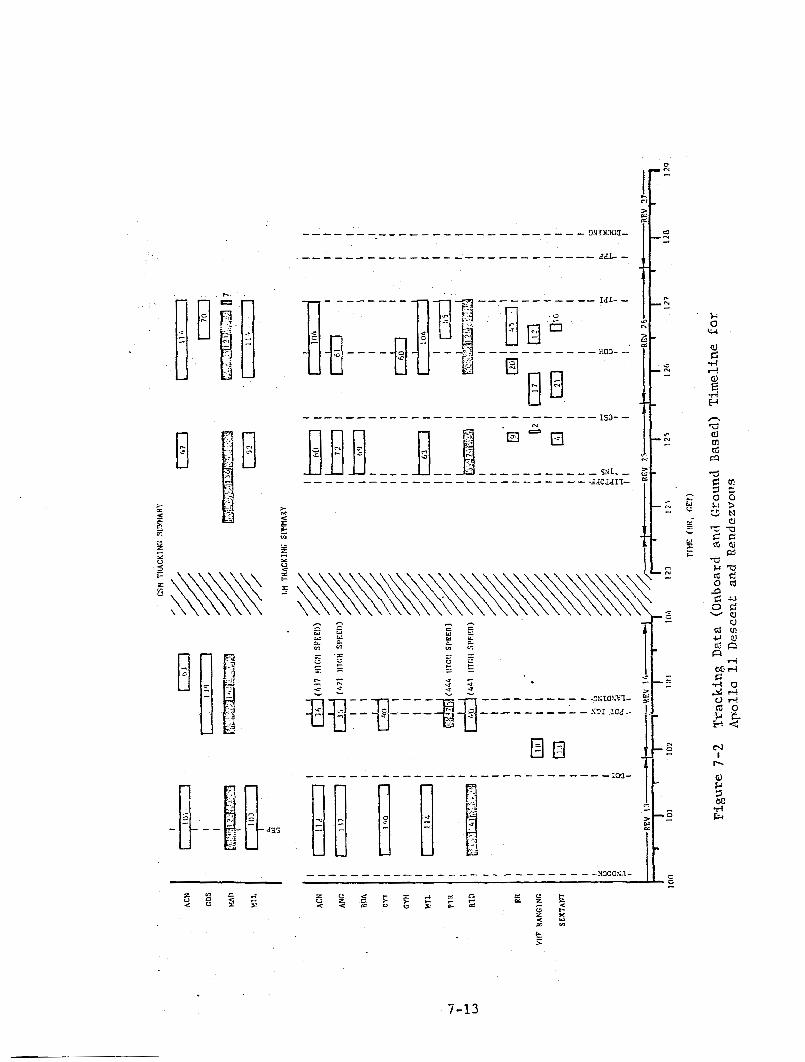
The t r a j e c t o r i e s for both Apollo II veh ic l e s during descent and rendezvous were recons t ruc ted using the methods summarized above. The
d a t a used i n these r econs t ruc t ion actlvities pr imar i ly included low
speed MSFN, high speed MSFN, rendezvous radar , VHF ranging, and sex tan t
data. Telemetered a c c e l e r a t i o n data were used t o reconstruct maneuvers
where ava i l ab le and app l i cab le .
during t h e descent and rendezvous per iods.
ing da ta arcs (which w e r e a v a i l a b l e over t h e per iods of i n t e r e s t ) as a
func t ion of ground e lapsed t i m e .
the t ransmit t ing (two-way) MSFN s t a t i o n and t h e numbers represent t h e
number of observations upon which final f i t s w e r e based.
s t a t i o n s operated i n t h e dua l mode (simultaneous t racking of both t h e CSM
and the LM).
Table 7.2 lists the maneuvers perforired
Figure 7-2 shows the t rack-
I n Figure 7-2, the s o l i d ba r s represent
Note t h a t some
The following paragraphs descr ibe t h e t r a j e c t o r i e s which w e r e used
as t h e f i n a l BET for both vehic les .
7.2.2 CSM Best Estimate of Trajectory
The t r a j e c t o r i e s for t h e CSM lunar revolu t ions 13, 14, 25 and 26
w e r e reconstructed fron low speed MSFN t r ack ing da ta compacted t o a ra te
of two samples p e r minute o r , i n the case of s t a t i o n s opera t ing i n the
dua l mode, one sample every 36 ‘seconds. The d a t a used are summarized
i n Figure 7-2. The quan t i ty of d a t a obtained for revolu t ions 13 and 26
w a s good. Because of t h e p a r t i a l d a t a arcs from some s t a t i o n s on revo-
lutions 14 and 25, t h e d a t a quantity i n these revs could only b e r a t e d
as fair.
enhanced t h e geometry of t h e active t racking network conf igura t ion a d
cont r ibu ted to t he q u a l i t y of a l l t h e f i t s .
Inclusion of data f r o n a southern henisphere station (Ascension)
Two reconstruct ion techniques w e r e used t o obta in t h e CSM BET’S. The
MSFN IGS f i t technique was used on revolution 13 because of t he presence
of telemetered a c c e l e r a t i o n d a t a from the CSM sepa ra t ion burn performed
7-8
i n t h e MSFN d a t a arc.
25 and 26) were obtained from MSW f r e e f l i g h t fits.
BET's f o r the remaining o r b i t s o f ' i n t e r e s t (14,
. In general, t he CSN BET'S were of good q u a l i t y . This is i l l u s t r a t e d
to some extent by t h e good pos i t ion and v e l o c i t y comparisons between
r evo lu t ions (Table 7.4) and by the r e s i d u a l statistics l i s t e d f o r each
f i t i n Appendix B. These s ta t is t ics (s tandard dev ia t ion of .1 to .25
cycles per second) compare very trelL with Apollo 8 (standard devia t ions
betk7een - 3 and .6 cycles per second) and Apol lo 10 (standard devia t ions
between .2 and .4 cycles p e r second). A por t ion of t h i s inprovenent nay
be a t t r i b u t e d t o t h e b e t t e r f i t produced by t h e L1 lunar p o t e n t i a l model.
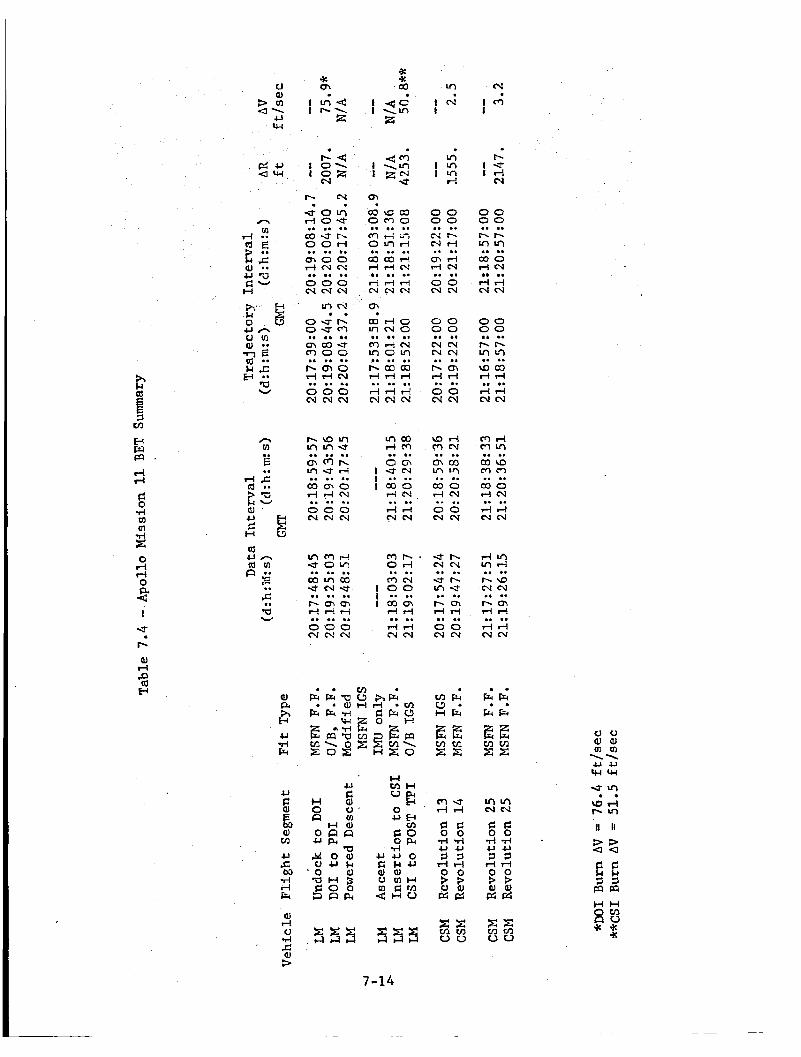
Table 7.4 contains a s m a r y o f t h e f i n a l BET's giving f i t type
(technique), d a t a interval, NAT t r a j e c t o r y i n t e r v a l , and p o s i t i o n and
v e l o c i t y d i f f e rences a t matchpoints between segments.
7.2.3 Df Best E s t i m a t e of Trajectory
A major por t ion of the p o s t f l i g h t ana lys i s e f f o r t . w a s d i r e c t e d towards
recons t rucz ion of t he trajectories from undocking t o laDding and f rom
l i f t o f f through rendezvous. A. discuss ion of t h e o r i g i n and q u a l i t y of t h e
f i n a l t ra j ec t o r i e s i s included in the following paragraphs.
7.2.3.1 Descent Phase Tra jec tor ies
The descent phase was reconstructed i n t h r e e segments; undocking to
DOI, D O 1 to PDI, and PDI t o Touchdorm. The BET f o r undocking t o D O 1 was
obta ined froin a MSFN f ree f l i g h t f i t based cpon t h e e n t i r e d a t a arc from
revo lu t ion 13.
CSPf s i n c e f i v e s t a t i o n s were t racking t h e LM.
( s m a r i z e d i n Appendix B) compare well wi th the MSFN resfdual ststistics
obta ined from t h e CSM f i t s . Note from Figure 7-2, which shows t h e t rack-
i n g history, t h a t t h e t racking s t a t i o n geometry w a s good.
The quan t i ty of data vas considerably b e t t e r than for t h e
Residual s tz t is t ics
The BET for the per iod fromDOI to PDI was obtained from an onboard
free f l i g h t f i t based on CSM sex tan t and VHF ranging d a t a taken p r i o r to
FDI. VHF ranging observat ions and 13 sex tan t s igh t ings . Data q u a l l t y i s
discussed more thoroughly i n Sect ion 7 . 3 used as t he r e fe rence t r a j e c t o r y was t h e revolu t ion 1 4 BET d iscussed i n
paragraph 7.2.2.
As can b e seen i n Figure 7-2 the d a t a quan t i ty was good, wi th 18
The CSEI trajectory which was
7-9
The BET for the powered descent segment of t h e f l i g h t was o r i g i n a l l y
based on a f i t obtained from low speed ElSFN d a t a taken from revo lu t ion 1 4 a c q u i s i t i o n of s i g n a l t o touchdown.
fit was modified to fo rce t h e landing p a i n t t o coincide with t h e
cu r ren t best estimate of landing s i t e location.
obtained from this descent t r a j e c t o r y (BET 413) were .6358' la t i tude , 23.4938' longitude, 2nd -8557 f e e t a l t i t u d e (referenced t o t h e mean
lunar rad ius) .
Reference 10 as the b e s t estimate ( l a t i t u d e .647 and longi tude
23. 505c, determined from p o s t f l i g h t photo reduct ion) .
The t r a j e c t o r y obtained from this
Landing s i t e parameters
These f i g u r e s compare well with t h e va lue pu3l ished i n 0
Since the BET #3 was constrained t o impact 2 des i r ed landing site, A sub- t h e q u a l i t y of the t r a j e c t o r y a t PDI is not t h e besf ava i l ab le .
sequent reconstruct ion using a combination of onboard p lus h igh speed
MSFN d a t a i s discussed i n Sec t ion 7.4 of t h i s r epor t .
of h igh speed d a t a from acqu i s i t i on of signal t o l a d i n g and relative
t racking d a t a obtained p r i o r t o PDI produces a cons i s t en t and continuous
representa t ion of t h e LM traj ecto-ry from DO1 t o touchdo;m.
7 . 2 . 3 . 2 Rendezvous T r a j e c t o r i e s
This combination
The BET f o r TN ascent was i n i t i a l i z e d wi th landing site coord ina tes
of .6357' l a t i t u d e , 23.4701' longi tude, and a he ight of -8607 f.eet
above t h e mean luna r radius.
agated t o in se r t ion using accelerometer d e t a t o model t h e ascent
burn.
These initial conditiocs were then prop-
The D I B E T f o r t he per iod from i n s e r t i o n t o TPF was recons t ruc ted
in two segments; i n s e r t i o n t o CSI and CSI t o TPF.
i n s k i o n t o CSI segment was obtained from a MSFN f r e e f l i g h t f i t .
d a t a arc and trajectory- i n t e r v a l are descr ibed i n Table 7.4. The NSFN
data was good both q u a n t i t a t i v e l y and qua l i t a tFve ly as can be se, an i n
Figure 7-2. The r e s idua l statist ics, suminarizcd i n Appendix B, show t h a t
the s tandard deviat ions of t h e doppler r e s i d u a l s are l a r g e r I n th i s segnent
than i n segments which have a less severe o r b i t a l geometry.
acteristic also ex i s t ed i n t h e Apoilo 10 p o s t f l i g h t r e s u l t s .
The t r a j e c t o r y f o r the
The
This char-
7-10
The second rendezvous segment covered the per iod from CSI t o TPF.
The BET choser? m.s obtained from an onboard da ta , IGS f i t . The d a t a used
i n the fit included LM rendezvous rad2r , CSM sextant, and CSM VHF ranging
observations. In addi t ion, telemetered acceleration d a t a was used i n the
I G S burn option of HOPE t o recons t ruc t the CDH and TPI burns. The d a t a
arcs are shown i n Figure 7-2, and t h e r e s i d u a l statistics are s m a r i z e d
i n Appendix B. Data q u a l i t y was good, and t h e r e s u l t i n g BET produced an
accurate relative trzjectory . €or t h e relative observat ions was t h e r evo lu t ion 26 t r a j e c t o r y described i n paragraph 7.2.2. (The qua l i t y of t h e d a t a and t h e r econs t ruc t ion
are discussed i n more d e t a i l i n Sec t ion 7.3 of this r epor t . )
The C94 t r a j e c t o r y chosen 8 s t he re ference
7-11
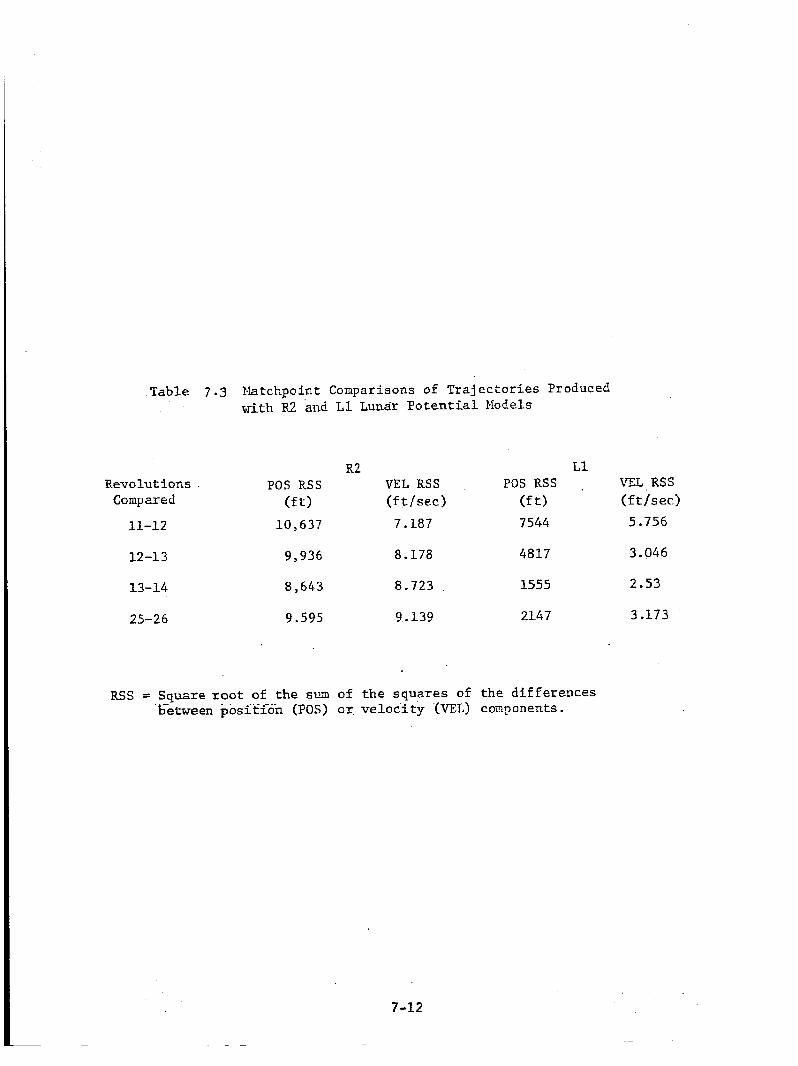
Table 7 . 3 Matchpoint Comparisons of Trajectories Produced with R2 and L1 Lunar Potential Nodels
R2 Ll POS Rss . VEL RSS Revolutions . POS RSS VEL RSS
Compared (ft) (ft/sec) u t > (f t / s ec)
11-12 1 0 , 6 3 7 7.187 7544 5.756
12-13 9,936 8.178 4817 3.046
13-14 8 , 6 4 3 8.723 1555 2.53
25-26 9.595 9.139 2147 3.173
RSS = Square root of the sum of the squares of t h e differences between positi-on (POS) or, velocity (VEL) components.
7-12
L I-
f
7-13
e w m .
0 rf rt 0
2 i
I-
n cn 2 ..
15 2z
m +In a m n
:E .. 5 a W
9) a h H +I d k
c Q\
b\ 4 4 2
L 4 z2
G O 4
N
b - 4
do* x .u- h 004 m o o r l N N
......
......
...... 000 C V N N
In- . . 0-r- o e m m c o u m o o ...... ...... r - m o r l 4 N ...... 000 W W N
...... c n m h m u 4 E o m o ddhl
000 “ 0 4
......
......
m m 4 uov l ...... O o m a u w - 3 h a m r ldd
......
...... 000 N h’ r\l
Q,
caw03 o m 0 ...... m ri L-, o m r l c o c o d ddc4
d d d N N N
......
...... 0‘. (x3FIo m N O ...... OldN m o u ) b Q 3 E D d d d
4 4 4 n1NC.l
......
......
mco 4 m o m
I - f N
.... I .... I Q)o dhl .... r ld CIN
.... I O 0 I .... I a m ?Id l-ld N c u
....
H 0 FI 0 U
2 . O a c P
H FI PI 0 U
H 0 FI
LI
N
1 - l I
0 0 0 0
c.i F- N r l
m r l d N
0 0 N N
....
....
....
0 0 00
N N N N
b c n d d 0 0 mC\1
....
....
....
a 4 m w
m m c o o r ( w 00 N N
.... m m .... ....
ut.. N e 4
ut..
b c h dPi
00 C V N
....
....
....
y? E E 2E
H F r
P7-T r ld
gdo
% Z
E %
dtl UJJ 3 3 r ld 0 0
& W
u u
00 00 .... h ic- m m a 3 0 FIN
d 4 C V N
....
.I .. 00 00 .... l-r- m v l U l D Q 4 d
rld C\IN
....
....
m r l Flln .... COLD o m .... c o o FIN
d 4 c.lN
....
r l m m r l .... h a N h l .... r - m d d
rld N c v ....
. . F ? $ k
H H
*3( 8 e
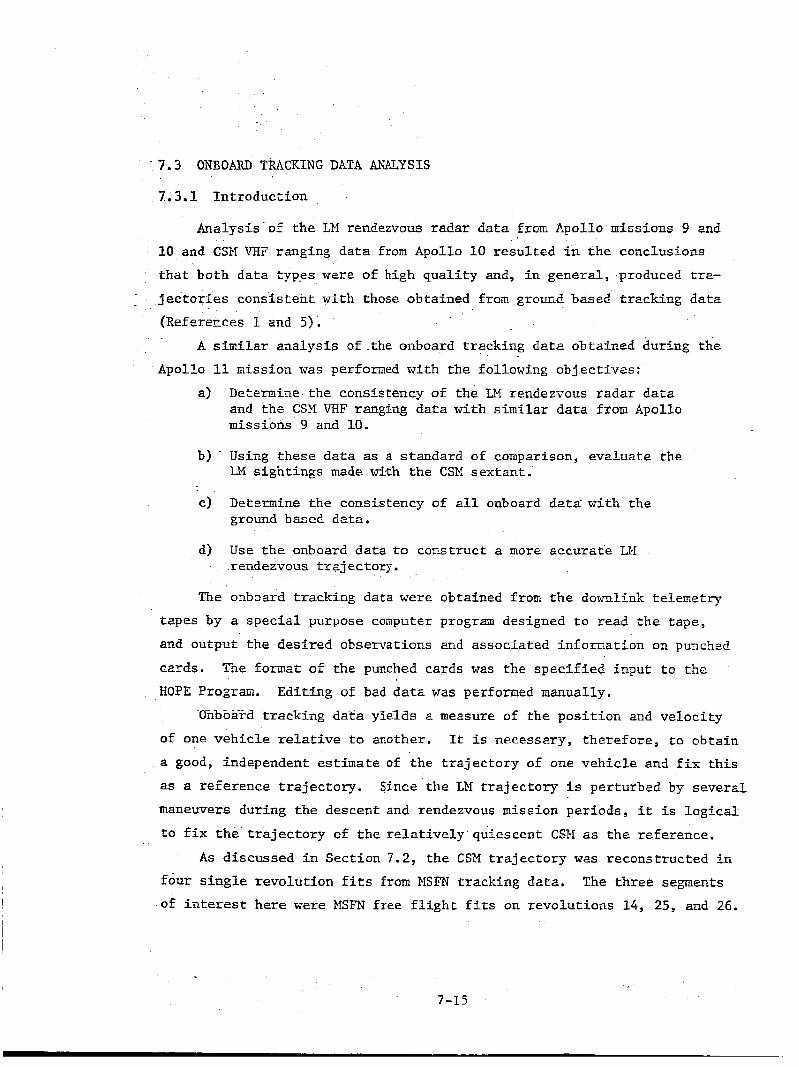
. 7.3 ONBOARD TRACKIRG DATA ANALYSIS
7.3.1 h t r o d u c t i o n
Aqalysis'of t h e Lll rendezvous r ada r d a t a from Apol lo missions 9 2nd
10 and CSM IXF ranging d a t a f r o m Apollo 10 r e s u l t e d i n t h e conclusions
t h a t both da t a types w2re of high q u a l i t y and, i n genera l , produced tra-
j e c t o r i e s cons i s t en t wi th those obtained from ground based t racking da ta
(References I and 5 ) . A s i m i l a r a n a l y s i s o f . t h e onboard t racking d a t a obtained dur iag t h e
Apollo 11 mission was perfonzed with t h e following objec t ives :
a) Deternine the consistency of the LM rendezvous r ada r d a t a and t h e CSM VHF ranging d a t a with similar data from Apollo missions 9 and 10.
b). Using t h e s e d a t a as a s tandard of comparison, eva lua te the LM s igh t ings made with the CSM sex tan t .
c) Determine t h e consistency of all onboard da ta .wi th the ground based da ta .
d) Use t h e onboard da ta t o cons t ruc t a more accura t e LT.I rendezvous t ra j e ctory .
The onboard t rack ing data w e r e obtained from t h e dotrnlink te lemetry
tapes by a special purpose computer program designed t o read t h e tape ,
and output t h e des i r ed observations 2nd assoc ia ted information on punched
cards.
HOPE Program.
The format of the punched cards was t he s p e c i f i e d input t o the
Edicirig of bad data was perfom-ed manually.
Enboard t racking d a t a yTelas a measure of t h e p o s i t i o n and v e l o c i t y
of one v e h i c l e relative to another. It is necessary, t he re fo re , t o ob ta in
a good, independent estimate of t he t r a j e c t o r y of one v e h i c l e and fix- t h i s
as a rer'erence t r a j e c t o r y .
manewers during t h e descent and rendezvous mission per iods , it: is l o g i c d
to f i x the' t r a j e c t o r y of t h e r e l a t i v e l y quiescent CSI4 as t h e reference.
Since t h e Ltf t r a j e c t o r y i s per turbed by several
A s discussed i n Sec t ion 7.2, t h e CSM t r a j e c t o r y was recons t ruc ted i n
four s i n g l e revolu t ion f i t s from MSFN t rack ing da ta .
of i n t e r e s t here w e r e MSFN free f l i g h t f i t s on r evo lu t ions 14, 25, and 26.
The t h r e e seginents
7-15
Trajectories for t h e 1;M free f l i g h t segments were a l s o recons t ruc ted from
MSFX tracking data . The ground based ZIfSFN t r ack ing a v a i l a b l e f o r use dur-
ing t h e periods of i n t e r e s t are s m a r i z e d i n t imel ine form i n Figure 7-2.
The CSM t r a j e c t o r y was fixed aS t h e re ference , and t h e LM MSFN f r e e
f l i g h t t r a j e c t o r i e s were then used to i n i t i a l i z e fits based on anboard
da ta i n the four segments where relative d a t a w e r e a v a i l a b l e .
confidence va lues of 10,000 feet w e r e placed on each component of p o s i t i o n
and 10 f e e t pe r second on each component of v e l o c i t y i n t h e i n i t i a l
conditions.
A p r i o r i
The reconstruct ion activities w i l l b e discussed i n more d e t a i l i n
the following sec t ions .
included which serve t o descr ibe t h e opera t ions performed and show t h e
accuracy and v a l i d i t y of the data .
In addi t ion , va r ious t a b l e s and f igu res are
7 . 3 . 2 Onboard Measurements
Rendezvous radar da t a were obtained during t h r e e per iods of t h e
Apol lo I l m i s s i o n ; t hese were I n s e r t i o n t o CSI (9 observa t ions) , C S I t o
CDZ (20 observations), and CDB t o TPI (45 observa t ions) . As i n previous
missions, t h e amount of rendezvous r a d a r d a t a obtained vas l imi ted t o
those per iods when t e l e n e t r y coverage w a s ava i l ab le .
VRF ranging data were cbtained from the CSM during fou r segments of
t he f l i g h t ; t h e s e w e r e DO1 to PDI (18 obsemat ions ) , i n s e r t i o n t o CSI
(2 observations), CSI t o CDH (17 observa t ions) , and CDH t o TPI (12 observa-
tions).
io meaningful statistics could b e obtained.
Since only two observat ions w e r e obtained from I n s e r t i o n t o CSI ,
Sextant d a t a w e r e obtained during the same per iods of f l i g h t as were
VEF-ranging data; 13 observat ions between DO1 and PDI, 4 observat ions from
i n s e r t i o n to CSI , 21 observat ions f rom C S I t o CDH, and 10 observat ions
between CDH and TPI. Lis t ings of a l l t h e d a t a are included i n Appendix D.
7 . 3 . 3 Rendezvous Radar Data
Evaluation of Onboard Tracking Data
In order t o determine t h e q u a l i t y of t h e rendezvous r ada r da t a , t h e
residuals (d i f fe rences between t h e a c t u a l measured va lue and a measurement
7-16
vzlue computed from given CSM and T..M t r a j e c t o r i e s ) w e r e exanked.
CSH t r e j e c t o r i e s used i n obtaining these r e s i d u a l s were t h e BET'S discussed
i n Sect ion 7.2 of t h i s r e p o r t (one rev MSFN free f l i g h t f i ts) .
t r a j e c t o r i e s w e r e obtained by using technique (c) descr ibed i n paragraph
7.2.1 (onboard f r e e f l i g h t f i t s ) .
The
The Dl
A l l available onboard d a t a were used
in t hese f i t s .
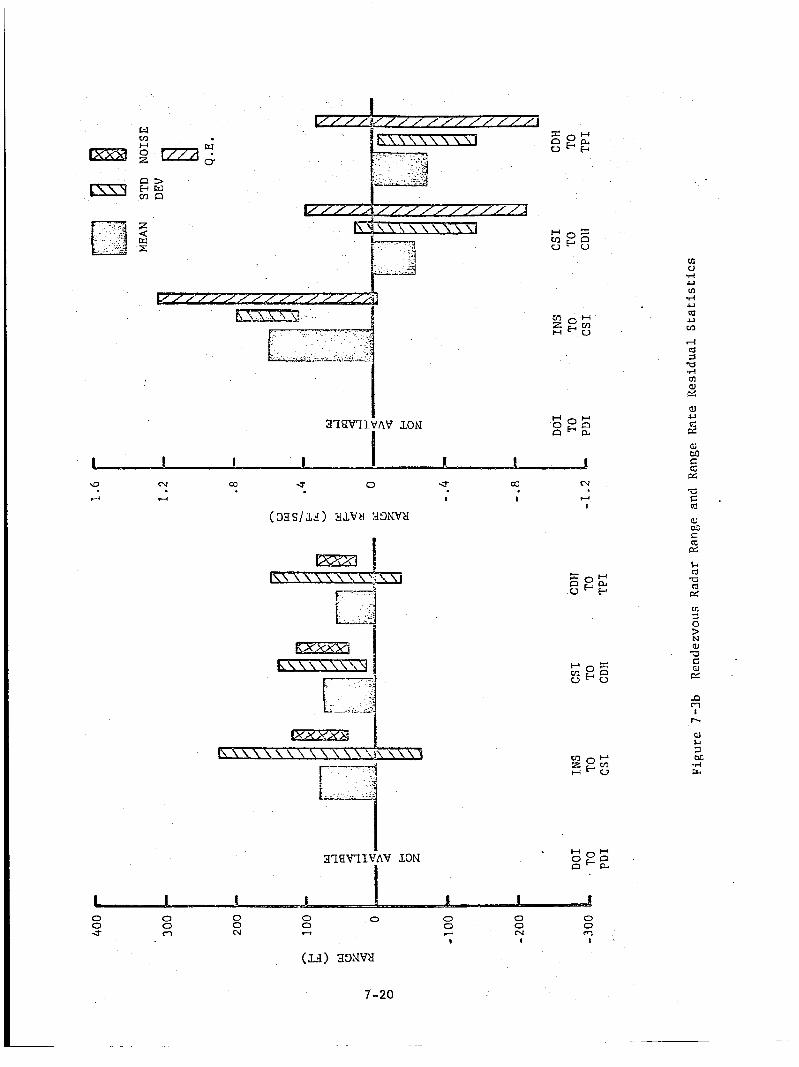
Table 7.5 lists r e s i d u a l statistics (mean, s tandard deviat ion, one-
sigma noise estimate) computed from t h e onboard free f l i g h t fits .of each
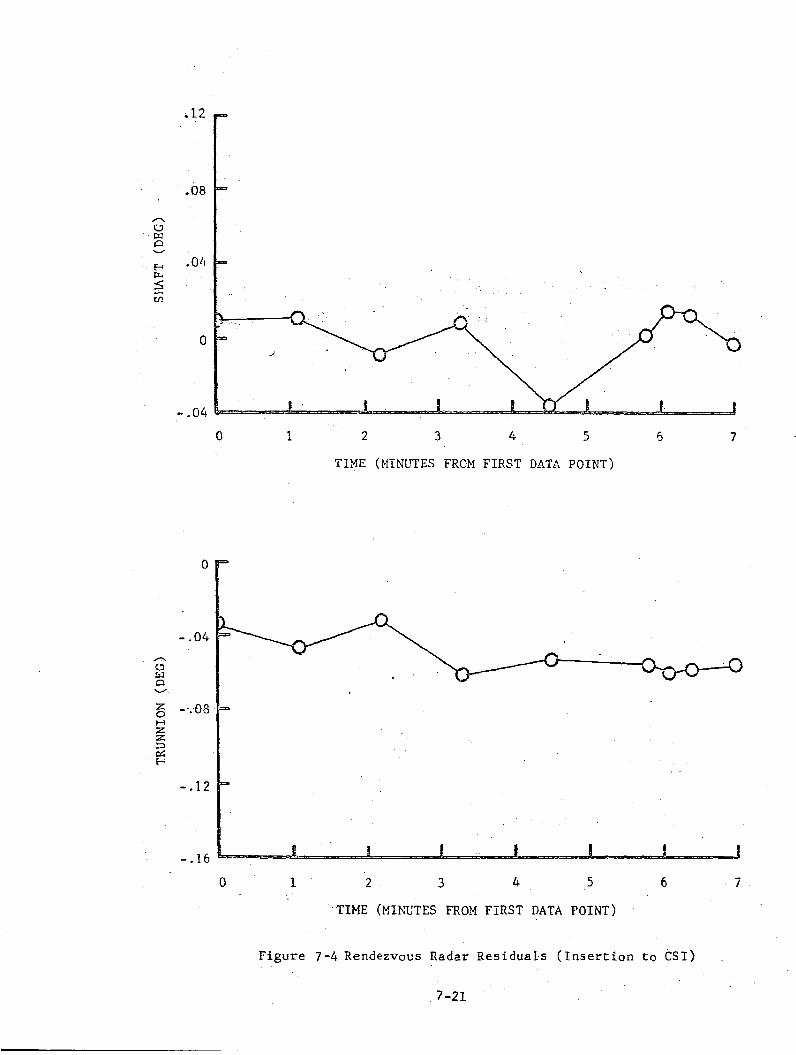
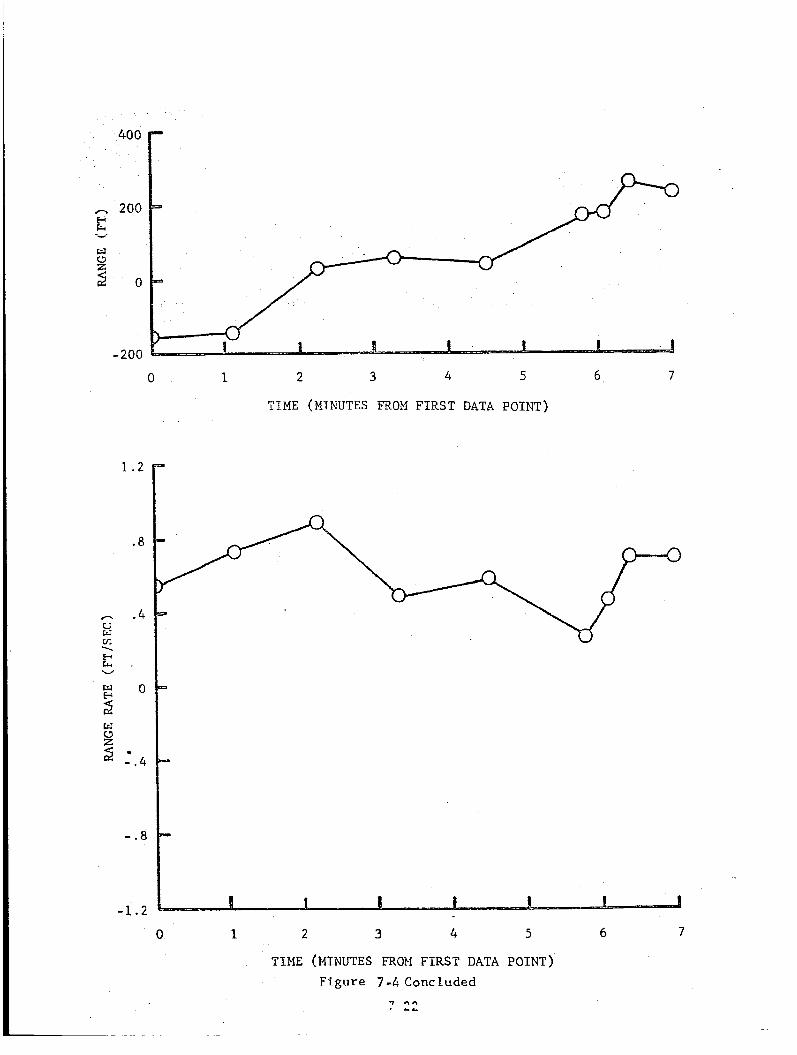
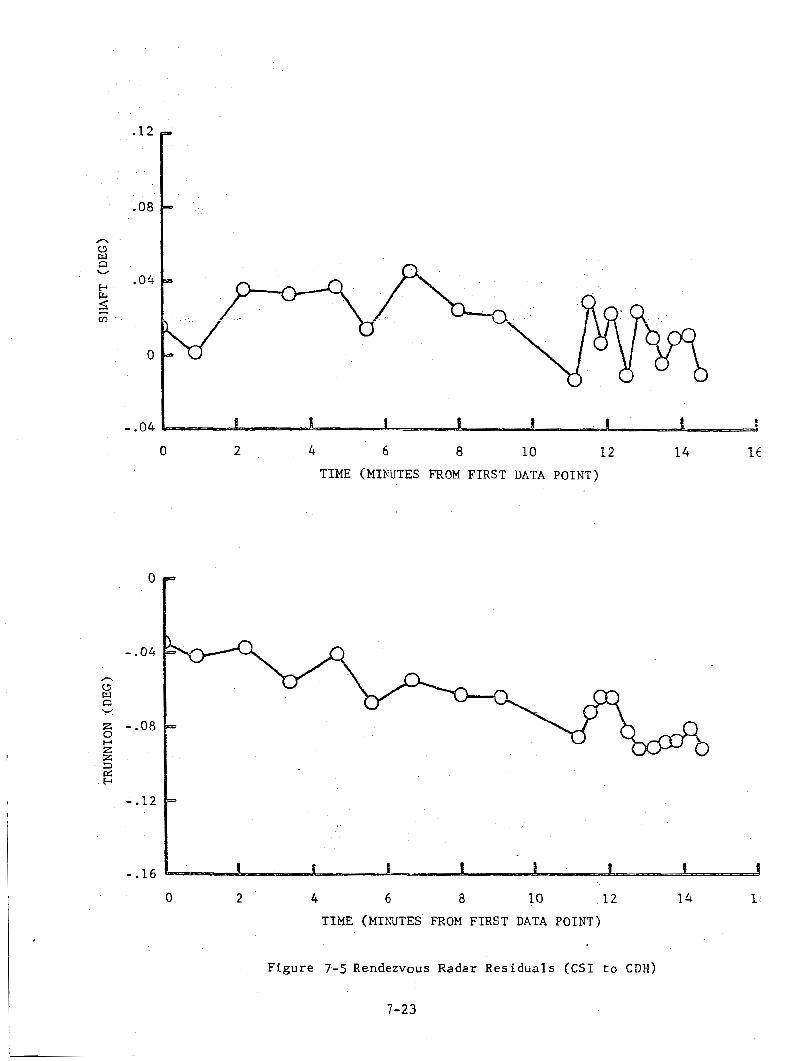
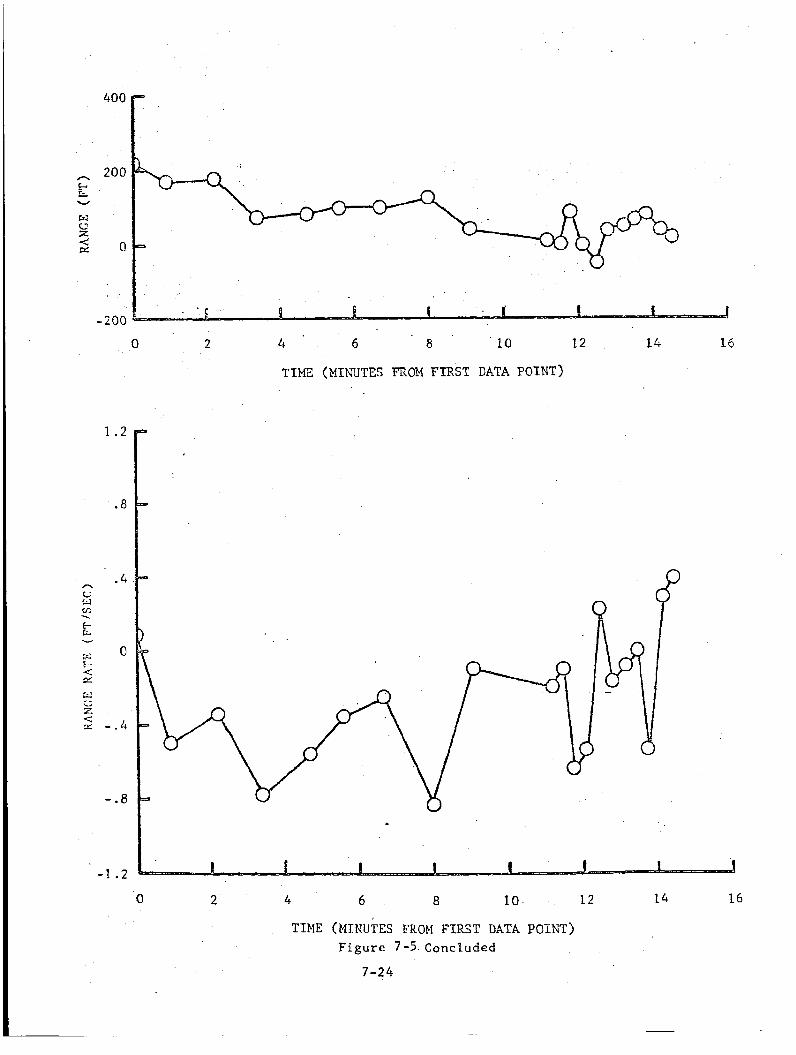
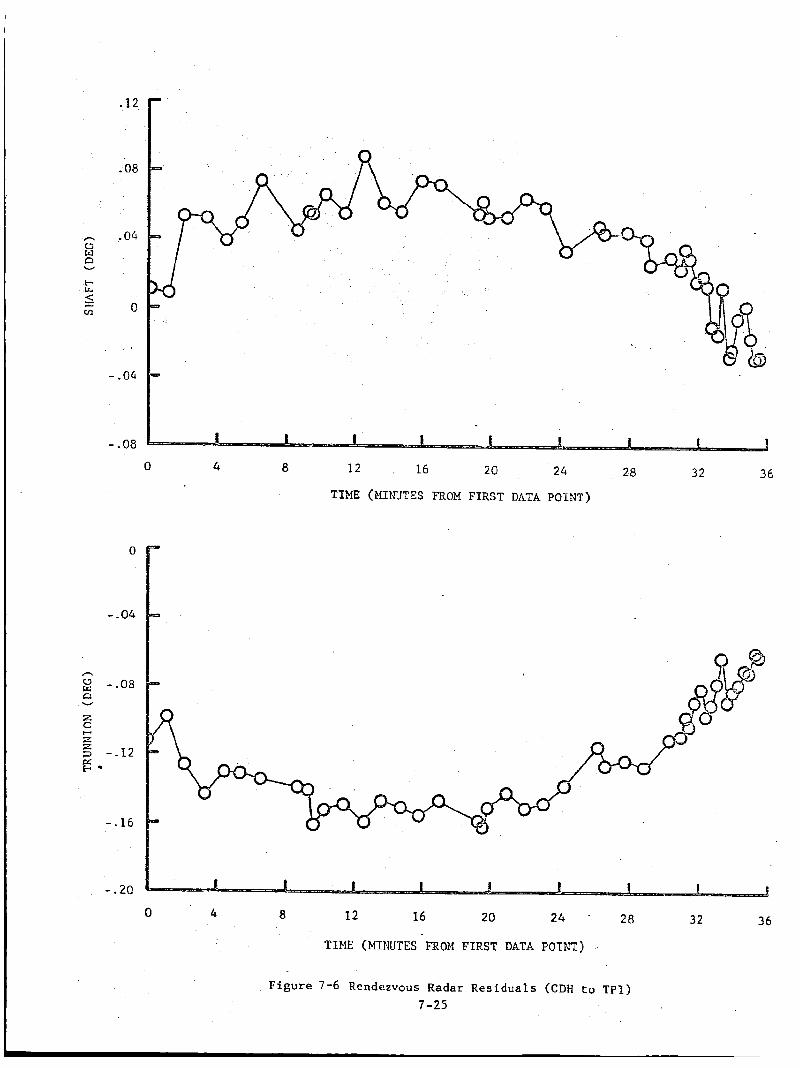
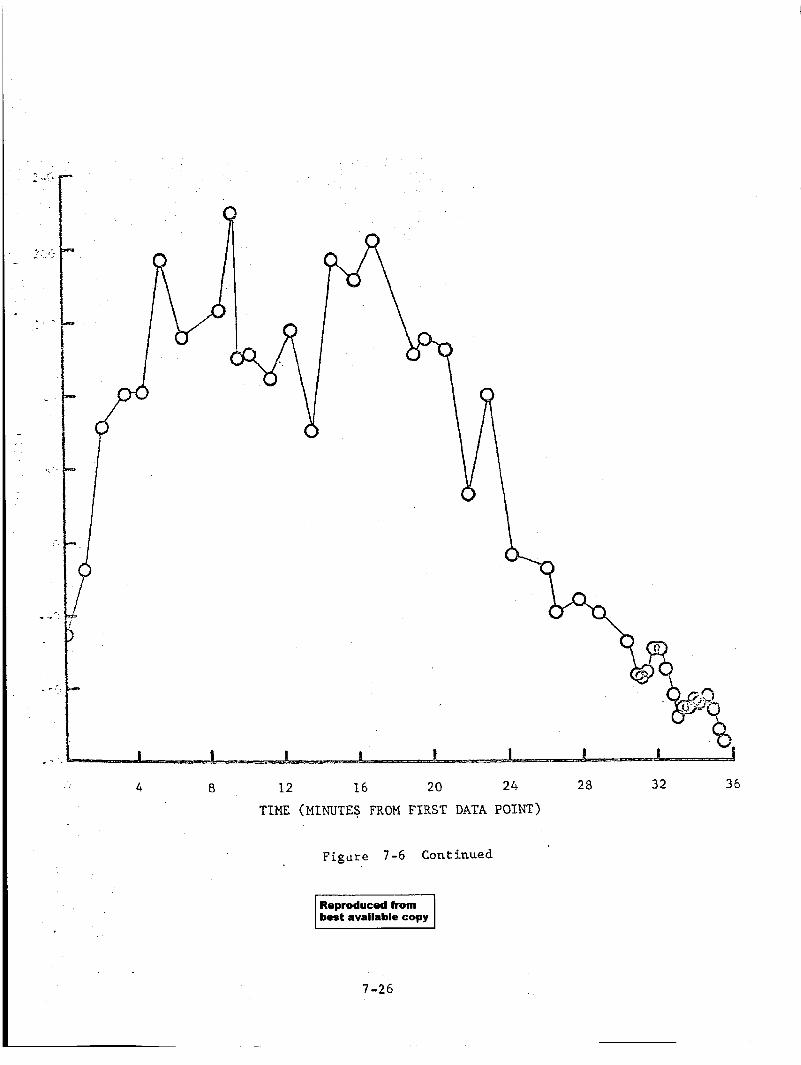
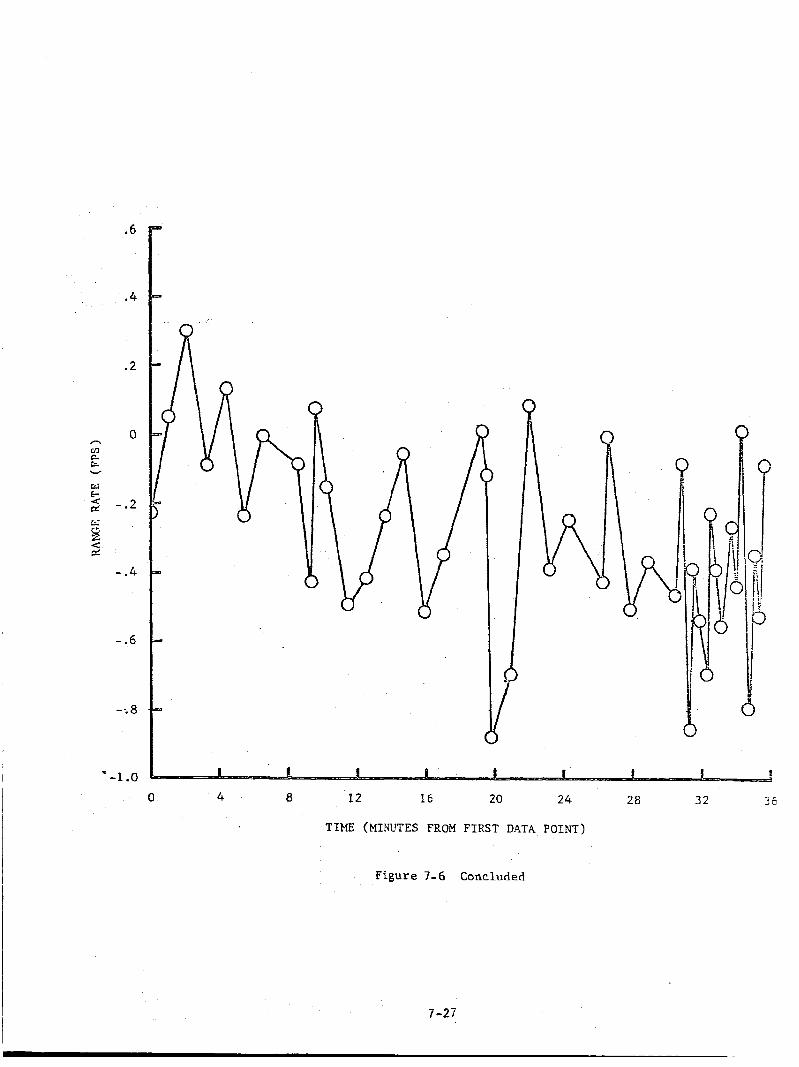
segment and Figures 7-3a and 7-3b i l l u s t r a t e the r e s u l t s graphica l ly .
were genera l ly w e l l behaved as can be seen i n t h e r e s i d u a l p l o t s (Figures
7-4 through 7-6). The r e l a t i v e l y large differences between t h e s taadard
devia t ion and noise computed f o r s h a f t and t runnion i n che CSI t o CDH and
CDH t o TPI per iods can p a r t l y be a t t r i b u t e d to t h e f a c t t h a t both rendezvous
radar and sextant da ta were used i n the f i t . A s t h e two da ta sets become
more equal in s i z e (weighted e f f e c t ) o r the sampling arcs more coinc ident ,
r e s idua l statist ics d e t e r i o r a t e .
statistics l i s t e d i n Tsble 7.6 which were obtained from fits made ~ 5 t h
only rendemous r a d a r d a t a included.
eliminated, t h e RR s h a f t and trunnion means and devia t ions decrease i n a l l
segments.
t h e CDH and TPI per iod) , i nd ica t ing t h a t a sys temat ic e r r o r i s s t i l l pre-
s e n t i n the s h a f t measurement. It should a l s o be noted t h a t t h e rendezvous
The dat2
This e f f e c t is demonstrated by the
Note t h a t when sex tan t d a t a i s
The shaft s t a t i s t i c s are s t i l l relatively high ( e spec ie l ly i n
radar r e s i d u a l s t a t i s t i c s from Apollo 1 0 exhib i ted a sixilar c h a r a c t e r i s t i c
(Reference 1).
tYuiEZo3 measurement are r e l a t i v e l y large i n the CDH to 'RT period (no
sex tan t da t a were included i n Apollo 10 so lu t ions ) .
.
In A p o l l o 1 0 , t h e s tandard dev ia t ions for both shaft and
The l a r g e mean values
seen i n T a b l e 7.5 are a l s o a r e s u l t of t h e inc lus ion of s ex tan t d a t a i n the
so lu t ion d a t a sets. !.Then only rendezvous r ada r d a t a was included, t h e mean
values decreased t o near zero va lues .
The range r e s i d u a l statist ics exhib i ted c h a r a c t e r i s t i c s s i m i l a r t o
When VHF ranging d a t a i s removed from t h e s o l u t i o n the Apollo 1 0 da ta .
data set, s tandard devia t ions decrease and become, i n two segments, a h o s t
equal t o n o i s e estimates.
t h a t no bias is present .
The mean values a l so approach ze ro , ind ica t ing
7-17
I .T?IH nsertion . CSI To CDH TP I
I 1 ' .009 ,015 ' .033
.015 .016 .031
.013 .010 . o m -. 051 -. 068 -. 119 9 010 .019 .031
.010 .008 . .007
79. 75. 55. 144. 63. 92.
39. 37. 27.
.604 - .243 -. 305
.173 .339 ,277
.627% ,6278 .6278
Meen
S. D e v .
Noise
Mean
S. D e v .
Noise
Me an S. D e v .
No is e
Mean
S. D e v .
Q. E.*
* 9.uantization Error.
7-18
ti v) H
=,o
VAV LOIY
7-19
I 3'78V'IIVAV LON
I a M C d X
N
I-+
W
I
N
l-l I
C (3 p:
rn 3 0 > N aJ 'J C 0 !%
0 0 rl
0 0 N
0 0 0 +--(
0 0 N
I
0 0 m
7-20
.12
-08
.04
0
- .04
0
- .04 n 0 w n v
-.a8 t-l z 2 3 ffi E-
- . 1 2
-. 16
0 1 2 3 1; 5 5 7
TIVE (MINUTES FROM FIRST DATA POINT)
I
0 1 2 3 4 5 6 7
TIME (MINUTES FROM FTRST DATA POINT)
Figure 7-4 Rendezvous Radar Residua1.s ( I n s e r t i o n to CSI)
7-21
1 . 2
u z 3 - . 4
.8
.4
0
.
- . a
-1.. 2
0 1 2 3 4 5 6 7
TIME (MINUTES FROM FIRST DATA POINT)
3 4
0 1 2 3 4 5 6 7
TIME (MINUTES FROM FIRST DATA POINT) Figure 7-4 Concluded
7 .-lo I &L
.08
.04
0
- .04 6 8 10 22 14 I€ 0 2 4
TIME (MINUTES FROM FIRST DATA POINT)
0
-.04
c5 w n
- .16 2 4 6 8 10 12 14 IC 0
TIME (MIhWTES FROM FIRST DATA P O I N T ) 2 4 6 8 10 12 14 I; 0
TIME (MIhWTES FROM FIRST DATA P O I N T )
Figure 7-5 Rendezvous R a d a r Residuals (CST t o C D H )
1-23
0 2 4 6 8 ' 10 12 1L; 16
TIME (MINUTES FROM FIRST DATA POINT)
1 . 2
.8
. 4
0
- .4
- .8
-1.2
I
D
0 2 4 6 8 10 1 2 14 1 6
TIME (MINUTES FROM FIRST DATA POTNT) Figure 7 -5 Concluded
7-24
.12
* 08
- .04 ci w 0 v
0 -2 m c
- .04
- -08
3 R
,
20 24 28 32 36 0 4 8 12 , 16
TINE (MIhVTES FROM FIRST DATA POINT)
0
- -04
- .16
0 4 16 20 24 26 32 36 8 12
TTE!E (MINUTES FXON FIRST DATA POINT)
Figure 7-6 Rendezvous Radar Residuals (CDH to TPI) 7-25
4 8 12 16 20 24 28 32 36
TIME (MINUTES FROM FIRST DATA POINT)
F i g u r e 7-6 Continued
I Reproduced from best available copy
7 -26
.6
.4
.2
0
- . 2
- .4
- .6
--. 8
i I
0 4 8 22 16 20 24 28 3 2 3e
TIME (MINUTES FROM FIRST DATA POINT)
F i g u r e 7-6 Concluded
7-27
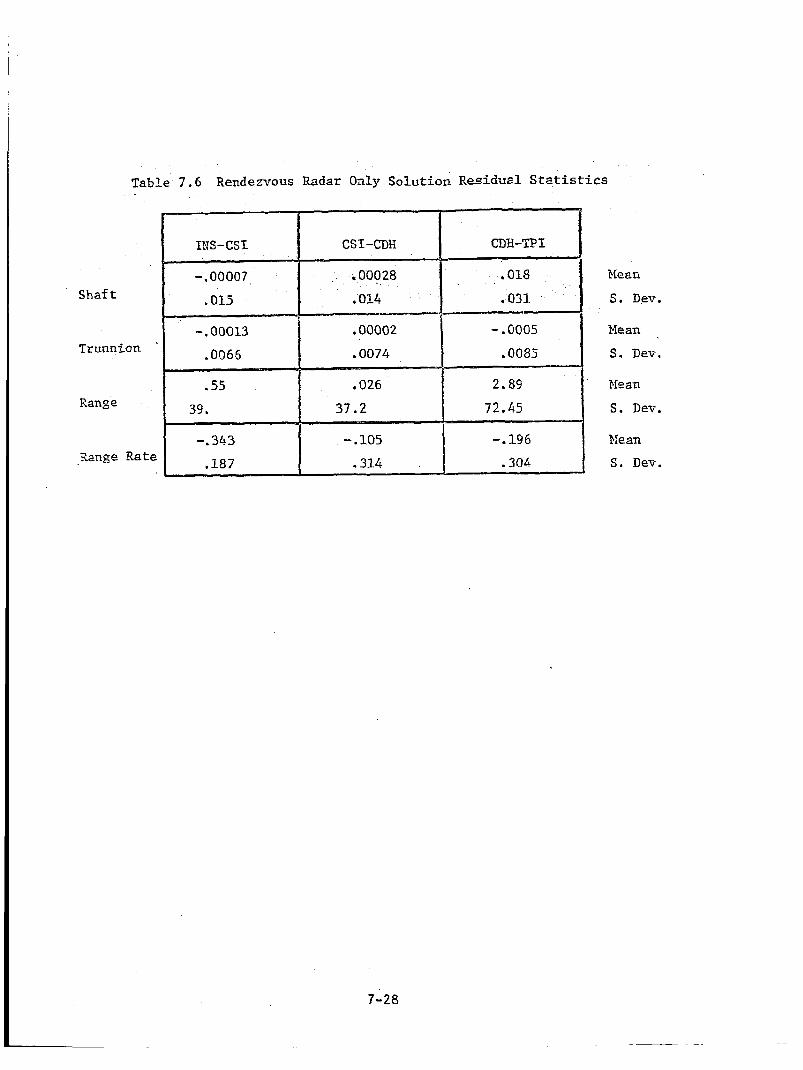
Table 7 . 6 Rendezvous Radar Only Solution Residual Sta t i s t ics
S h a f t
Trunnion '
Rang e
Range Rate
Mean
S. Dev.
Me an
S. Dev.
Mesn
S. Dev.
EIean
S. Dev.
7-28
I
The range rate res idua ls w e r e a l s o of good'qual2ty. Mean ve lues w e r e
&I less than the downlink readout e r r o r (.6278 fps) .
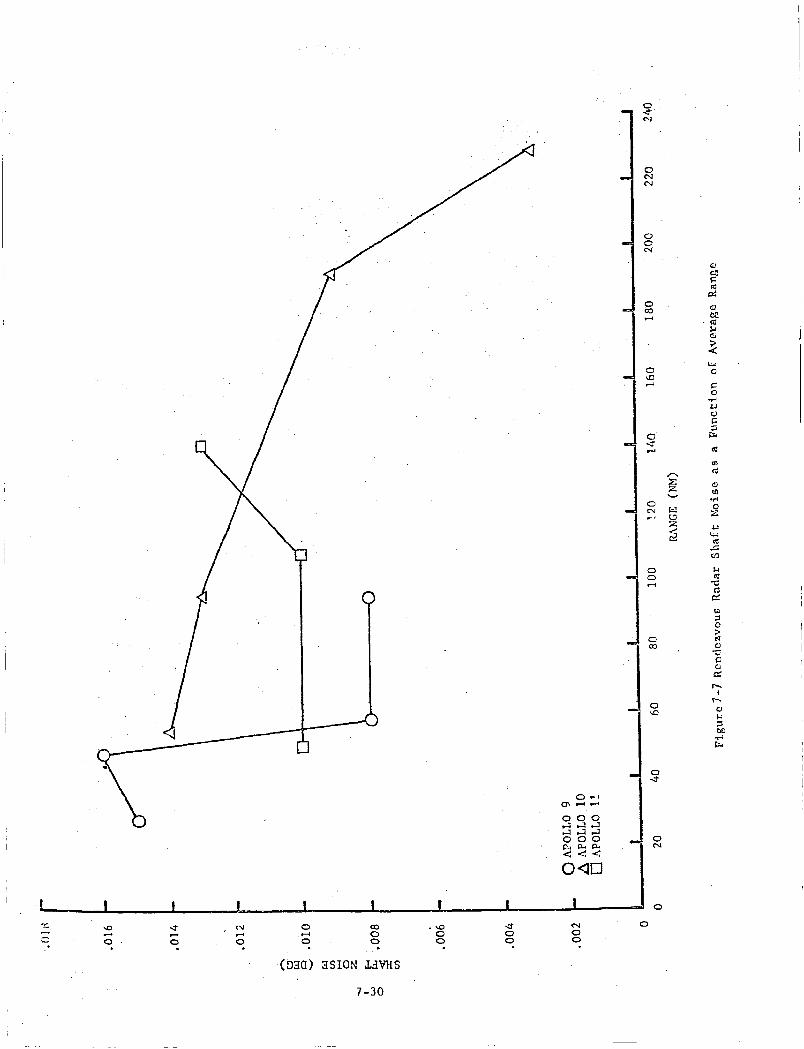
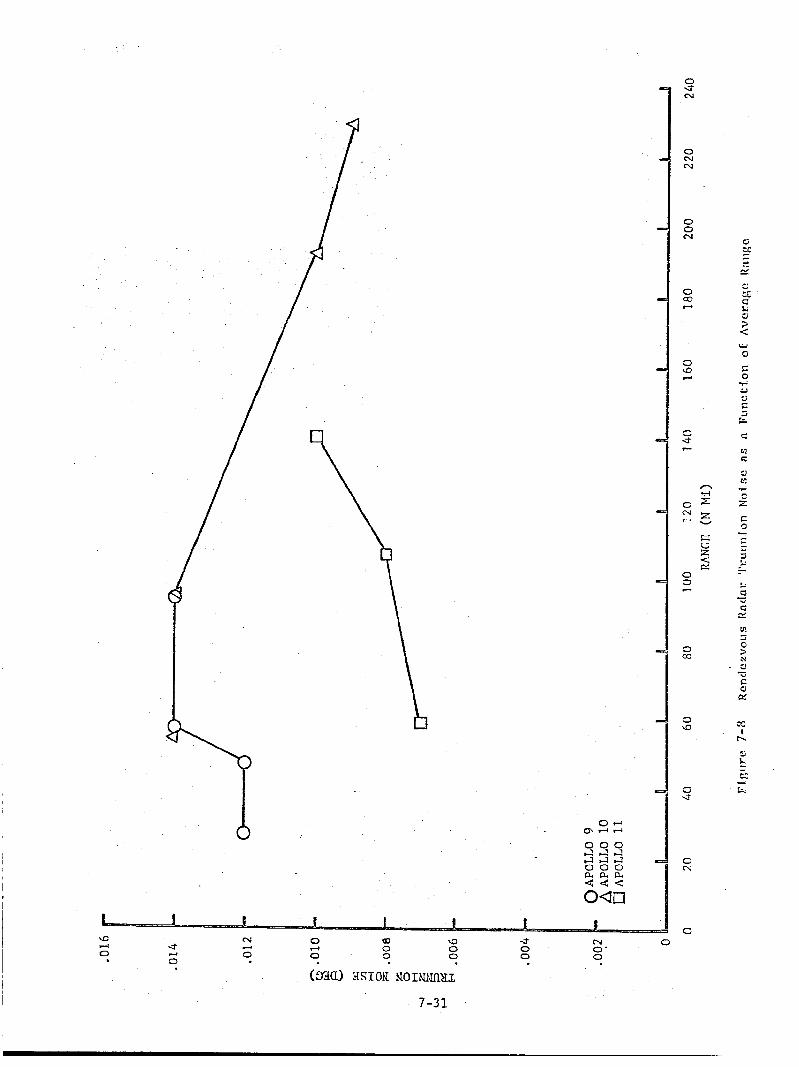
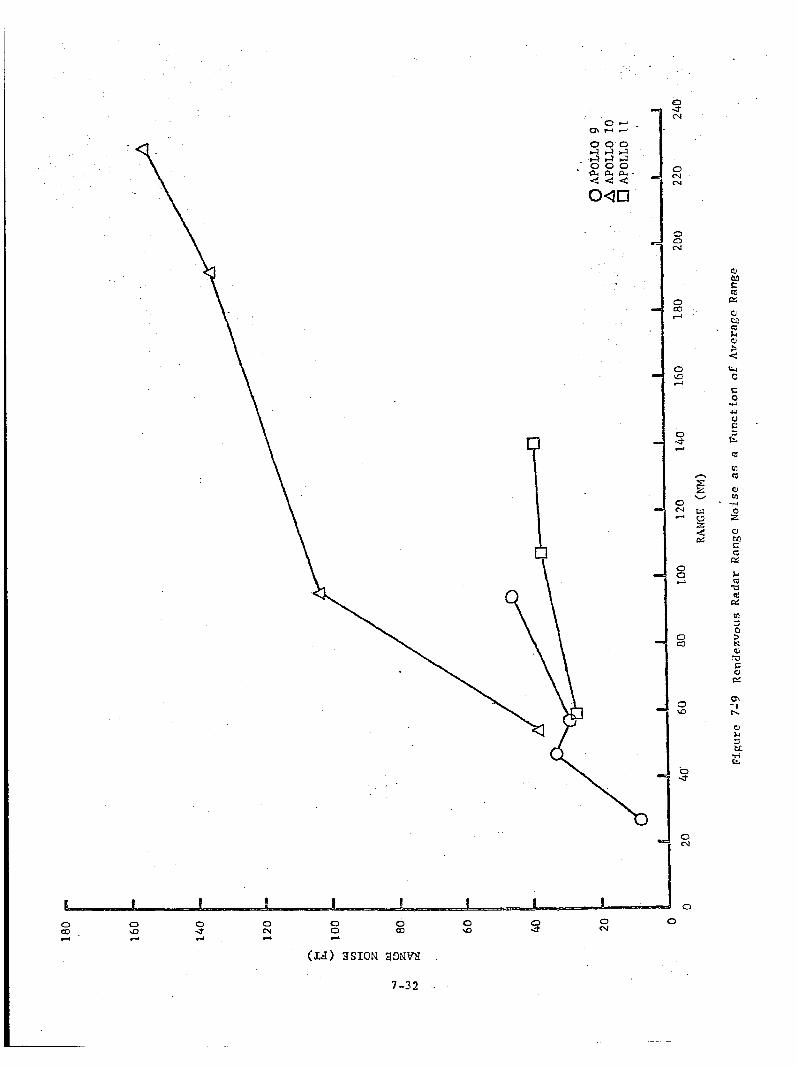
One sigma noise ca lcu la t ions f o r s h a f t , . trunnion, and range rate
from three missions are plo t ted as a func t ion of average range i n Figures
7-7 through 7-9. .These f igures show t h a t t h e Apollo 11 n o i s e estimates
campare well wi th similar estimates from missions 9 and 10. h'ote t h a t no
d e f i c i t e ' t r e n d i s apparent i n t h e angular noise as relative rmge varies. F igure 7-9 does seen t o ind ica te , however, t h a t t h e n o i s e e s t ima te f o r .
t h e range measurement does increase as average range increases . The
Apol lo 11 noi se estimates f o r all t h r e e observables appear t o be gene ra l ly
smaller than those obtained from previous missions.
VEF Ranging Data
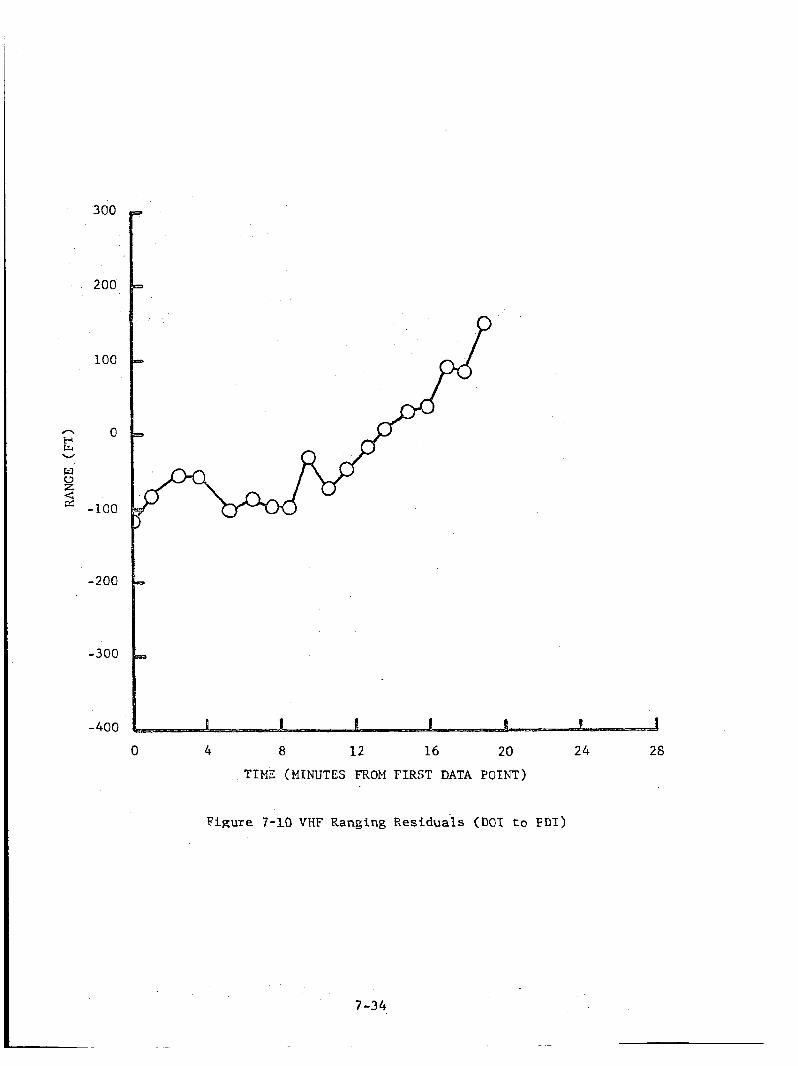
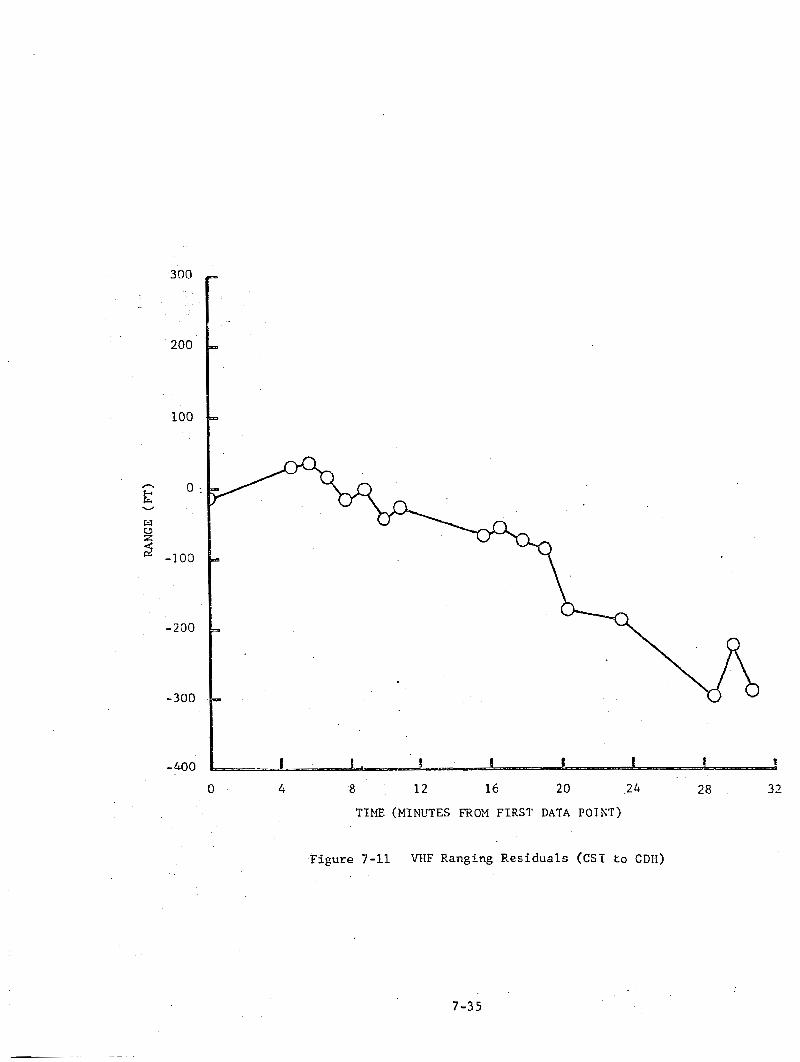
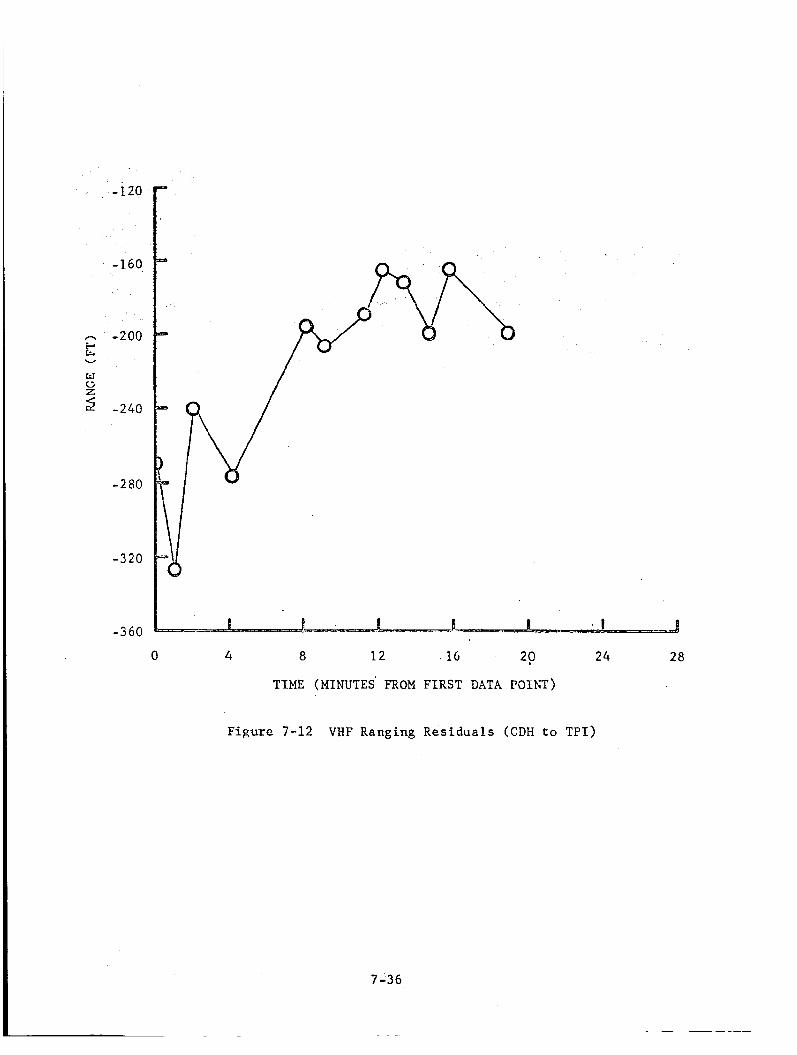
Table 7.7 contains a summary of VHF ranging da ta r e s i d u a l s t a t i s t i c s
ob ta ined from onboard f r e e f l i g h t f i ts made over t h e t h r e e segments where
adequate amounts of da ta were ava i l ab le . Figures 7-10, 7-11, and 7 ~ 1 2
con ta in p l o t s of t hese res idua ls . Since only two observat ions were obtained
f r o m t h e i n s e r t i o n t o CSI segment, o n l y t h e DO1 t o PDT (18 observa t ions) ,
CST t o CDH (17 observat ions) , and CDH t o TPI (12 observat ions) sements
are considered.
The VHF ranging da ta were generally of good qual i ty . As expected,
t h e smallest mean va lue w a s obtained during t h e D O 1 to PPI period i.Then
VEF ranging w a s t h e only range d a t a type measuring t h e d i s t a n c e between
veh ic l e s . The mean values becoine increas ingly large as more rendezvous
r a d a r d a t a are included i n t h e d a t a set o r as t h e da t a a r c s become
coinc ident i n t i m e .
CDE t o 'PI period. This large mean, however, i s s t i l l wi th ln t h e b i g s
s p e c i f i c a t l o n l i m i t of 2270 feet.
This can be seen i n t h e l a r g e mean va lue for t h e
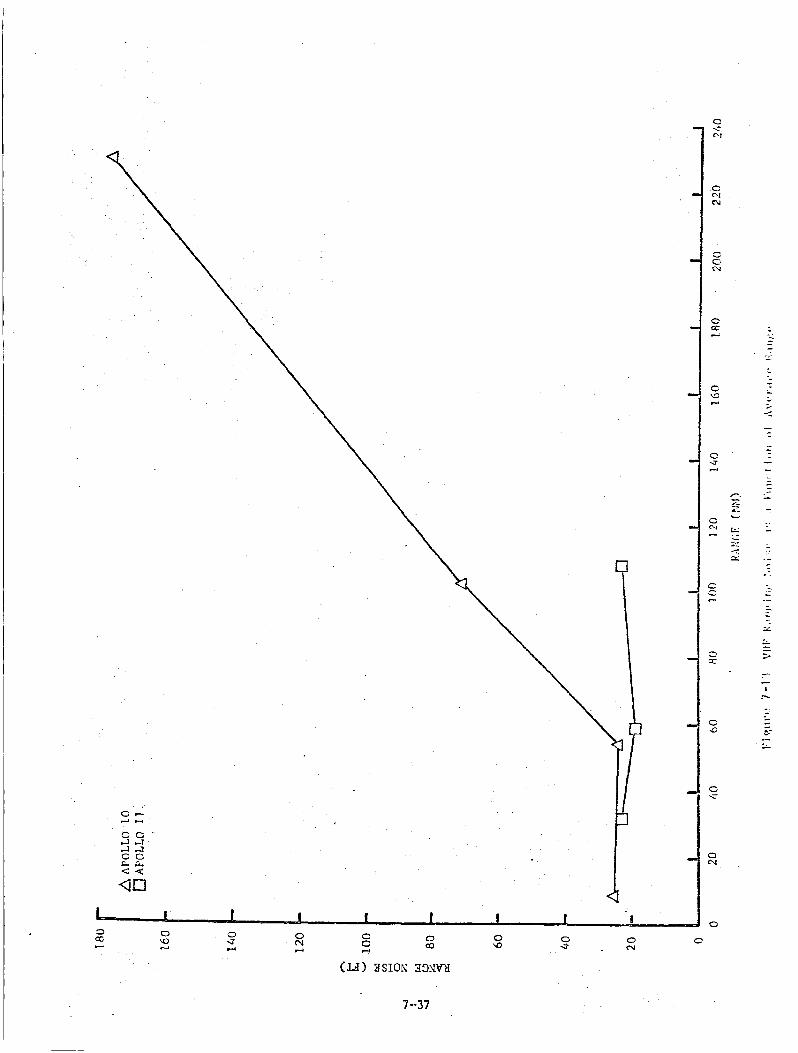
Figure 7-13 shor-7s t h a t the ca lcu la ted no i se values conpare favorably
with Apollo 10 r e s u l t s apd are r e l a t i v e l y constant when compared t o those
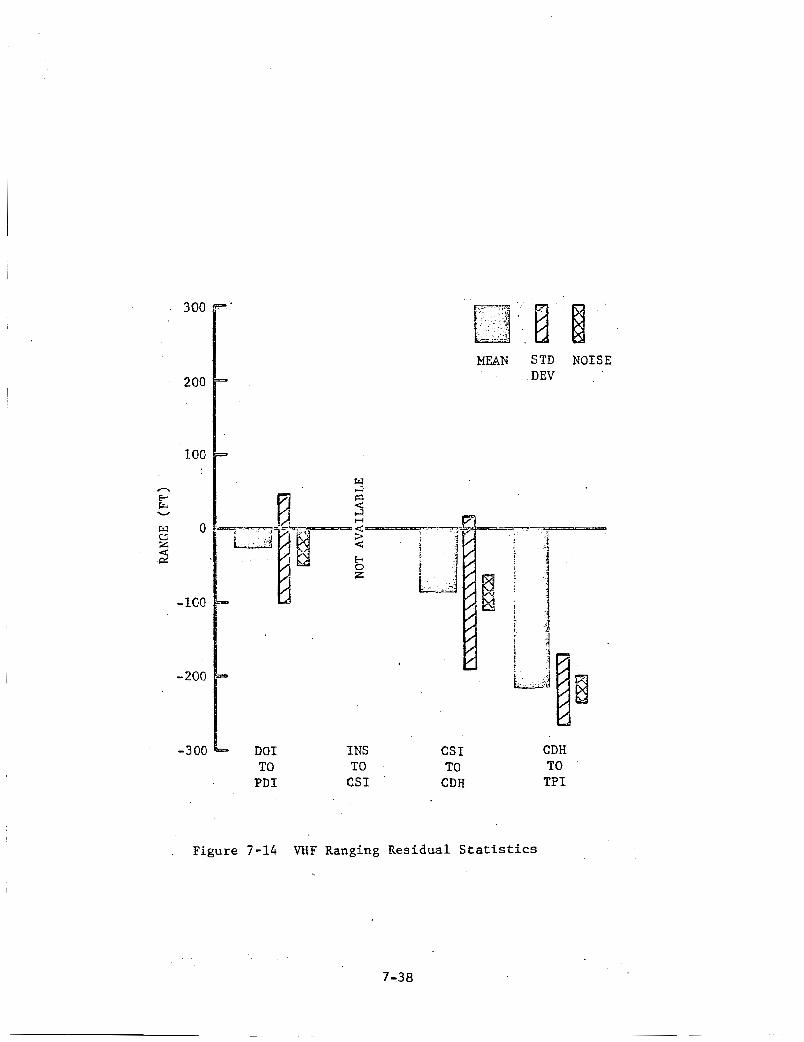
obta ined from Apollo 10. The r e s i d u a l statist ics l i s t e d i n Table 7.7 are
i l i u s t r a t e d graphica l ly in Figure 7-14.
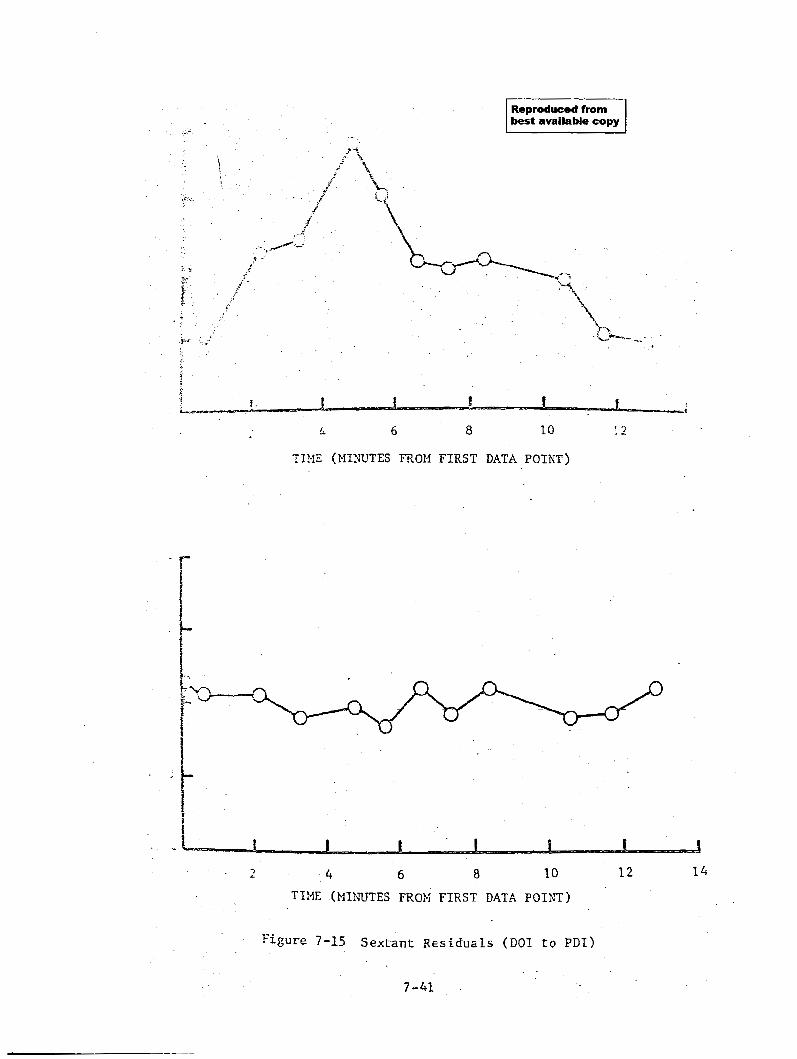
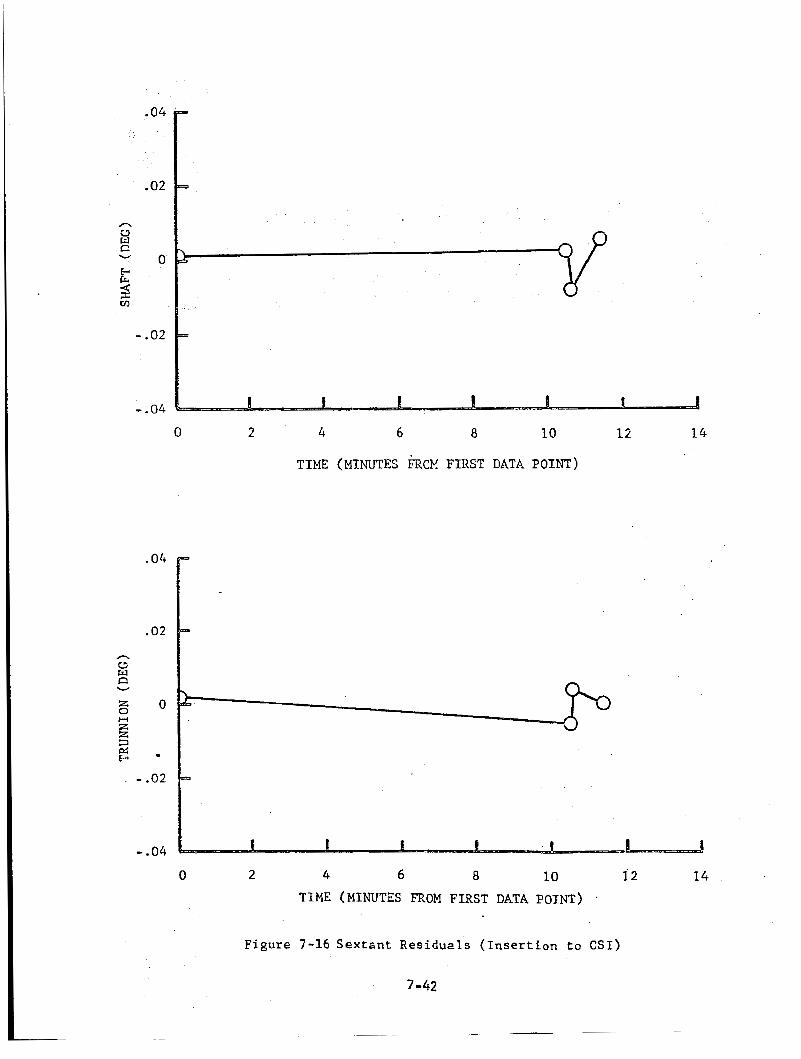
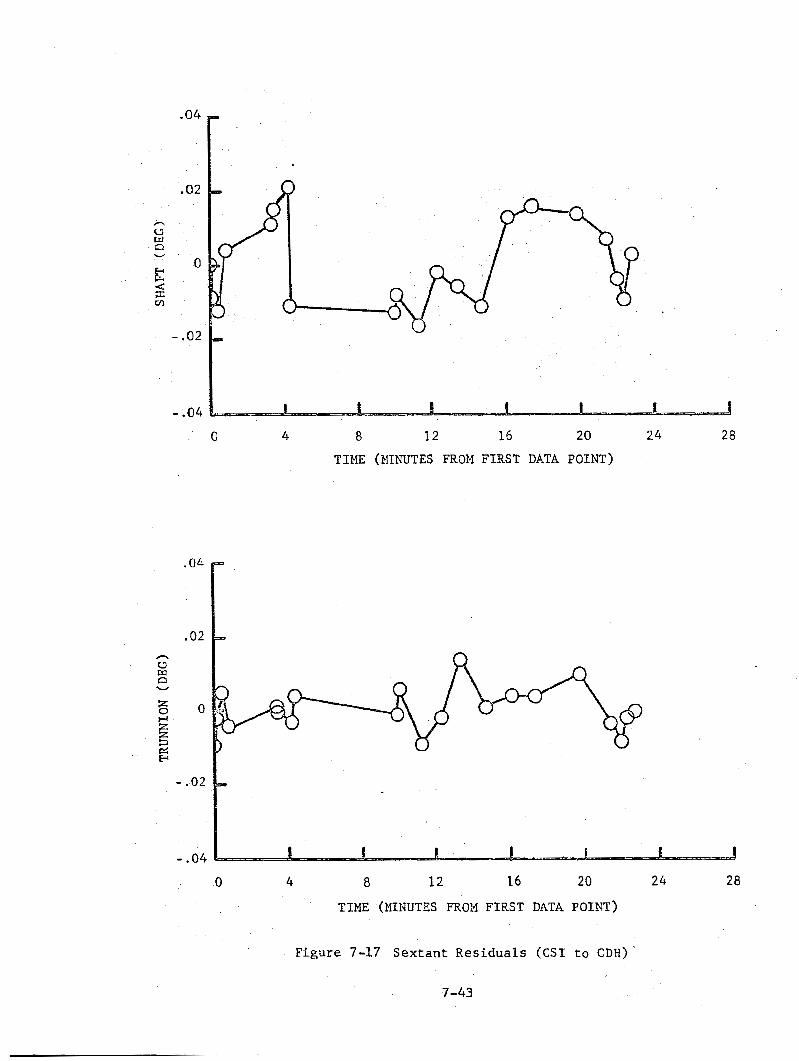
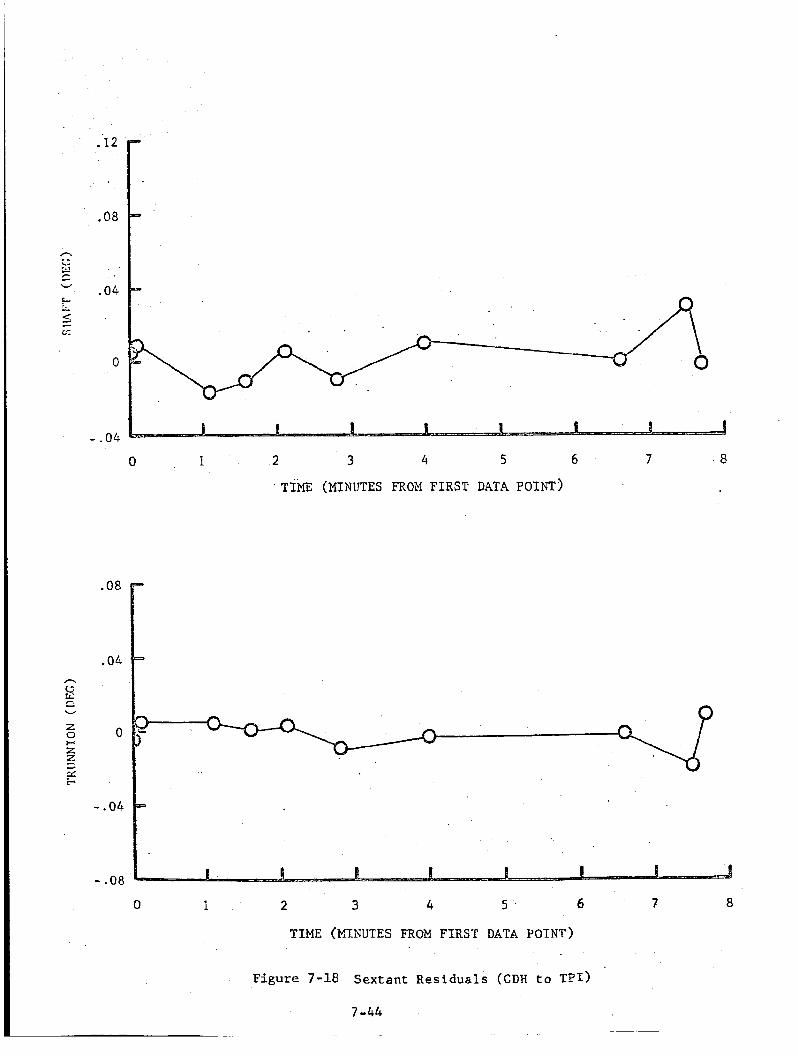
Sextant
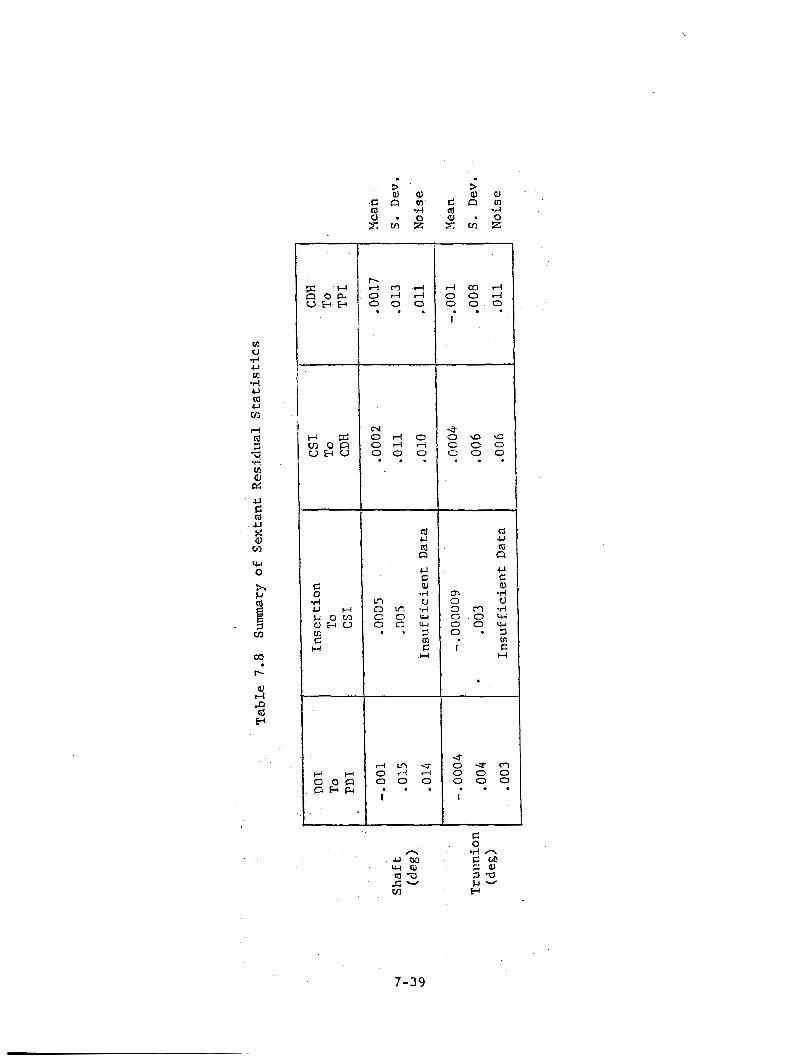
The r e s i d u a l s t a t i s t i c s shown i n Table 7.8 i n d i c a t e t h a t t h e CSM
sextant i s a very accura te instruqent . Sextant observat ions were obtained
OQD
f 1 I I I I 1 I I N 0 r. r(
0 0
co 0 0
-3 0 0
0 N hl
0 C N
lo N
0
0
7-30
9 -;t 0 0
cy 0 0' 0
0 Q . r(
0 \o
0 0 0 hl 0 co r) r)
0 cv 0
7-32 '.

DOI-PDI
-26.
7 4 .
23.
Range (feet)
7-33
CSI-CDR CDH-TPI
-86, -216. Mean
104. 48. S. Dev.
Koise 23. 19.
300
200
100
0
-100
-200
-300
-400
0 4 8 12 16 20 24 28
TIME (MINUTES FROM FIRST DATA POINT)
Figure 7-10 VHF Ranging Residua'ls (DOT to PDT)
7-34
300
200
100
0 :
-100
- 200
-300
- 400
8 1 2 16 20 24 28 32 0
TIME (MINUTES FROH FIRST DATA POTNT)
Figure 7-11 VHF Ranging Residuals ( C S I to CDH)
7-35
-120
-160
c3
2 -240
-280
-320
-360
0 4 8 12 . 16 29 24 28
TIME (MINUTES FROM FIRST DATA POINT)
Figure 7-12 VHF Ranging Residuals (CDH to T P I )
7-36
I i
7-37
300
200
100
n F a W
m O u
3 - 100
-200
-3 00
MEAN STD NOISE D EV
D O 1 INS TO TO PDI CST
CSI CDH TO TO CDH TPI
Figure 7-14 VHF Ranging Residual Stat i s t ics
7-38
U C m U
5 0-l
w 0 h &i
B ’ 5 cn
h
A m 4 0 4 4 0 0 0 . . .
F1 0 4 0 O d d 9 9 9
(d U CI P
U C a, .A
In u 0 In -4 c o w o c w
cn c
4 L n c 0 4 4 0 0 0 I . .
I
4 0 3 4 0 0 4 0 0 0 . . .
I
. . .
P) OI .rl 0 U
G . 0 U-I o o w
I C
o m -r!
0 * :
H
4 o u m 0 0 0 0 0 0 . . . I
7-39
I
in four of the f r e e flight seginents; DO1 t o PDI (13 s i g h t i n g s ) , i n s e r t i o n
to CSI ( 4 s igh t ings ) , CSI t o CDH (21 s i g h t i n g s ) , O H t o TPI (10 s i g h t -
ings) . The c lose agreement of t h e s tandard devia t ions w i t h t h e no i se
estimates and t h e very small means listed i n d i c a t e t h a t t h e r e are
essen t i a l ly no b i a s e s i n e i t h e r angle.
The r e s idua l p a t t e r n s (Figures 7-15 through 7-18) are very w e l l be- . “haved. The random n o i s e es t imates (Figure 7-19) compare w e l l w i t h ren-
demous radar angular noise estimates and no t rend can be i d e n t i f i e d
tr i th respect t o average range.
no ise estimates p l o t t e d i n Figure 7-19.
Onboard Tracking Data Consistency
Note the good agreement with t h e Apollo 9
In order t o determine the consis tency of t r a j e c t o r i e s reconstructed
from onboard t r ack ing d a t a wi th those obtained from MSFN t rack ing d a t a ,
state vector comparisons w e r e made over the gxopagatioa interrals. These
conparisons w e r e made i n a UVV-type coord ina te system and t h e r e s u l t s are
presented i n graphic fonn. I n t h e figures presented, RZ is the Eegzt ive
of t he U or r a d i a l component, RX i s the V o r downrange component, and RY i s the negat ive of t h e W o r crossrange component of a system centered a t
the CSM. RW, RM) and RZD are the r e spec t ive v e l o c i t i e s .
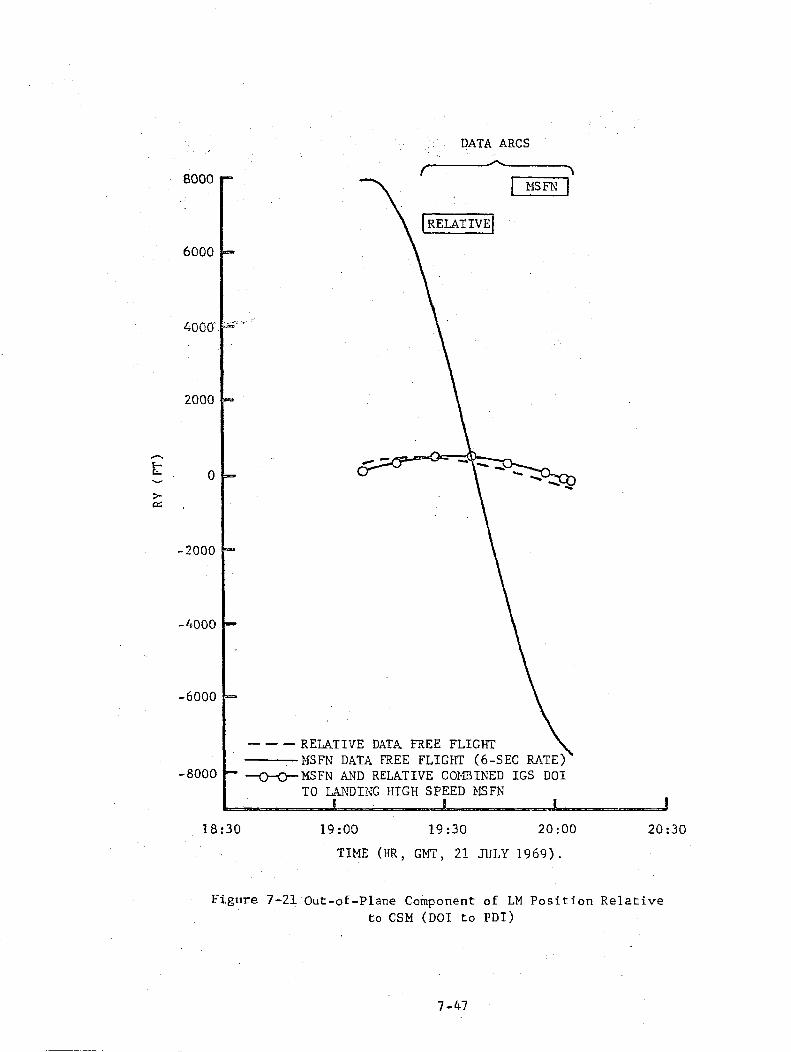
Three LM t r a j e c t o r i e s were obtained f o r t he per iod from D O 1 t o PDI.
Figure 7-21 plots (as a function of time) t h e out-of-plane component o f
LM pos i t ion relative t o t h e CSM f o r z MSFN f r e e f l i g h t ‘ t r a j e c t o r y , an
onboard data free f l i g h t t r a j e c t a r y , and the f ina l BET (combined h igh
speed MSFN and onboard t rack ing data) . It can be seen that the add i t ion
Of onboard t racking d a t a d r a s t i c a l l y improves t h i s component of pos i t i on .
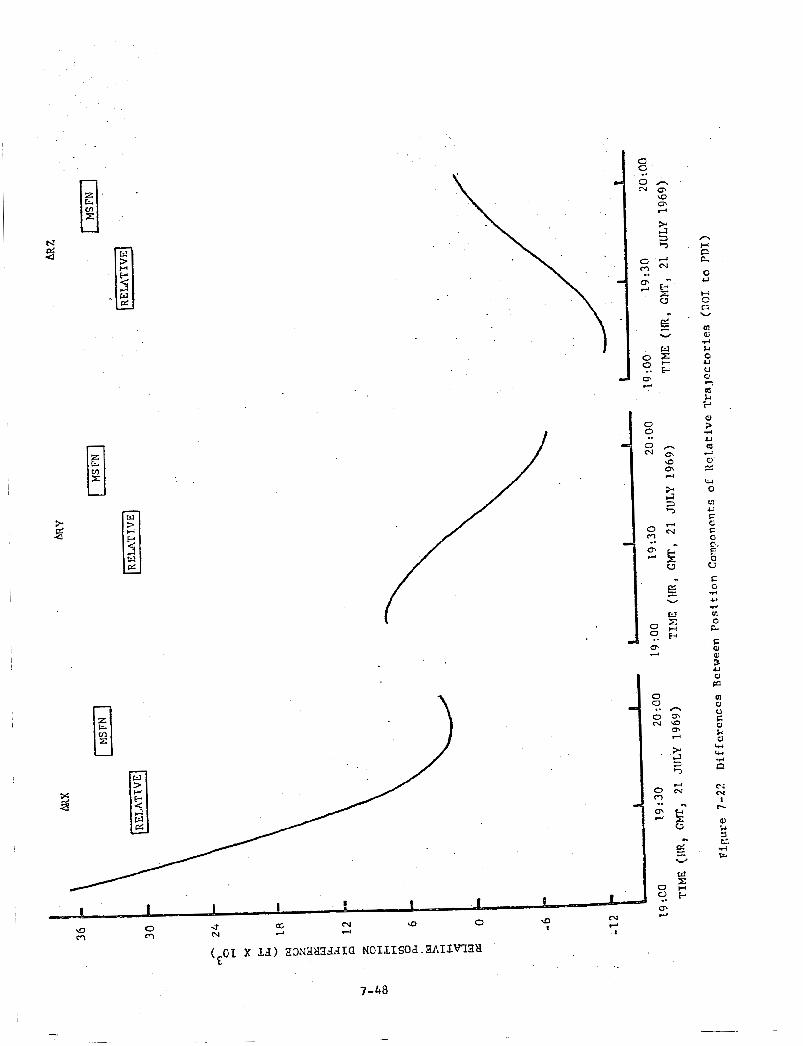
Figures 7-22 and 7-23 show t h e d i f f e rences between re la t ive t r a j e c t o r i e s
obtained froui t h e MSFN and from t he onboard t racking free f l i g h t f i ts .
Tnere are large d i f f e rences i n the t r a j e c t o r i e s which are pr imar i ly due
to the poor q u a l i t y of the MSFN f r e e f l i g h t f i t , b u t the coinparFsons do
show t h a t t he dawnrznge and rad‘tal components compare f a i r l y w e l l i n s i d e
the ES” data arc.
7 -40
t . L . c r c M . l i
I I -e
1. .. 6 8 10 !7
91!*:E (NTPUUTES J X O M FIRST DATA POINT)
- r f .c f
$ I- . i
4-
pc, 5-
t
f I i
4 6 8 10 1 2 14 . 2
TIME (MINUTES FROM FIRST DATA POINT)
7-41
.04
.02
n c5 cri P
& 0 W
3 ul
-.02
- -04
.04
.02
h
t9 w m W
2 3 0 n z z D ffi E + -
- .02
- .04
0 2 4 6 8 10 12 14
TIME (MINUTES I k O M FIRST DATA POINT)
0 2 4 6 8 10 12 14 TIME (MINUTES FROM FIRST DATA POINT) ’
Figure 7-16 Sextant Residuals (Insertion to C S I )
7-42
-04
.02
- .02
- .04
. OL:
.02 h
c3 W a U
z o o H z z D cs e
- -02
- .04
0 4 8 12 16 20 24 28
TIME (MINUTES FROH FIRST DATA POINT)
F i g u r e 7-17 Sextant Residuals (CSI to CDH)'
7-43
.12
.08
.04
0
- - 0 4
0 1 2 3 4 5 6 7 8
TIME (MINUTES FROM FIRST DATA POINT3
.08
.04
0
- .04
- .08
TIME (MINUTES FROM FIRST DATA POINT)
Figure 7-18 Sextant Residuals (CDH to T P I )
7 -44
0
0
b
4 v1
Q ri
9 \o c
9 N 0 aa \o + ,-I 0 0 0 . o 9 (33U) BSLON N O X N f l X L ‘J,.dFRts
7-45
* 0 9
PJ 0 0 -?
0 C c

cn (v d 0
co 0 0
* 0 0
0 a 0 0
N 4 0
I
4 U ld
0 0
I U rn
.
.;f m 0 0
4 C J .O 0
8000
6000
4000
2000
0
- 2000
- 400C
-6OOC
-8OOC
DATA ARCS - .)
D
--- RELATIVE DATA FREE FLIGHT \ MSFN DATA FREE FLIGHT (6-SEC RATE) - -MSFN AND RELATIVE COMBINED IGS DO1 TO XNDING H I G H SPEED NSFN
1 8 : 3 0 19 :OO 19 :30 20:oo 20:30
TIME (HR, GMT, 2 1 JULY 1969).
Figure 7-21 Out-of-Plane Component of LM Position Relative to CSM (DOT. to PDI)
7 -47
N
0 0
m
0 0
r(
6 4
,-l O N m
-.
[ w
X
H
0
0 N
Ff
s: .. i
0 0
m .. 4
0 0
0 .. N
0 rl
0. .. ri
0
0 c d
7-49
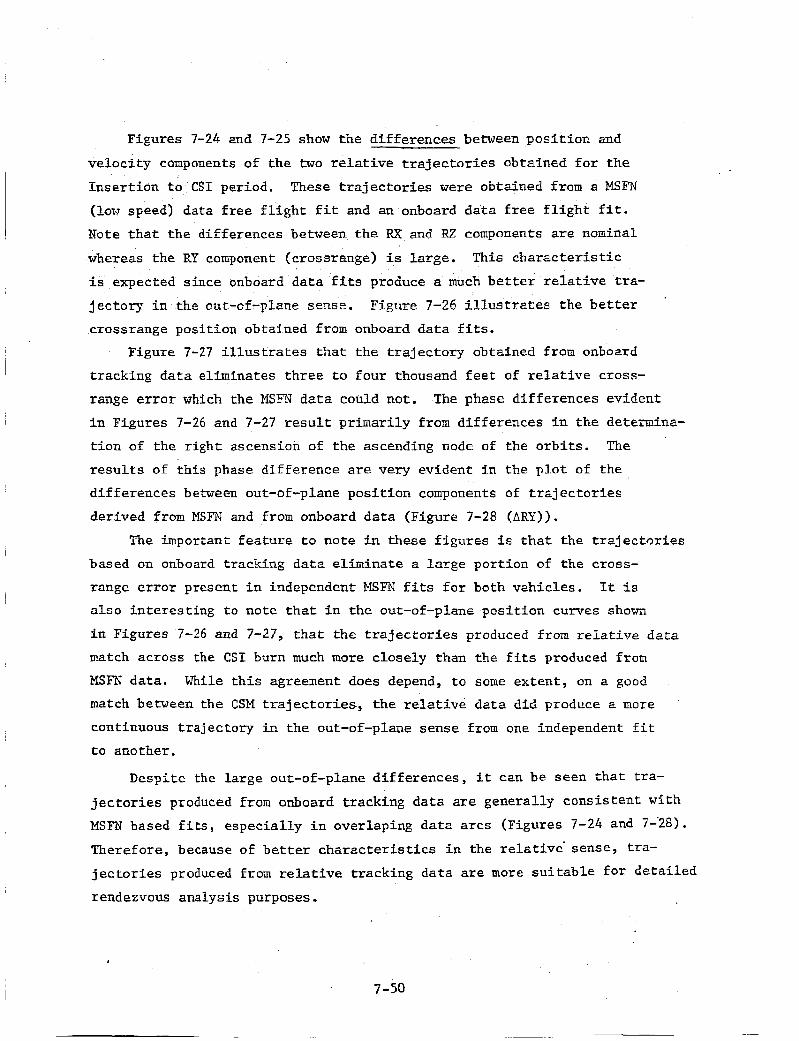
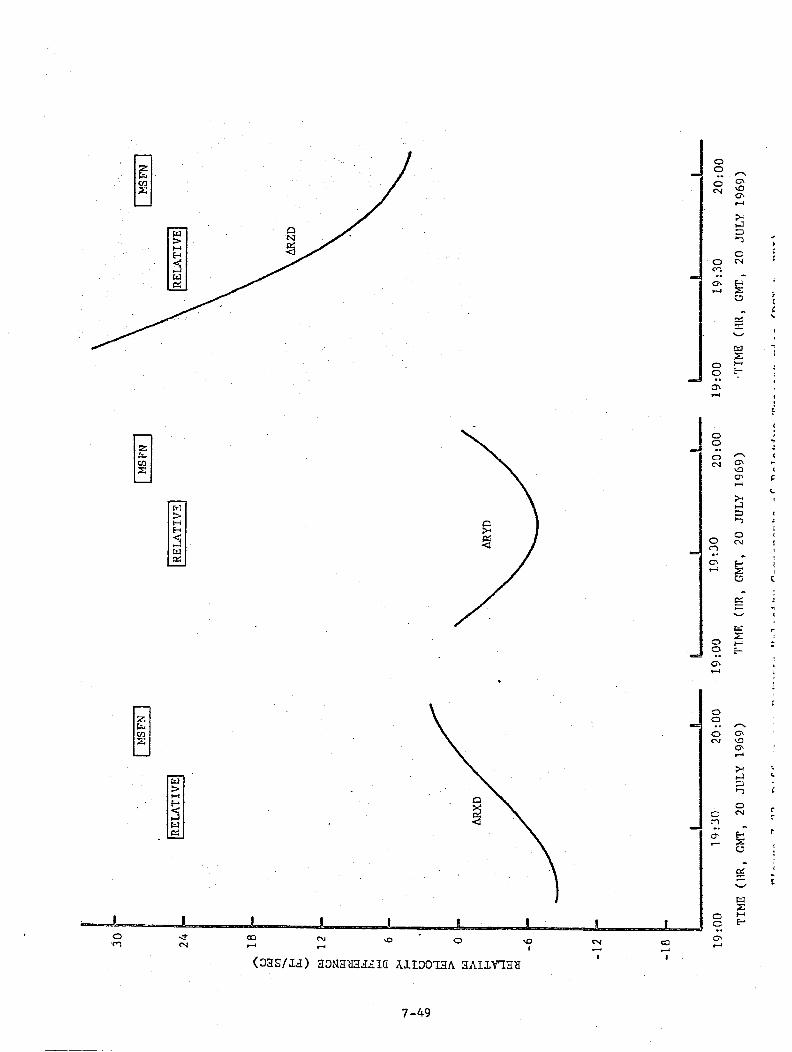
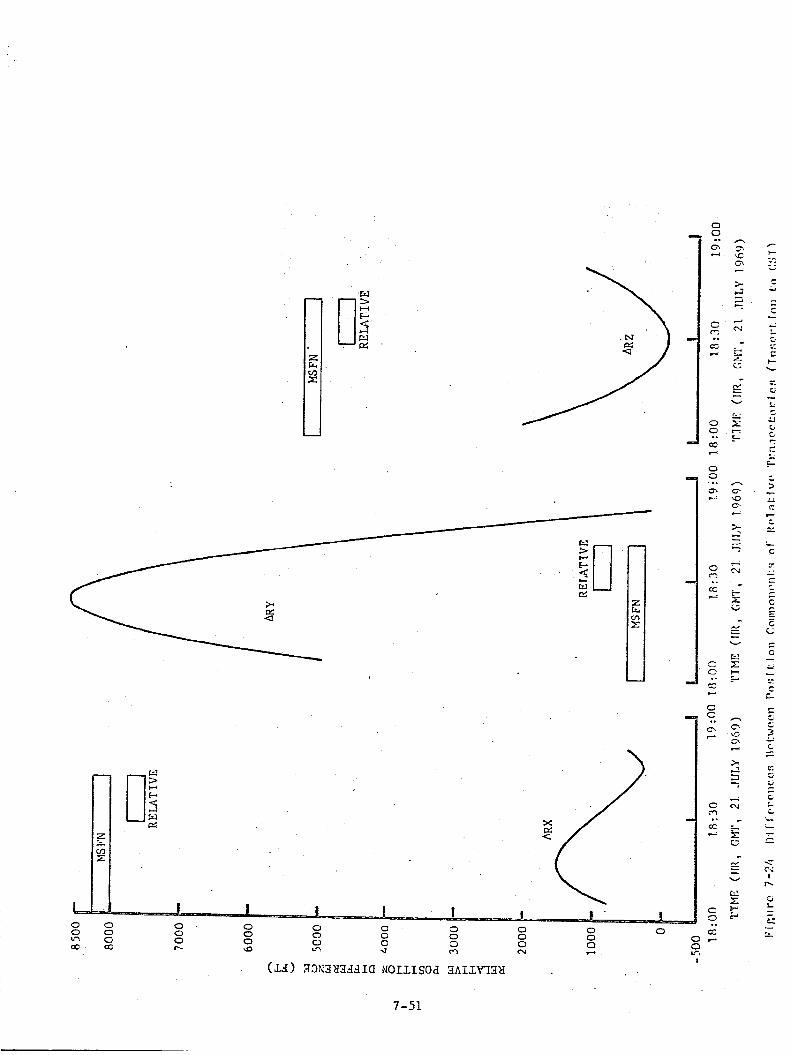
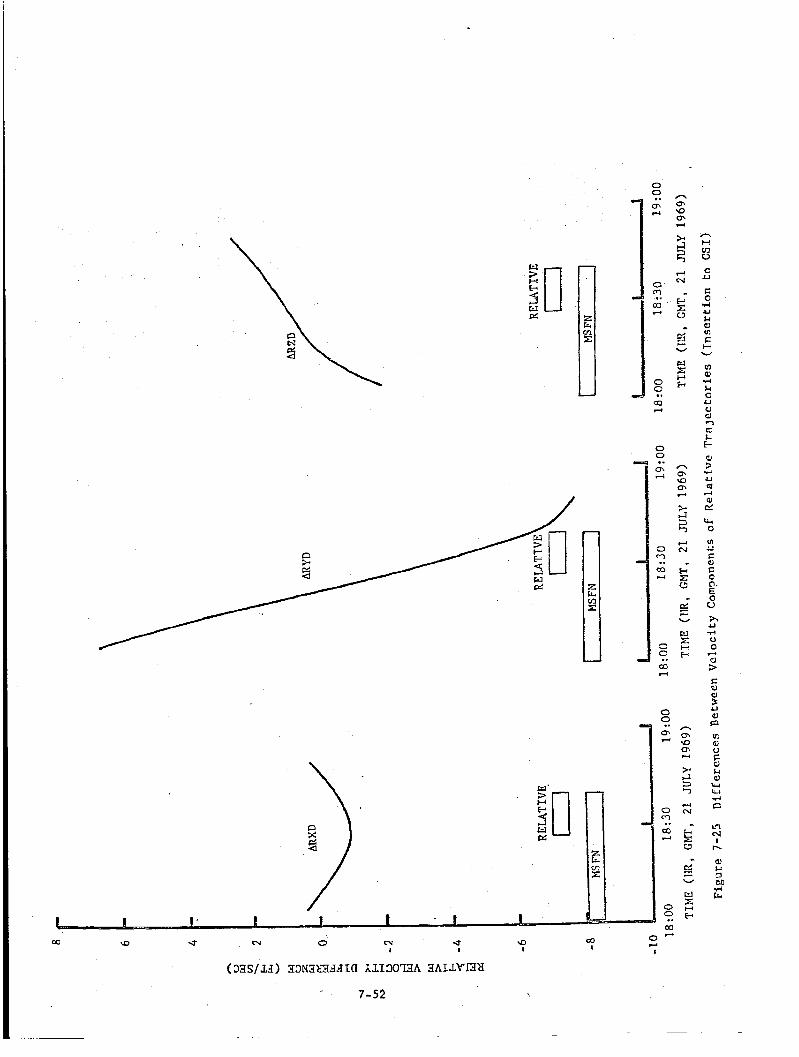
Figures 7-24 and 7-25 show the d i f f e rences between p o s i t i o n and
v e l o c i t y components of the two relative t r a j e c t o r i e s obtained f o r the
I n s e r t i o n t o C S I per iod.
(low speed) da ta free f l i g h t f i t and an onboard d a t a f r e e f l i g h t f i t .
N n t e t h a t t h e d i f fe rences between t h e RX and RZ components are nominal
whereas t h e RY component (crossrange) is l a r g e . This c h a r a c t e r i s t i c
i s expected s ince onboard d a t a f i t s produce a much b e t t e r relative tra-
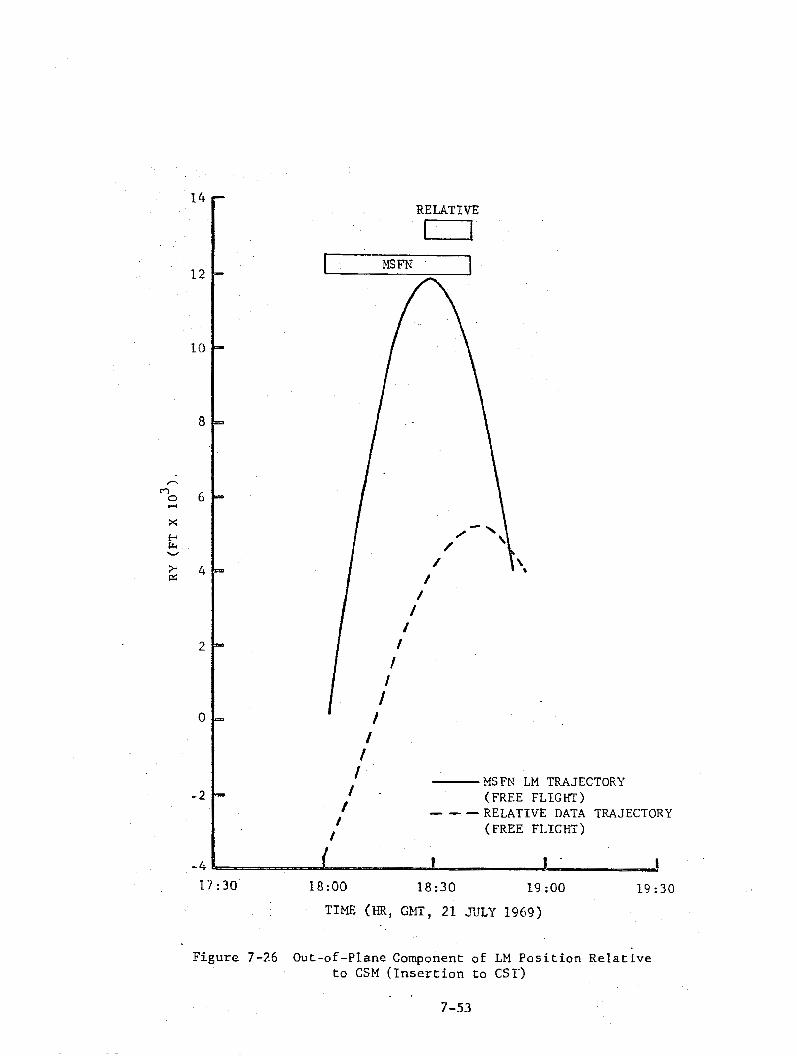
jectory i n the cut-of-plane sense. Figure 7-26 i l . l u s t r e t e s the better
crossrange pos i t ion obtained f r o m onboard d a t a f i t s .
These t r a j e c t o r i e s w e r e obtained from a EEFN
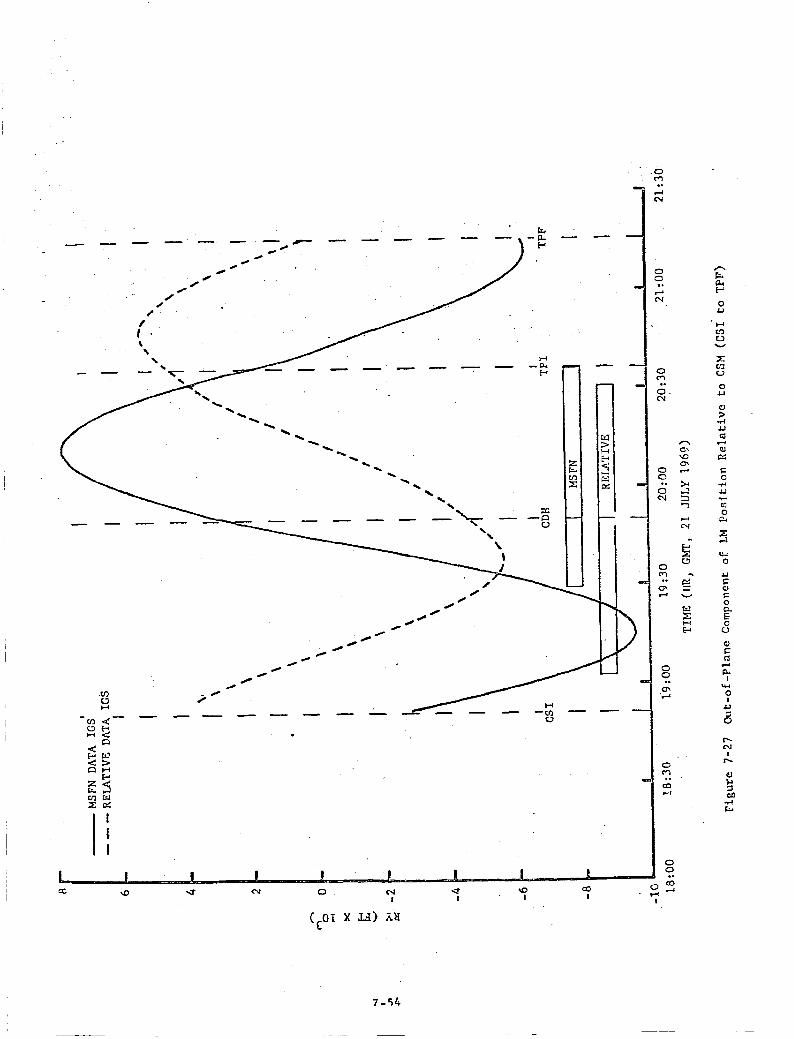
Figure 7-27 i l l u s t r a t e s t h a t t h e t r a j e c t o r y obtained from onboard
t r ack ing data el iminates t h r e e t o f o u r thousand feet of r e l a t i v e cross-
range error which the MSFN d a t a could not. i n Figures 7-26 and 7-27 r e s u l t p r imar i ly from d i f f e rences In t h e deternina-
t i o n of t h e right ascension of the ascending node of t h e o r b i t s . The
r e s u l t s of t h i s phase d i f f e rence are very evident i n the plot of the
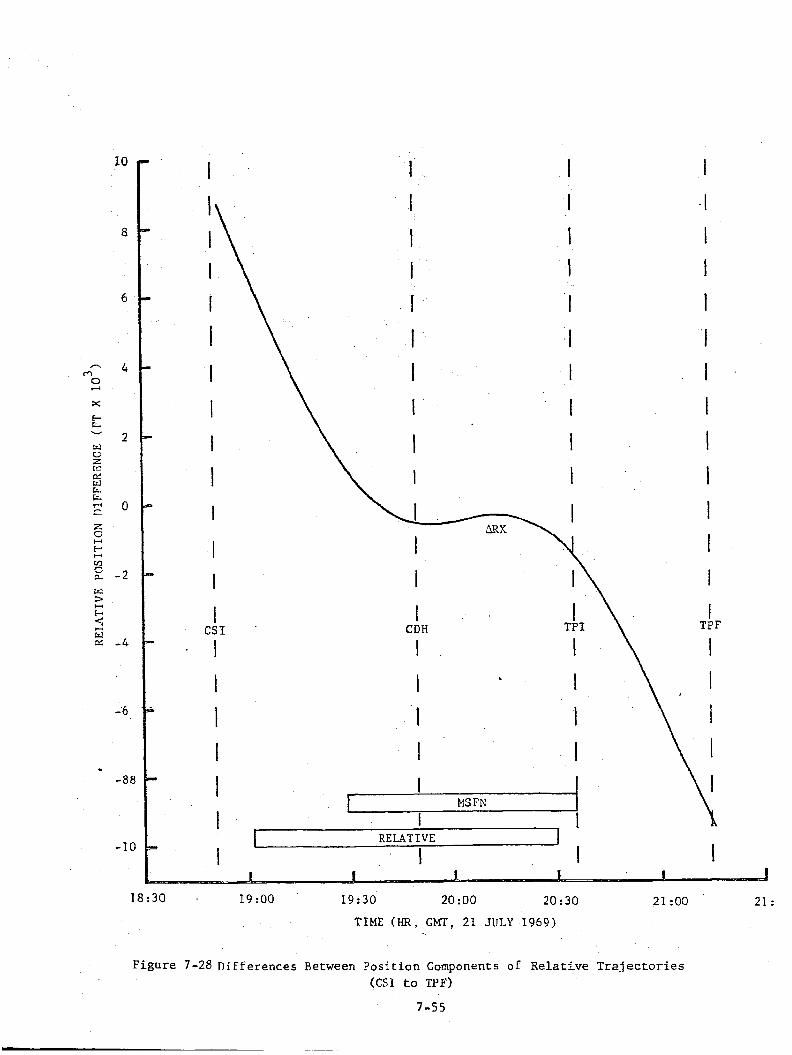
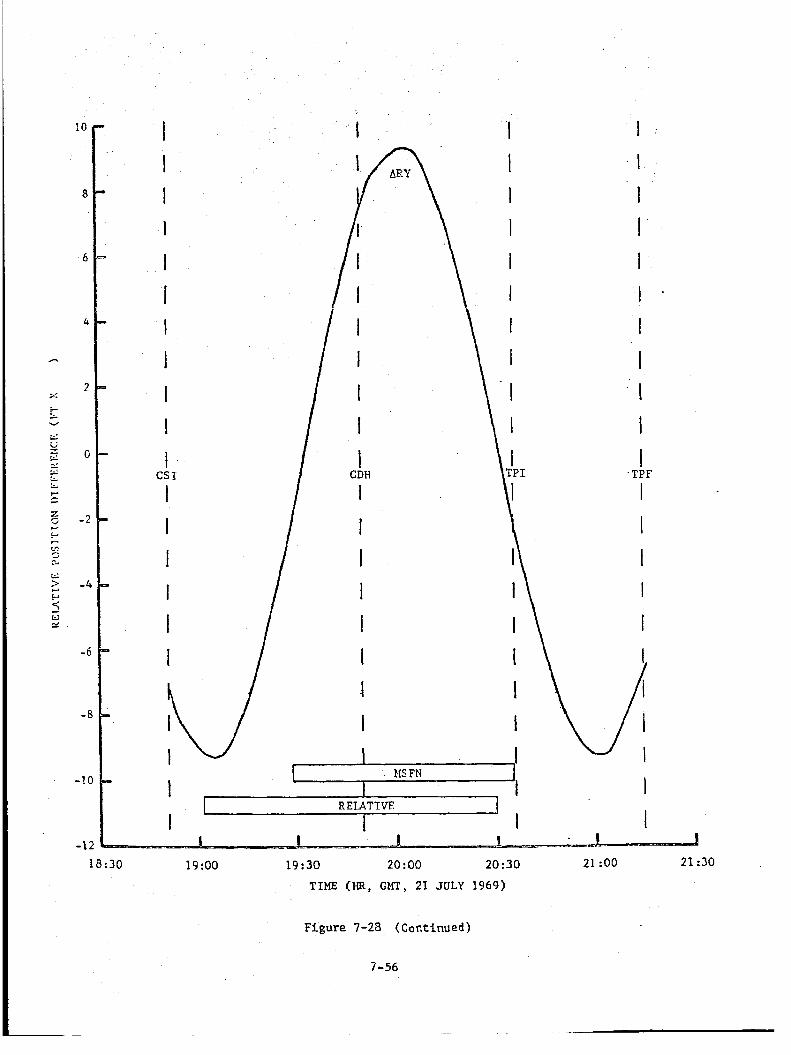
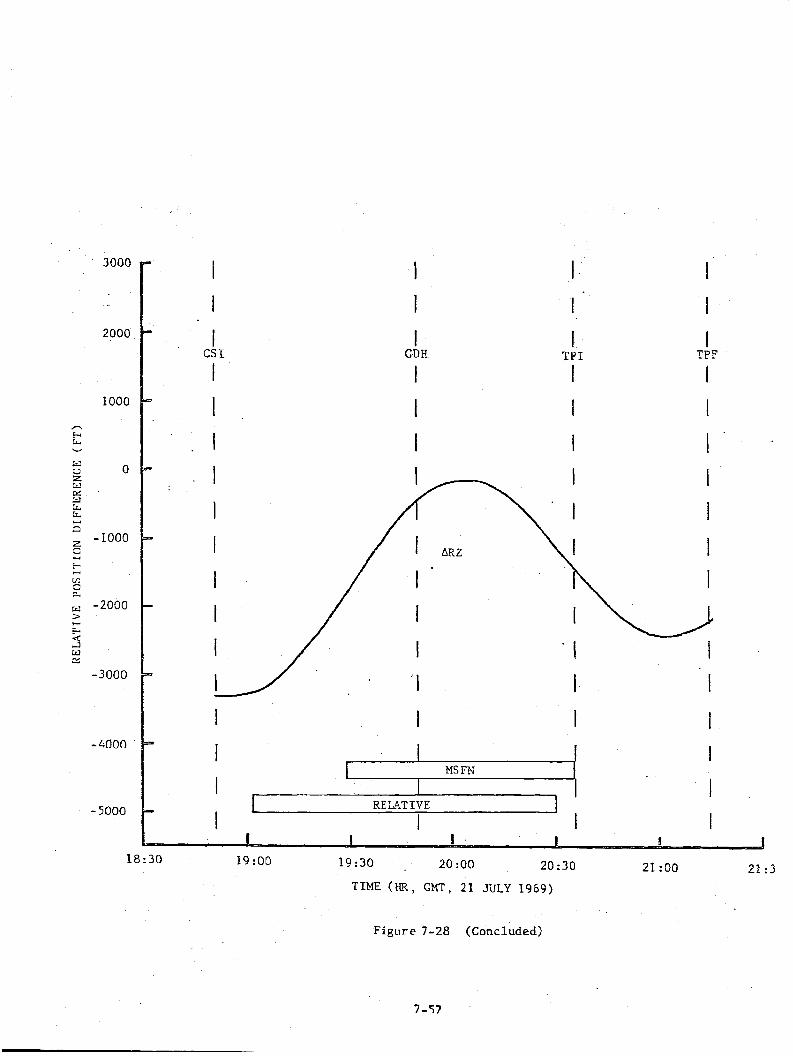
d i f f e rences between out-of-plane pos i t i on components of t r z j e c t o r i e s
der ived from MSFN and from onboard d a t a (Figure 7-28 (ARY)).
The phase d i f f e rences ev ident
The important f e a t u r e t o no te in these f i g u r e s i s t h a t t h e t r a j e c t o r i e s
based on onboard t racking d a t a e l imina te a l a r g e po r t ion of t h e cross-
range error present i n independent E.IsFN f i t s far both vzhicles. It i s a l s o i n t e r e s t i n g t o no te t h a t i n t h e out-of-plane pos i t i on curves shown
in Figures 7-26 and 7-27, t h a t t h e t r a j e c t o r i e s produced from relative data
match across the C S I burn much more c lose ly than the fits produced from
MSFN da ta . While t h i s agreement does depend, t o some extent, on a good
match between t h e CSM t r a j e c t o r i e s , t h e relative d a t a d id produce a m o r e
continuous t r a j ec to ry i n t h e out-of-plane sense from one independent fit
t o another .
Despi te the l a r g e out-of-plane d i f f e r e n c e s , i t can be seen t h a t tra-
jectories produced from onboard t rack ing d a t a are genera l ly c o n s i s t e n t w i t h
MSFN based f i t s , e spec ia l ly i n overlaping d a t a arcs (Figures 7-24 and 7-28).
Therefore , because of b e t t e r c h a r a c t e r i s t i c s i n the r e l a t i v e ' sense , tra-
j e c t o r i e s produced from relative t r ack ing d a t a are more s u i t a b l e f o r d e t a i l e d
rendezvous analysis purposes.
7-50
L 0 0
i;
0
o\ c I+
C
cc - . I .. c
0
5 0 ri
0 0
u? i
..
a CI
a2 .. i
u 0
‘1:
0
0
.. r(
Fi
C (?
a2 .. i
0
?
ri
14
12
10
a
n r7 0 6 4
x !3 L W
2 4
2
0
-2
- 4 '
- RELATIVE
n I MS FN I
/ 1
/ I
f I
1 /
/ f
f I . (FREE FLIGHT) - M S F N LM TRAJECTORY
--- RELATIVE DATA T R A J E C T O R Y I (FREE F L I G H T ) f
I
28:OO 18:30 19 :00 19 :30 1 7 :30
TIME (HR, GMT, 21 JULY 1969)
Figure 7-26 Out -o f -P lane Component of LM Position Relative t o CSM (Insertion t o CSI->
7-53
c -
0 - 0
0 # /
/
Q s-4
0 Fz
7 - 5 4
1 I
I I 1 1 I I
1 - I I I 1 I I - t I 1 I I I I
i I
TPF
1 MS FN I I
I I . I I RELATIVE I
I I I I
18:30 . 19 :oo 19:30 20:oo 20:30 2 1 :oo 21 :
TIME (HR, G M T , 21 JULY 1969)
Figure 7-28 Differences Between Posttion Components of Relative Trajector ies (CSI to TPF)
19:OO 19 : 30 20:oo 20:30 21 :oo 2 1 :30
TIME (HR, G M T , 2 1 JULY 1969)
Figure 7-28 (Continued)
7 -56
3000
2000
1000
A
E- '& v
0 Ga 0 z kl & 3 2 w 3
-1000 z u 3
b t-l VI
E w -2000 > F 4 -3 Lil ,u
b-
-3000
- ~ 0 0 0
- 5000
I 1 1 . I I I I I
I I I I I I I 1 I I
1 I I I .
TPF I
T P I I
CD H cs I
1 I I I
1 I
MS FN I I I I I I - I I
L RELATIVE
I I I 4 I
20:30 21 :oo 21 : 3 19 :oo 19:30 . 20 :oo 18:30
TIME (HR, GMT, 21 JULY 1969)
F i g u r e 7-28 (Concluded)
0 ?. 4 N
0 F! l-l N
0 m 0 N
0
0 N
F!
0 c?
o\ 4
..
0
rn 4
0
0 m
t% --PI -
H c -
- T H
-fi - w
X -0 -
V
H cn- u
-
m U cv 0 I N
I
7-58
0 ?. ri N
0 0 .. i N
c 0 -1
2
0 0
0 cv ..
0 r l
0' .. i
0 0
Q\ .. 3
0 W
C' .. c
0
co 0 d
7 - 5 9
- - -
I d I a 9 N
I I 9 cu 4 UI aD
I I I
7 -60
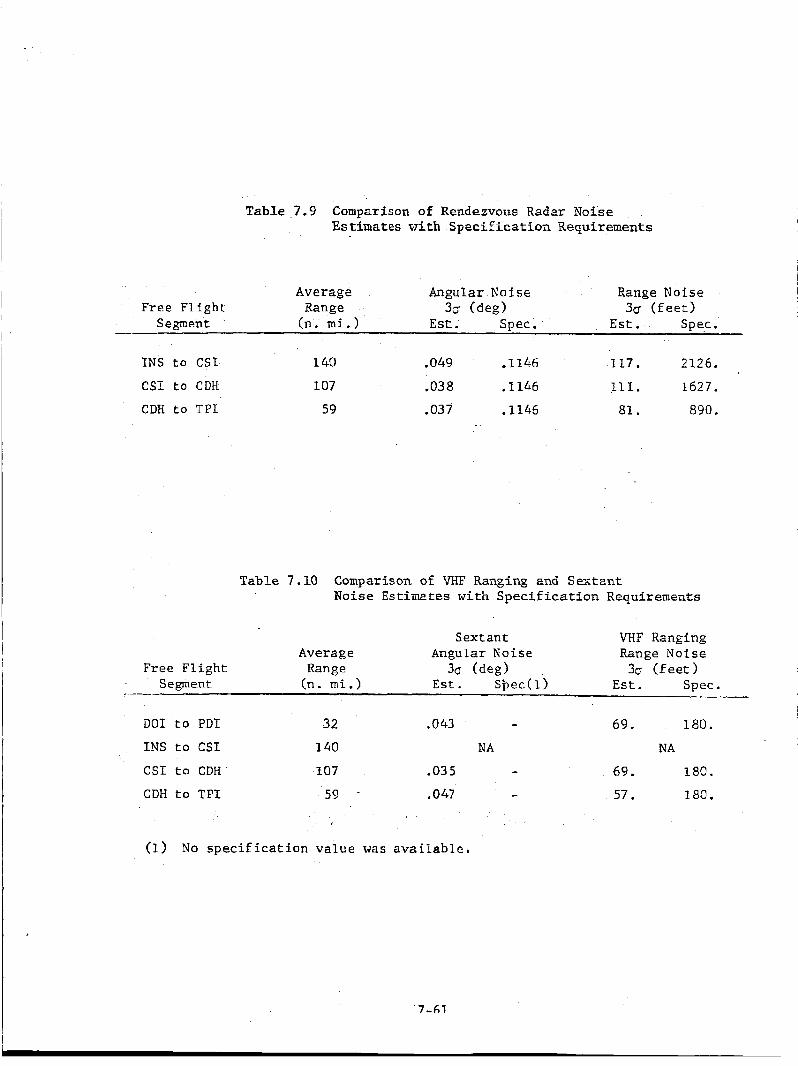
Table 7.9 Comparison of Rendezvous Radar Noise Estimates with Specification Requirements
Average Angular Noise Range Noise Free Flight R a n g e 35 (deg) 30 (feet)
Segment (n . m i . ) E s t . Spec. E s t . S p e c . --
INS t o CSI
CSI t o CDH
140
107
.049 .I146 117. 2126.
,038 .I146 111. 1627.
CDH t o T P I 59 .037 .1146 81. 890.
Tzble 7.10 Comparison of VHF Ranging and Sextant Noise Estimates with Speci f ica t ion Requirernents
Sextant VHF Ranging Average Angular Noise Range NoJLse
Free Flight Rang e 30 (deg ) 3c ( f e e t ) - Segment (n. m i . ) Est. S b e c ( l > E s t . Spec.
~ --
DO1 t o PDI
INS t o CSI CSI to CDH
CDH t o TPI
32 ,043 - 140 NA
107 .03 5 L
59 - ,047 -
69. 180.
NA
69. 180.
57. 180.
(1) No s p e c i f i c a t i o n value was available.
7-61
Speci f ica t ion Comparisons
Table 7.9 compares the 3a values of noise estimated from the redemous
radar residuals with s p e c i f i c a t i o n requirements.
estimates were a l l well w i th in s p e c i f i c a t i o n limits.
the sex tan t and trtr_F ranging d a t a zre l i s t e d i n Table 7-10. Although no
spec i f i ca t ion value was found for t h e sex tan t , t h e va lues obtained (RSS
of individual angle n o i s e estimates) were all within acceptab le l i m i t s .
The VHF ranging noise estimates d s o C O ~ F Z ~ ~ well with spec i f i ca t ions .
Conclusions
It can be seen that t h e
Noise estimates f o r
The following conclusions w e r e drawn f r o m t h e zna lys i s .
1. The onboard d a t a was general ly of good qua l i ty . datz, examined for the first time, appesred t o b e es accurate as the rendezvous radar angular measureinenrs.
The sex tan t
2. Estimates of d a t a random noise were a l l w i t h i 2 s p e c i f i c a t i o n and expected va lues .
3. Tra jec to r i e s produced from onbaard tracking data proved t o be genera l ly cons i s t en t with t h o s e produced from HSFN data . L t was found that a method used i n the past t o demonstrate t r a j e c t o r y consis tency was inadequate. On Apollo 10, tra- j e c t o r i e s w e r e compared only a t s e l e c t e d t i m e s . Because of t he s i g n i f i c a n t l y l a r g e phase d i f f e rences found to be present i n r e l a t i v e t r a j e c t o r i e s , t he values for out -o f - plane p o s i t i o n d i f fe rences obtained a t s e l e c t e d t i m e s may b e misleading. The out-of-plane p o s i t i o n conponents must be p l o t t e d as a funct ion o f t i m e i n order t o see t h e t o t a l d i f fe rences i n t h e t r a j e c t o r i e s .
7 -62
7.4 W % I N G DATA AhULYSIS
The laEding r ada r data ana lys i s cons is ted of genera t ing and evaluat-
ing landing r ada r r e s i d u a l s (difference between observed measurement and
computed mezsurement) and mapping of t h e l u n a r su r face p r o f i l e and ground-
t r a c k wi th t h e s l a n t range measurement.
The landing r ada r data were obtained by processing the downlink
telen,etry d a t a wi th a s p e c i a l purpose computer program which outputs
onboard observations on punched cards i n a HOPE-compatible forinat.
The HOPE Program was used t o compute simulated landing radar abserv-
ables from se l ec t ed LM t r a j e c t o r i e s and from auxiliary information such as REFSMAT, gimbal angles , and radar opera t ing inode. The LV t r a j e c t o r i e s
w e r e generated by t h e HOPE Progran u t i l i z i n g te lemetered acce le ra t ion
d a t a i n the IGS burn opt ion t o model t h e descent burn.
then formed by sub t r ac t ing the coinputed f rom t h e a c t u s 1 observable value.
Paragraph 7.4.2 presents statistics and s e l e c t e d p l o t s of r e s idua l s
obtained from var ious T.21 state vec tors .
Residuals were
Terrain mapping da ta w e r e obtained from a s m a l l , special pupose
computer program designed t o compute terrain a l t i t u d e above a mean luna r
r ad ius 2s a func t lon of l a t i t u d e and longitude. The r e s u l t s of rn z t t e p t
t o c o r r e l a t e t h i s t e r r a i n da ta wi th lunar contour maps are presented Lxi
Paragrqh 7 . 4 . 3 .
7.4.1 Descent T ra j ec to r i e s
Six d i f f e r e n t descent t r a j e c t o r i e s were examined i n the landing rzdzr
data ana lys i s .
(a)
The o r i g i n s o f t hese t r a j e c t o r i e s are summzrized as follows:
RTCC - This v e c t o r was obtained i n t h e RTCC i n real time.
(b) MSFN (LS) - This vector was obtained f r o m an I G S f i t using l o w speed MSFN da ta obtained from a c q u i s i t i o n of s i g n a l t c LM touchdown (revolut ion 1 4 ) . The doppler d a t a were conpact- ed t o tqio observations p e r minute.
( c ) Onboard - This vec tor vas obtained from a free f l i g h t f i t using CSM sex tan t and VHI: ranging observat ions. The tech- nique required f ix ing the CSM t r a j e c t o r y as a re ference and updating t h e LN s ta te from onboard observat ions and t h e CSK re ference t r a j ec to ry .
(d) BET f 3 - The MSFN state vector descr ibed i n item (b) above, was used a s t h e b a s i s for t h i s t r e j e c t o r y . The BET #3 w a s obtained by cor rec t ing the- l.ISFBT low speed state wi th a linear e r r o r ana lys i s pmgram s o t h a t t h e r e s u l t a n t povered descent t r a j e c f o r y would impact a des i r ed landing site with a r e l a t i v e v e l o c i t y of zero. as re ference were the MPB photographic estimate.
Lear - High speed NSFI? ckta (ten s a n p l e s p e r second) obtained over a 232 second da ta arc j u s t p r i o r t o PDI were fit by the Lear Powered F l i g h t Processor producing this state vector .
The landing coordinates used
( e )
(f) Onboard/MSE" (H-S) - This t r a j e c t o r y was obtained wi th the HOPE Program and used high speed MSFN doppler d a t a which had been compacted t o 30 observat ionslminute and from CSFI sextant: and VHF ranging da ta us ing t h e HOPE orbit de temina - t i o n program. burn option. vec tor included position and v e l o c i t y a t epoch (which was p r i o r to P D I ) , ai-d Y platform mlsaligninent. The t racking da ta i n t e r v a l t7as f r o a DO1 t o LEI touchdam. Figure 7-2 shows t h e t racking data t imel ine.
The descent burn was modeled by t h e HOPE IGS Tie HOPE weighted leas t squares solution
In order to gauge the q u a l i t y of the landing r ada r data , i t was
necessary to determine t h a t the above t r a j e c t o r i e s d i d accura te ly rep-
resent the actual descent t r a j ec to ry .
l a r g e l y on t h e landing poin t condi t ions obtained f rom each t ra jec torv ' .
These landing sites obtained from each t r a j e c t o r y are summarized graphica l ly
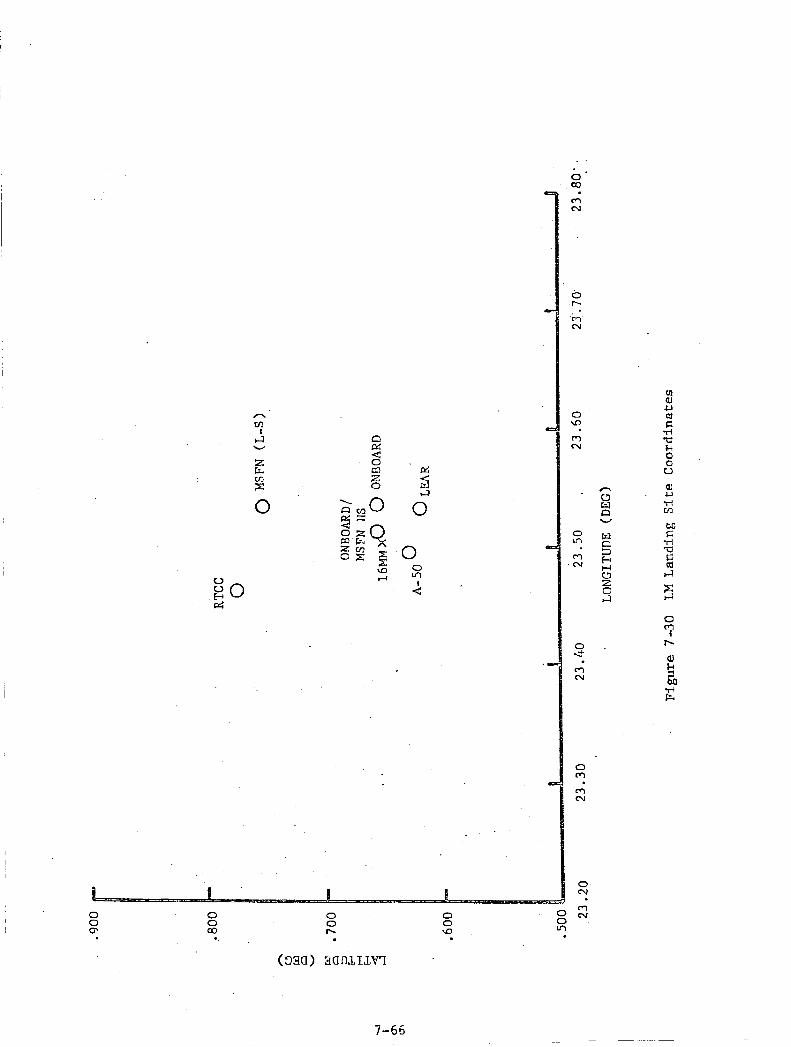
i n Figure 7-30.
estinates are very close t o t h e 16mm photographic estimate (accepted as
t h e b e s t es t imate) .
This q u a l i t y judgeinent vas based
Note t h a t both t h e BET #3 and the OrLboardhlSFN H-S
Since the data type being examined is a v e l o c i t y measurement, i t is
nost dimportant t h a t the re ference t r a j e c t o r y be v i r t u a l l y f r e e of v e l o c i t y
errors i n the data arc,
v e l o c i t y e r r o r a t landing where the BET #3 was cons t ruc ted i n such a manner that t h e v e l o c i t i e s are zero a t landing, as the bas ic re ference upon which t o b a s e the analysis of landing radar
v e l o c i t y res idua ls .
The onboard/NSFN H-S t r a j e c t o r y conta ins a Iarge
Therefore , t h e BET #3 was chosen
7.4.2 Landing Radar Veloci ty Residuals
Table 7.12 lists t h e v e l o c i t y r e s i d u a l statistics obtained from a l l Note the small mean va lues
In t h e absence of a
the t r a j e c t o r i e s considered i n the analysis;
obtained from t he re ference t r a j e c t o r y (BET C3).
real s tandard of comparison, t he mean va lues obtained from BET #3 were reasonably s m a l l . Standard deviat ions i n d i c a t e t h a t 77 and V are
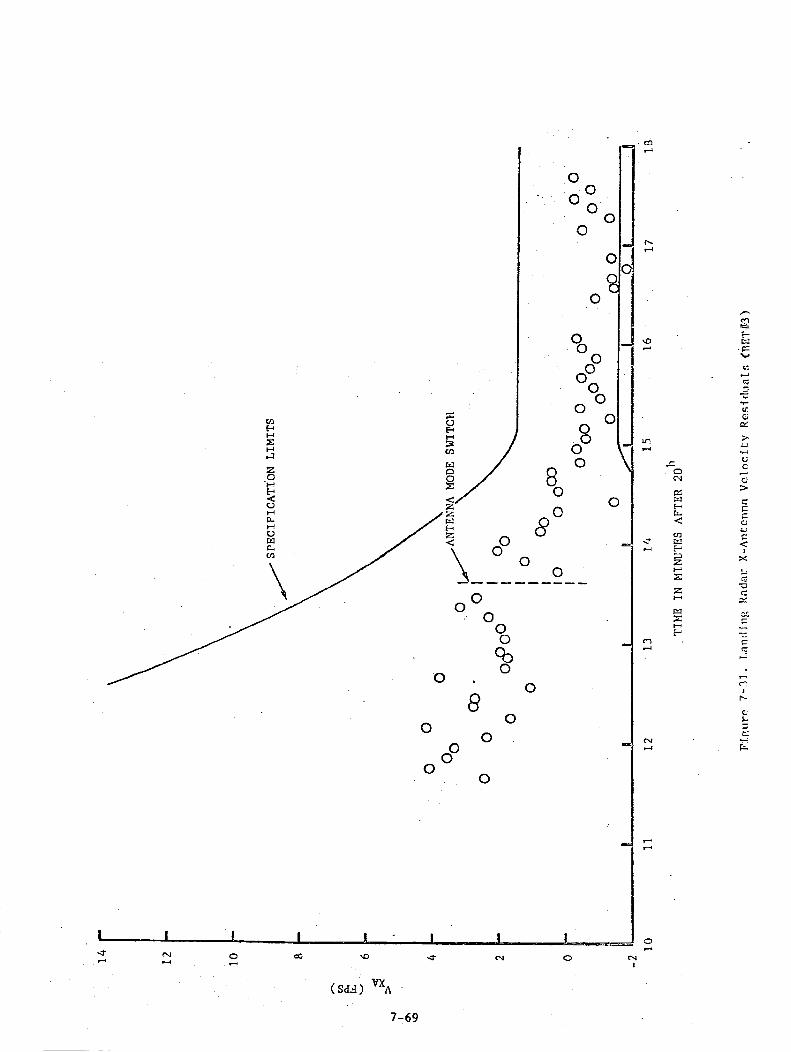
somewhat more errat ic than V reasonably good quality as shown by Figures 7-31 through 7-33.
f i g u r e s show t h e BET #3 v e l o c i t y res idua ls p l o t t e d ve r sus time.
addi t ion , s p e c i f i c a t i o n l i m i t s have been p lo t t ed . Note t h a t . a f e w po in t s f a l l ou t s ide spec i f i ca t ion .
YA ZA However, these va lues are s t i l l of X I -
These
I n
It is d i f f i c u l t t o i s o l a t e measurement e r r o r s from t r a j e c t o r y e r r o r s
i n this p a r t i c u l a r case. The descent t r a j e c t o r y is a p a r t i c u l a r l y di f -
f i c u l t one t o recons t ruc t , and the landing radar v e l o c i t y d a t a are par-
t i c u l a r l y s e n s i t i v e t o t r a j e c t o r y e r ro r s . Notice that t h e v e l o c i t y
r e s i d u a l s i n Figures 7-31 through 7-33 tend toward zero a t landing where
the BET #3 v e l o c i t i e s w e r e constrained to zero.
j e c t o r y obtained from t h e Onboard/MSFN H-S f i t i s known t o conta in v e l o c i t y
e r r o r s a t landing. The r e s u l t a n t t o t a l v e l o c i t y at landing as 8.02 f p s ,
wi th t h e p r i m a r y con t r ibu t ion i n the 2 d i r e c t i o n (North).
I n con t r a s t , the tra-
The r e s i d u a l
s tatist ics show a mean valve f o r V roughly North, the large mean value r e f l e c t s t h e -7.96 f p s i n t h e Z com-
ponent of v e l o c i t y a t landing. The r e s i d u a l s obtained from t h e Onboard/
MSE" H-S f i t are p l o t t e d i n Figures 7-34 through 7-36.
of 6.966 fps. Since V,,was d i r e c t e d YA
The r e s i d u a l s t a t i s t i c s l i s t e d i n Table 7.12 also i n d i c a t e t h a t the .
b e s t t r a j e c t o r i e s do produce the bes t landing r ada r v e l o c i t y r e s i d u a l
s t a t i s t i c s , t h a t is, t h e BET #3 and t h e OnboardjMSFN H-S t r a j e c t o r i e s
produce t h e smallest r e s i d u a l inean values . This f a c t , toge ther wi th t h e
s e n s i t i v i t y which the d a t a has exhib i ted t o t r a j e c t o r y v e l o c i t i e s i n d i c a t e
t h a t descent t r a j e c t o r y recons t ruc t ion activities w i l l be aided consider-
ably by t h e landing radar v e l o c i t y da ta . *
* Subsequent recons t ruc t ions using landing radar d a t a have produced a a t r a j e c t o r y landing a t acceptab le coordinates ( tar . = .649 deg, Long. = 23.490 deg) with a t o t a l r e l a t i v e ve loc i ty of .96 f p s . A r e p o r t of this r econs t ruc t ion w i l l be forthcoming under a s e p a r a t e cover.
0
e
0 0 h
0 0 UI
0’ a3 rl cv
0 fi
P> N
0 \D
m N
0 L n
m cv
0 4
m hl
0
? m N
0 hl
r? N
rl Q k 0 0 u aJ u rl m oc c
rl Q
7-66
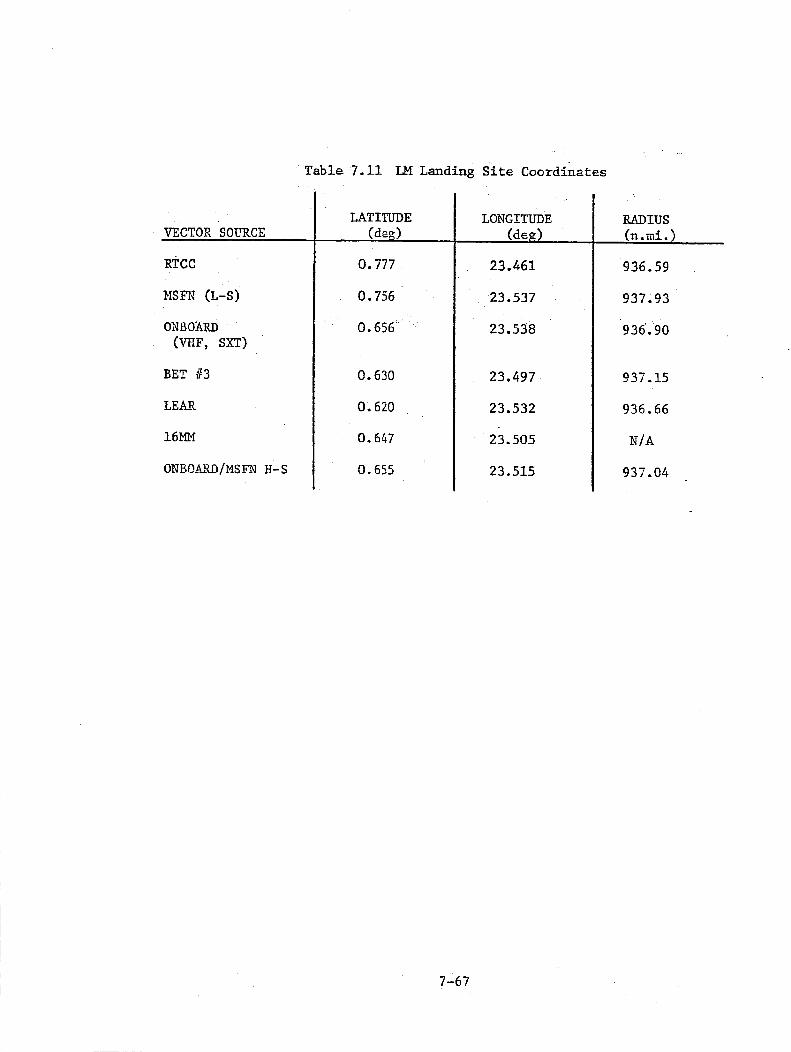
Table 7.11 LM Landing S i t e Coordinates
VECTOR SOURCE
RTCC
MSm' (L-S)
OhqO&U) (VRF, S X T )
BET #3
LEAR
16MM
ONB0_4RD/MS FN H- S
0.777
0.756
0.656.'
0.630
0.620
0.647
0.655
LONGITUDE (ded
23.461
23.537
23.538
23.497
23.532
23.505
23.515
RADIUS (n.mi.)
936.59
937.93
936.90
937.15
936.66
N/A
937.04
7-67
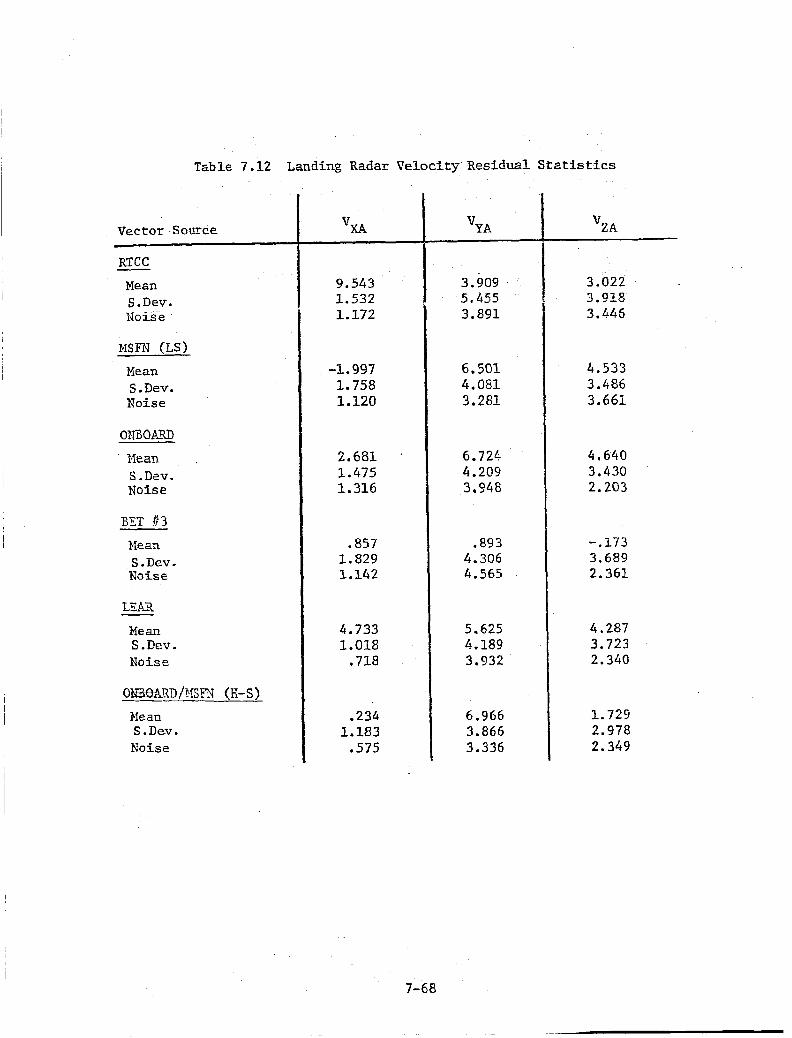
Table 7.12 Landing Radar Velocity Residual Statist ics
Vector Source
RTCC - Mean S.Dev. Noise
MSFN (LS)
Mean S . Dev. Xoise
ONBOARD
. Nean S.Dev. Nois e
EET 53 Nean S . D e v . Noise
LEAR Me an S .Dev. Nois n,
Ok€B€MU/IfSF?T (K-S)
Mean S .Dev. Nofse
vxA - ~~
9 . 5 4 3 1.532 1.172
-1.997 1.758 1.120
2.681 '
1.475 1.316
.857 1.829 1.142
4.733 1.018 .718
.234 1.183
.575
3.909 5 . 4 5 5 3.891
6.501 4.081 3.281
6 . 7 2 4 4.209 3.948
.a93 4.306 4.565
5.625 4.189 3 .932
6 .966 3.866 3 .336
3 .022 3 .918 3.44s
4.533 3.486 3 . 6 6 1
4.640 3 . 4 3 0 2.203
-.I73 3.689 2 .361
4.287 3 . 7 2 3 2 .340
1.729
2 . 3 4 9 2 .978
7-68
0 .
0 . oo
OC 0
c (
0
0
C
0
c
7-69
0
r
8
3
0 c)
0 0 r-l
0 r -4
I
n
n -4
U E
* - 7 -
N m I b .
(Sad) "A
7-70
0 I
0’)
0 0.
0
O O 0
O* 0
0
8 0
0 0
0 0
O O
C
1 r
r
f
0
0
0
0
0
0 0
0
0
go 0
83 0
0
0
m N V-I 0 d N r-l I I I
0
0
0 .
0
O 0 0 8 . 8. * O * O
0 3 0 O
0 0
O O
0
0 O O 0
0 0 0
h
0 a”
0 0
0
0 0
0
0 0 ,o
0
0
0
]L I I t 0 c\I
\o CJ m y‘ 0 w 4 m-l s m N
I i
0
0
0
0
OO 0 0
0
0 0
0 0 0
I I
(sail) vz*
7-7 4
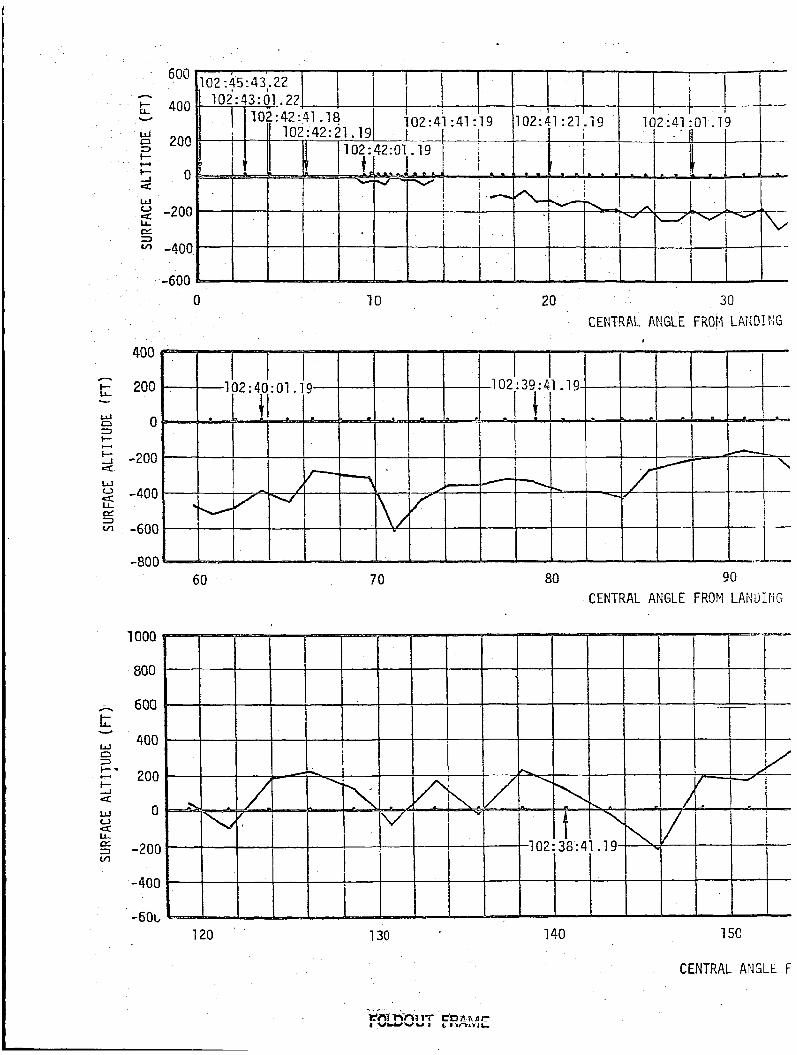
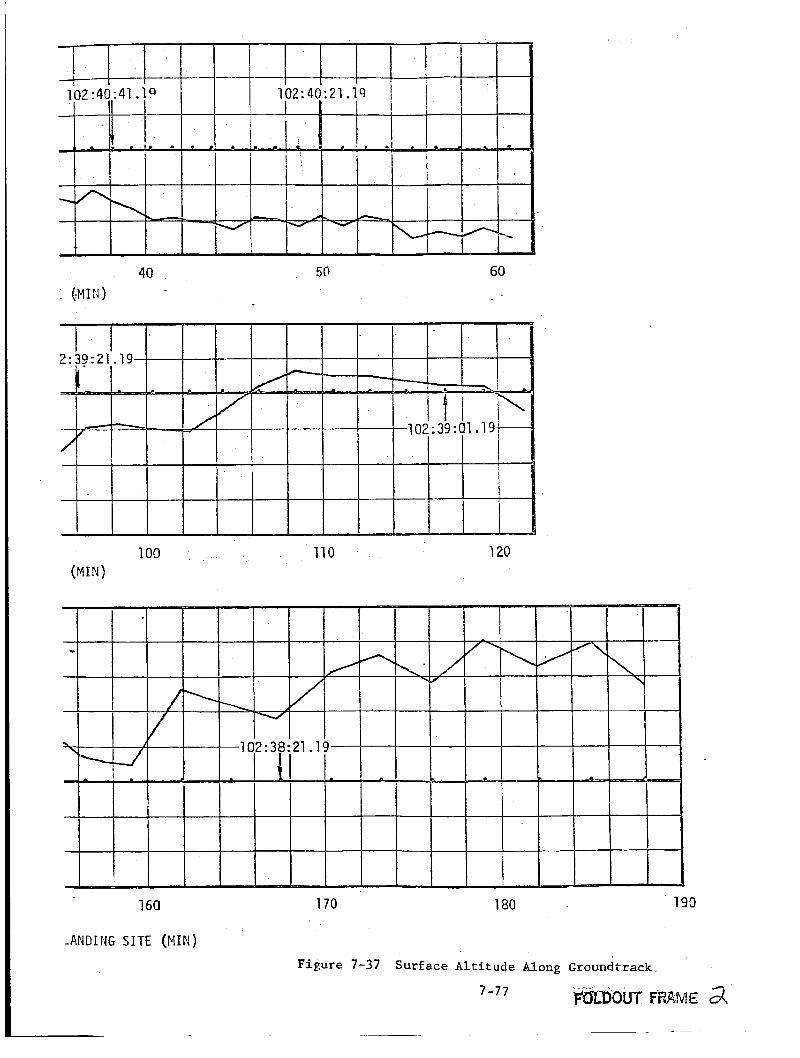
. 7.4.3 Lunar Surface Al t r tude Alonp Groundtrack
Landing Radar range r e s idua l s are used to.compute an estimate or' t h e
re la t ive a l t i t u d e of t h e sur face along t h e groundtrack of t h e p ie rcepoin t .
Surface a l t i t u d e re la t ive t o t h e landing s i te is p l o t t e d versus
angular range i n Figure 7-37.
r e d times (2-second in t e rva l s ) .
T i m e t i c k s ' a r e ind ica t ed at the LR range
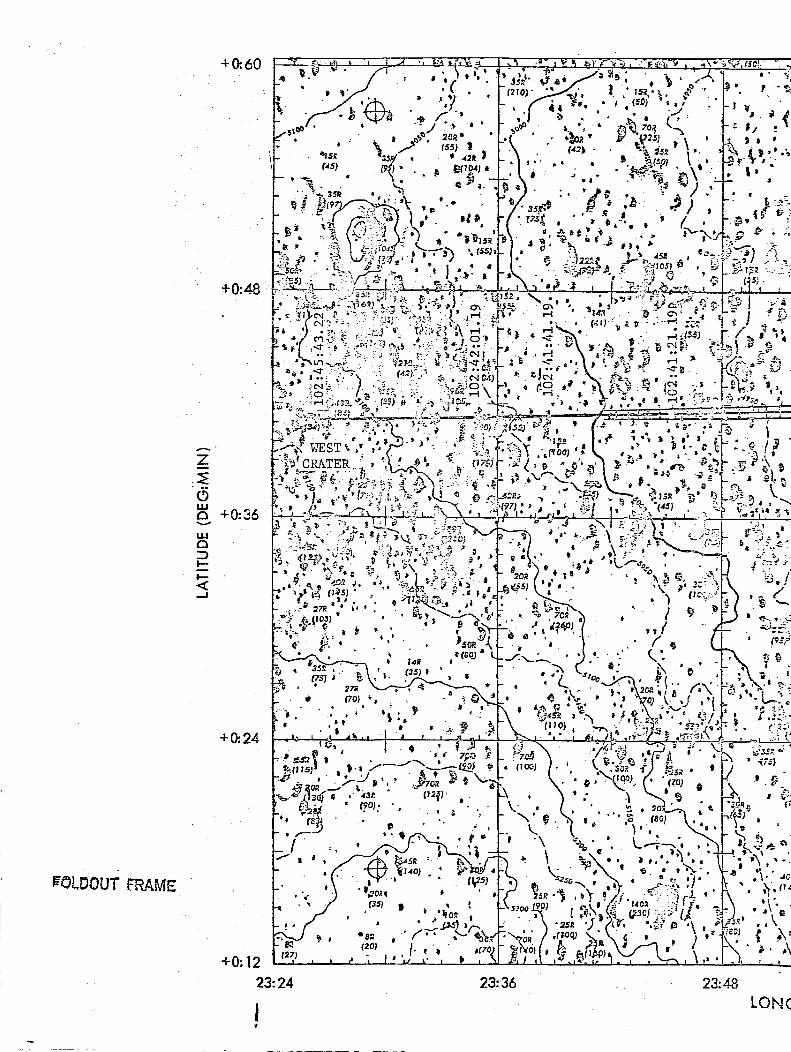
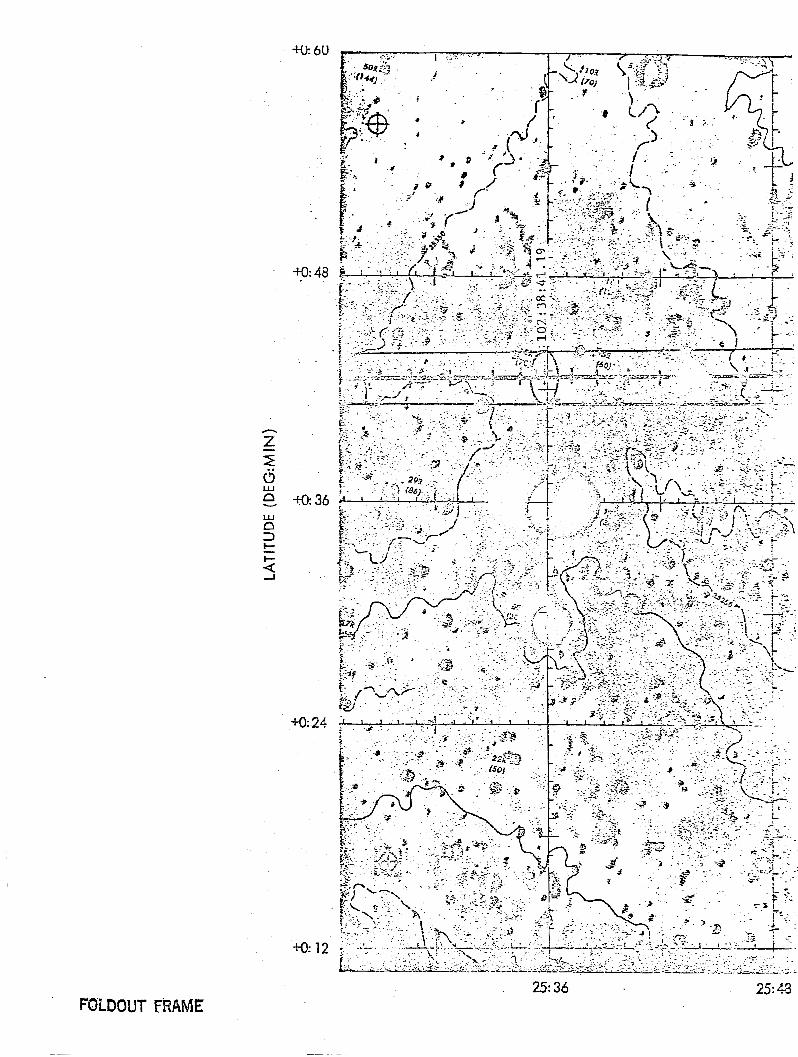
The ground track of the range beam p ie rcepo in t i s shown i n Figure
7-38.
lOO,OOO)*.
T r s n q u i l i t y Base coordinates .
correspond t o those on t h e surface a l t i t u d e p l o t .
bean on the s u r f a c e is indicated by t h e snall ellipses drawn pe r iod ice l ly
a long t h e groundtrack.
The p l o t is made on Lumr Maps 0P.B-Ii-6 and ORB-1-3 (scale I:
The l a t i t u d e does n o t a g r e e with p o s t f l i g h t estimates of
Time t i c k s are a t LR range read t-es and
The s i z e of t h e raxe
Litcle quan t i t a t ive information caa be obtained from Figure 7-33.1 except to n o t e t h a t t h e gen t l e upward s lope of the terrain on t h e approzch
to t h e landing s i t e i s i n general agxeement wi th t h e su r face a l t i t u d e
p l o t .
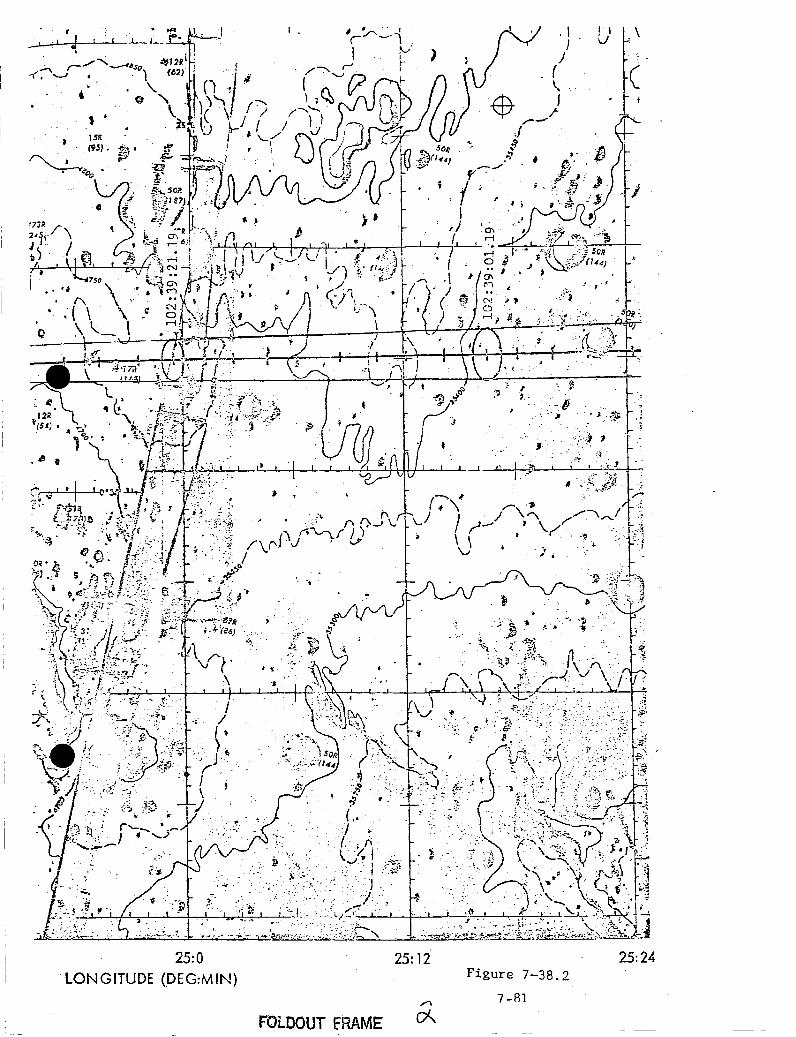
On Figure 7-38.2, sur face a l t i t u d e v a r i a t i o n s can b e co r re l a t ed t o
several prominent f ea tu re s :
The 170 f t drop i n a l t i t u d e between the readings a t 102:39:37.19 and 102 :39 :39.19 correspond t o range beam c e n t e r s a t t h e top and bottom of a c l i f f .
T h e po in t a t 102:39:51.19 is centered in a f a i r l y lar, =e crater. A depression of approximately 300 f t is clearly ou t l ined i n t h e su r face a l t i t u d e p lo t .
* Nap legend: Contour l i nes (a t 50 meter intervals) zre indexed by an e s t t m t e of the radius in meters wi th t h e f i r s t three d i g i t s omitted. Crater markings such as 45R (110) i n d i c a t e - Height of rim above terrain = 45 meters, Crater depth (floor t o rim) = 110 meters.
7-75
The po in t at 102:39:23.19 f a l l s inside a crater, and a depres- s ion of approximately 200 ft i s indicated.
As the range bean intersection grows in s i z e with increasing LM a l t i t u d e , su r f ace details become tncreas ingly difficult t o resolve. The overall downward terrain slope along t h e ground- t r a c k i n Figure 7-38.3 is i n general agreement wi th t h e su r face a l t i t u d e p l o t .
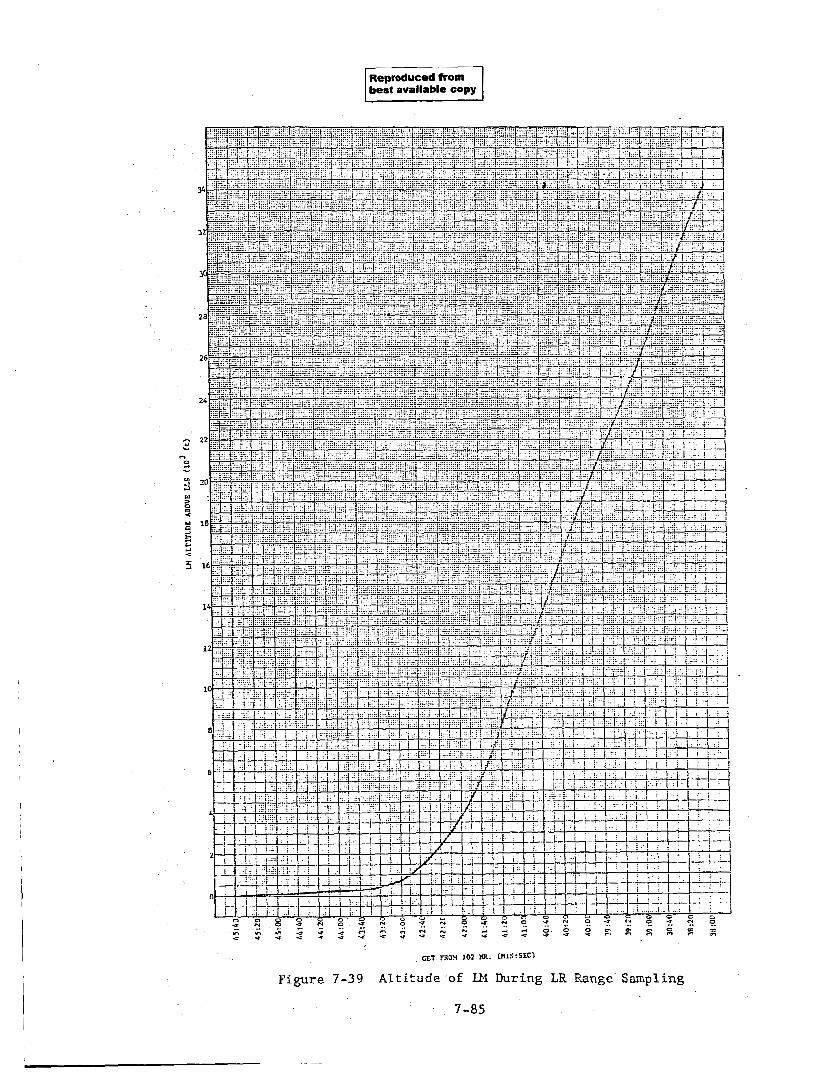
The a l t l t u d e of the LLN above tnc’ LLS radius during LR range data coverage is shown i n Figure 7-39.
The data presented i n t h i s s e c t i o n results from a HOPE program o r b i t
determination which includes LR v e l o c i t y i n the DC f i t .
only r e c e n t l y become a v a i l a b l e and t h e r e s u l t s presen:ed here are amoog
t he f i r s t obtained using Apollo I1 data. The p r i n c i p a l e f f e c t of in- c luding LR velocity in the fit is t o produce a more accu ra t e relative
v e l o c i t y p ro f i l e .
of the descent t r a j e c t o r y , show u n r e a l i s t i c t e r r a i n slopes due t o small
inplane velocity errors.
This opt ion has
Surface a l t i t u d e p l o t s , der ived from ezr l i er versions
7-76
600
400
200 t; 2 0
-200 iz * -400
-600
- U
w 3
I-
4
W
@= =l
0 IO 20 30 CENTRAL ANGLE FROM LA!iDIllG
1
400
200
0
-200
-400
-600
-800 60 70 80 90
CENTRAL ANGLE FROM LP.i.!UIHCi
I000
800
600
400 w 3 w- n - 200 5 w 0
2 3 -200
-400
-60~
4
u
a I n
120 130 140 150
CENTRAL ANGLE F
40 (-MIN)
5@ 60
100 ( M I N )
110 120
160
-ANDING SITE (MIN)
170 180 190
Figure 7-37 Surface A l t i t u d e Along Groundtrack - , I .-.
7-77 FCiL$DUT F’RAME 2
h
Z - :r 6 W CI W
+a60
+0:48
+036
+a24
+o: 12 2
!
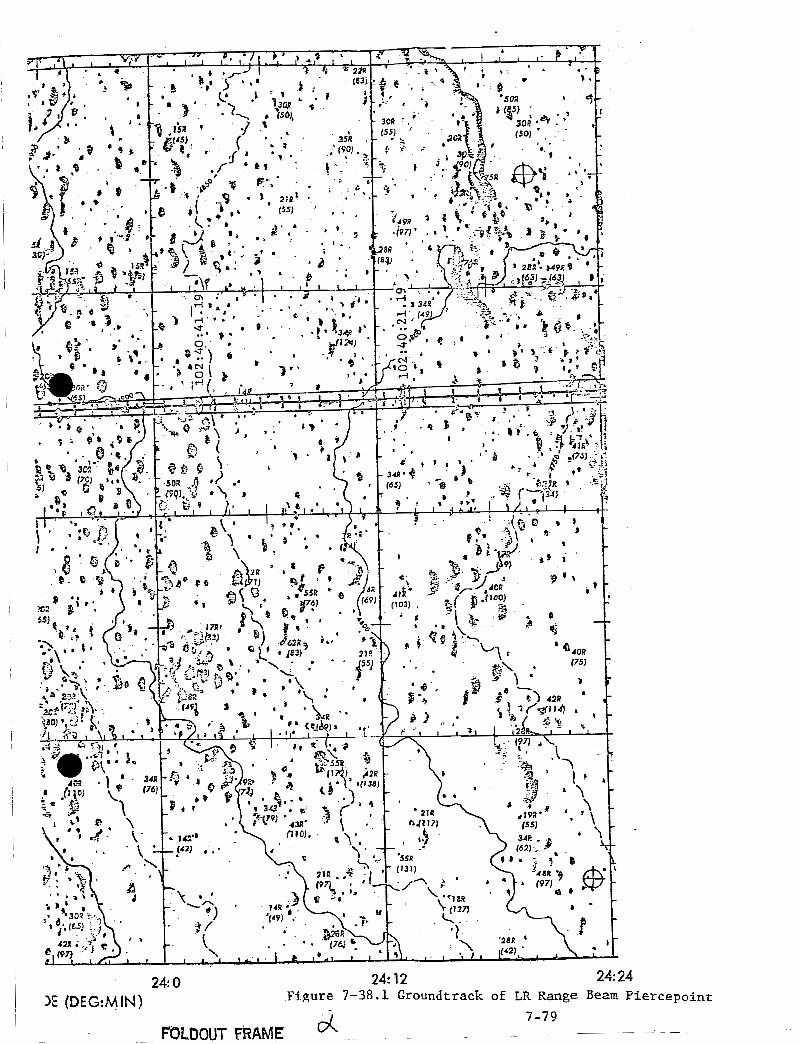
2 4 0 24: 12 24: 24 Figure 7-38.1 Groundtrack of LR Range Beam Piercepoint )E (DEG:MIN)
FOLDOUT @AME o( 7-79

+o:
+ U: 6U
+048
+ 0:36
+a24
2 24: 36 24: 48
-to: 48
-to: 24
+o: 12
25: 36 25: 43 FOLDOUT FRAME

26: 0 ~ LONGITUDE (GEGMIN)
26: 24 - 26: 12 Figure 7 - 3 8 . 3
7 -83
GET 102 w.. (nr:lrsrc)
F i g u r e 7-39 A l t i t u d e . o f U4 During LR Range Sampling
7-85

Page Intentionally Left Blank
R- 1

Page Intentionally Left Blank
Appenl
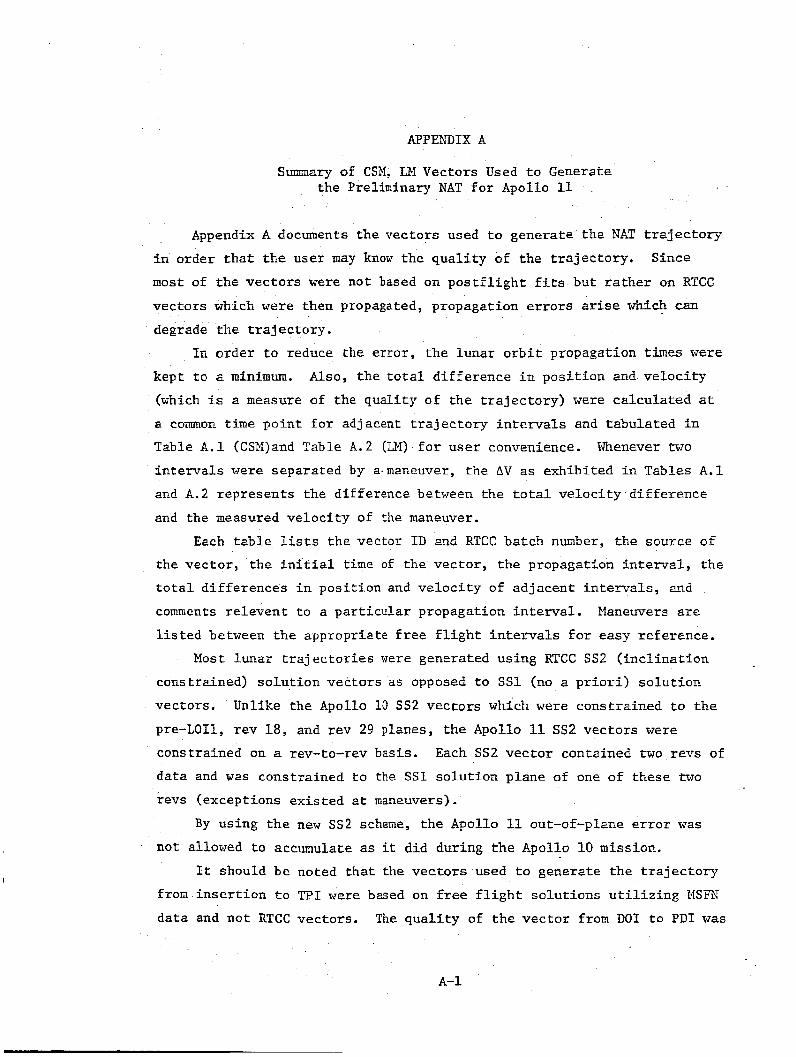
APPENDIX A
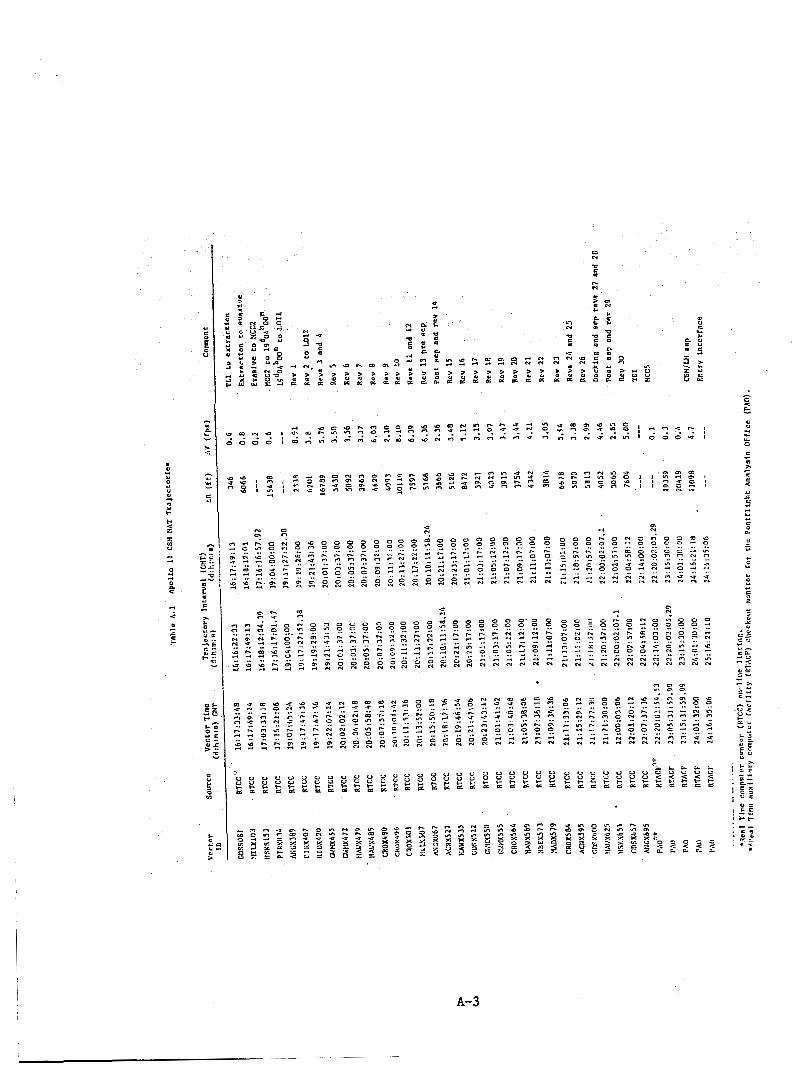
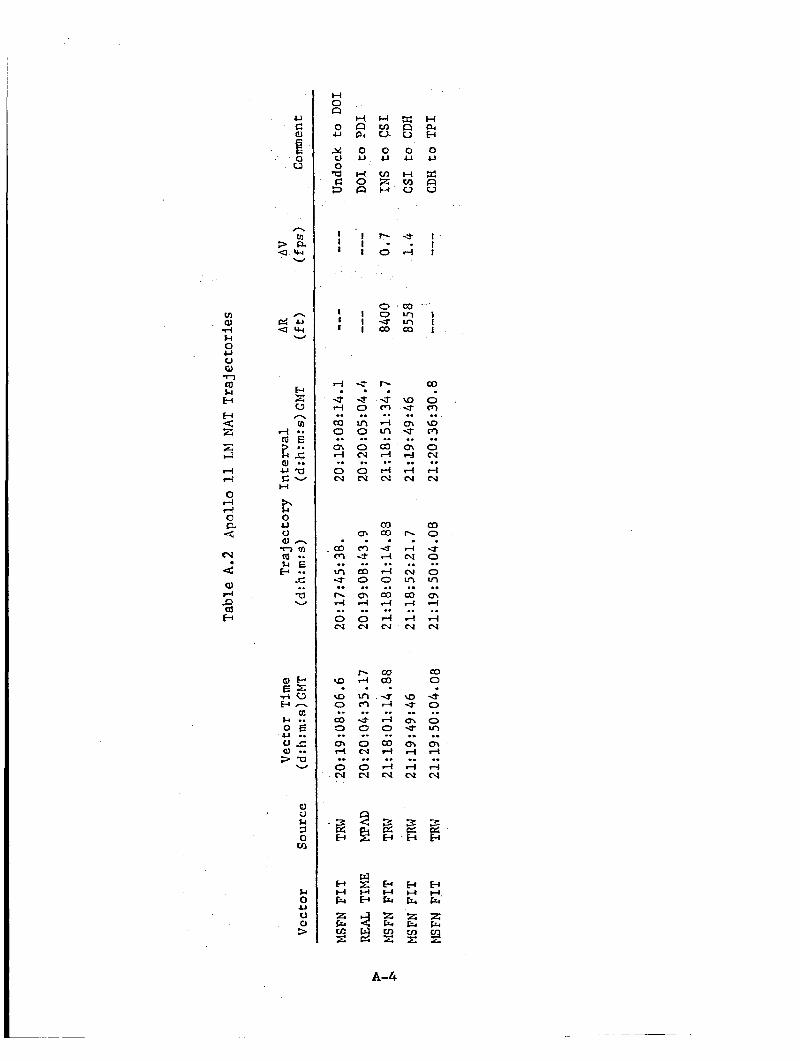
Summary of CSM, Uf Vectors Used to Generate the Preliminary NAT f o r Apollo 11
ix A documents t h e vec tors used t o genera te the N T t r a j e c t o r y
Since i n order t h a t t h e user may know t h e q u a l i t y of the t r a j ec to ry .
most of t h e vec to r s were not based on p o s t f l i g h t f i ts but r a t h e r on RTCC
vec tors which w e r e then propagated, propagation e r r o r s arise which can
degrade t h e t r a j e c t o r y .
In order t o reduce the e r ro r , t h e lunar o r b i t propagation times were
kept t o a minimum.
(which i s a measure of t he qua l i t y of t h e t r a j e c t o r y ) were ca l cu la t ed at
a comon t i m e po in t f o r adjacent t r a j e c t o r y i n t e r v a l s and t abu la t ed fn
Table A . l (CSM)and Table A . 2 (LM) f o r u se r convenience. Whenever two
i n t e r v a l s were separated by a,maneuver, t h e BV as exhib i ted in Tables A . 1
and A . 2 r ep resen t s the d i f fe rence between the t o t a l ve loc i ty d i f f e rence
and the measured v e l o c i t y of the maneuver.
Also, t h e t o t a l d i f f e rence i n pos i t i on and v e l o c i t y
Each t2b le l i s t s t h e vector I D snd RTCC batch number, the source of
the vec to r , t he i n i t i a l t i m e of t he vec tor , t h e propagation iztemal, t h e
t o t a l d i f f e rences i n pos i t i on and v e l o c i t y of ad jacent i n t e r v a l s , and
comments relevent t o a p a r t i c u l a r propagation i n t e r v a l . Maneuvers are
l i s t e d between the appropriete f r e e f l i g h t intervals f o r easy reference.
Most lunar t r a j e c t o r i e s were generated using RTCC SS2 ( i n c l i n a t i o n
constrained) s o l u t i o n vec tors as opposed t o S S l (no a p r i o r i ) s o l u t i o n
vectors .
pre-LOI1, rev 18, and rev 29 planes, t h e Apollo 11 SS2 vectors were
constrained on a rev-to-rev basis . Each S S 2 vector contained two revs of
da ta and w a s constrained t o the SSI s o l u t i o n plane of one of these two
revs (except ions ex i s t ed at maneuvers).
By us ing the new SS2 scheme, t h e Apollo 11 out-of-plane e r r o r was
Unlike t h e Apollo 1 0 SS2 vec tors which were constrained t o t h e
not allowed t o accumulate as it d id during the Apollo 10 mission. It should be noted t h a t the vec to r s used t o genera te t h e t r a j e c t o r y
from i n s e r t i o n t o P I were based on free f l i g h t solutions u t i l i z i n g S.IS5”
d a t a and not RTCC vectors . The q d i t y of t h e vec to r from D O 1 t o PDI w a s
A-I.

questionable, bu t w a s included because no bet te r vector Qras available at
. that .tine. In general, the q u a l i t y of t h e CSM trajectory was better than the
quality of the LM trajectory during the rendezvous period.
A-2
0 N
0 c 9
s c -
n o m , " '7
A-3
I-!
0 a 4
9J
LJ
i 0 U
W
E c n In
e 0 J J c) o l n
P . ? C tl
H 0 a 0 U
5 0 -a fi EJ
I I I
I I I
rl
* rl
02 0 o\ l-l
0 N
..
..
..
c3 m m u- pc 4
0 N
..
..
..
\D
9 0
co 3
m d
0 N
..
..
..
- 2 w
H H Fa z Fr, cl: E
H
2 0 u U 0 f=a
I I I
I I I
5 * 0
Vl 0
0 N
0 N
..
..
..
Q: r-l 4
0
6 rl
.. m .. .. s
I- rl
L n n u- 0
0 N
0 N
..
..
..
2 9
Lil
E 2 2
H Pi t3 0 u X FI U
I I I
I I I
co 0 m \o rn 0 cv d cv
..
.I
..
a3 0 U 0 0 u)
Q\ rl
r( cv
..
..
..
co 0
4. 0
0 In cn d
d CJ
.I
..
..
A-4
APPENDIX B
Supplementary Data
Appendix B conta ins supplementary information wb-ich 2s too d e t a i l e d
This information inc ludes a sunrmary of fo r the main body of the report.
the r ada r da t a used i n each BET f i t segment, a suimary of ground and on-
. board data weights used i n HOPE, a sumnary of t h e USBS s t a t i o n l o c a t i o n s ,
and a summary of the components used i n the R 2 and L1 lunar p o t e n t i a l
models.
Tables 33.1 and B.2 l i s t by v e h i c l e s ta t is t ics conputed from the d a t a
used i n each BET f i t , t h e type and number of observables , and the mean and
s tandard devia t ions obtained f r o m t h e r e s idua l s ca l cu la t ed i n the f i n a l
i t e r a t i o n of t he f i t . The range s ta t is t ics are i n f e e t , doppler u n i t s are
cycles per second, range r a t e u n i t s are i n f e e t pe r second, and angular
units are degrees .
Table B . 3 l i s t s the d a t a weights used i n t h e HOPE Prograq f o r ground
based radar d a t a and Table B.4 l i s t s t h e da t a weights used i n t h e HOPE Program for onboard d a t a by t y p e of observable.
Table B.5 l ists the terms of t h e R 2 lunar p o t e n t i a l model.
Table B . 6 l ists the terms of t h e Langley 1 l una r p o t e n t i a l mode, a
modi f ica t ion of the R2 model. Table B.7 l is ts t h e S-band tracking s ta t ior rs and t h e i r l oca t ions as
used i n t h e Apo l lo 11 p o s t f l i g h t ana lys i s . A l l l oca t ions are referenced
to t h e F ischer E l l ip so id o f 1960. The mean s u r f a c e r e f r a c t i v i t y numbers
for ezch s t a t i o n f o r t h e month of July are a l s o l i s t e d .
B- 1
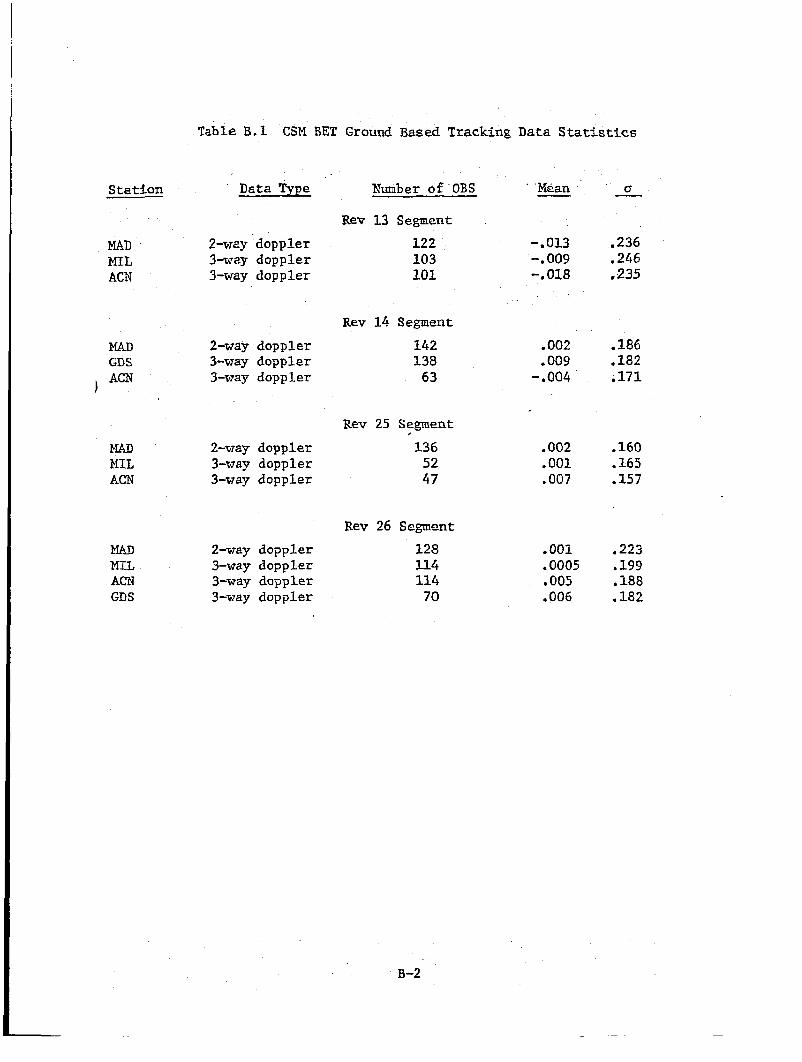
Station
MAD MIL ACN
MAD GDS , ACN
MAD MIL ACN
MAD MIL ACii GDS
Table B. 1 GSM BET Ground Based Tracking Data Statistics
Data Type
2-my doppler 3-way doppler 3-way doppler
2-way doppler 3-way doppler 3-way doppler
2-way doppler 3-way doppler 3-way doppler
2-way doppler 3-way doppler 3-way doppler 3-way doppler
Number of'OBS
Rev 13 Segment 122 103 101
Rev 14 Segment
142 138 63
Rev 25 Segment 136 52 47
Rev 26 Segment 128 114 114 70
' 'Hean I__
-.013 -. 009 -. 018
.002
.009 - -004
.002
.om
.007
.001
.0005
.005
.006
' 0 -
,236 .246 ,235
.186
.171
.1a2
.160
.165
.157
.223 ,199 ,188 .182
B-2
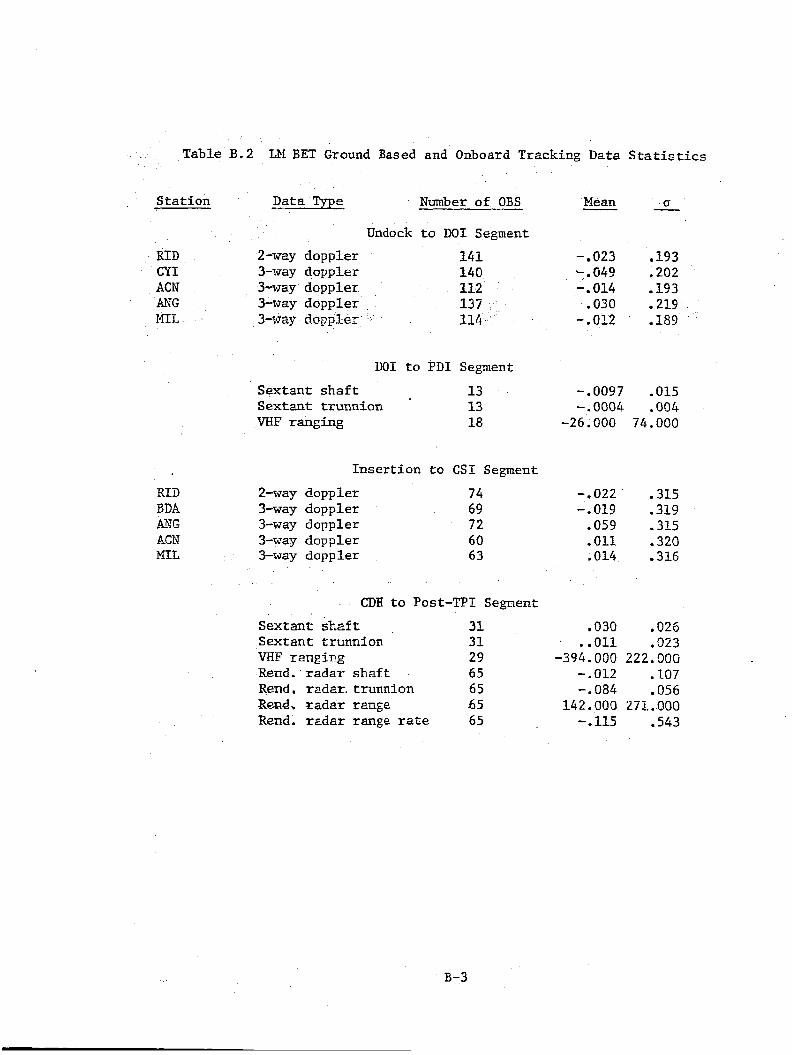
Table B . 2 LM BET Ground Based and Onboard Tracking Data Statist ics
Sta t ion Data Type Rmber of OBS Mean __ cr
Undock t o DO1 Segment
RID 2-way doppler 141 - 023 .I93 CY1 3-way doppler 140 -.049 .202 ACN 3-way doppler 112 -.014 .193 P-NG 3-way doppler 137 .030 .219 MI?, 3-Way doppler 114 -.OX .189
WI t o PDI Segment Sextant s h a f t 13 -.0097 .015 Sextant trunnion 13 -.0004 .004 VKF ranging 18 -26.000 74.000
R I D EDA k I G ACN MIL
Inse r t ion t o CSI Segment
2-way doppler 74 3-way doppler 69 3-way doppler 72 3-way doppler 60 3-way doppler 63
CDH t o Post-TPI Segnent
Sextant shaft 31 Sextant trunnion 31 WF ranging 29 Rend. r a d a r s h a f t . 65 Rend. radar. trunnion 65 Rend, radar rmge 55 Rend. radar range rate 65
-.022' .315 - .019 .319
. O S 9 .315
.Olf .320 .014 .316
,030 . O X . ..011 .023
-394.000 222.00G -.OX! ,107 -.084 .056
- .I15 .543 uz.aoo z7~ .aoo
B-3
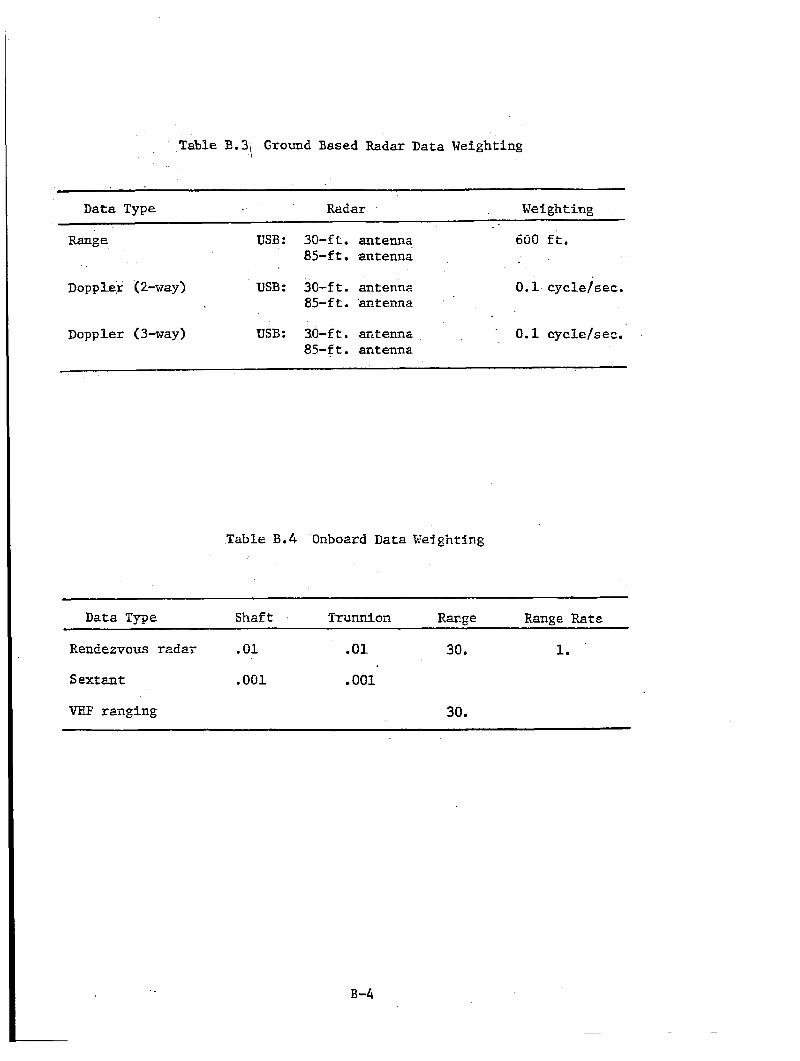
Table 3 .3 , Ground Based Radar Data Weighting
Data Type Radar Weighting
Range USB: 30-ft. antenna 600 ft. 85-f t . antenna
Doppler (2-way) USB: 30-ft. antenna 0.1 cyclejsec. 85-ft. antenna
Doppler (3-way) USB: 3.0-ft. antenna 0.1 cycle/sec. .
85-f t . antenna
B-4
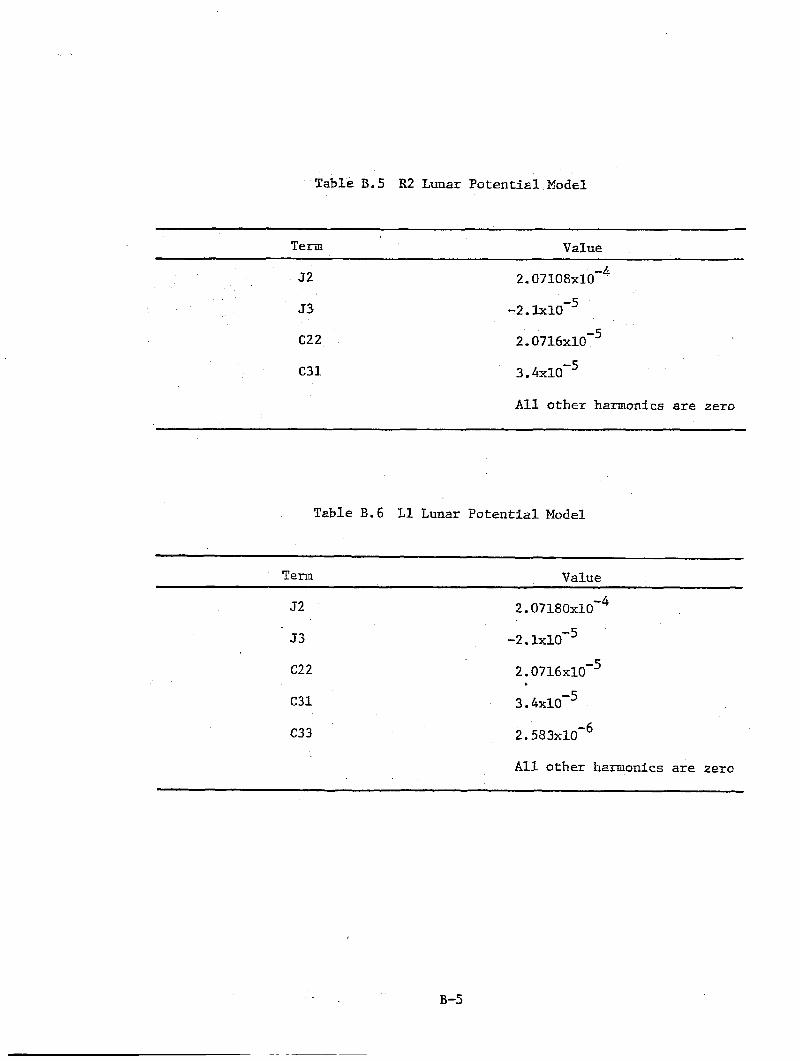
Table B.5 R2 Lunar P o t e n t i a l Model
Term
52 2.07108~10-~
53
c22
C31
All o the r harmonics are zero
Table B.6 L1 Lunar Potential Model
Value Term
52
33
c22
C 3 1
c33
-2. 1x1~-5
2.0716~10-~
3. CXIO-~
All other harmonics are zero
B -5
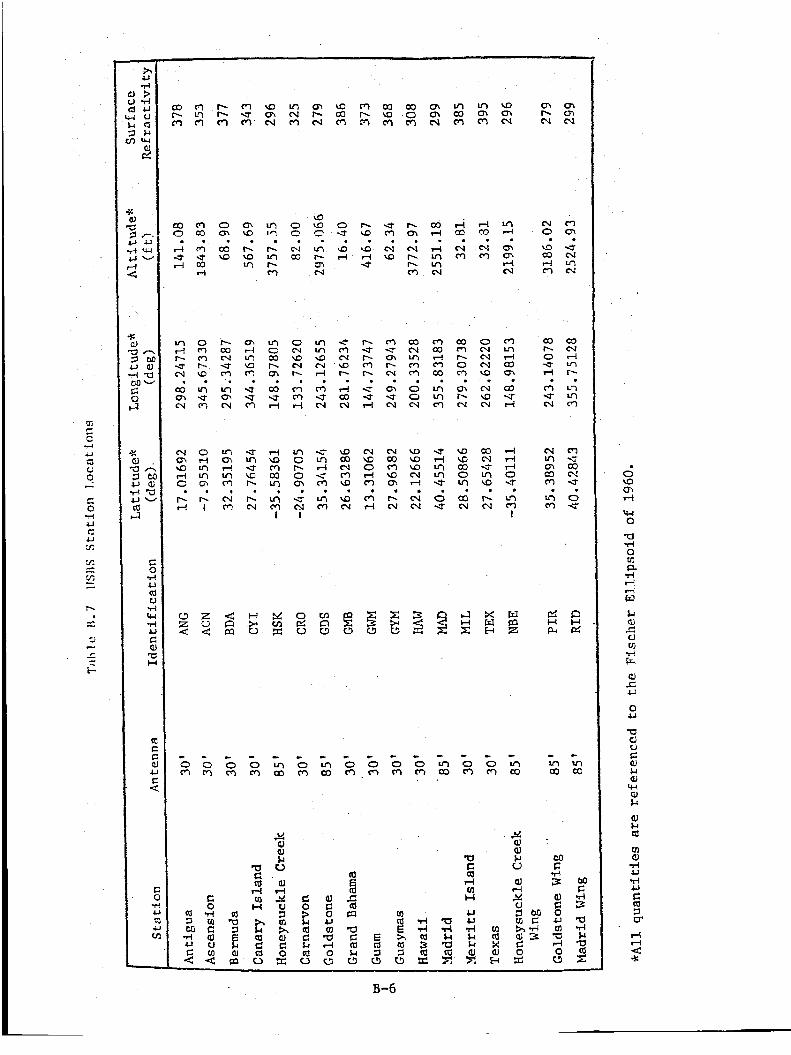
m I.- hl
hl 0
\o a3 l-i rl
CO I.- 0 U 4
m * N
N In
a3 m v) m
cn
.
d H PI
- m a3
n N rl
0 c N Eo
0 N \D N r-
m m d
m 0 b 0 m U rsl
I
0 r3
c o r n o m m N
b m
v) CO e7
I-i a)
N m
0) m b 0 m cn b N
Ul UJ 02 0 v)
cn N
;3 r:
I 0.
hl b b m
03 N m c) m 0 0 N
UJ w UI N 4
N hl
.
m 5 0 d L1 c ..J c; 9 - c. 0
c
0 m L
0 rn
- L
o m r n a
c
0 cp)
c 0 cp)
c
0 L
0 (?
C 0
ul co 0 rn
Y aJ aJ u W
‘L1
E M E: w
C (0
t-4 rn H
aJ d v1 H U v1
al s t l 3 X a h ; 0
X
APPENDIX C
h Rendezvous Radar Data, CSM VHF'Ranging Data and CSX Sextant (Apollo 11)
The LM rendezvous r a d a r data t h a t w a s used i n the analysis are l i s t e d
i n the two card format of t h e HOPE o r b i t determinat ion program. The f irst
card speci€ies.the veh ic l e taking the observation, the vehicle that is
being obs.erved, t he t i m e o f the observat ion (year (mod 1900), month, day,
hour, minute, and second (GMT)), t h r e e code n h b e r s , shaft observable, ,
trunnion observable, range observable, and range rate observable. The
second card specifies the inner, middle, and outer gimbal angles . The
units are feet, degrees, and seconds.
The CSM VHF ranging d a t a are a l s o listed i n the same format. The
card format d i f fe rences are t h e following: 1) v e h i c l e ID'S are reversed,
2) code numbers are different, 3) range is t h e only observable, and 4 )
ginbal angles are not needed to process the ranging da ta .
The CSM sex tan t d a t a a r e also l i s t e d . The card format i s a l s o
similar t o t h e rendezvous radar cards.
c-1
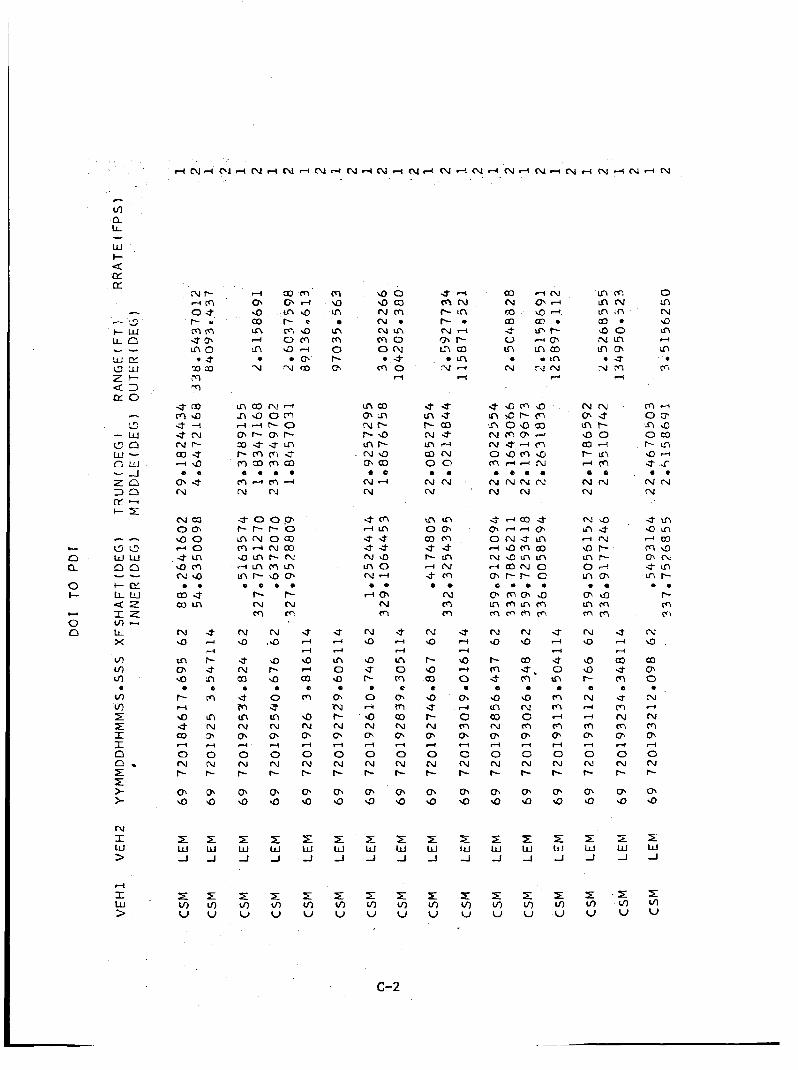
N .Q
a r- Q
0 3 M N 0.
0 N r- o\ 9
e
rl
5. W J
E Y) V
m 9 UJ
m 0 I- m
m
Q t-4 4
In 0 9 a 0. N r- N 0'
0 N r-
m 9
rl
z w -I
r VI V
N 9
t- a m e 9 J I' N m 0 N t-
o\ 9
#-I
5 W -I
P Y) V
c-2
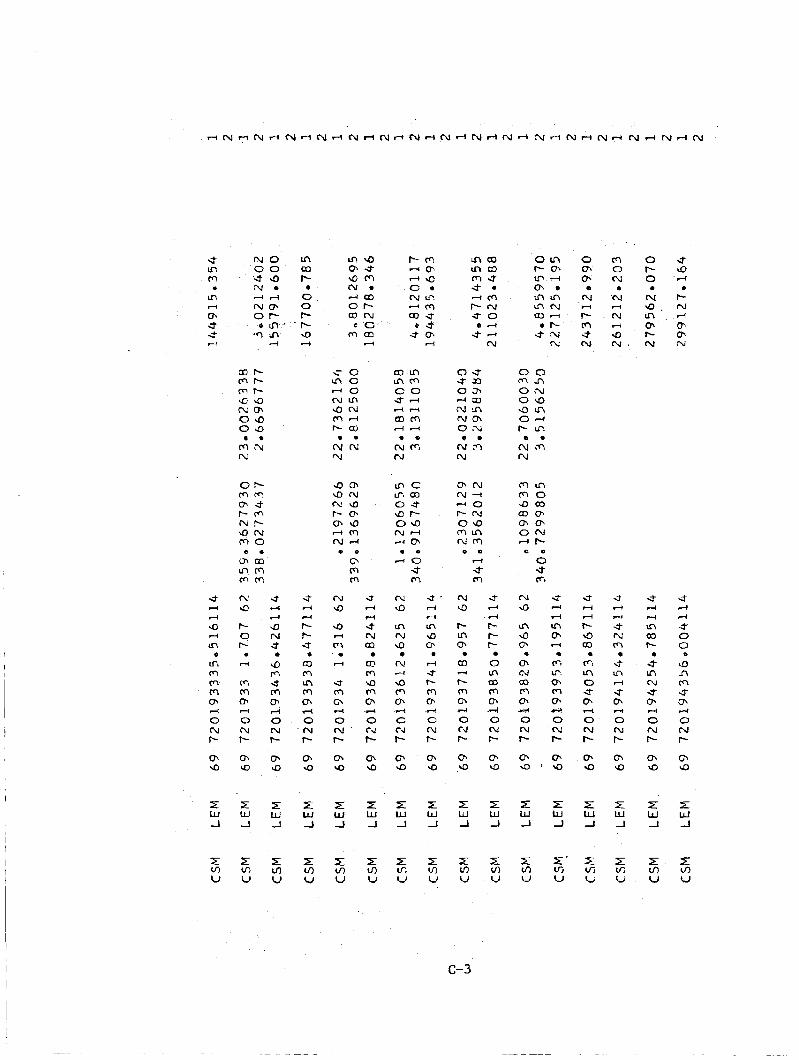
c\I 9
r 0 r- e
.-I
m m 6
0 N
4
r 0. \D
E W -I
I rr, V
Q 4 4 r- r- r-
0 L n m m cn .d 0 N r- 0. 9
r W J
z a V
0 0 m r l O N 09 a n 0 4 P 0.
N m N
* .
c-3
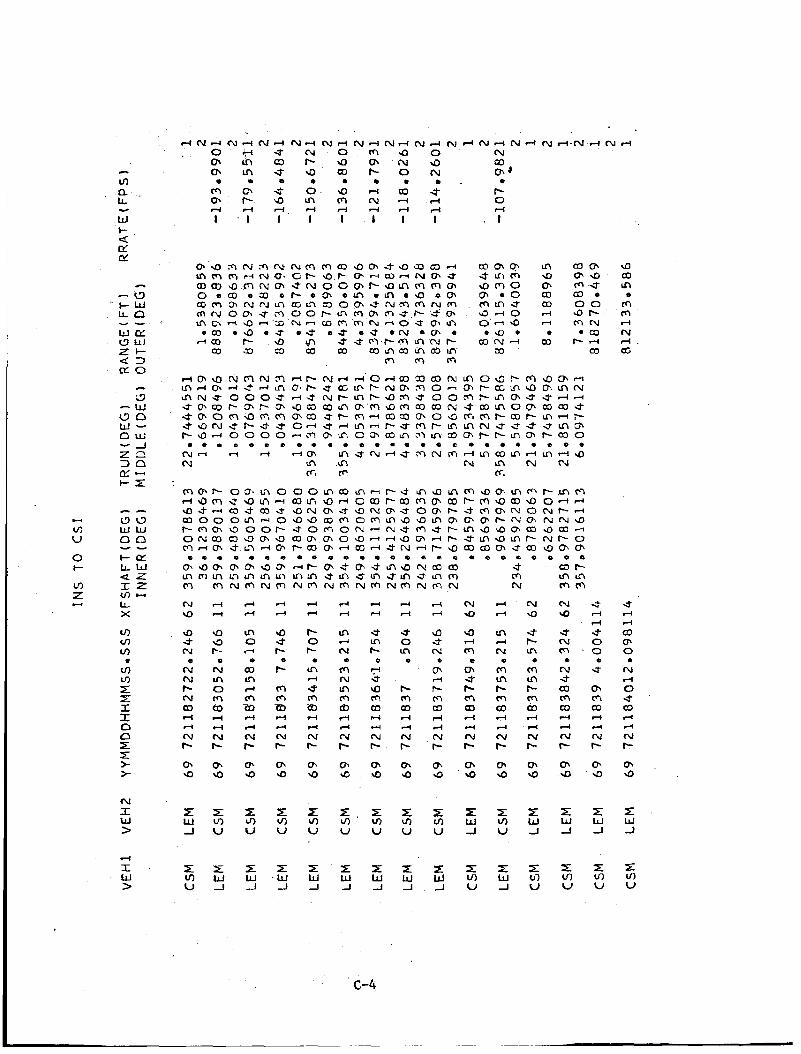
>
cu I W >
d I w >
c-4
N 9
-3 r- ln
m m r- m 0 V-i
A N r- m 9
o
z w J
rr, U
cv I W >
rl I W >
XJ r- 0 0 ob 0 N
rrl 0
N a In 9 -t
N L n rn
cn
0
r-i
d d N Iz
o\ 9
z U J
r m V
cv Q
cn o\ 0
t- m m 0
Q
r-4
?I 4
N r-
o\ 9
r W -I
P v) V
c-5
3 &, 0
In rr o\ 0 0 9
0
4. ri rl In m ln m m (D rl OI k-l rl N (I
t3 9
IT w J
x w LJ
Q d rl m 0 In
9 N N N ch d rl N e m 9
0
I w -I
x w V
N 9
r 0 r-
e P-
m N OI d 4 N c- m 9
I W -I
x v) U
4- d d -5 f- ln e
m -5 m N 01 rl rl N r- OI r3
z W -J
r w V
N 9
In a3 h!
m tr\ 0 N @ d 4 N r- OI 9
0
r W J
E v) u
N 9
+ N rn
N 0
* m m rl rl N r- 0. a
6
z w J
x Ir) u
C-6
N a Q Q N
e d
N m Ch d d N P-
.-I 4
Ln P- rn a N
Ln m Ch r4 d
N I-
d
c-7
C-8
c-9
d m \b e co t-i r4 1
9) Q3 9 3 0 m N e 4
9 tu 4-
)c N m rl 0
I Q
0
m
c\I 9
5 0 0.
e a r- 0 N d N r 0. 9
x w -I
5 U
N 9
r- 0 o\ e
rn 4 r-
0 N
N r-
d
4 4
ln ln m o\ Lr\ 0 I--(
0 N 4 N I'
I
rl rl
4- N m
a i€+ r-
0 N I 4
N I'
0
c-10
A d
IC m 4.
r- 4- m -0 N d N t-
0
d
N 9
03 m 0
IC & -3
-0 N
cu rc
. d
4
4 4
9 0 4
O'
0 cv 0 N r(
N r-
a
c-11
.--(
.-I
In a3 P-
0 Q CD N 0 N l-l
N P-
o\ Q
e
E Y) U
I: w -I
c-12
APPENDIX D
. Apollo 11 Landing Radar Data
The LM landing radar da ta t h a t was used i n the analysis is l i s t e d
i n the two card fo rna t of t h e HOPE o r b i t determinat ion program. The
f i r s t card s p e c i f i e s the vehicle , t h e time of the observat ion (year
(mod 1900) , month, day, hour, minute, and second), t h ree code numbers,
Vu measurement, VyA measurement, Vu measurement, and t h e s l a n t range
measurement (p). The second card specifies the inner , middle , and the
ou te r gimbal angles. The units are feet and f e e t per second.
D-1
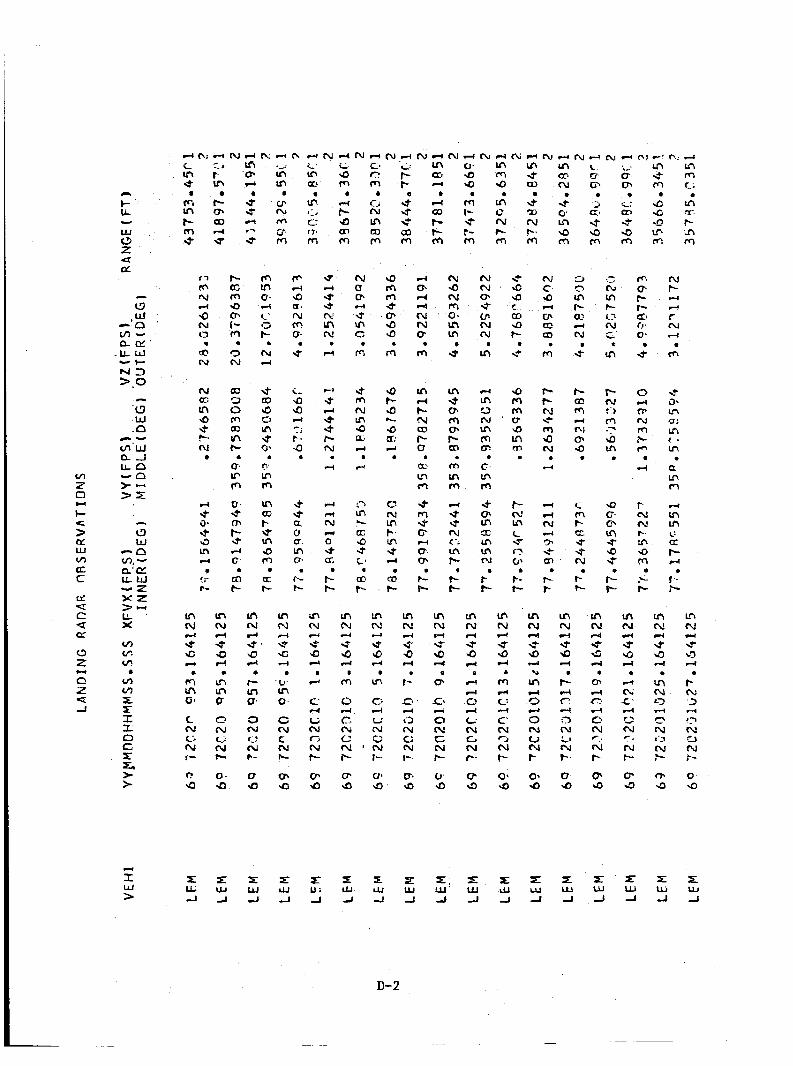
I
vr z 0 Y
I- G > hI UJ v)
ec C
rz c
VI E L I:
c' d Li cv
d
c. cv
c: rl L. N
. . i3 N
c c\I
c N
D-2
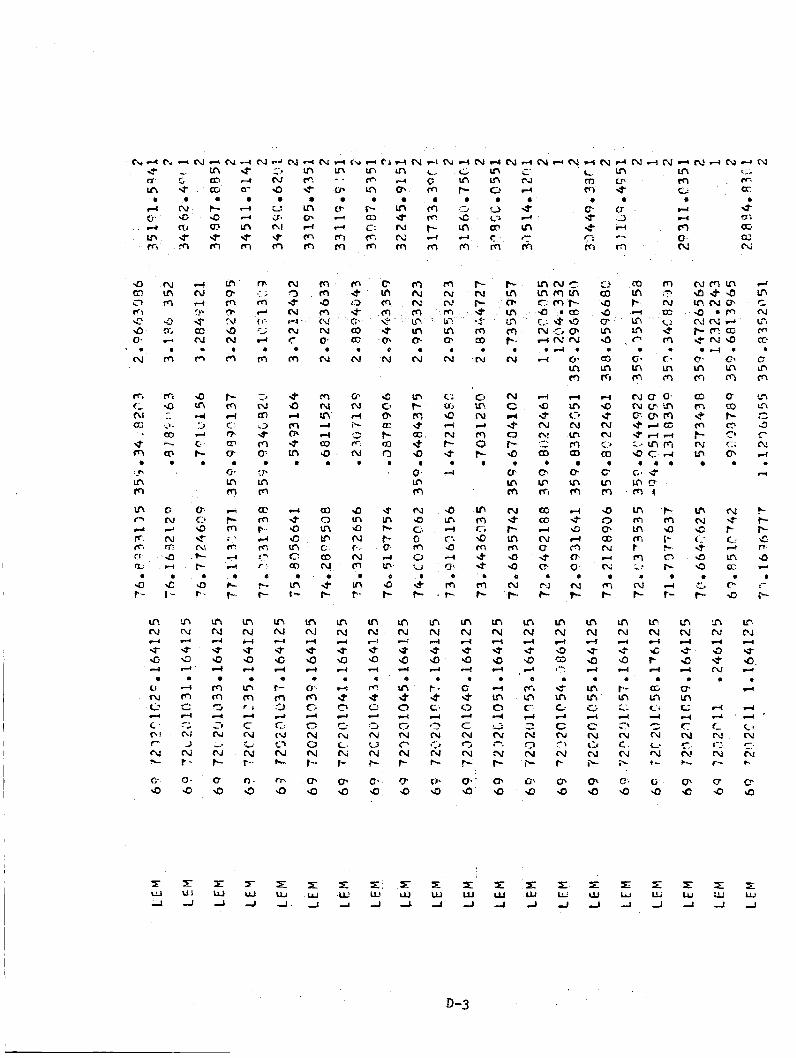
N In A
.3 5. c e
m
4- 4 r )
A rP 4 Ln
C
cs m 4- m ?- N ul
N e r- m r n d 9
N m
V f i l c t"
a r .
e
m N 4 9 4 N e
d d
c ru
5, N I-
O' 9
1-:.
N c-
0. d
D-3
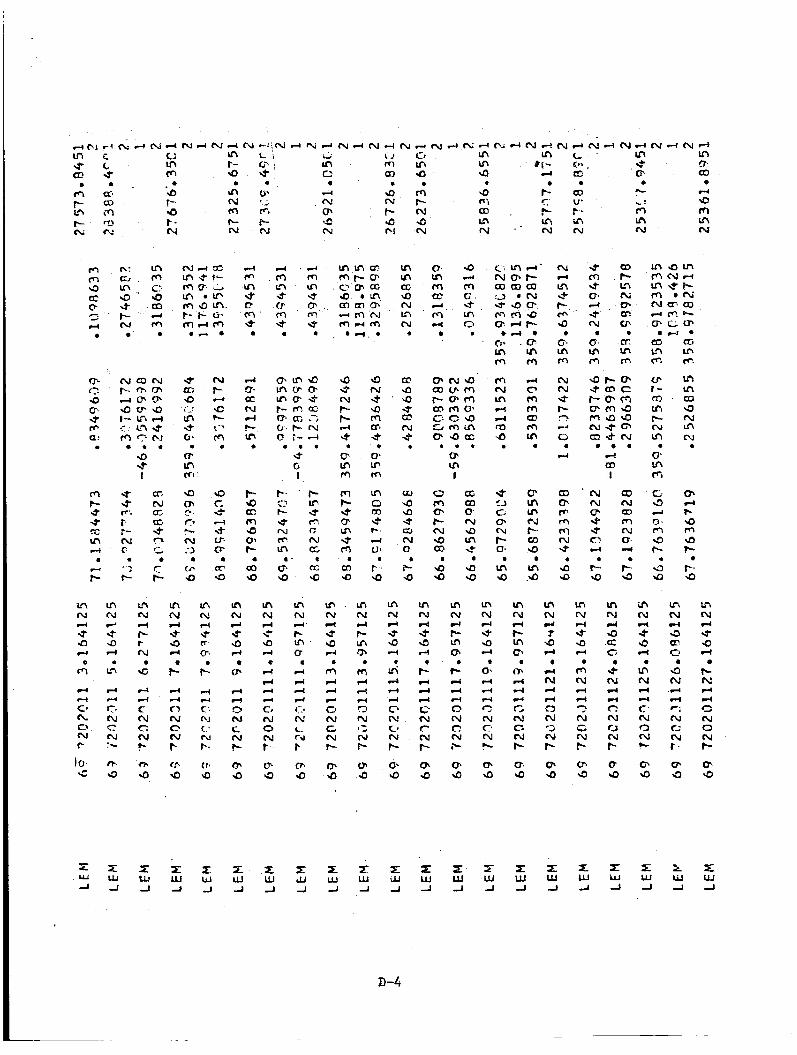
In N rr d 43 r )
;P
d d 3 N c N r OI Q
Ln N d z 9 r(
* N d r(
a N 0 N t-

D-5
b 0 CJ r;,.
D-6
ln 4-
t- in Q
d
a
c
I' d Q N m U* In .
I
0 N C 3' N 3 co
I- t- N a cr) 9 N
c)
I
cu v\ 9 m * F- 0'
CP ln
e
D-7
4
I
r- 9
D-8
QD a m * 0' 4-
m
a
U 3 m 9 rl 0; 9
N 8
9 rn co rn Q N
N
r(
. I
I In N d 9 N 0, .
D-9
I
D-10
in N
.$ m d
r . 4 9 m 5 N 3 ry P-
o' 9
4
l
I
3 4-d
. . .. rg C..
9 Ln 0 m
.
In CL' d .+ 9 l-l . In s m d
c: N c N t-
c" 9
1
I
I
m N
d 3 P I
* 4- rn
. c N
In Q Fl t7. N 9 tu . rn
h Q) r- m N d . 0
4 t-.
- $ m N
0' J r) 0-* f- VI N cv
r- 0 cv N d N 9
m C. N CO c2
m
c' v\ m
I I
I
1
I
r: N t
c N P-
3 hl b
Q, 9
01 9
D-12
In r- m CP C 9 .p
cu e
D-13
d
I I
u, Ln a3 c.. CD m VI
rl w
I
Lc, N d v\ d N
0
m In 4-
C N c N c 0' 9
4
c' N
ti N r- CP 9
c ru b
r .- N r- 0- 9
5: LU J
D-14
U N 9 e 0; ln rn
\t hl c@ y\
a a In d N CT 9 In
9) a a
QI c U cu .+ .s.
a? h .$ 03 0 el m
a
n
a 51 In r- m 4 N
Q .
I
d Q .t N
Lh N d m 4 N e
0'
m rl Q N
c N c= rJ r-
D-15
m cv d m r( (v
Fl A VI 4 -0 tu v N
.
r-
m N rl ln d N
.$ m 4 c? N C N t-
8 d
c cu 0 N r- cn Q
c N C N I-
'3 M 0 N r-
D-16
m a? c(? 4 Ln N 9
A a
m N 9 In d In rn
a
N m m I n m m
0
i-
I- d CF In 9
r- (u
hl E-
P N hl r- c
0- e c - 0 s- .
Ln d
. P. P i
D-17
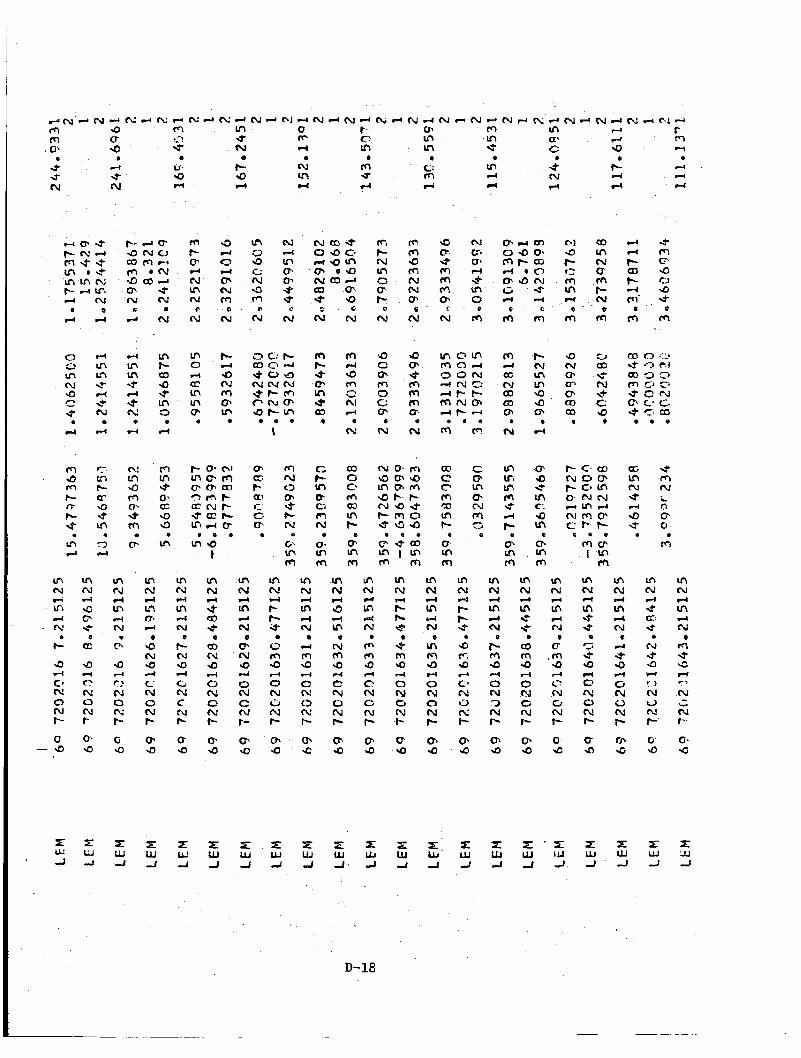
I
I
tn N rl ln 4 N
t- cu 9 4 G CJ c N e 0 9
*
In CJ d m 4 N
Q 0' h' d d 0 N C i d t-
o, 9
E w -1
ln N d 9
E w I
u
D-18
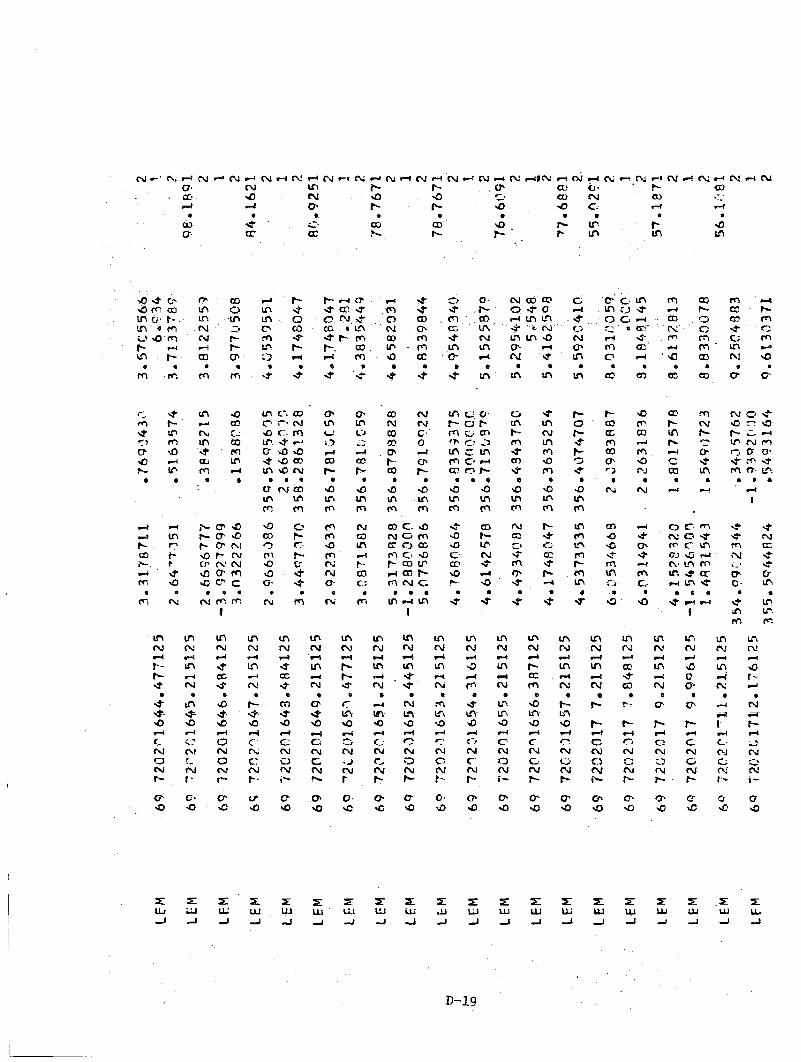
r( m 0 N W LF 9
4
4.
CD cr m m QI
4 a
I
I
5 ln r m 4- a, *
0 9 Ln rn
I
tn N d ln 4 N
a ?-- In 9 + c N i> N I-
@ 9
D-19
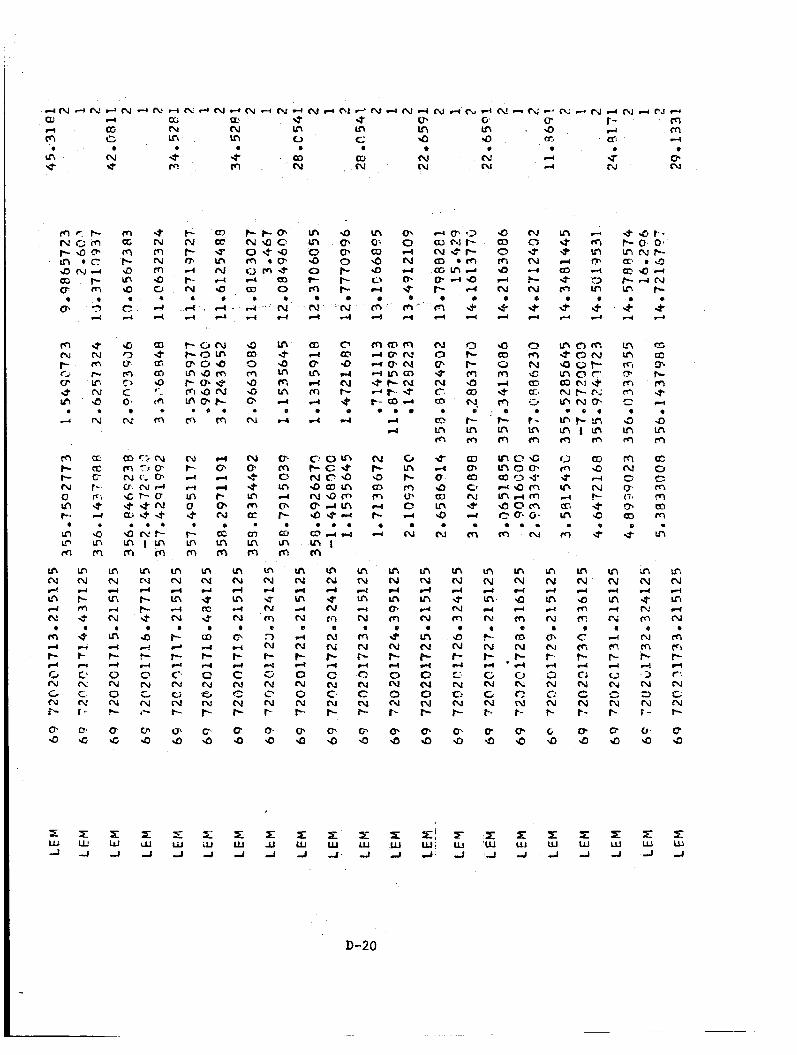
ri a5 m C m N * 4
b
.s u- co 02 ru N pr! m N N N N
1
I
I
C 0%
c N c N rc
s N r
cp 9
Q 9
z: 0 J
D-20
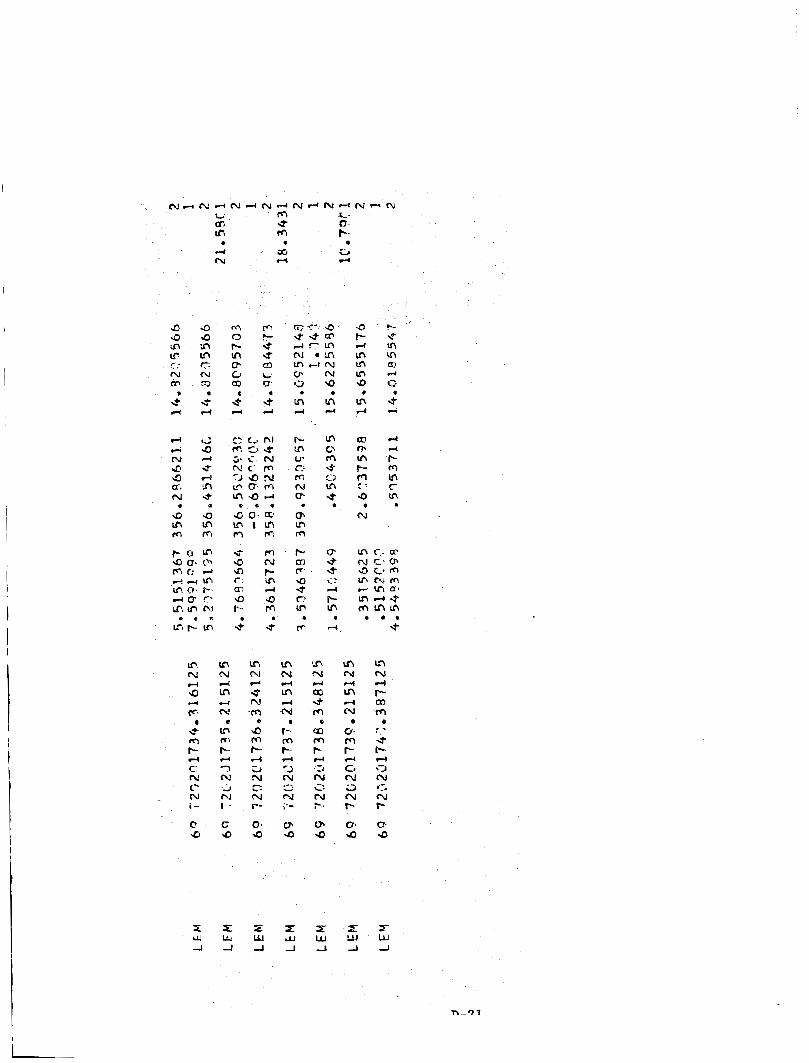
Q sr
I