project
DESCRIPTION
project about Work life balanceTRANSCRIPT

1.1 INTRODUCTION
Inventory represents the second largest asset category for manufacturing companies,
next only to plant and equipment.Given substantial investment in inventories, the importance
of inventory management cannot be overemphasized.
Primary executives in production, purchasing and marketing departments, take decisions
relating to inventories. Usually, purchasing raw material policies and production executives
and production and marketing executives evolve finished goods inventory policy. inventory
management has important operational implications, the operation manager has the
responsibility to ensure that inventories are properly monitored and controlled. He has to
emphasize the operational point of view and initiate programmers with the participation and
involveinvolvement of others for effective management of inventories
Definition of 'Inventory
The raw materials, work-in-process goods and completely finished goods that are considered
to be the portion of a business's assets thatare ready or will be ready for sale. Inventory
represents one of the most important assets that most businesses possess, because the
turnover of inventory represents one of the primary sources of revenue generation and
subsequent earnings for the company's shareholders/owners.
The main functions of inventory are summarized below
Smoothing out irregularities in supply
Minimizing the production cost
Allowing organization to cope with perishable material
Need to hold inventories
Maintaining inventories involves trying up of the company’s funds and incurrence of storage
and handling costs.
1

Inventory analysis
Careful inventory management is critical to the financial health of businesses whose primary
venture is manufacturing or retailing. In retail and manufacturing companies, huge amounts
of time and money are pended in keeping and managing inventory. The assumption of basic
inventory model.
Only one item is considered.
An entire order arrives at once.
No shortages are allowed.
The demand is known and constant over time.
The time value of money is zero.
Price for items is not a function of order quantity.
Lead-time is known and constant.
Types of inventory:
There are three basic types of inventory - raw materials, work-in-process, finished good.
based on their uses, inventory can be classified as - cycle inventory, safety stock, anticipation
inventory, and in-transit inventory.
You may have also heard about independent and dependent demand inventories. We will
work with independent demand in our analysis. Independent demand is most frequently
associated with finished goods where the demand is more or less unknown. Dependent
demand inventory is associated with MRP systems and bills of materials.
Cost involved in inventory analysis:
Ordering cost:
Ordering cost is referred to as the cost of placing an order and securing the supplies. It varies
from time to time and also from industry to industry.
2

Carrying cost:
Carrying cost refers to the cost of keeping the materials in the storehouse which include (1)
capital cost, (2) cost of storage and handling, (3) cost of deterioration and obsolescence, and
(4) other kinds of expenses and losses during storage.
Definition of Supply Chain Management
SCM is the management of a network of all business processes and activities involving
procurement of raw materials, manufacturing and distribution management of Finished
Goods. SCM is also called the art of management of providing the Right Product, At the
Right Time, Right Place and at the Right Cost to the Customer.
Why SCM strategy is important for an Organization
Inventory control and inventory visibility are two very critical elements in any operations for
these are the cost drivers and directly impact the bottom lines in the balance sheet. Inventory
means value and is an asset of the company. Every business has a standard for inventory
turnaround that is optimum for the business. Inventory turnaround refers to the number of
times the inventory is sold and replaced in a period of twelve months. The health of the
inventory turn relates to the health of business.
In a global scenario, the finished goods inventory is held at many locations and distribution
centres, managed by third parties. A lot of inventory would also be in the pipeline in
transportation, besides the inventory with distributors and retail stocking points. Since any
loss of inventory anywhere in the supply chain would result in loss of value, effective control
of inventory and visibility of inventory gains importance as a key factor of Supply Chain
Management function.
3
1.2 INDUSTRY PROFILE
Although pottery and ceramic industry is of prehistoric origin in India, the HT insulator
industry has a recent origin. The first unit was set up in the fifties at Bangalore. Some units
were set up in the sixties but the main expansion of the industry took place in the seventies
are used in electrical transmission lines, substations and electrical equipment. Different types
of industry are used for each application.
There has been up gradation of transmission voltage and plans are afoot to install 765 KV AC
transmission lines. The industry would need to develop and produce HT insulators of higher
ratings for transmission lines, substations and equipment.
There are 14 units manufacturing electro porcelain high tension insulators. Two of these units
are in small scale sector. These have installed capacity of 85,050 tonnes per annum one small
scale and one organized sector unit have stopped production of insulators. The capacity of
these two units is 5000 tonne per annum.
The demand and average production of the HT Insulators during the last nine year have been
around 31,000 tonne per annum.
More than 60% of the installed capacity is lying idle with the industry due to lack of domestic
demand. With the implementation of the approved projects, the unutilized capacity would
increase from 60,000 tonne to 1,00,000 tonne approximately. Since the domestic is not likely
to increase proportionately at least for the next five years, the only possible way for
improving the efficiency of the industry is to enter the world export market.
All the units in the organized sector have been set up with foreign technology through foreign
collaborations were entered into initially to set up the projects and number of 1 unit
subsequently had entered into supplementary collaborations to upgrade and enhance the
product range. Each unit in the industry has been acting as a sealed compartment and centre
of an exclusive secret technology. There has been very little exchange of technological
information amongst the units of the industry.
The industry has done well to adapt the foreign technology. Over the past decade, it has
produced major equipment and testing equipment on their, own. Porcelain insulator industry
4
in India has substantially matured and even is in a position to pass on technology to any third
country who may want to set up such a plant in association with them.
Electro porcelain and toughened glass are the two types of insulators that are being used for
high tension transmission lines and equipment throughout the world. The world market
comprises of the power project being set up mainly in the under developed and developing
countries using electro porcelain and toughened glass insulators.
In India also toughened glass insulators are being used in transmission lines. However, it may
be noted that this comparison is not exhaustive, as complete data on properties and
performance of glass insulators is not available due to its limited use so far. Toughened glass
insulator technology acquisition and adaptation has not received sufficient attention so far in
the country. The only unit which has been given the license for manufacture of toughened
glass insulator has set up an assembly line. Production of glass shell which indeed is the real
technology is yet to start.
Generally glass tends to deteriorate in outdoor application as it is not crystalline. It is
amorphous and also in a Metastable state. Also surface damage in glass insulators leads to
shattering, while porcelain insulators can withstand reasonable degree of surface demand.
Performance of glass is yet to be proved in EHV system trial in tropical countries. Long rod
porcelain insulators have been developed and are being used along with disc insulator strings.
5
1.3 COMPANY PROFILE
Vision:
WSI was established in 1961 with a vision of creating an enduring benchmark in India for
strategic excellence in electro-porcelains.
Goal:
The continuing drive to synthesize material technology with manufacturing competence to
develop innovative product solutions.
A period of expansion:
The foundation of product and process technology from international leaders coupled With
continuing emphasize on in-house development and adaptation to market requirements,
helped WSI to introduce many new product styles for the domestic and export markets as
well as improve manufacturing efficiency.
The company today has an installed capacity of 12,800 CMT on a built-up area of 67,237
square meters and manufactures all types of high voltage porcelain insulators.
Continuing improvement:
The plant is with comprehensive facilities to ensure production consistency and flexibility.
An integrated approach to quality management through comprehensive training at all levels
supported by full-fledged test facilities ensures superior product performance and reliability.
All products are rigorously tested to ensure compliance with not only all international
standards but also stringent customer specific standards. This is supported by periodic testing
at reputed international laboratories.
Extensive usage of information technology for production planning, scheduling and control
creates the ability to track each order through the production process, respond quickly to
customer requirements and maintain minimum throughput time.
6
Quality A company Wide commitment:
The quality system, certified for compliance to ISO 9001(achieved in 1991) is used as the
primary tier of product and process control. This is supplemented by comprehensive usage of
other techniques including SQC, SPC, PDCA and continuous improvement project in all
areas of operations.
An international outlook:
WSI believes in serving global market while retaining a strong domestic presence. Today,
WSI products are in service in many countries in severe operating environments. WSI has put
in place an extensive network of sales agent and distributors supplementing direct marketing
efforts to provide comprehensive service to its customer.
All our product have been tested extensively at various international laboratories in
accordance with the international standards.
Since its inception WSI has won numerous awards for its export performance from the
Government of India.
An On-going saga:
WSI continues to enhance its competence in design and manufacturing expertise in the
electro-porcelain industry in its mission to provide increasing value to the customers.
7

1.4 PRODUCT PROFILE
A true insulator is a material that does not respond to an electric field and completely resists
the flow of electric charge. In practice, however, perfect insulators do not exist. Therefore,
dielectric materials with high dielectric constants are considered do not exist. Therefore,
dielectric materials with high dielectric constant are considered insulators. In insulating
materials valence electrons are tightly bonded to their atoms. These materials are used in
electrical equipment as insulators or insulation. Their function is to support or separate
electrical conductors without allowing current through themselves. The term also refers to
insulating supports that attach electric power transmission wires to utility poles or pylons.
Some materials such as glass, paper or Teflon are very good electrical insulators. Even
though they may have lower bulk resistivity, a much larger class of materials are still ”good
enough” to insulate electrical wiring and cables. Examples include rubber-link polymers and
most plastics. Such materials can serve as practical and safe insulators for low to moderate
voltages (hundreds, or even thousands, of volts).
Insulators are commonly used as a flexible coating on electric wire and cable. Since air is an
insulators, in principle no other substance is needed to keep power where it should be. High
voltage power line commonly use just air, since a solid(e.g., plastic) coating is impractical.
However, wires which touch each other will produce cross connection, short circuits, and fire
hazards.
In coaxial cable the center conductor must be supported exactly in the middle of the hollow
shield in order to prevent EM wave reflection. Finally, wires which expose voltages higher
then 60V can cause human shock and electrocution hazards. Insulating coatings help to
prevent all of these problems
Every insulator manufactured is subjected to an array of thermal, electrical and mechanical
tests. Apart from the routine tests, samples from each lot are subjected to acceptance tests in
line with the relevant standards
Suspension Insulators
Service environments necessitate the use of the proper profile of the insulator, to ensure
hassle-free operation under severe site conditions. To cater to the needs of the customers WSI
8
manufactures three different profiles catering to site conditions ranging from lighting /
moderate pollution to severe sand pollution.
Every insulator manufactured is subjected to an array of thermal, electrical and mechanical
tests. Apart from the routine tests, samples from each lot are subjected to acceptance tests in
line with the relevant standards.
Insulators for substations and apparatus require a high degree of safety and service reliability.
These insulators may be subjected to high degree of static and dynamic loading, severe
climatic conditions and very heavy levels of pollution.
"Suspension" and "Strain" insulators are the same thing; when used in the vertical position
(with the conductor hanging below) they are called "suspension"; when used in the
horizontal, to dead-end a conductor, they are called "strain".
There are two basic types of suspension insulators: Unipart and multipart.
Multiparts are no longer produced, and original units are rare today. There are only two
known styles: Cochrane and Byllesby, both dating from the late 1910s.
Unipart’s (see left and right) were first developed in the 1910s and are the common style still
in production today. Each unit has a single glass shell bonded to a steel cap (above) and a
steel pin (below). The modular units connect with each other cap-to-pin, forming a chain or
"string".
The mechanical strength of a string is determined by the rating of the metal parts of a single
unit, but the electrical rating can be increased by simply adding more units. This system
allows for much higher insulation value than any pin-type insulator: the largest one-piece pin-
type power insulator ever made in the U.S. was the Corning Pyrex No. 701, which is rated at
only 70,000 volts, while a string a suspension insulators could be assembled that stands off
1,000,000 volts or more.
There are three basic styles of Unipart suspension insulator shells: (1) "sombrero" (so-called
by collectors), which is flat, with multiple ridges or "skirts" on the under-side which increase
the leakage distance; (2) fog or "bell", in which the disk is curved into a bell or nearly
hemispheric shape, the indent being to keep the ridge less underside from being wetted as
9

easily; and (3) aero(dynamic) style, a wide flat disc (also with no ridges) which presents little
cross-section and so is least affected by high winds.
Ceramic Disc Suspension Insulator/Porcelain Suspension Insulator/Suspension
Insulator
Ceramic Disc Suspension Insulator/Porcelain Suspension Insulator/Suspension Insulator
Disc Suspension Porcelain Insulator is used for insulation and supporting in high voltage
overhead transmission and distribution lines. They are usually connected and assembled into
insulator string and used on different levels of line voltage.
Connected fitting type: ball & socket type; clevis & tongue type
Strength can be 40 KN, 45KN, 60KN, 70KN, 80KN, 100KN, 110KN, 120 KN,
125KN,160KN, 210KN, 300KN
According to different use environment and region, the insulator can be divided into standard
type and anti-pollution type.
Standard suspension insulator:
10

ANSI type:
52-1, 52-2, 52-3, 52-4, 52-5, 52-6, 52-8, 52-9 according to ANSI C29.2
EC type:
U70BL, U70BS, U100B, U120B, U160B, U210B, U300B according to IEC383, BS137
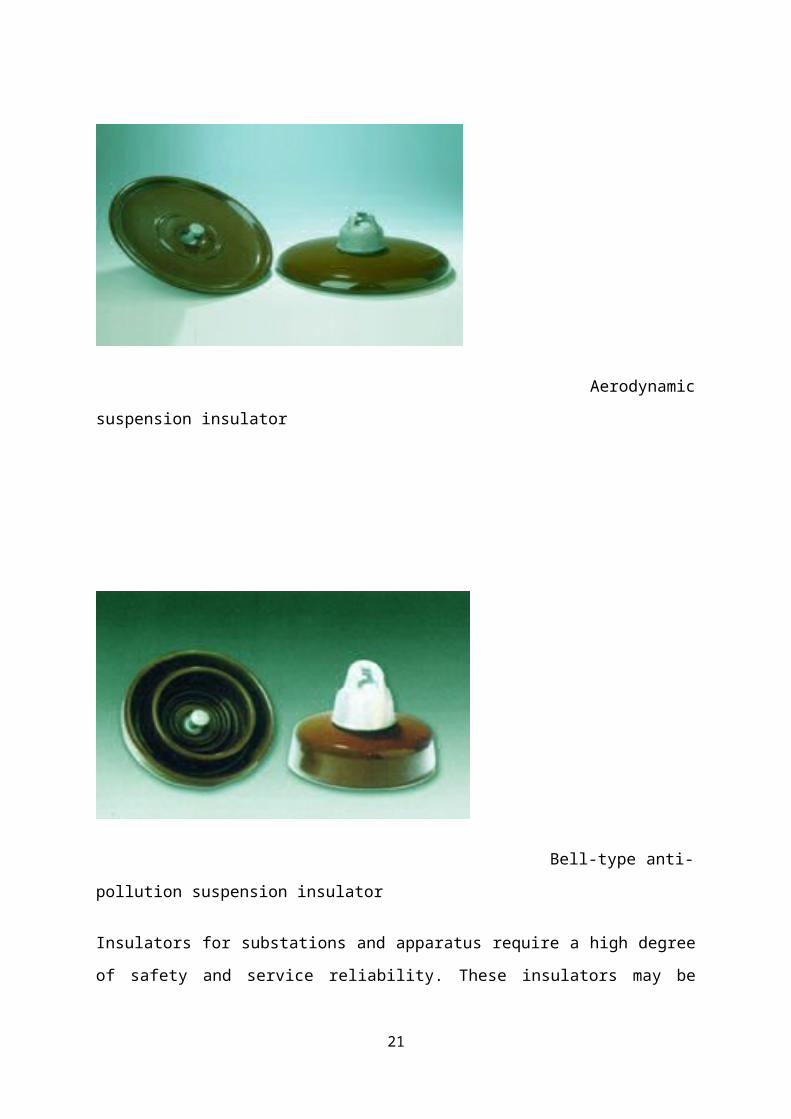
The fog type has big creep age distance. According to the shed shape and structure, the fog
type disc suspension insulator can be divided into double-shed anti-pollution insulator, tri-
shed anti-pollution insulator, aerodynamic suspension porcelain insulator and bell-type anti-
pollution suspension insulator
Fog type anti-pollution ceramic disc suspension
The fog type has big creepage distance. According to the shed shape and structure, the fog
type disc suspension insulator can be divided into double-shed anti-pollution insulator, tri-
shed anti-pollution insulator, aerodynamic suspension porcelain insulator and bell-type anti-
pollution suspension insulator.
Double shed suspension insulator
11
Three shed suspension insulator
According to connected way, the suspension insulator can be divided into ball and socket
type & clevis and tongue type. The surface of the cap and pin ball of insulator should be hot
dip galvanized. If the area is highly polluted, the pin ball can be added the zinc sleeve. The
locking device of W and R spring split is made of bronze or stainless steel. They have good
flexibility and anti-corrosion nature.
Aerodynamic suspension insulator
12

Bell-type anti-pollution suspension insulator
Insulators for substations and apparatus require a high degree of safety and service reliability.
These insulators may be subjected to high degree of static and dynamic loading, severe
climatic conditions and very heavy levels of pollution.
Color: Brown, Grey, White, Blue
Type: standard type, Orient design, customer requirement and drawings
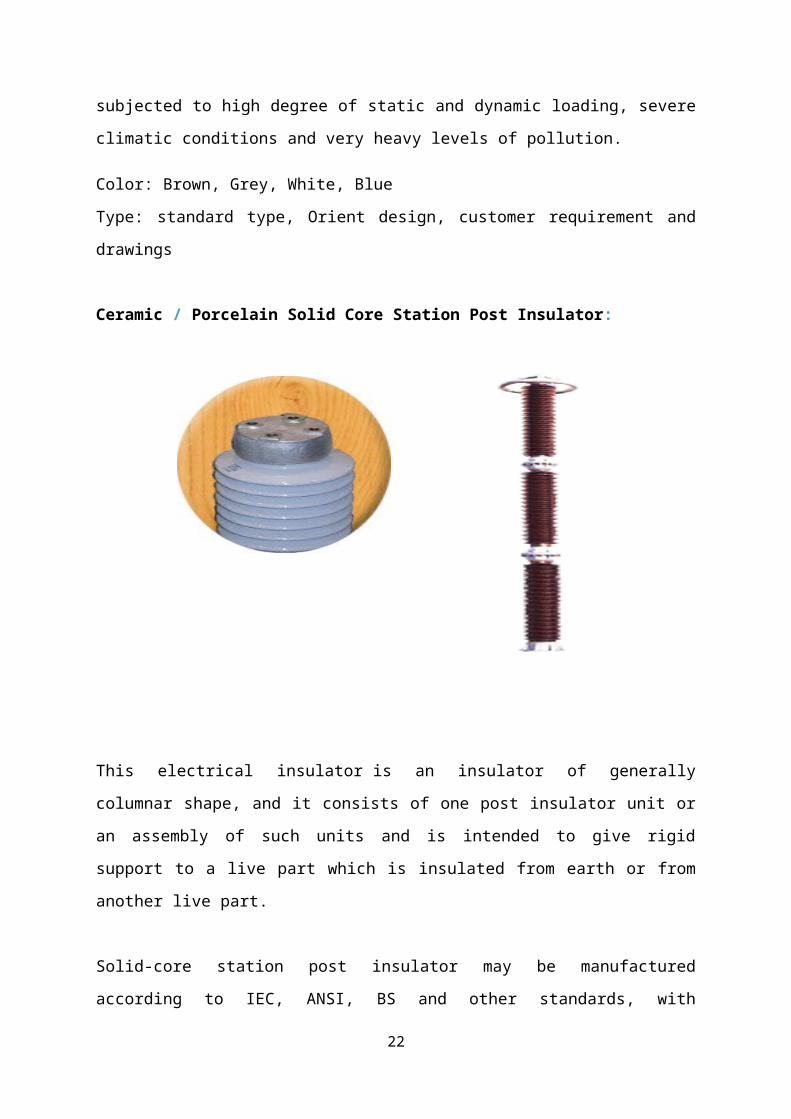
Ceramic / Porcelain Solid Core Station Post Insulator:
This electrical insulator is an insulator of generally columnar shape, and it consists of one
post insulator unit or an assembly of such units and is intended to give rigid support to a live
13

part which is insulated from earth or from another live part.
Solid-core station post insulator may be manufactured according to IEC, ANSI, BS and other
standards, with cantilever strength from 4kN to 18kN, which is used on 15kV to 750kV
station and substation.
There are two types for this series, normal type and anti-pollution type.
Station Post Insulators including:
Solid-Core Station Post Insulators to meet ANSI C29.9:
TR-202, TR-205, TR-208, TR-210, TR-214, TR-216, TR-286, TR-287, TR-288, TR-289,
TR-291, TR-304, TR-312, TR-362, TR-369, TR391
Station Post Insulators to meet IEC 273:
C4-125, C4-150, C4-170, C4-200, C4-250, C6-325, C6-450, C6-550, C6-650, C8-750, C10-
950, C10-1050, C12.5-1550, C10-1675C C10-1800, C10-2100, C10-2550.
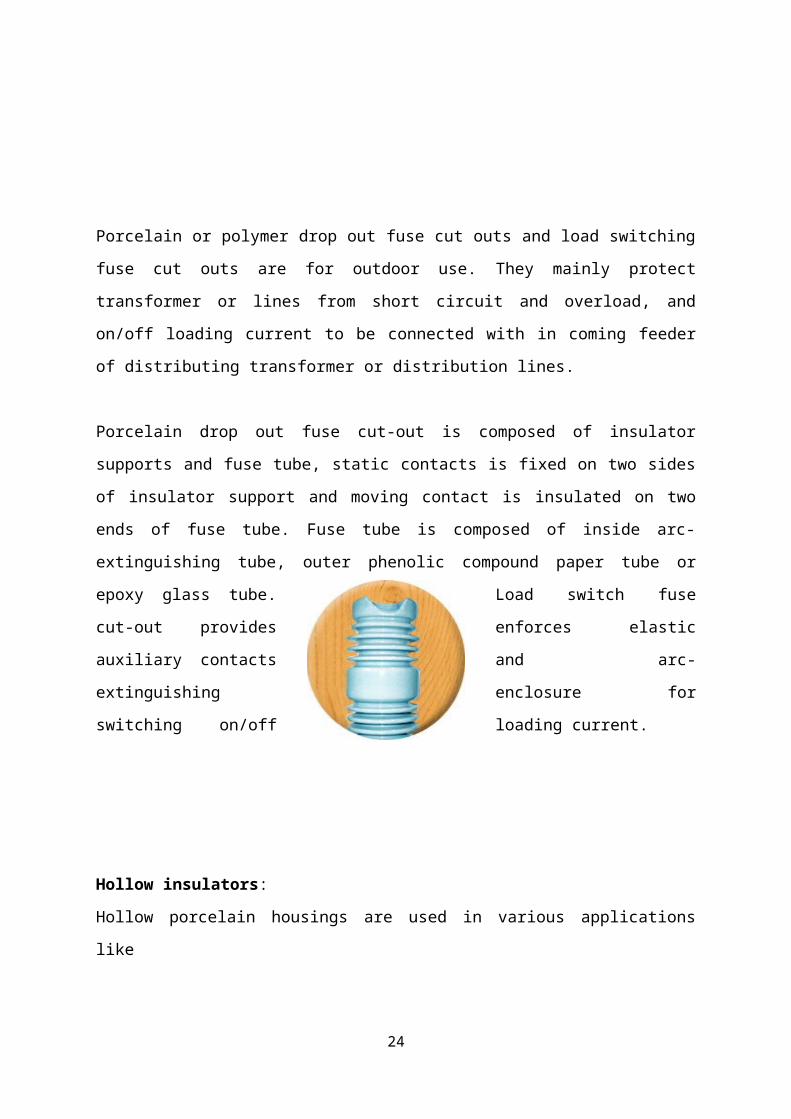
Cut-out Insulator:
Porcelain or polymer drop out fuse cut outs and load switching fuse cut outs are for outdoor
use. They mainly protect transformer or lines from short circuit and overload, and on/off
14

loading current to be connected with in coming feeder of distributing transformer or
distribution lines.
Porcelain drop out fuse cut-out is composed of insulator supports and fuse tube, static
contacts is fixed on two sides of insulator support and moving contact is insulated on two
ends of fuse tube. Fuse tube is composed of inside arc-extinguishing tube, outer phenolic
compound paper tube or epoxy glass tube. Load switch
fuse cut-out provides enforces elastic auxiliary
contacts and arc- extinguishing enclosure for
switching on/off loading current.
Hollow insulators:
Hollow porcelain housings are used in various applications like
1. Transformer bushings
2. Condenser bushings
3. Lightning arresters
4. Instrument transformers
5. SF6 breakers
6. Wall through bushings and
7. Other applications
To meet the creep age requirements and climatic conditions in service the hollow porcelain
housings can be manufactured with different shed profiles namely
1. Plain sheds without droplet rims
15

2. Plain sheds with droplet rims
3. Alternate sheds without droplet rims
4. Alternate shed with droplet rims and
5. Anti-fog sheds
Each and every porcelain housing manufactured is subjected to ultrasonic, temperature cycle
and routine electrical tests. Routine mechanical tests like hydraulic inner pressure, cantilever
bending and beam test as per customers’ requirements are carried out. The critical dimensions
and surface roughness are also verified to check conformance to requirement. Acceptance
and type tests are carried out in line with standards and / or customers’ requirements
The solid core insulators have the following distinct advantages:
1. Reliability of service
2. Absolutely puncture proof
3. Very high mechanical strength
4. Very low deflection at bending loads
5. Free from internal partial discharges
Every insulator manufactured is subjected to an array of tests. Apart from the routine tests,
samples from each lot are subjected to acceptance tests in line with the relevant standards.
Insulators comply with relevant IEC / ANSI standards.
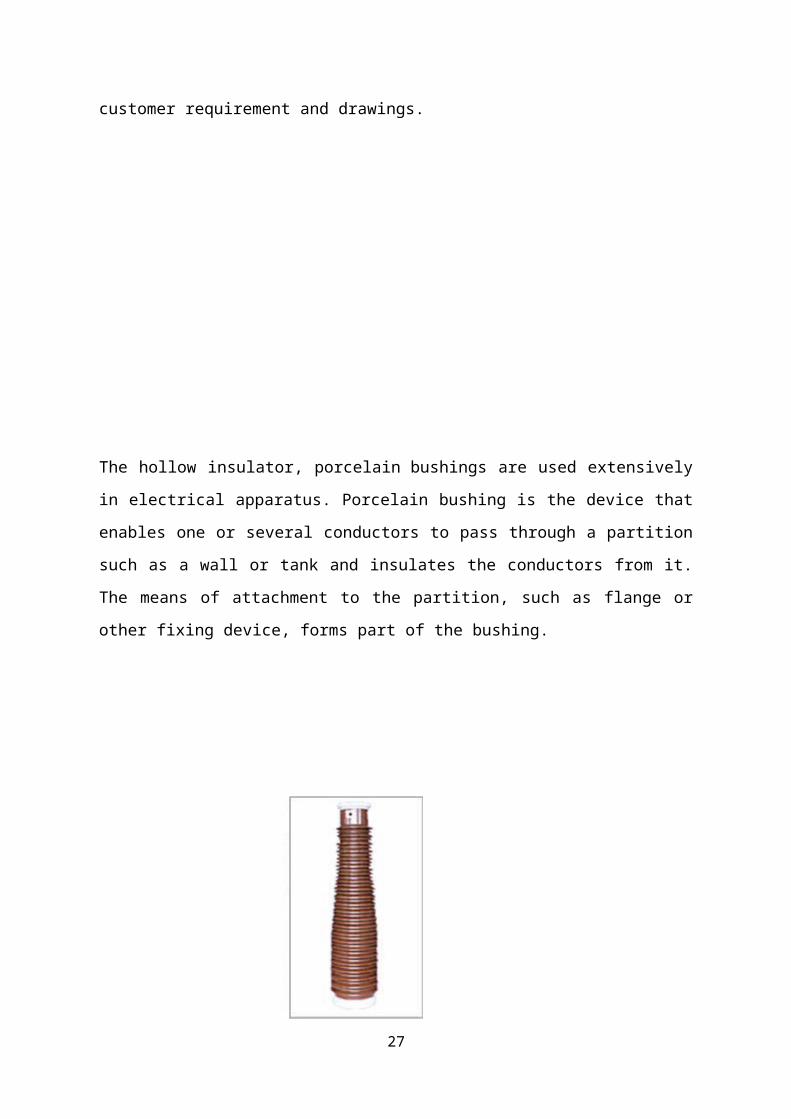
Porcelain Bushing/ Hollow Insulator/ Ceramic Bushing
Porcelain bushing and big hollow insulators:
16
Color: Brown, Grey, White, Blue glaze
Type: IEC, ANSI, DIN, BS AS standard type, Orient design, customer requirement and
drawings.
The hollow insulator, porcelain bushings are used extensively in electrical apparatus.
Porcelain bushing is the device that enables one or several conductors to pass through a
partition such as a wall or tank and insulates the conductors from it. The means of
attachment to the partition, such as flange or other fixing device, forms part of the bushing.
17

Big porcelain bushing, hollow insulator up to 1000KV:
Upside down transformer bushing
Capacity voltage transformer bushing
SF6 current transformer bushing
Outdoor cable end bushing
Voltage transformer bushing
Current transformer bushing
Circuit breaker post bushing
SF6 transformer bushing
Oil immersed voltage transformer bushing
SF6 circuit breaker bushing
electrostatic precipitator bushing
Small porcelain bushings:
Small porcelain bushing, hollow insulators are used
as the insulating elements such as the transformer
bushings and wall bushings .They are designed to
18

perform under outdoor and indoor conditions for voltage up to 36KV.
DIN transformer bushing:
AB250, AB630, AB1000, AB2000, AB3150, 10Nf250, 10Nf630, 10Nf1000, 10Nf3150,
20Nf250, 20Nf630, 20Ni630, 20Nf1000, 20Nf3150, 30Nf250, 30Nf630, 30Ni630,
30Nf1000, 30Nf3150
19

2.1NEED FOR THE STUDY
Insulator industry is efficiently utilizing in the electricity& Atomic energy system.
Since the demand for power in accelerating the demand for insulators will go shout up.
Therefore to meet tough competition, any between organizations tend to reduce the cost being
locked up in inventory.
Inventory control and inventory visibility are two very critical elements in any operations for
these are the cost drivers and directly impact the bottom lines in the balance sheet. Inventory
means value and is an asset of the company. Every business has a standard for inventory
turnaround that is optimum for the business. Inventory turnaround refers to the number of
times the inventory is sold and replaced in a period of twelve months. The health of the
inventory turn relates to the health of business.
In a global scenario, the finished goods inventory is held at many locations and distribution
centres, managed by third parties. A lot of inventory would also be in the pipeline in
transportation, besides the inventory with distributors and retail stocking points. Since any
loss of inventory anywhere in the supply chain would result in loss of value, effective control
of inventory and visibility of inventory gains importance as a key factor of Supply Chain
Management function.
20
2.2 OBJECTIVES OF THE STUDY
Primary objective
To study the inventory analysis and supply chain management in WS industries.
Secondary objective
To classify insulators using ABC analysis.
To find out maximum inventory level of raw material using P system.
To suggest appropriate review period.
21
2.3 SCOPE OF THE PROJECT
The study of the project is the inventory flow procedure prevailing in a insulators company
mainly in WS industries. It will help the company to know about the various level of supply
chain management that the company has to concentrate
The study seeks to find out the factors used in inventory analysis. The research was analysed
from the statements, purchase order of raw material data, finishing goods data and other
books of operation management of the concern. The data collect has been analysis and
arrived on findings which have proved it worth to know about the areas of inventory analysis
and supply chain management.
22

2.4 LIMITATIONS OF THE STUDY
The study was conduct only in WS Industries.
Data collected is from company for 1 year only so it is data constraint.
The study is carried out for 3 months only so it time constraint.
23
2.5 RESEARCH METHODOLOGY
P .Radhakrishnan, V M Prasad, M R Gopalan ,in their thesis titled Genetic Algorithm
Based Inventory Optimization Analysis in Supply Chain Management did a research
On Inventory management is one of the significant fields in supply chain management.
Efficient and effective management of inventory throughout the supply chain significantly
improves the ultimate service provided to the customer. Hence there is a necessity of
determining the inventory to be held at different stages in a supply chain so that the total
supply chain cost is minimized. Minimizing the total supply chain cost is meant for
minimizing holding and shortage cost in the entire supply chain. This inspiration of
minimizing Total Supply Chain Cost could be done only by optimizing the base stock level at
each member of the supply chain. The dilemma occurring here is that the excess stock level
and shortage level is very dynamic for every period. In this paper, we have developed a novel
and efficient approach using Genetic Algorithm which clearly determines the most possible
excess stock level and shortage level that is needed for inventory optimization in the supply
chain so as to minimize the total supply chain cost.
Dawn Barnes-Schuster, Yehuda Bassok, Ravi Anupindi in their thesis titled Optimizing
delivery lead time/inventory placement in a two-stage production/distribution system In
this paper we study a system composed of a supplier and buyer(s). We assume that the buyer
faces random demand with a known distribution function. The supplier faces a known
production lead time. The main objective of this study is to determine the optimal delivery
lead time and the resulting location of the system inventory. In a system with a single-
supplier and a single-buyer it is shown that system inventory should not be split between a
buyer and supplier. Based on system parameters of shortage and holding costs, production
lead times, and standard deviations of demand distributions, conditions indicating when the
supplier or buyer(s) should keep the system inventory are derived. The impact of changes to
these parameters on the location of system inventory is examined. For the case with multiple
buyers, it is found that the supplier holds inventory for the buyers with the smallest standard
deviations, while the buyers with the largest standard deviations hold their own inventory.
24
J F Dong, L H Wang, J X Wang in their thesis titled Research on reverse logistics-
oriented multi sources inventory control modelto improve enterprise inventory control
strategy and optimize control parameters of inventory including external and interior reverse
logistics, through applying periods' inventory checking strategy, a multi-sources inventory
control model helpful to simulate the real logistics operations was proposed. Based on the
arrival time of returned products following Poisson distribution, the returns production with
lot-size processing method and the nonzero lead time of a rational cost function of inventory
control was established. Then the genetic algorithm was used to solve the inventory cost
function so as to obtain the optimum solution of inventory checking periods, safe inventory
point, production lot-sizes and processing lot-sizes of returns production. An example was
presented to prove the feasibility and validity of the proposed method, and the proposed
model can help the enterprises to implement multisource inventory control strategy.
Stefan Minner Multiple-supplier inventory models in supply chain management:This
paper reviews inventory models with multiple supply options and discusses their contribution
to supply chain management. After discussing strategic aspects of supplier competition and
the role of operational flexibility in global sourcing, inventory models which use several
suppliers in order to avoid or reduce the effects of shortage situations are outlined. Further,
related inventory problems from the fields of reverse logistics and multi-echelon systems are
presented. Finally, issues for future research and a synthesis of available supply chain
management and multiple supplier inventory models are discussed.
R D H Warburton, in their thesis titled An exact analytical solution to the production
inventory control problem The full set of continuous, differential delay equations
describing the inventory and orders for a typical industrial production control system are
solved exactly for a step function surge in demand. The replenishment delay is explicitly
included. The order rate is tuned with three parameters, which modulate the demand
smoothing, the recovery of the inventory deficit, and the desired level of work-in-process.
The analytical solutions are validated by comparison with numerical integration and confirm
the instabilities and inventory deficits found elsewhere. Useful management strategies can be
deduced, and the approach should be widely applicable in supply chains. 2003 Elsevier B.V.
All rights reserved.
25

Keenan D Yoho, James A Rappold in their thesis titled Beyond lean : Production and
inventory policy for the old economy Lean manufacturing has fundamentally changed the
way business leaders think about the production of manufactured goods and services. Over
the past three decades, firms have dedicated considerable resources to reducing production
setup times, shrinking inventories, and organizing work into cellular flows. Discrete parts
manufacturing has benefited from production planning schemes that smooth production and
level- load the plant to reduce idle time and overtime. But in the process industries, where
production occurs 24 hours a day, seven days a week, what does it mean to level-load the
production facility? In those industries, capacity stabilization is defined as creating
production cycles that are predictable, and level-loading consists of stabilizing manufacturing
lead times. In this article, we describe the differences between what we call inventory-centric
versus capacity-centric modes of production and inventory control, and we present data
collected from a large chemical plant operation that illustrates a mismatch between inventory
policy and capacity characteristics. We also describe policies appropriate for old economy
firms in the face of increasing consolidation and pressures to reduce costs and increase
responsiveness
J F A B Zhao, in their titledA New Kind Of Supply Chain Management Inventory
Optimization Model Based On Cooperation And Coordination Mechanisms did a
research on Cooperation and coordination problem is one of the main problems of supply
chain inventory optimization controlling currently. The MTP (matter, thing and people)
ideology was introduced and used to optimize the traditional F.Harris inventory model. On
this basis, a new kind of supply chain management inventory optimization batch Elasticity
model based on cooperation and coordination mechanisms was established. Optimizing
results were analysed through batch flexibility theory based on coordination mechanisms. A
new and feasible method to optimize inventory management was provided. In this thesis, the
inventory optimization problems were discussed from the quantitative study perspective
andbased on cooperation and coordination mechanisms using MTP ideology and combining
with F.Harris inventory model.
26
Ibeas A Herrera J Vilanova R Garcia C A, in their thesis titled A New Kind Of Supply
Chain Management Inventory Optimization Model Based On Cooperation And
Coordination Mechanisms did a research on inventory management, In this paper, an
Internal Model Control (IMC) scheme is incorporated in production inventory control
systems in a complete supply chain. This control scheme presents a good target inventory
tracking under the perfect knowledge of the system. Furthermore, the inventory tracking and
load disturbance rejection control problems can be tackled separately.
However, the closed-loop performance of the IMC scheme may be degraded due to a
mismatch between the modelled and actual delay or to the fact that delays may be time-
varying. Thus, the IMC control scheme is enhanced in this work with a novel method for the
online identification of lead times based on a multimodel scheme. In this way, all benefits of
the IMC scheme can be exploited. A detailed discussion of the proposed production inventory
system is provided including stability and performance analysis as well as the identification
capabilities of the algorithm. Several simulation examples illustrate the efficiency of the
approach
D L Olson, M Xie, in their thesis titled A Comparison Of Coordinated Supply Chain
Inventory Management System did a research on Supply chain operations are widely
used, as they have proven very effective in contemporary business environments. Traditional
supply chain coordination has suffered from well-known bullwhip effects, which have been
alleviated in part through greater information exchange from Efficient Consumer Response
(ECR) and more coordinated systems such as Vendor-Managed Inventory (VMI). The
refinements of VMI include Continuous Replenishment (CR) and Collaborative Planning,
Forecasting and Replenishment (CPFR). This paper reviews the definitions of these variant
supply chain inventory management systems. Simulation studies of VMI have studied the
expected impact on supply chain operations. This paper evaluates the relative benefits and
costs of alternative supply chain inventory systems and provides an analysis of the conditions
for which coordinated inventory management systems are appropriate.
Huafei Chen.in their thesis titled Research On Uncertainty Demand Inventory Control
In Supply Chain. did a research on overall operations of supply chain are affected by the
increase of demand uncertainty. Inventory control is an important part in supply chain
management. Under the requirement mentioned above, this paper studies the inventory
control with uncertainty demand. Three-echelon inventory model of manufacture regarded as
27

core enterprise is model, which assumes that uncertainty demand subjects to normal
distribution. Redundancy inventory in the node enterprise of supply chain is discussed under
the two inventory replenishment strategy (continuous review inventory and periodic review
inventory). It 's shown that the result of this study is valuable to reduce the total cost of
inventory and improve the performance of supply chain.
28

3.1 RESEARCH METHODOLOGY
RESEARCH
Research is a process in which the researcher wishes to find out the end result for
the given problems and thus the solutions help in future course of action.
RESEARCH DESIGN
Research design is an arrangement of condition for collection and analysis of data
in a manner that aims to combine relevance to the research purpose with economy in
procedure.
A plan outlining how information is to be gathered for an assessment or evaluation that
includes identifying the data gathering method(s), the instrument to be used/created, how the
instruments will be administered, and how the information will be organized and analysed.
The design used in this study is the analytical research.
NATURE OF THE RESEARCH
ANALYTICAL RESEARCH
In the analytical research, the research uses the facts or information already available
and analysis the existing data to make a critical evaluation of the material. The research
method used for the project involves an analytical research, which has been carried out
respect to the existing system in the company and a critical evaluation of the same is made. In
this type of research has to use facts or information already available, and analyse these to
make a critical evaluation of the material. The researcher depends on existing data for his
research work. The analysis revolves round the material collected/ or available.
SOURCES OF DATA
It is collected from the internal records of the company such as library records, trade journals,
various manuals of the company; it is also conducted from the officials of the pursed
department in the factory. Secondary data provides a better view of the problem study, tools
and other references were also mean important in this study.
29

The data collected for the purpose of this analysis is secondary. Secondary data refer to
information gathered from sources already existing. Some source of secondary data are data
available from previous research, information available from any published or unpublished
sources available either within or outside the organization, library records, online data,
websites and the internet.
There was no need for collecting primary data as the study involves analysis of data
available. The data has been collected through the annual report and statements available with
the company.
ANALYTICAL TOOLS
In order to extract meaningful information from the data collected, the data
analysis is carried out. The analysis is basically aimed at giving inferences of associations or
difference between the various variables present in the research. The data collected was
edited, coded and tabulated for analysis. The analysis can be conducted using analytical tools.
The analytical tools comprise of both statistical and financial tools. In this survey only three
of the statistical tools were used.
TOOLS & TECHNIQUES
To analyse the secondary data:
1. ABC analysis:
Always better control is the technique used for analysing the inventory. The
material are classified and controlled according to the value of the material involved. It is
also called proportional part value analysis.
Thus, high value items are paid more attention that low value items. The material are
classified under A, B or C designation on the basis of their value and importance. A category
consists of a few items of high value. Category B includes more items of medium value and
category C includes all other materials of small value.
30

PARETO CURVE
ABC inventory analysis:
ABC inventory analysis is one of the ways of classifying the inventory. Not all the items have
equal importance and therefore they do not require the same management attention. The ABC
analysis provides you helpful information to evaluate each item and decide the method to
monitor and control it. It is a basic inventory management tool. An ERP (Enterprise Resource
Planning) system also constitutes both ABC analysis and a control mechanism within itself.
Inventory Classification:
With ABC inventory analysis, the inventory is classified into three categories: A, B and C
and each category is given a different treatment:
31

Class A materials – these are usually the most expensive, highly important items and main
raw materials in the production. A class items need tight monitoring and control. They should
be managed by JIT (Just in Time) since its close management is most cost-effective.
Class B materials – these materials are usually the medium expensive items that still require
more control and some management effort. They may not require a micromanagement by
JIT, but they should also be tracked methodically.
Class C materials – these items have low value and lower importance. C class items require
the minimum controls and they generally consist of the largest volume of the inventory. They
are mostly managed by two bin system. When a bin is empty or when the system sends a
signal of reaching a minimum stock level, an order is placed.
ECONOMIC ORDER QUANTITY:
Economic order quantity is referred to as the size of the order that gives maximum economy
in purchasing the materials.
Economic order quantity for Q system:
In this system of inventory, whenever the stock level touches the reorder level, an order is
placed for a fixed quantity which is equal to EOQ.
Economic order quantity for P system:
In this system of inventory, the stock position is reviewed once in a fixed period and an order
is placed depending on the stock position, unlike a fixed quantity in the Q system of
inventory. The review period is approximately equal to EOQ/D.
WS insulators industries using P system for calculating economic order quantity.
32

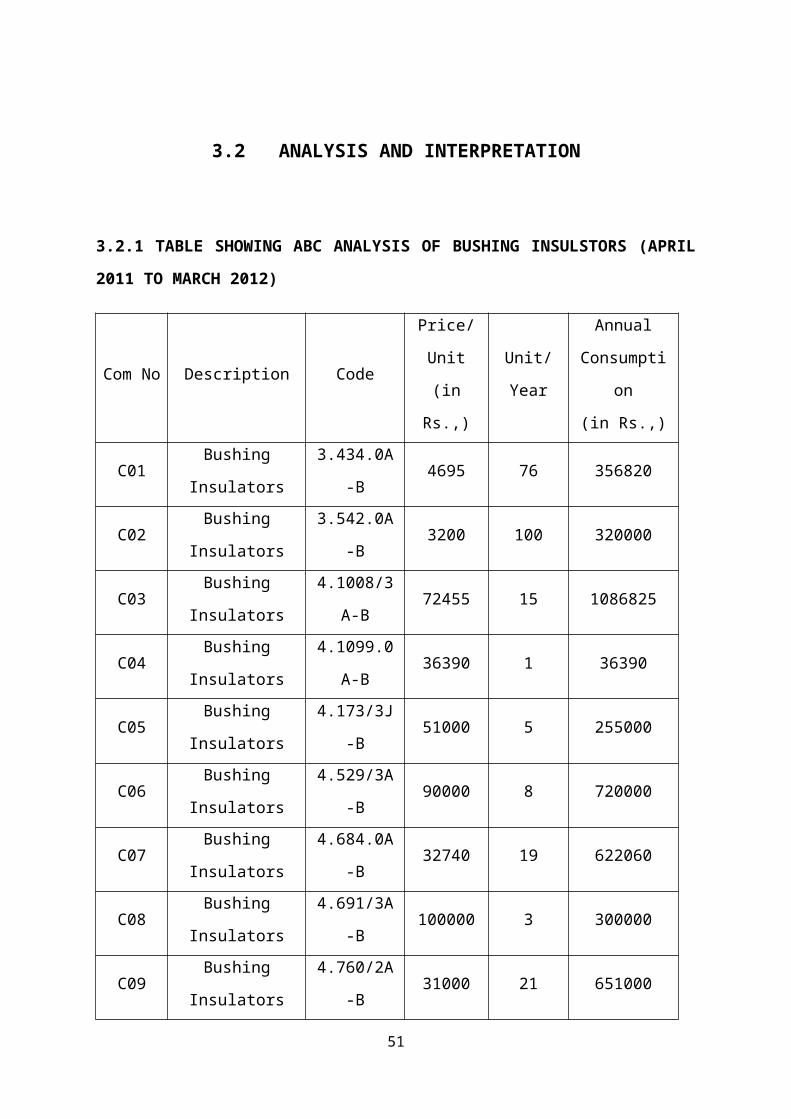
3.2 ANALYSIS AND INTERPRETATION
3.2.1 TABLE SHOWING ABC ANALYSIS OF BUSHING INSULSTORS (APRIL 2011
TO MARCH 2012)
Com No Description CodePrice/Unit
(in Rs.,)Unit/Year
Annual
Consumption
(in Rs.,)
C01 Bushing Insulators 3.434.0A-B 4695 76 356820
C02 Bushing Insulators 3.542.0A-B 3200 100 320000
C03 Bushing Insulators 4.1008/3A-B 72455 15 1086825
C04 Bushing Insulators 4.1099.0A-B 36390 1 36390
C05 Bushing Insulators 4.173/3J-B 51000 5 255000
C06 Bushing Insulators 4.529/3A-B 90000 8 720000
C07 Bushing Insulators 4.684.0A-B 32740 19 622060
C08 Bushing Insulators 4.691/3A-B 100000 3 300000
C09 Bushing Insulators 4.760/2A-B 31000 21 651000
C10 Bushing Insulators 4.935.0A-B 26940 11 296340
C11 Bushing Insulators 4.936.9A-B 29570 12 354840
C12 Bushing Insulators 4.968/3A-B 52433 1 52433
C13 Bushing Insulators 5.3023.0A 3020 15 45300
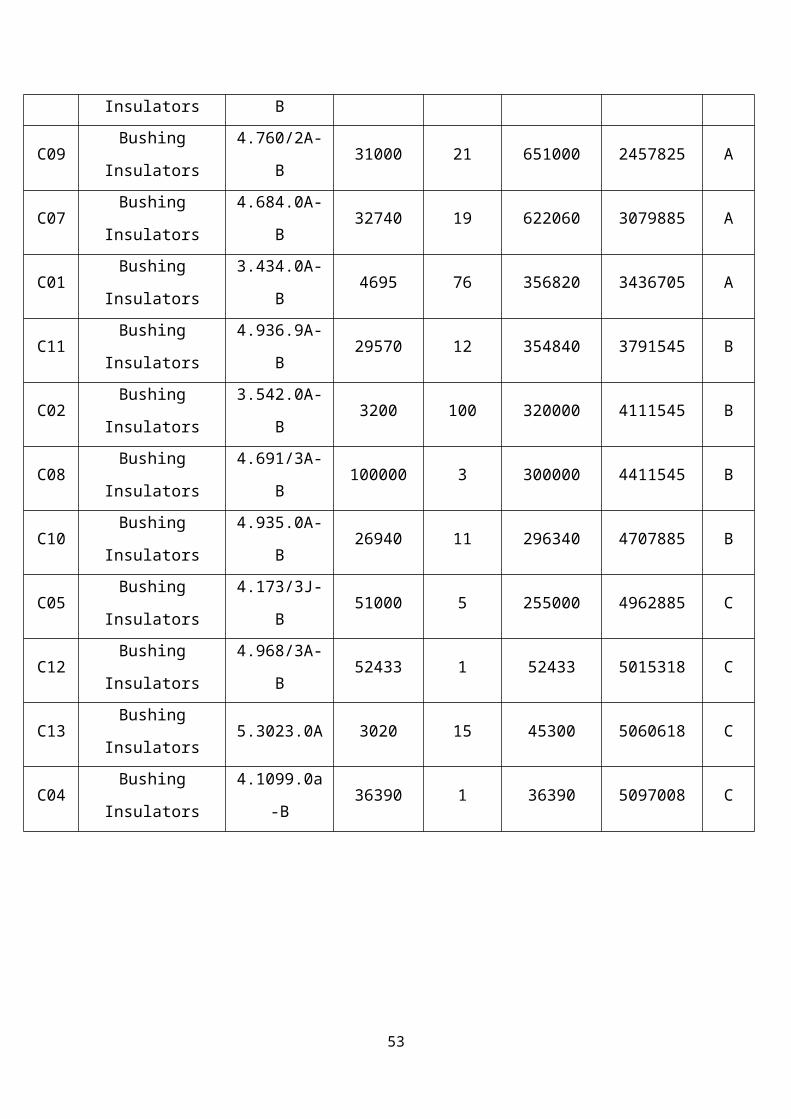
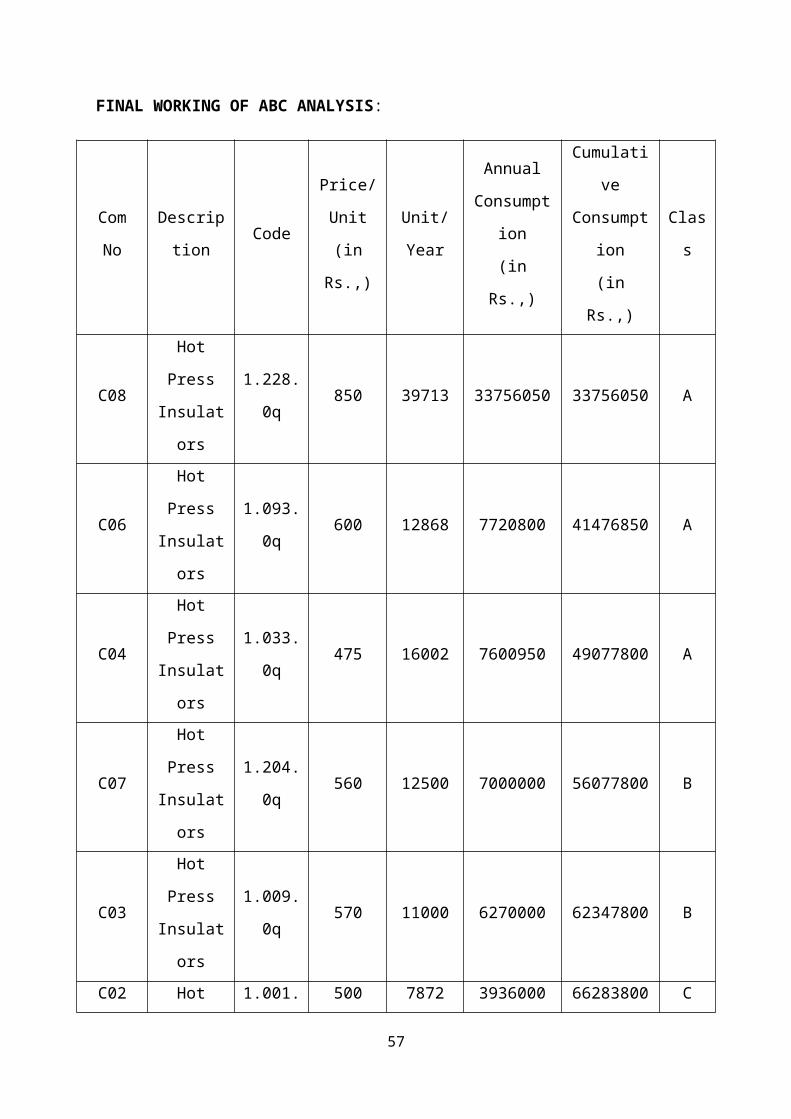
FINAL WORKING OF ABC ANALYSIS:
33

Com
NoDescription Code
Price/Unit
(in Rs.,)Unit/Year
Annual
Consumption
(in Rs.,)
Cumulative
Consumption
(in Rs.,)
Class
C03 Bushing Insulators 4.1008/3A-B 72455 15 1086825 1086825 A
C06 Bushing Insulators 4.529/3A-B 90000 8 720000 1806825 A
C09 Bushing Insulators 4.760/2A-B 31000 21 651000 2457825 A
C07 Bushing Insulators 4.684.0A-B 32740 19 622060 3079885 A
C01 Bushing Insulators 3.434.0A-B 4695 76 356820 3436705 A
C11 Bushing Insulators 4.936.9A-B 29570 12 354840 3791545 B
C02 Bushing Insulators 3.542.0A-B 3200 100 320000 4111545 B
C08 Bushing Insulators 4.691/3A-B 100000 3 300000 4411545 B
C10 Bushing Insulators 4.935.0A-B 26940 11 296340 4707885 B
C05 Bushing Insulators 4.173/3J-B 51000 5 255000 4962885 C
C12 Bushing Insulators 4.968/3A-B 52433 1 52433 5015318 C
C13 Bushing Insulators 5.3023.0A 3020 15 45300 5060618 C
C04 Bushing Insulators 4.1099.0a-B 36390 1 36390 5097008 C
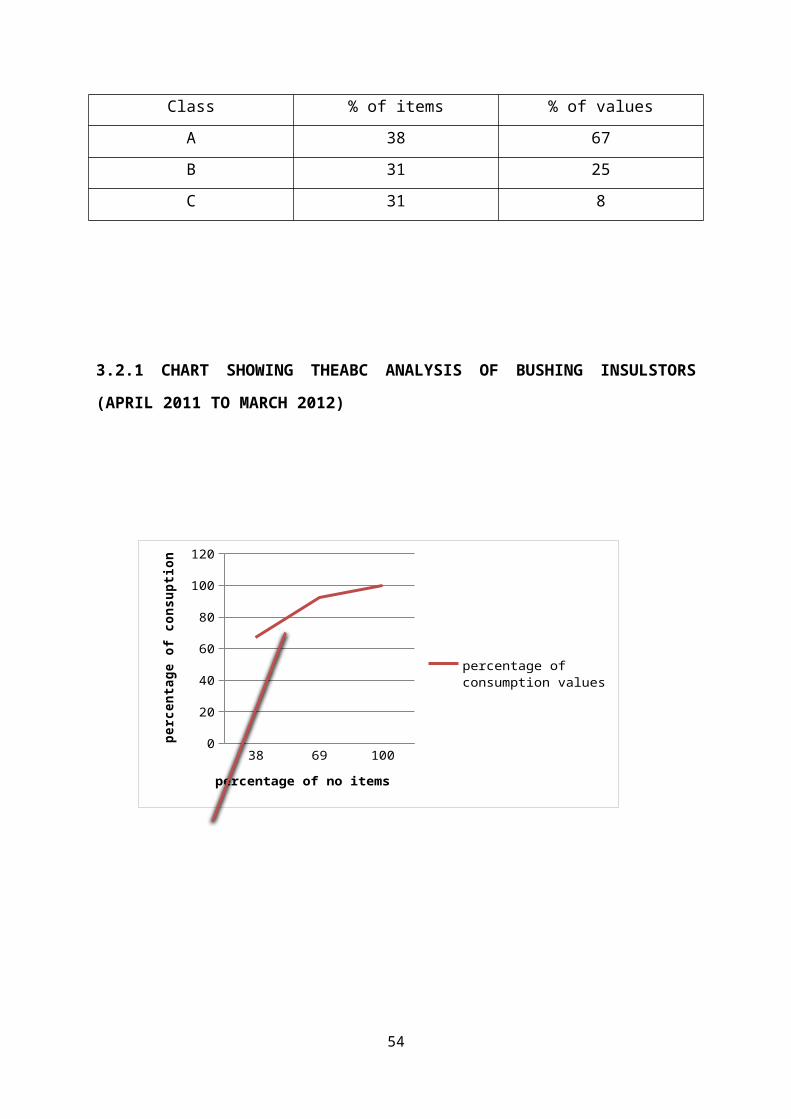
Class % of items % of values
A 38 67
B 31 25
C 31 8
3.2.1 CHART SHOWING THEABC ANALYSIS OF BUSHING INSULSTORS
(APRIL 2011 TO MARCH 2012)
34
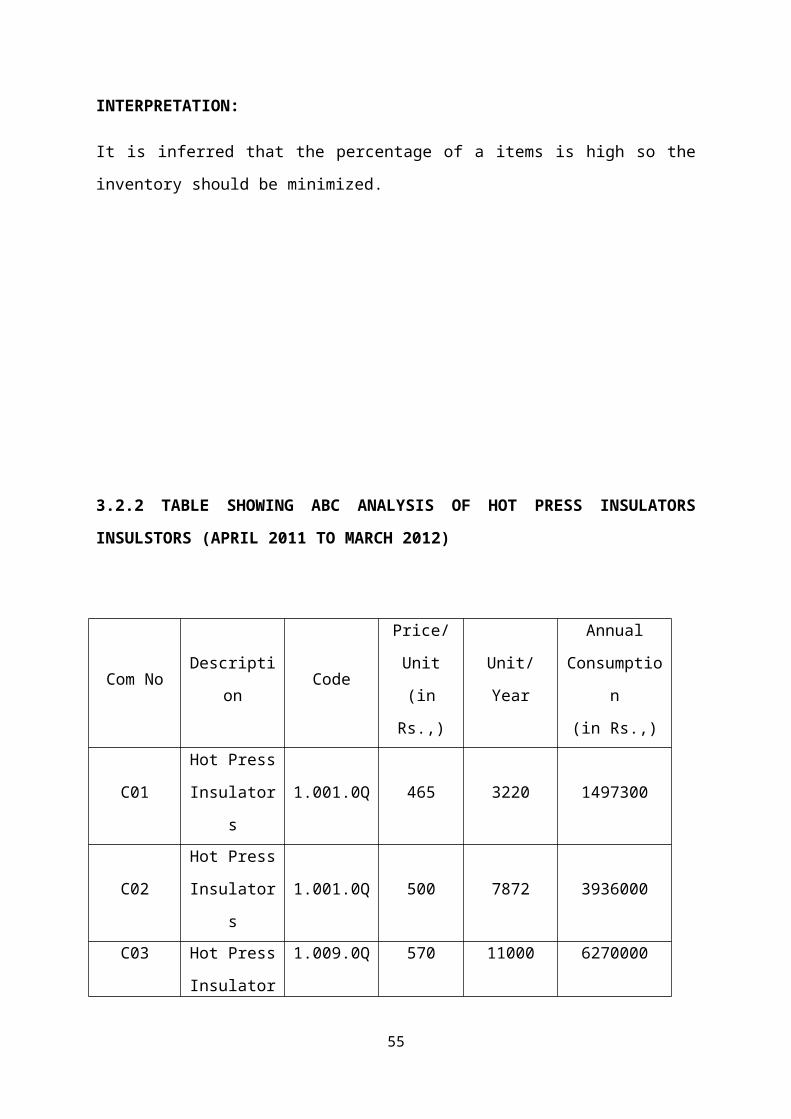
INTERPRETATION:
It is inferred that the percentage of a items is high so the inventory should be minimized.
3.2.2 TABLE SHOWING ABC ANALYSIS OF HOT PRESS INSULATORS
INSULSTORS (APRIL 2011 TO MARCH 2012)
35
38 69 1000
20
40
60
80
100
120
percentage of consumption values
percentage of no items
perc
enta
ge o
f con
supti
on

Com No Description CodePrice/Unit
(in Rs.,)Unit/Year
Annual
Consumption
(in Rs.,)
C01Hot Press
Insulators1.001.0Q 465 3220 1497300
C02Hot Press
Insulators1.001.0Q 500 7872 3936000
C03Hot Press
Insulators1.009.0Q 570 11000 6270000
C04Hot Press
Insulators1.033.0Q 475 16002 7600950
C05Hot Press
Insulators1.059.0Q 400 300 120000
C06Hot Press
Insulators1.093.0Q 600 12868 7720800
C07Hot Press
Insulators1.204.0Q 560 12500 7000000
C08Hot Press
Insulators1.228.0Q 850 39713 33756050
C09Hot Press
Insulators1.256.0Q 350 250 87500
C10Hot Press
Insulators1.289.0Q 1300 668 868400
C11Hot Press
Insulators1.299.0Q 1550 1801 2791550
36

FINAL WORKING OF ABC ANALYSIS:
Com NoDescriptio
nCode
Price/
Unit
(in Rs.,)
Unit/
Year
Annual
Consumptio
n
(in Rs.,)
Cumulative
Consumptio
n
(in Rs.,)
Class
C08Hot Press
Insulators1.228.0q 850 39713 33756050 33756050 A
C06Hot Press
Insulators1.093.0q 600 12868 7720800 41476850 A
C04Hot Press
Insulators1.033.0q 475 16002 7600950 49077800 A
C07Hot Press
Insulators1.204.0q 560 12500 7000000 56077800 B
C03Hot Press
Insulators1.009.0q 570 11000 6270000 62347800 B
C02Hot Press
Insulators1.001.0q 500 7872 3936000 66283800 C
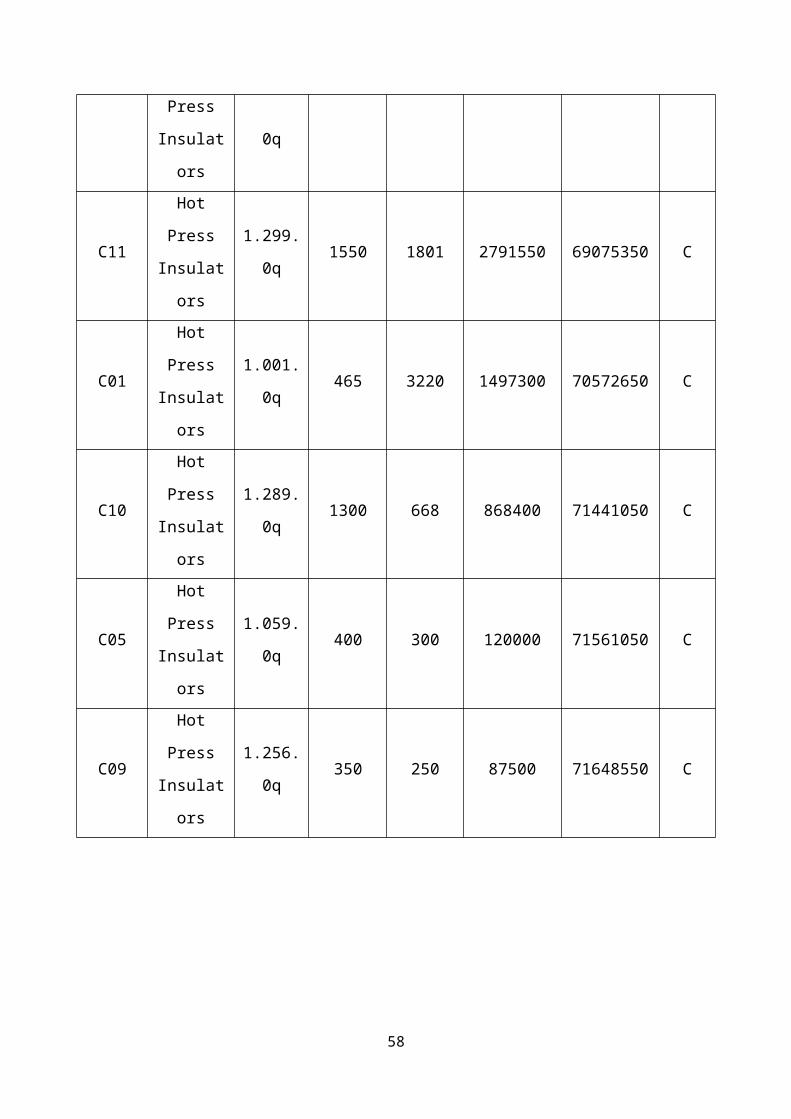
C11Hot Press
Insulators1.299.0q 1550 1801 2791550 69075350 C
C01Hot Press
Insulators1.001.0q 465 3220 1497300 70572650 C
C10Hot Press
Insulators1.289.0q 1300 668 868400 71441050 C
C05Hot Press
Insulators1.059.0q 400 300 120000 71561050 C
C09Hot Press
Insulators1.256.0q 350 250 87500 71648550 C
37
Class Percentage of items Percentage of values
A 27 68
B 19 19
C 54 13
3.2.2 CHART SHOWING ABC ANALYSIS OF HOT PRESS INSULATORS
INSULSTORS (APRIL 2011 TO MARCH 2012)
27 45 1000
20
40
60
80
100
120
percentage of consump-tion values
percentage of no items
perc
enta
ge o
f con
supti
on
INTERPRETATION:
It is inferred that the percentage of a items is high so the inventory should be minimized.
38

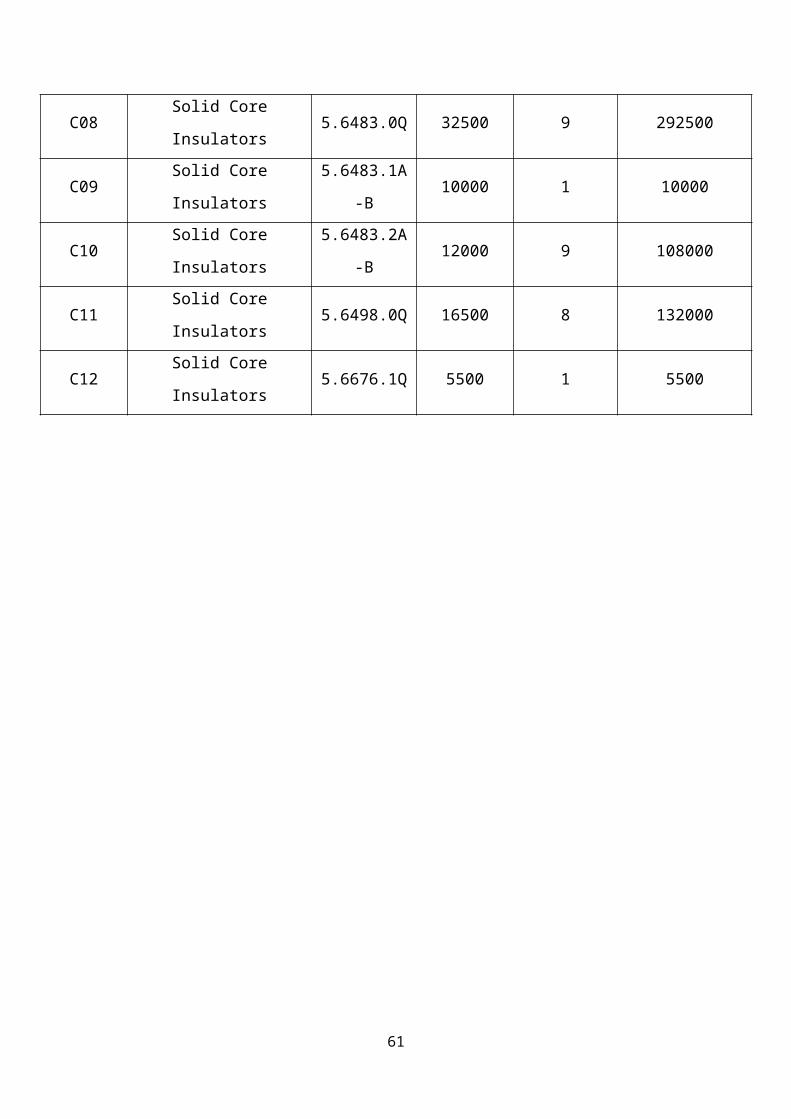
3.2.3 TABLE SHOWING ABC ANALYSIS OF SOLID CORE INSULATORS
INSULSTORS (APRIL 2011 TO MARCH 2012)
Com No Description CodePrice/Unit
(in Rs.,)Unit/Year
Annual
Consumption
(in Rs.,)
C01 Solid Core Insulators 5.6080.0Q 5500 23 126500
C02 Solid Core Insulators 5.6102.0Q 8000 1 8000
C03 Solid Core Insulators 5.6105.0Q 12750 18 229500
C04 Solid Core Insulators 5.6264.0Q 16000 72 1152000
C05 Solid Core Insulators 5.6401.0Q 45000 36 1620000
C06 Solid Core Insulators 5.6446.0Q 5500 4 22000
C07 Solid Core Insulators 5.6464.1Q 6700 9 60300
C08 Solid Core Insulators 5.6483.0Q 32500 9 292500
C09 Solid Core Insulators 5.6483.1A-B 10000 1 10000
C10 Solid Core Insulators 5.6483.2A-B 12000 9 108000
C11 Solid Core Insulators 5.6498.0Q 16500 8 132000
C12 Solid Core Insulators 5.6676.1Q 5500 1 5500
39
FINAL WORKING OF ABC ANALYSIS:
Com No Description Code
Price/
Unit
(in Rs.,)
Unit/Year
Annual
Consumption
(in Rs.,)
Cumulative
Consumptio
n
(in Rs.,)
Clas
s
C05Solid Core
Insulators5.6401.0Q 45000 36 1620000 1620000 A
C04Solid Core
Insulators5.6264.0Q 16000 72 1152000 2772000 A
C08Solid Core
Insulators5.6483.0Q 32500 9 292500 3064500 B
C03Solid Core
Insulators5.6105.0Q 12750 18 229500 3294000 B
C11Solid Core
Insulators5.6498.0Q 16500 8 132000 3426000 B
C01Solid Core
Insulators5.6080.0Q 5500 23 126500 3552500 B
C10Solid Core
Insulators5.6483.2A-B 12000 9 108000 3660500 C
C07Solid Core
Insulators5.6464.1Q 6700 9 60300 3720800 C
C06Solid Core
Insulators5.6446.0Q 5500 4 22000 3742800 C
C09Solid Core
Insulators5.6483.1A-B 10000 1 10000 3752800 C
C02Solid Core
Insulators5.6102.0Q 8000 1 8000 3760800 C
C12Solid Core
Insulators5.6676.1Q 5500 1 5500 3766300 C
40

Class Percentage of items Percentage of values
A 16 73
B 34 21
C 50 06
3.2.3 CHART SHOWING ABC ANALYSIS OF SOLID CORE INSULATORS
INSULSTORS (APRIL 2011 TO MARCH 2012)
INTERPRETATION:
It is inferred that the percentage of a items is high so the inventory should be minimized.
41
16 50 1000
20
40
60
80
100
120
percentage of consumption values
percentage of no items
perc
enta
ge o
f con
supti
on

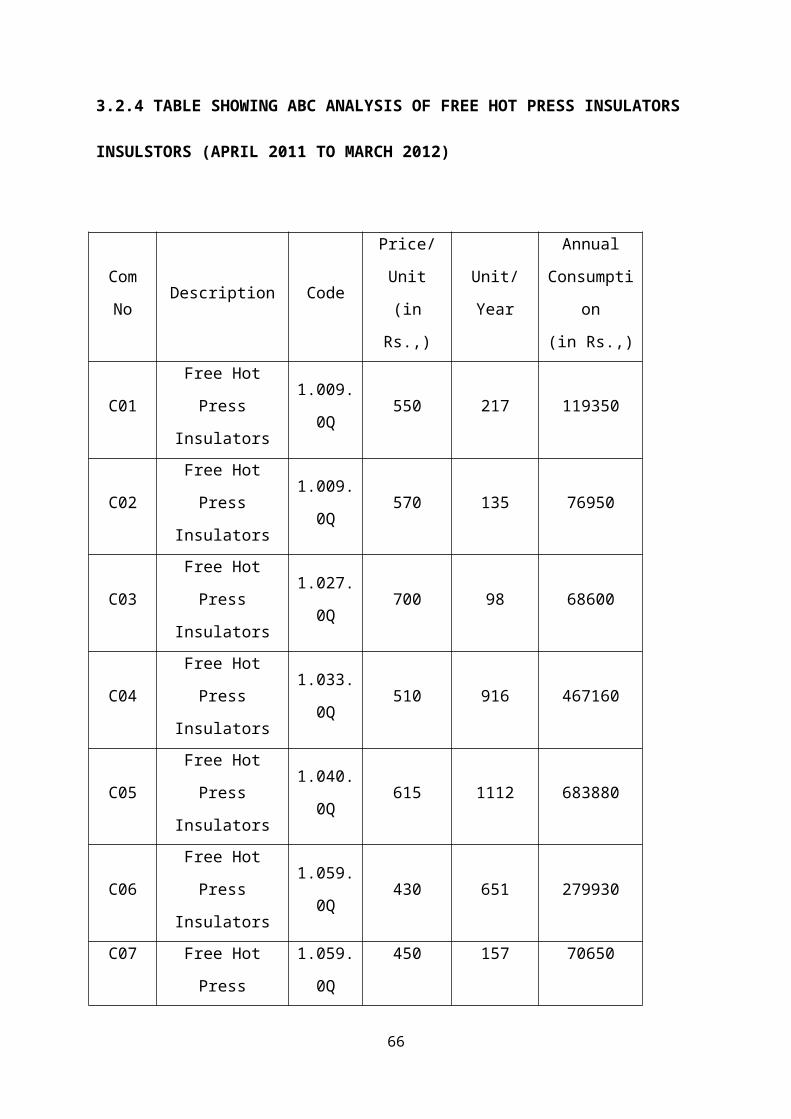
3.2.4 TABLE SHOWING ABC ANALYSIS OF FREE HOT PRESS INSULATORS
INSULSTORS (APRIL 2011 TO MARCH 2012)
Com
NoDescription Code
Price/Unit
(in Rs.,)Unit/Year
Annual
Consumption
(in Rs.,)
C01Free Hot Press
Insulators1.009.0Q 550 217 119350
C02Free Hot Press
Insulators1.009.0Q 570 135 76950
C03Free Hot Press
Insulators1.027.0Q 700 98 68600
C04Free Hot Press
Insulators1.033.0Q 510 916 467160
C05Free Hot Press
Insulators1.040.0Q 615 1112 683880
C06Free Hot Press
Insulators1.059.0Q 430 651 279930
C07Free Hot Press
Insulators1.059.0Q 450 157 70650
C08Free Hot Press
Insulators1.064.0Q 775 263 203825
C09Free Hot Press
Insulators1.228.0Q 925 6 5550
42

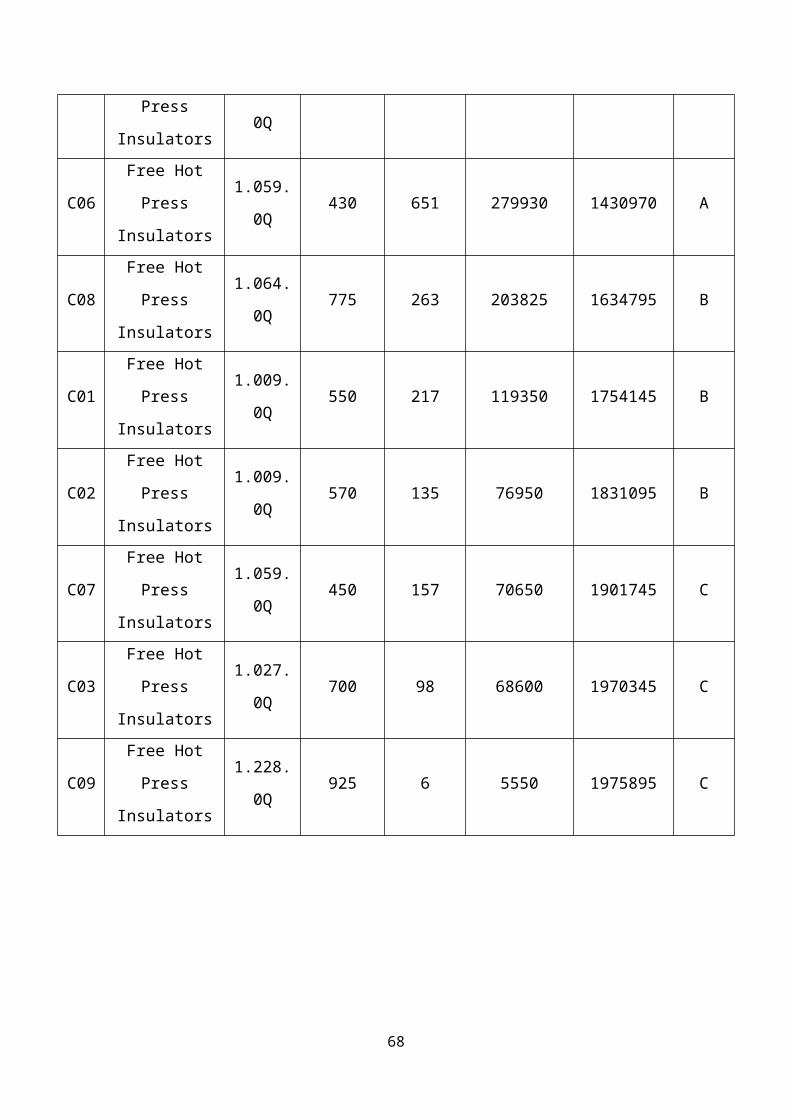
FINAL WORKING OF ABC ANALYSIS:
Com
NoDescription Code
Price/Unit
(in Rs.,)Unit/Year
Annual
Consumption
(in Rs.,)
Cumulative
Consumptio
n
(in Rs.,)
Class
C05Free Hot Press
Insulators1.040.0Q 615 1112 683880 683880 A
C04Free Hot Press
Insulators1.033.0Q 510 916 467160 1151040 A
C06Free Hot Press
Insulators1.059.0Q 430 651 279930 1430970 A
C08Free Hot Press
Insulators1.064.0Q 775 263 203825 1634795 B
C01Free Hot Press
Insulators1.009.0Q 550 217 119350 1754145 B
C02Free Hot Press
Insulators1.009.0Q 570 135 76950 1831095 B
C07Free Hot Press
Insulators1.059.0Q 450 157 70650 1901745 C
C03Free Hot Press
Insulators1.027.0Q 700 98 68600 1970345 C
C09Free Hot Press
Insulators1.228.0Q 925 6 5550 1975895 C
Class Percentage of items Percentage of values
43

A 34 72
B 33 20
C 33 08
3.2.4 CHART SHOWING ABC ANALYSIS OF FREE HOT PRESS INSULATORS
INSULSTORS (APRIL 2011 TO MARCH 2012)
INTERPRETATION:
It is inferred that the percentage of a items is high so the inventory should be minimized.
44
34 67 1000
20
40
60
80
100
120
percentage of consumption values
percentage of no items
perc
enta
ge o
f con
supti
on
34 67 1000
20
40
60
80
100
120
percentage of consumption values
percentage of no items
perc
enta
ge o
f con
supti
on
3.2.5 TABLE SHOWING ABC ANALYSIS OF VAP INSULATORS INSULSTORS
(APRIL 2011 TO MARCH 2012)
Com No Description Code
Price/
Unit
(in Rs.,)
Unit/
Year
Annual
Consumption
(in Rs.,)
C01 VAP Insulators 1.009.0Q 550 93392 51365600
C02 VAP Insulators 1.014.0Q 225 3072 691200
C03 VAP Insulators 1.025.0Q 534 1843 984162
C04 VAP Insulators 1.027.0Q 700 31000 21700000
C05 VAP Insulators 1.059.0Q 400 60 24000
C06 VAP Insulators 1.064.0Q 775 30000 23250000
C07 VAP Insulators 1.074.0Q 255 4953 1263015
C08 VAP Insulators 1.093.0Q 550 1100 605000
C09 VAP Insulators 1.168.0Q 655 995 651725
C10 VAP Insulators 1.204.0Q 500 66 33000
C11 VAP Insulators 1.256.0Q 350 69 24150
C12 VAP Insulators 1.351.0Q 180 640 115200
C13 VAP Insulators 1.355.0Q 515 120 61800
C14 VAP Insulators 1.377.0Q 33 7584 250272
FINAL WORKING OF ABC ANALYSIS.
45
Com
NoDescription Code
Price/Unit
(In Rs.,)Unit/Year
Annual
Consumption
(in Rs.,)
Cumulative
Consumptio
n
(in Rs.,)
Class
C01VAP
INSULATORS1.009.0Q 550 93392 51365600 51365600 A
C06VAP
INSULATORS1.064.0Q 775 30000 23250000 74615600 A
C04VAP
INSULATORS1.027.0Q 700 31000 21700000 96315600 B
C07VAP
INSULATORS1.074.0Q 255 4953 1263015 97578615 C
C03VAP
INSULATORS1.025.0Q 534 1843 984162 98562777 C
C02VAP
INSULATORS1.014.0Q 225 3072 691200 99253977 C
C09VAP
INSULATORS1.168.0Q 655 995 651725 99905702 C
C08VAP
INSULATORS1.093.0Q 550 1100 605000 100510702 C
C14VAP
INSULATORS1.377.0Q 33 7584 250272 100760974 C
C12VAP
INSULATORS1.351.0Q 180 640 115200 100876174 C
C13VAP
INSULATORS1.355.0Q 515 120 61800 100937974 C
C10VAP
INSULATORS1.204.0Q 500 66 33000 100970974 C
C11VAP
INSULATORS1.256.0Q 350 69 24150 100995124 C
C05VAP
INSULATORS1.059.0Q 400 60 24000 101019124 C
46
Class Percentage of items Percentage of values
A 14 73
B 07 22
C 79 05
3.2.5 CHART SHOWING ABC ANALYSIS OF VAP INSULATORS INSULSTORS
(APRIL 2011 TO MARCH 2012)
INTERPRETATION:
It is inferred that the percentage of a items is high so the inventory should be minimized.
47
38 69 1000
20
40
60
80
100
120
percentage of consumption values
percentage of no items
perc
enta
ge o
f con
supti
on
38 69 1000
20
40
60
80
100
120
percentage of consumption values
percentage of no items
perc
enta
ge o
f con
supti
on
38 69 1000
20
40
60
80
100
120
percentage of consumption values
percentage of no items
perc
enta
ge o
f con
supti
on
14 21 1000
20
40
60
80
100
120
percentage of consumption values
percentage of no items
perc
enta
ge o
f con
supti
on
38 69 1000
20
40
60
80
100
120
percentage of consumption values
percentage of no items
perc
enta
ge o
f con
supti
on
38 69 1000
20
40
60
80
100
120
percentage of consumption values
percentage of no items
perc
enta
ge o
f con
supti
on
38 69 1000
20
40
60
80
100
120
percentage of consumption values
percentage of no items
perc
enta
ge o
f con
supti
on
14 21 1000
20
40
60
80
100
120
percentage of consumption values
percentage of no items
perc
enta
ge o
f con
supti
on

3.2.6 TABLE SHOWING EOQ VALUES FOR THAN CLAY
(APRIL 2011 TO MARCH 2012)
S
NO
DESCRIP
TION
DEM
AND
IN
TONS
ORDER
ING
COST
PER
ORDER
CARRIY
ING
COST
PER
UNIT
PER
YEAR
PURCH
ASE
PRICE
PER
UNIT
1THAN
CLAY450 400 15% 575
CALCULATION OF EOQ MODEL (P SYSTEM)
Annual demand, D = 450
Ordering cost per order = Rs.400.
Purchase price per unit = Rs.575.
Carrying cost per unit year = 15% of the purchase price
Economic Order Quantity = √ 2coDP∗%CC
Economic Order Quantity = 65
48

DETERMINATION OF MAXIMUM INVENTORY LEVEL FOR P SYSTEM
Review period = EOQ/D
=0.144 year
=7.51 weeks
The review period can be either 7 weeks or 8 weeks.
Selection of review period:
Total cost when the review period = 7 week:
Total cost = ordering cost + carrying cost
= (52/7) * 400 +( 45052
∗7)/2*575*.15
= 2971 +2612 = 5583
Total cost when the review period = 8 week:
Total cost = ordering cost + carrying cost
= (52/8) * 400 +( 45052
∗8)/2*575*.15
= 2600 +2985 = 5585
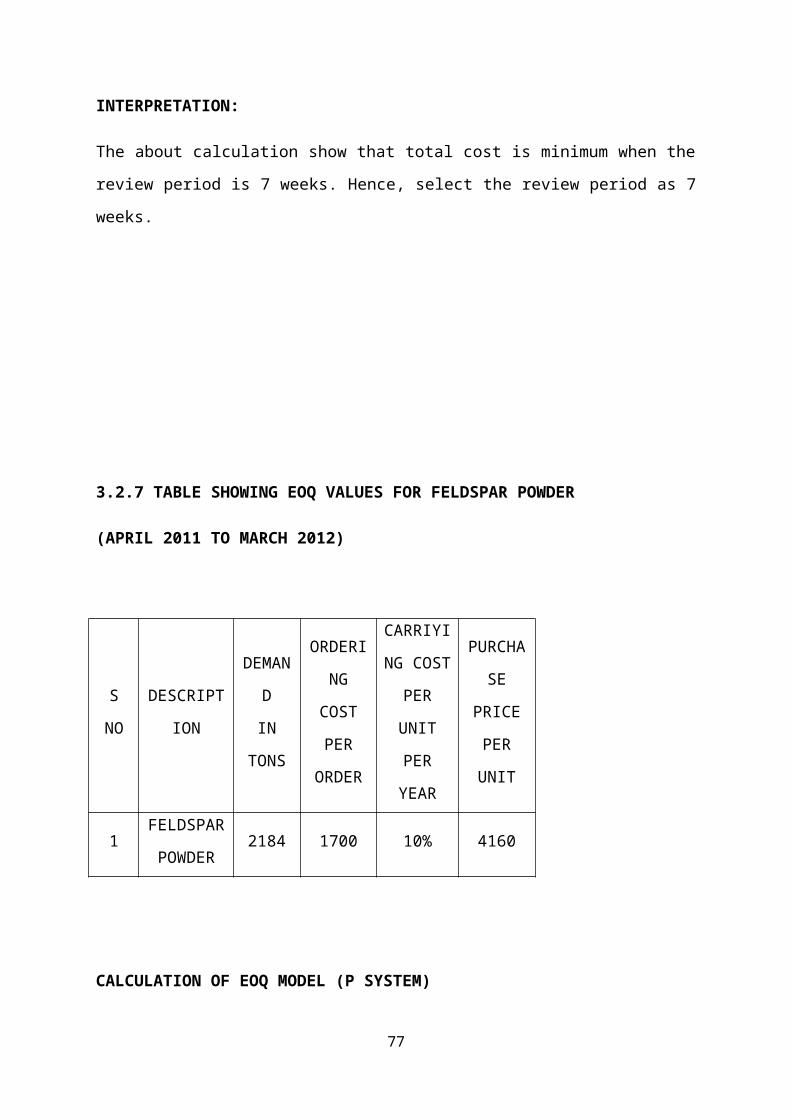
INTERPRETATION:
The about calculation show that total cost is minimum when the review period is 7 weeks.
Hence, select the review period as 7 weeks.
49

3.2.7 TABLE SHOWING EOQ VALUES FOR FELDSPAR POWDER
(APRIL 2011 TO MARCH 2012)
S NODESCRIPT
ION
DEMA
ND
IN
TONS
ORDERI
NG
COST
PER
ORDER
CARRIYI
NG
COST
PER
UNIT
PER
YEAR
PURCH
ASE
PRICE
PER
UNIT
1FELDSPAR
POWDER2184 1700 10% 4160
CALCULATION OF EOQ MODEL (P SYSTEM)
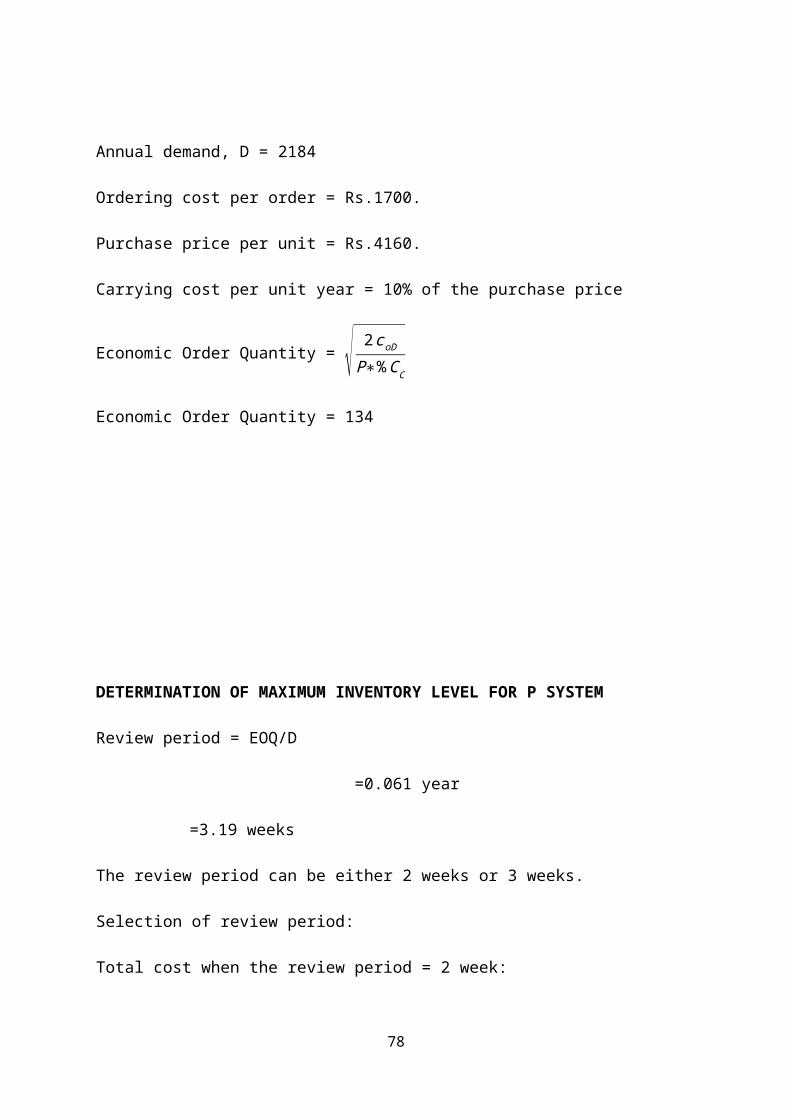
Annual demand, D = 2184
Ordering cost per order = Rs.1700.
Purchase price per unit = Rs.4160.
Carrying cost per unit year = 10% of the purchase price
Economic Order Quantity = √ 2coDP∗%CC
Economic Order Quantity = 134
50
DETERMINATION OF MAXIMUM INVENTORY LEVEL FOR P SYSTEM
Review period = EOQ/D
=0.061 year
=3.19 weeks
The review period can be either 2 weeks or 3 weeks.
Selection of review period:
Total cost when the review period = 2 week:
Total cost = ordering cost + carrying cost
= (52/2) * 1700 +( 218452
∗2)/2*4160*.10
= 44200 + 17472 = 61672
Total cost when the review period = 3 week:
Total cost = ordering cost + carrying cost
= (52/3) * 1700 +( 218452
∗3)/2*4160*.10
= 29466 +26208 = 55674
INTERPRETATION:
The about calculation show that total cost is minimum when the review period is 3 weeks.
Hence, select the review period as 3 weeks
51

3.2.8 TABLE SHOWING EOQ VALUES FOR QUARTZ POWDER
(APRIL 2011 TO MARCH 2012)
S
NO
DESCRIPT
ION
DEMA
ND
IN
TONS
ORDERI
NG
COST
PER
ORDER
CARRIY
ING
COST
PER
UNIT
PER
YEAR
PURCH
ASE
PRICE
PER
UNIT
1QUARTZ
POWDER2112 2000 10% 5096
CALCULATION OF EOQ MODEL (P SYSTEM)
Annual demand, D = 2112
Ordering cost per order = Rs.2000.
Purchase price per unit = Rs.5096.
Carrying cost per unit year = 10% of the purchase price
52
Economic Order Quantity = √ 2coDP∗%CC
Economic Order Quantity = 128
DETERMINATION OF MAXIMUM INVENTORY LEVEL FOR P SYSTEM
Review period = EOQ/D
=0.060 year
=3.15 weeks
The review period can be either 2 weeks or 3 weeks.
Selection of review period:
Total cost when the review period = 2 week:
Total cost = ordering cost + carrying cost
= (52/2) * 2000 +( 211252
∗2)/2*5096*.10
= 52000 +20697 = 72697
Total cost when the review period = 3 week:
Total cost = ordering cost + carrying cost
= (52/3) * 2000 +( 211252
∗3)/2*5096*.10
= 34667+31046 = 65713.
INTERPRETATION:
53
The about calculation show that total cost is minimum when the review period is 3 weeks.
Hence, select the review period as 3 weeks
54
3.2.9 TABLE SHOWING EOQ VALUES FOR PLASTER OF PARIS
(APRIL 2011 TO MARCH 2012)
S
NO
DESCRIPT
ION
DEMA
ND IN
TONS
ORDERI
NG
COST
PER
ORDER
CARRIY
ING
COST
PER
UNIT
PER
YEAR
PURCH
ASE
PRICE
PER
UNIT
1PLASTER
OF PARIS120 400 15% 6000
CALCULATION OF EOQ MODEL (P SYSTEM)
Annual demand, D = 120
Ordering cost per order = Rs.400.
Purchase price per unit = Rs.6000.
Carrying cost per unit year = 15% of the purchase price
Economic Order Quantity = √ 2coDP∗%CC
Economic Order Quantity = 10
55

DETERMINATION OF MAXIMUM INVENTORY LEVEL FOR P SYSTEM
Review period = EOQ/D
=0.083 year
=4.33 weeks
The review period can be either 3 weeks or 4 weeks.
Selection of review period:
Total cost when the review period = 3 week:
Total cost = ordering cost + carrying cost
= (52/3) * 400 +( 12052
∗3)/2*6000*.15
= 6934+3115= 10049
Total cost when the review period = 4 week:
Total cost = ordering cost + carrying cost
= (52/4) * 400 +( 12052
∗4)/2*6000*.15
= 5200+4154= 9354
INTERPRETATION:
The about calculation show that total cost is minimum when the review period is 4 weeks.
Hence, select the review period as 4 weeks
56
57
3.2.10 TABLE SHOWING EOQ VALUES FOR LILITE CHINA CLAY
(APRIL 2011 TO MARCH 2012)
S
NO
DESCRIPT
ION
DEMA
ND IN
TONS
ORDERI
NG
COST
PER
ORDER
CARRIYI
NG
COST
PER
UNIT
PER
YEAR
PURCH
ASE
PRICE
PER
UNIT
1
LILITE
CHINA
CLAY
7200 4000 5% 5200
CALCULATION OF EOQ MODEL (P SYSTEM)
Annual demand, D = 7200
Ordering cost per order = Rs.4000.
Purchase price per unit = Rs.5200.
Carrying cost per unit year = 5% of the purchase price
Economic Order Quantity = √ 2coDP∗%CC
Economic Order Quantity = 470
58

59

DETERMINATION OF MAXIMUM INVENTORY LEVEL FOR P SYSTEM
Review period = EOQ/D
=0.065 year
=3.39 weeks
The review period can be either 2 weeks or 3 weeks.
Selection of review period:
Total cost when the review period = 2 week:
Total cost = ordering cost + carrying cost
= (52/2) * 4000 +( 720052
∗2)/2*5200*.05
= 104000+36000= 140000
Total cost when the review period = 3 week:
Total cost = ordering cost + carrying cost
= (52/3) * 4000 +( 720052
∗3)/2*5200*.05
= 69334+54000= 123334
INTERPRETATION:
The about calculation show that total cost is minimum when the review period is 3 weeks.
Hence, select the review period as 3 weeks
60
61

3.2.11 TABLE SHOWING EOQ VALUES FOR CHINA CLAY(ORISSA)
(APRIL 2011 TO MARCH 2012 )
S NODESCRIPTI
ON
DEMA
ND IN
TONS
ORDERI
NG
COST
PER
ORDER
CARRIYI
NG
COST
PER
UNIT
PER
YEAR
PURCH
ASE
PRICE
PER
UNIT
1
CHINA
CLAY(ORI
SSA)
1360 1000 10% 2800
CALCULATION OF EOQ MODEL (P SYSTEM).
Annual demand, D = 1360
Ordering cost per order = Rs.1000.
Purchase price per unit = Rs.2800.
Carrying cost per unit year = 10% of the purchase price
Economic Order Quantity = √ 2coDP∗%CC
62

Economic Order Quantity = 99
63

DETERMINATION OF MAXIMUM INVENTORY LEVEL FORP SYSTEM.
Review period = EOQ/D
=0.072 year
=3.78 weeks
The review period can be either 3 weeks or 4 weeks.
Selection of review period:
Total cost when the review period = 3 week:
Total cost = ordering cost + carrying cost
= (52/3) * 1000 +( 136052
∗3)/2*2800*.10
= 17334+10984 = 28318
Total cost when the review period = 4 week:
Total cost = ordering cost + carrying cost
= (52/4) * 1000 +( 136052
∗4)/2*2800*.10
= 13000+14646 = 27646
INTERPRETATION:
The about calculation show that total cost is minimum when the review period is 4 weeks.
Hence, select the review period as 4 weeks.
64

3.2.12 TABLE SHOWING EOQ VALUES FOR BALL CLAY
(APRIL 2011 TO MARCH 2012)
S
NO
DESCRIP
TION
DEM
AND
IN
TONS
ORDER
ING
COST
PER
ORDER
CARRIY
ING
COST
PER
UNIT
PER
YEAR
PURCH
ASE
PRICE
PER
UNIT
1BALL
CLAY4200 2000 10% 1250
CALCULATION OF EOQ MODEL (P SYSTEM)
Annual demand, D = 4200
Ordering cost per order = Rs.2000.
Purchase price per unit = Rs.1250.
Carrying cost per unit year = 10% of the purchase price
Economic Order Quantity = √ 2coDP∗%CC
Economic Order Quantity = 366
65
66

DETERMINATION OF MAXIMUM INVENTORY LEVEL FOR P SYSTEM
Review period = EOQ/D
=0.087 year
=4.53 weeks
The review period can be either 4 weeks or 5 weeks.
Selection of review period:
Total cost when the review period = 4 week:
Total cost = ordering cost + carrying cost
= (52/4) * 2000 +( 420052
∗4)/2*1250*.10
= 26000+20192 = 46192.
Total cost when the review period = 5 week:
Total cost = ordering cost + carrying cost
= (52/5) * 2000 +( 420052
∗5)/2*1250*.10
= 20800+25240 = 46040.
INTERPRETATION:
The about calculation show that total cost is minimum when the review period is 5 weeks.
Hence, select the review period as 5 weeks
67
68

3.2.13 TABLE SHOWING EOQ VALUES FOR GIJRI T.P LAVIGATED CLAY
(APRIL 2011 TO MARCH 2012)
S NO DESCRIPTION
DEMA
ND IN
TONS
ORDERI
NG
COST
PER
ORDER
CARRIYI
NG COST
PER
UNIT
PER
YEAR
PURCH
ASE
PRICE
PER
UNIT
1
GIJRI T.P
LAVIGATED
CLAY
10800 5000 10% 1500
CALCULATION OF EOQ MODEL (P SYSTEM)
Annual demand, D = 10800
Ordering cost per order = Rs.5000.
Purchase price per unit = Rs.1250.
Carrying cost per unit year = 10% of the purchase price
Economic Order Quantity = √ 2coDP∗%CC
Economic Order Quantity = 849
69

70

DETERMINATION OF MAXIMUM INVENTORY LEVEL FOR P SYSTEM
Review period = EOQ/D
=0.078 year
=4.08 weeks
The review period can be either 3 weeks or 4 weeks.
Selection of review period:
Total cost when the review period = 3 week:
Total cost = ordering cost + carrying cost
= (52/3) * 5000 +( 1080052
∗3)/2*1500*.10
= 86667+46730 = 133397.
Total cost when the review period = 4 week:
Total cost = ordering cost + carrying cost
= (52/4) * 5000 +( 1080052
∗4)/2*1500*.10
= 65000+62307 = 127307
INTERPRETATION:
The about calculation show that total cost is minimum when the review period is 4 weeks.
Hence, select the review period as 4 weeks
71

72

3.3FINDINGS
From the 13 items considered for the study, 5 items found to be 30 %,( A category)
which is item very important. 4 items found to be 31%, (B category) which is items
important. 4 items found to be 31 %,( C category) which is item marginally important.
From the 11 items considered for the study, 3 items found to be 27 %,( A category)
which is items very important. 2 items found to be 18%, (B category) which is
itemsimportant.6items found to be 54 %,( C category) which is items marginally
important.
From the 12 items considered for the study, 2 items found to be 16%, (A category)
which is items very important. 4 items found to be 34%, (B category) which is items
important. 6 items found to be 50 %,( C category) which is items marginally
important.
From the 9 items considered for the study, 3 items found to be 34%, (A category)
which is items very important. 3 items found to be 33%, (B category) which is items
important. 3items found to be 33 %,( C category) which is items marginally
important.
From the 14 items considered for the study, 2 items found to be 14 %,( A category)
which is items very important. 1 items found to be 07 %,( B category) which is items
important. 11 items found to be 79 %,( C category) which is item marginally
important.
For theabove calculation it is found that cost is 5583 for 7 week and 5583 for 8 week.
From the above calculation it is found that cost is 61672 for 2 week and 55674 for 3
week.
From the above calculation it is found that cost is 72697 for 2 week and 65713 for 3
week.
From the above calculation it is found that cost is 10049 for 3 week and 9354 for 4
week.
From the above calculation it is found that cost is 140000 for 2 week and 123334 for
3 week.
From the above calculation it is found that cost is 28318 for 3 week and 27646 for 4
week.
73

From the above calculation it is found that cost is 46192 for 4 week and 46040 for 5
week.
From the above calculation it is found that cost is 133347 for 3 week and 127307 for
4 week.
74

3.4 SUGGESTIONS & RECOMMENDATION
The company should take some measures for controlling wastage of raw material.
The class change according to the number of items
For ex a product of 13 items are bought it comes under one class say ‘A’ class items
and the some product is purchased now the number of item purchased is 1 then it will
come under ‘B/C’ class items. Hence the combination of XYZ analysis helps in case
of such items.
A revised system has to be horizontally deployed to all the material i.e. all the direct
materials have to be classified into A,B,C category items and scheduling should be
done based on the parameter.
The company should forecast the customer demand in order to reduce the cost of
inventory
The safety stock should be calculated and main tainted to meet the customer demand.
The review period must be followed for ordering the raw materials
75

3.5 CONCLUSION
The inventory management technique is more useful in determine the optimum level of
inventory and finding answers inventory control and to problems of safety stock and lead
time. WS industries using maintain strict inventory control and will utilize in many areas.
There by any become concept leaders in the near future.
76
APPENDIX
S NO DESCRIPTION DEMAND ODERING COST
CARRIYING COST
PURCHASE PRICE review period(year)
review period(in week)
1 THAN CLAY 450 400 15% 575 65 0.144444 7.511111
2 FELDSPAR POWDER 2184 1700 10% 4160 134 0.061355 3.190476
3 QUARTZ POWDER 2112 2000 10% 5096 128 0.060606 3.151515
4 PLASTER OF PARIS 120 400 15% 6000 10 0.083333 4.333333
5 LILITE CHINA CLAY 7200 4000 5% 5200 470 0.065278 3.394444
6 CHINA CLAY(ORISSA) 1360 1000 10% 2800 99 0.072794 3.785294
7 BALL CLAY 4200 2000 10% 1250 366 0.087143 4.531429
8 GIJRI T.P LAVIGATED CLAY
10800 5000 10% 1500 849 0.078611 4.087778
77
BIBLIOGRAPHY
Books :
Research methodology, Kothari.C.R(2002), washman prakashan publications, new
delhi
Material management, Robert B.ballot, 11th edition, pearson education.
Supplier and material management, H.K. Compton
Production and operation management, R.panneerselvam
Introduction to material management, J.R.Tony Arnold, Stephen N.chapman, R.V.
Ramakrishnan.
Websites:
www.sciencedirect.com
www.mendely.com
www.engineeringletter.com
www.google.com
78