prof. dr. emad a. al-heety department of applied geology
TRANSCRIPT

Prof. Dr. Emad A. Al-Heety
Department of Applied Geology
College of Science, University of Anbar

The seismic stratigraphic interpretation is depending on interpreting the changes of the reflection waveform rather than reflection travel-time.
In practice, it is found that waveform changes caused by stratigraphic changes are easily obscured with noises.
Usually, marine seismic data give better resolved stratigraphic changes than land seismic survey data.
10/17/2020 2

The main objective of stratigraphic interpretation is determination of the types of stratigraphic features appearing on seismic sections.
Typical examples of such features are: facies changes, sand lenses, reefs, and unconformities.
10/17/2020 3
The seismic reflection wavelet is the net result of the interaction that occurred between the source signal and the stratified earth medium during its reflection travel-journey from the source to the receiver.
The physical properties of the traversed geological formations, contribute to the modifications of the wavelet waveform (spectrum
structure).
10/17/2020 4
Each physical property of the travel path has its own signature on the travelling seismic wavelet.
These changes imposed by the different properties of mineral and fluid contents (water, oil, or gas) can be considered as messages waiting for solving and understanding their geological implications.
10/17/2020 5

Seismic stratigraphy is concerned with the study of sedimentary formations (stratigraphic changes) based on seismic data.
The basic concept of the seismic stratigraphic analyses is that a sedimentary sequence is expressed in terms of seismic sequence.
10/17/2020 6
A summary of the basic definitions and concepts of seismic stratigraphy is given as follows:
I. Seismic Stratigraphy and the Depositional Sequence
Seismic stratigraphy are based mainly on development mechanism of sedimentary basins which are largely controlled by sea-level changes.
One or more contemporaneous depositional systems (fluvial, delta, continental shelf or slope) compromise the principal elements of basin fill.
10/17/2020 7

These deposition systems constitute the seismic
depositional sequences.
Diagnosis and delineation of the fundamental
basin-fill sedimentary units from seismic sections is referred to as seismic sequence analysis.
Seismic stratigraphy principal concepts are developed to describe precipitation processes and environments involved in creation of the sedimentary basins.
10/17/2020 8
In general, a sedimentary system made up of several sedimentary layers, which were contemporaneously-deposited under the same deposition-environment and bounded by unconformity subsurface, is called a (depositional sequence).
II. The Seismic Sequence
This is the expression of a depositional sequence as a seismic image appearing on a seismic section.
It is a group of seismic reflection events which are bounded by unconformity surfaces at both of its top and base.
10/17/2020 9
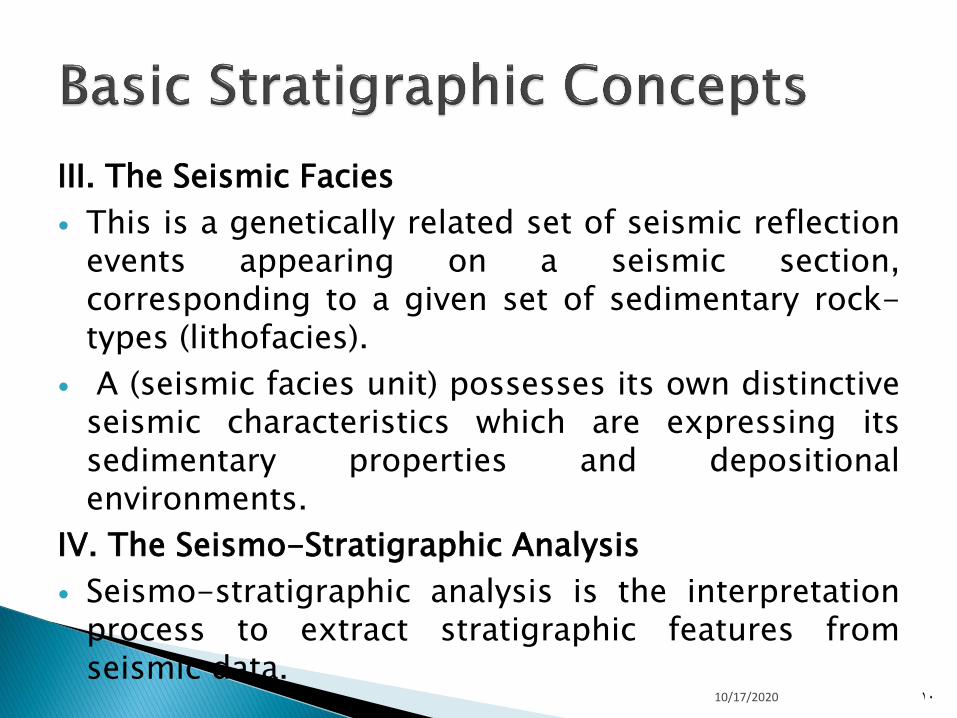
III. The Seismic Facies
This is a genetically related set of seismic reflection events appearing on a seismic section, corresponding to a given set of sedimentary rock-types (lithofacies).
A (seismic facies unit) possesses its own distinctive seismic characteristics which are expressing its sedimentary properties and depositional environments.
IV. The Seismo-Stratigraphic Analysis
Seismo-stratigraphic analysis is the interpretation process to extract stratigraphic features from seismic data.
10/17/2020 10
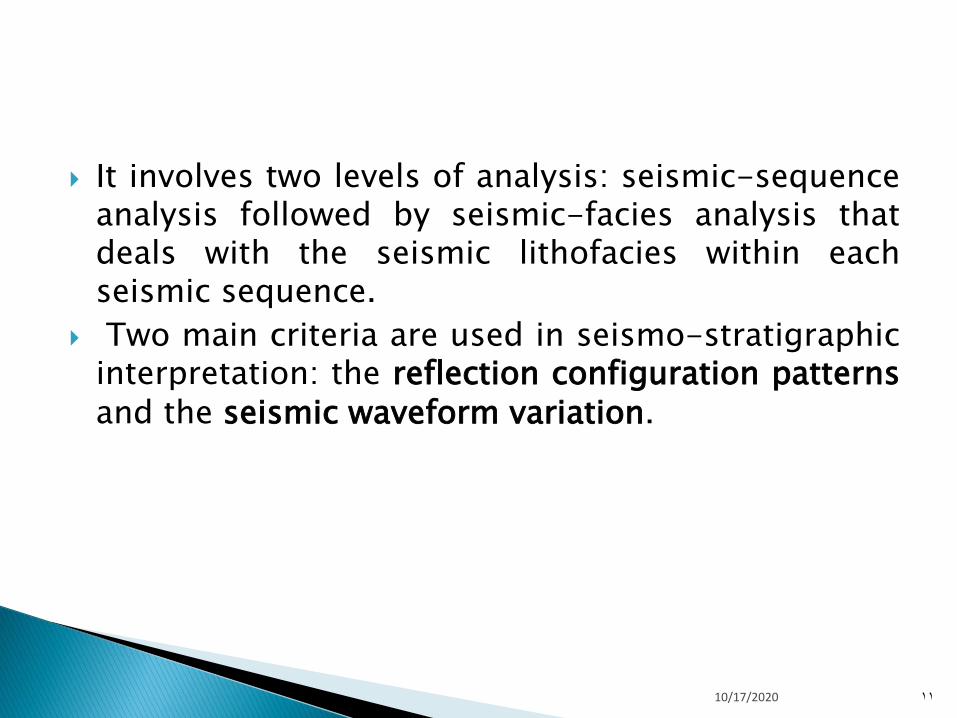
It involves two levels of analysis: seismic-sequence analysis followed by seismic-facies analysis that deals with the seismic lithofacies within each seismic sequence.
Two main criteria are used in seismo-stratigraphic interpretation: the reflection configuration patterns and the seismic waveform variation.
10/17/2020 11
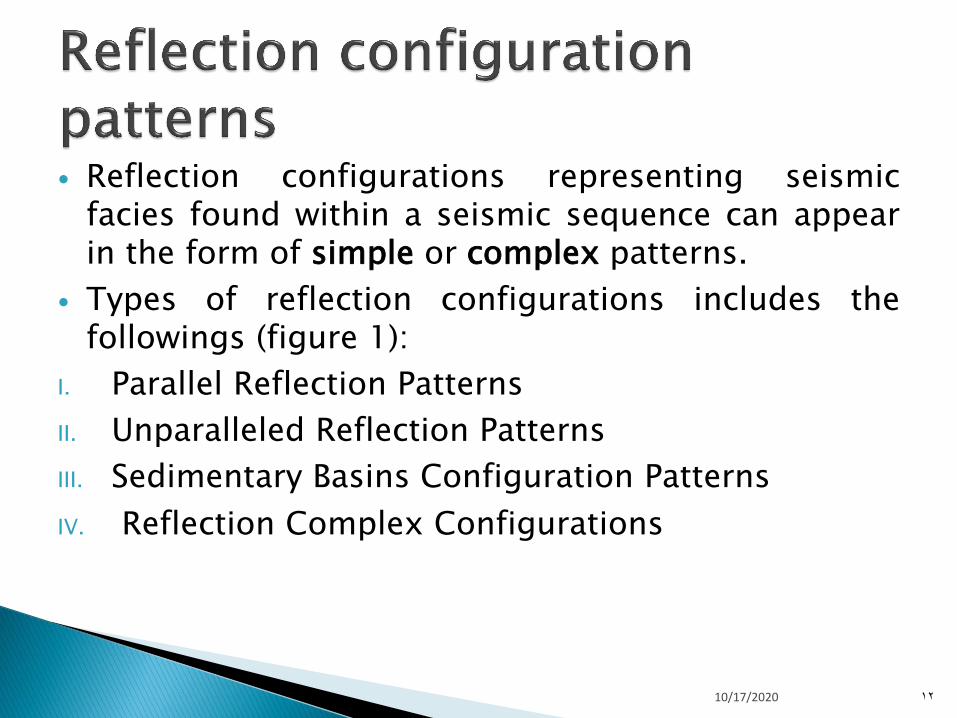
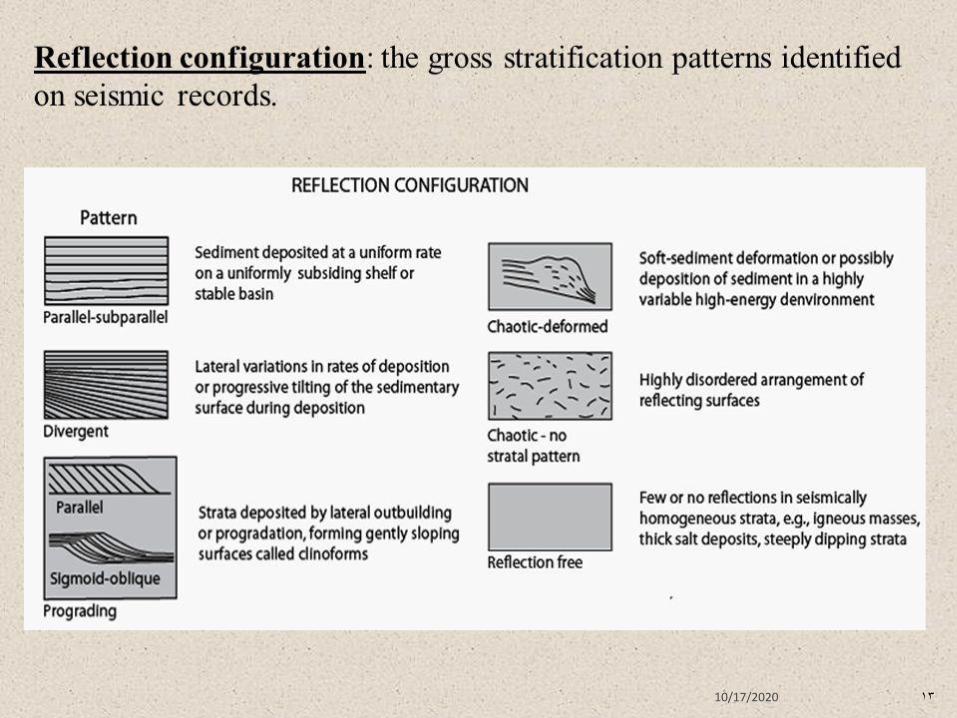
Reflection configurations representing seismic facies found within a seismic sequence can appear in the form of simple or complex patterns.
Types of reflection configurations includes the followings (figure 1):
I. Parallel Reflection Patterns
II. Unparalleled Reflection Patterns
III. Sedimentary Basins Configuration Patterns
IV. Reflection Complex Configurations
10/17/2020 12
10/17/2020 13

Reflection configurations can serve as indicators for the deposition environment and on the historical development of the sedimentary deposition process.
In short, geological stratigraphic features appearing on a particular geological section have their own seismic images (seismo-stratigraphic features) on the corresponding seismic section.
10/17/2020 14

The following discussion shall be concerning the principal stratigraphic features which are observable on seismic sections, with emphasis on those features having significance as regards oil stratigraphic traps:
I. Sand Lenses
These are buried stream channels or buried lakes, filled with sand and covered with impervious deposits as shale or clay.
Typically, sand lenses (especially gas-filled lenses)
exhibit abnormally high-amplitude reflections.
10/17/2020 15
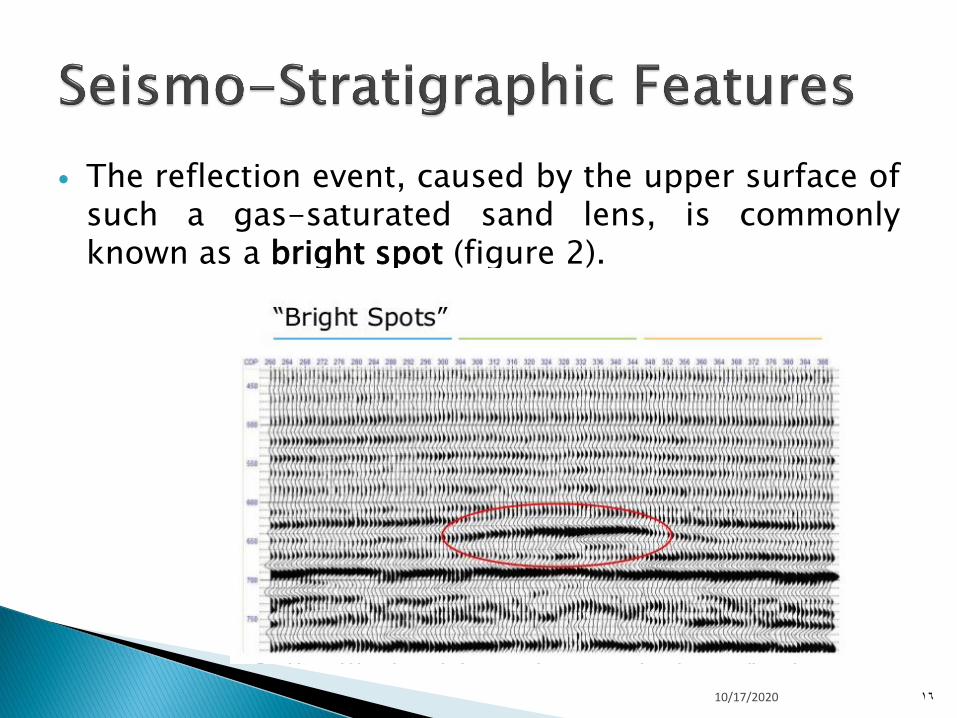
The reflection event, caused by the upper surface of such a gas-saturated sand lens, is commonly known as a bright spot (figure 2).
10/17/2020 16
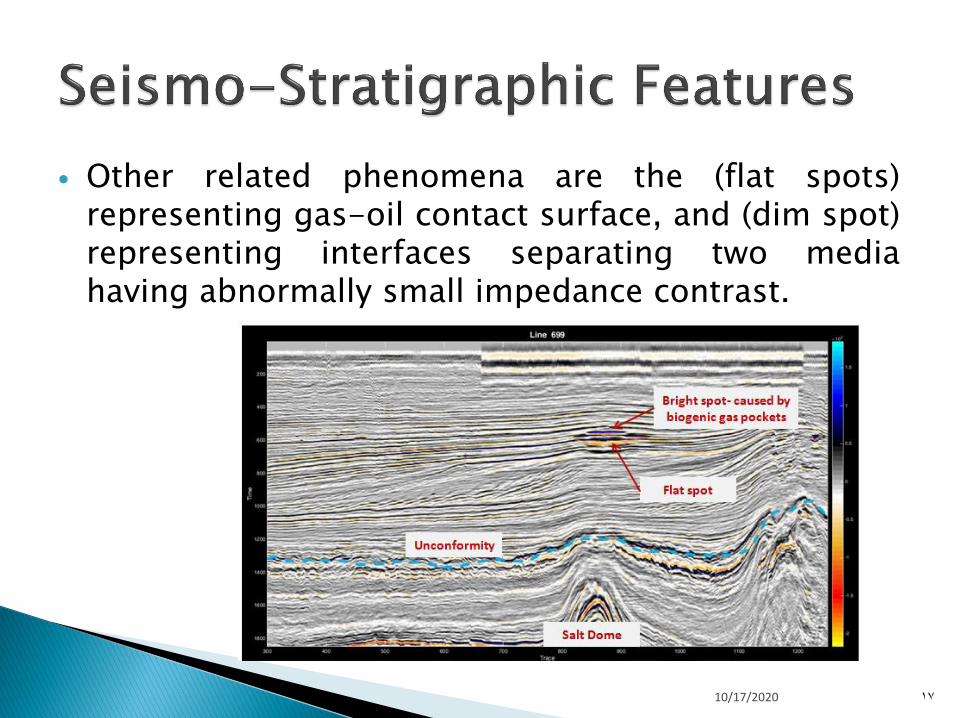
Other related phenomena are the (flat spots) representing gas-oil contact surface, and (dim spot) representing interfaces separating two media having abnormally small impedance contrast.
10/17/2020 17

II. Reef Bodies
A reef body is made up of skeletal remains normally deposited on shoals surrounded by deep water as shelf surfaces and shelf margins.
Favorable environment for the growth of coral reef is calm, clear, and warm water.
Reef deposits, made up of porous limestone rocks, are normally found within consolidated mudstone or shale (figure 3).
10/17/2020 18
The seismic event representing the reflection From the upper surface of the reef body differs from that of the sand lens in two ways:
I. Reef boundaries are usually rugged surfaces which result in creating diffractions and wave scattering and weak and unclear coherent reflections. In this case, identification of reefs is achieved with the help of the reflection events produced by those overlying formations which are draping across the reef top.
10/17/2020 19

II. The second difference between reef and sand lens seismic events is that the velocity of the reef material is higher than that of the host medium.
This property makes the reef body to act as a converging lens for the waves penetrating the reef.
As a result of the converging effect a false or apparent seismic anomaly may be created for the waves reflected from reflectors below the reef body.
10/17/2020 20
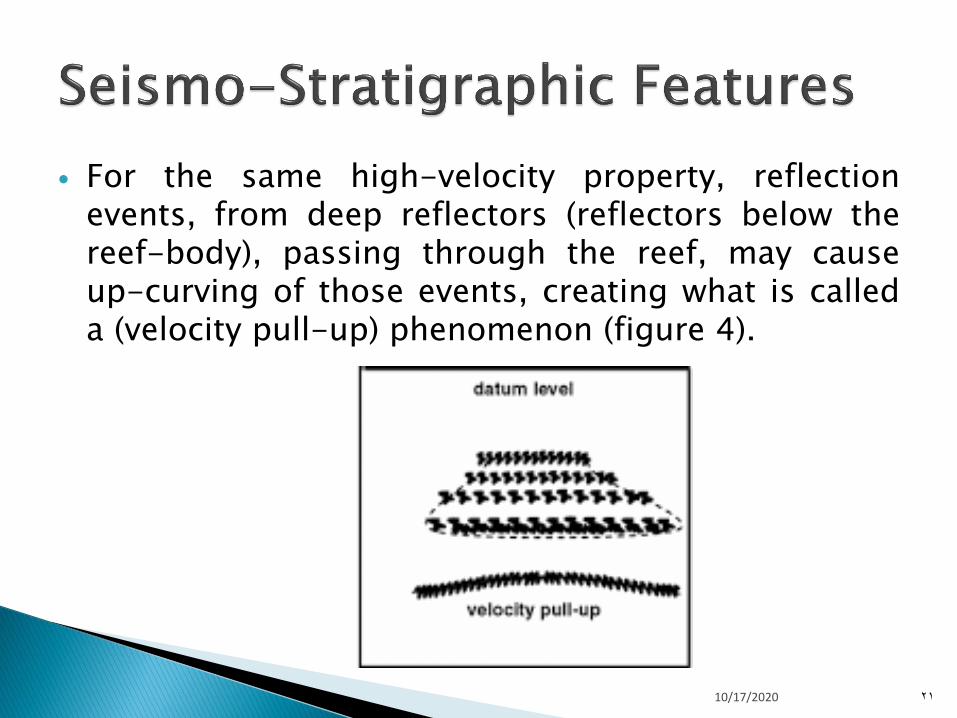
For the same high-velocity property, reflection events, from deep reflectors (reflectors below the reef-body), passing through the reef, may cause up-curving of those events, creating what is called a (velocity pull-up) phenomenon (figure 4).
10/17/2020 21

10/17/2020 22
III. Salt Domes
Within the zone occupied by the salt-body no reflection events are seen.
This reflection-free zone is a common feature that serves as a characteristic property aiding in salt dome identification.
Another characteristic feature is the thinning of the up-pushed formations which are overlying the salt dome.
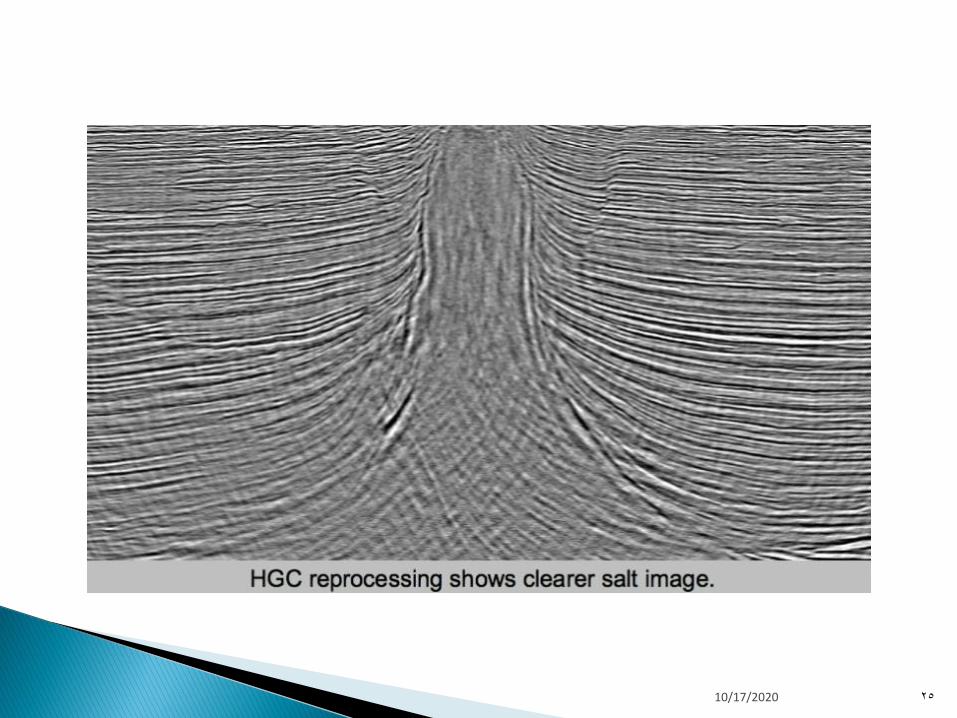
Most prominent features used in identifying a salt dome is the termination of reflection images at the salt dome surfaces, and absence of reflection events within the salt body, figure 5.
10/17/2020 23

By virtue of the vertical and horizontal pushing forces resulting from the growing salt body, folding and faulting of the overlying sedimentary cover take place.
An actual seismic image of a salt dome is shown in figure 5.
10/17/2020 24
10/17/2020 25

IV. Unconformity
The unconformity feature is of fundamental importance in the seismo-stratigraphic studies as it acts as the basis of defining seismic sequences.
It is representing a period of non-deposition or a period of erosion, followed by resumption of deposition.
On seismic sections, the angular unconformity is readily recognizable from the angular relation.
A typical seismic image of the unconformity is shown in figure 6.
10/17/2020 26

V. Facies Changes
Within a basin, sedimentary facies which are of coarse-grained deposits are found near basin margins, while more fine (silt or shale) sediments are found near basin center.
Usually, marked changes in rock lithology are
found in the areas where deltaic deposition environments prevail.
On seismic stack sections, the stratigraphic facies changes give corresponding anomalous seismic events.
More often such events indicate seismic facies units associated with the deltaic deposits, figure 7.
10/17/2020 27

Figure 7
10/17/2020 28
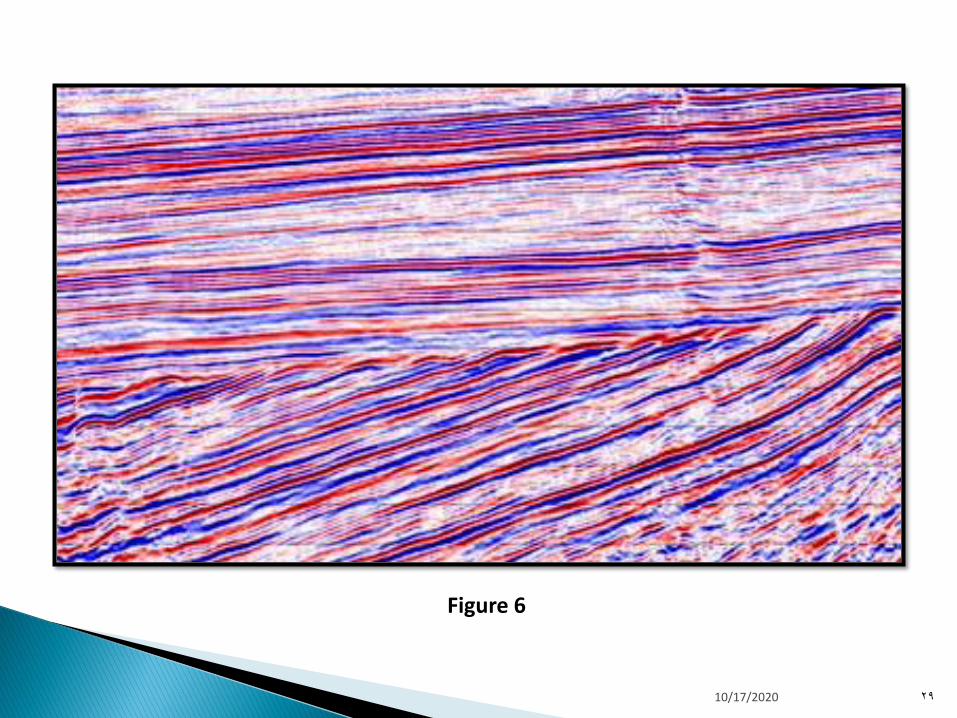
Figure 6
10/17/2020 29
In the same way as the stratigraphic changes affect the reflection wavelet, presence of hydrocarbon deposits causes waveform changes.
Interpretation tools and procedures employed in hydrocarbon detection are commonly referred to as (direct hydrocarbon detection).
All known hydrocarbon indication-tools (hydrocarbon indicators) are related to waveform parameters, as amplitude, frequency, phase, and propagation velocity.
10/17/2020 30
Geophysical studies proved that presence of hydrocarbon matters in the pores o a sedimentary formation leads to lowering of both of the seismic velocity and bulk density of those formations.
This means that we get a corresponding change in the reflection coefficient (and hence in reflection amplitude) of the interface separating the hydrocarbon-bearing rocks and the surrounding medium.
The direct dependence of these parameters on fluid contents of rock formations, make them active indicators in hydrocarbon detection.
10/17/2020 31
(i) Amplitude
Amplitude of the reflection wavelet is an expression of the wavelet energy-level which is controlled by the overall physical properties of the subsurface geology.
In particular, types and quantities of fluid content (water, oil, and gas).
A common observation is that presence of hydrocarbon gas in a rock formation results in lowering of the seismic velocity.
10/17/2020 32

As a result of this phenomenon we get increase of the reflection coefficient, and hence large amplitudes over the gas-reservoir.
Normally, the reflection-event representing the top boundary of the gas-saturated formation exhibits polarity reversal.
This abnormal seismic feature was recognized in the early 1970s and was given the name (Bright Spot).
10/17/2020 33

In presence of gas, it is found that amplitude of the reflected wavelet changes with offset.
The study tool that expresses this phenomenon is known in the geophysical literature by the term (amplitude versus offset, AVO).
In general, for low impedance contrast, as in the case of gas reservoir, AVO shows, in general, increase of reflection amplitude with the receiver-
offset.
10/17/2020 34

Amplitudes of reflections from top of gas reservoir (negative reflection), or from its base (positive reflection), will both show increase with offset, causing an AVO anomaly over the reservoir.
(ii) Frequency
An abnormal lowering of frequencies of the reflection events from reflectors beneath the hydrocarbon reservoirs is caused by the strong filtering effects of the hydrocarbon-bearing formations.
10/17/2020 35
For this reason (filtering effect), a low-amplitude shadow is produced by a hydrocarbon reservoir.
Frequency is another active indication tool for presence of hydrocarbon deposits.
(iii) Phase
The phase is generally useful in the study of reflector termination and polarity reversals.
10/17/2020 36
In this way, phase is considered as an effective indicator of faults, pinch-outs, and angular unconformities.
(iv) Velocity and Acoustic Impedance Two main changes take place from hydrocarbon
presence in a reservoir formation: 1. increase in the reflection coefficients (with
possible polarity reversal)
2. increase in the travel-time (time-delay) of the reflection wavelet passing through that formation.
10/17/2020 37
Due to the time-delay effect, it is expected to see an abnormal sagging of the reflection events from reflectors found below the hydrocarbon reservoirs.
The typical role of the parameter (velocity) is the velocity lowering-effect resulting from presence of hydrocarbon (gas, in particular) in a porous formation.
10/17/2020 38

In addition to that the velocity factor can be used in exploring lithological variations and pressure conditions since velocity is function of the rock physical properties (elasticity and density).
One of the common usages of the velocity is detection of reservoir gas-pressure conditions.
Normally, overpressure reduces velocity.
10/17/2020 39
Alsadi, H.N. (2017) Seismic Hydrocarbon Exploration: 2D and 3D Techniques. Springer International Publishing, Switzerland, 331p.
10/17/2020 40