production of inorganic metal compounds
TRANSCRIPT
PRODUCTION OF INORGANIC METAL
COMPOUNDS
CONTENT
LEAD OXIDE PRODUCTION .............................................................................. 3
1 General Information .............................................................................. 3
2 Industrial processes used .................................................................... 3
3 Production of PbO ................................................................................ 4
3.1 Production of Pb-stabilisers .................................................................... 4
4 Current emission and consumption levels ........................................ 4
4.1 Dust emissions ........................................................................................ 4
4.2 Water ....................................................................................................... 6
4.3 Waste .................................................................................................... 10
4.4 Energy ................................................................................................... 10
5 References ........................................................................................... 10
ZINK OXIDE PRODUCTION .............................................................................. 12
6 General Information ............................................................................ 12
7 Production of Zink oxide .................................................................... 12
8 Current emission and consumption levels ...................................... 13
8.1 Process emissions ................................................................................ 13
8.2 Water ..................................................................................................... 14
8.3 Waste .................................................................................................... 14
9 References ........................................................................................... 14
PRECIPITATED CALCIUM CARBONATE PRODUCTION .............................. 15
10 General Information ............................................................................ 15
11 Industrial Processes used .................................................................. 15
12 Current Emissioin and Consumption Levels ................................... 17
12.1 Air .......................................................................................................... 17
12.2 Water ..................................................................................................... 17
12.3 Waste .................................................................................................... 19
12.4 Energy ................................................................................................... 20
13 References ........................................................................................... 20

Production of inorganic metal compounds – Lead oxide production
2 Umweltbundesamt Vienna, 2017
CALCIUM CHLORIDE PRODUCTION VIA THE ACID-LIME NEUTRALISATION ROUTE .................................................................21
14 General Information ............................................................................21
15 Production of calziumchlorid .............................................................21
16 Current Emission and consumption levels ......................................22
16.1 Process emissions ................................................................................22
16.2 Water .....................................................................................................22
16.3 Waste ....................................................................................................22
16.4 Energy consumption .............................................................................23
17 References ...........................................................................................23
METAL SULPHIDES PRODUCTION ................................................................24
18 General Information ............................................................................24
19 Production of Sulphides .....................................................................24
20 Current Emission and consumption levels ......................................24
20.1 Process emissions ................................................................................24
20.2 Waste ....................................................................................................25
21 References ...........................................................................................25

Production of inorganic metal compounds – Lead oxide production
Umweltbundesamt Vienna, 2017 3
LEAD OXIDE PRODUCTION
1 GENERAL INFORMATION
The main present uses of lead oxides are for the manufacture of lead-acid bat-
teries, in additives to glass production and stabilisers for PVC.
The hereafter described reference plant is producing lead based PVC-stabilisers.
The European Chemicals Agency (ECHA) has submitted a Restriction Proposal
(date of submission 16/12/2016) for lead and its compounds on the placing on
the market and use of lead com-pounds to stabilise PVC. Based on the as-
sessment of the ECHA of the risks to human health or the environment associ-
ated the European Commission will restrict the lead compounds for the afore-
mentioned use earliest 2018.
The main applications of lead stabilisers in PVC are the production of pipes, ca-
bles and profiles in which the lead content is usually in the range of 0.5 and
2.5 %. In 2007 the consumption of formulated1 lead stabilisers was
100,000 tonnes in Europe (EU 28). In 2014 the consumption was reduced to
14,000 t/a and for 2015 the target of the European stabilisers producers associ-
ation was the total substitution of lead based products. The stabilisers are now-
adays based on calcium and tin (ESPA 2016).
The member companies of the European Stabiliser Producers Association
(ESPA) have commit-ted to carry out risk assessments by 2004 on lead-based
stabilisers. Moreover, the industry has developed alternative stabilisers to lead-
based systems and envisaged replacing lead-based sta-bilisers with lead-free
stabilisers till the year 2015 (www.vinylplus.eu).
The reference installation under discussion hereafter is producing lead based
PVC stabilisers (lead salts and lead soaps as granulates and tablets) as well as
lead free products. The produc-tion capacity of the reference installation is ap-
prox. 40.000 t/a.
2 INDUSTRIAL PROCESSES USED
Generally, there are four forms of lead oxide: PbO (litharge), having two forms
with different crystal structure, lead dioxide (PbO2) and Pb3O4 (minium). Where-
as litharge is the economically dominating lead oxide, the use of minium today
is rather small.
In the following, the production process of PbO (litharge), lead solutions and Pb
stabilisers is described in a general way.
1 “Formulated“ means that these systems are complete stabiliser/lubricant packages and may also
include pig-ments or fillers as a service to the customer.

Production of inorganic metal compounds – Lead oxide production
4 Umweltbundesamt Vienna, 2017
3 PRODUCTION OF PBO
The raw material for the production of PbO is lead-billets. These lead-billets are
melted and introduced into a stirrer vessel (so-called Barton furnaces). Then,
lead (Pb) is oxidised in an exothermic reaction to crude PbO (so-called Barton-
oxide) at approx. 450 °C through injection of air according to the formula:
Pb + ½ O2 → PbO
The content of free Pb in the Bartonoxide is usually comprised between 8 and
14%. The Bartonoxide is then precipitated with the help of a pre-filter system
(cyclone and fabric filter).
In order to meet the quality demand of less than 1% of free Pb in the PbO, a
post-oxidation at ca. 700 °C takes place in a so-called glazing plant. Then, the
PbO is milled and transferred into a silo.
3.1 Production of Pb-stabilisers
The main components of Pb-stabilisers are Pb-stearate, Pb-sulfate and Pb-
phosphide. Their production is mainly accomplished in a wet chemical way. The
fusible Pb-stearin can also be pro-duced by melting processes.
In the wet chemical process, PbO is mixed with acid in the presence of water.
The so-produced basic component is dewatered and dried. In the melting pro-
cess, stearin acid is molten with PbO giving Pb-stearin. Thus, the production of
lead-stabilisers in the form of tablets is possible.
Stabilisation compounds are produced through physical mixing. Partially, dust
poor compounds are produced by compression.
4 CURRENT EMISSION AND CONSUMPTION LEVELS
4.1 Dust emissions
The production of PbO and Pb-stabilisers causes dust emissions with an im-
portant share of lead. At the reference plant dust emissions below 0.05 mg/Nm³
with a total volume flow from all abatement systems of ca. 130,000 m³/h are typi-
cal.
In order to minimise fugitive dust emissions at hand-over points and at filling-
and packaging ma-chines, these devices are equipped with air extraction sys-
tems. Contaminated packaging materi-als are disposed in closed systems.
The dust emission limit from the production of PbO and Pb-stabilisers at the
reference plant is 0.1 mg/Nm³, at one emission point 0.05 mg/Nm³. No specific
emission limit is set for lead since the limit of 0.1 mg/Nm³ for dust emissions is
already far below the Pb emissions limit from the TA Luft2 of 0.5 mg/Nm³.
2 TA-Luft is currently under revision. For Pb and its compounds no proposal for changing the emis-
sion limit values was made.

Production of inorganic metal compounds – Lead oxide production
Umweltbundesamt Vienna, 2017 5
Compliance with permitted values is verified yearly by periodic measurements.
The reference plant applies High Efficiency Particulate Air (HEPA) filters after a
pre-filter system (cyclone and fabric filter) in the process of PbO- and Pb-
stabilisers production. These HEPA filters basically consist of a two-stage cas-
sette-filter with which dust-emission are reduced below 0.05 mg/Nm³. The main
advantage of this filter is that it is independent from production, which guaran-
tees highest security without cleaning-peaks at blowing off.
The compliance with the emissions limit values is controlled by
Differential pressure measurement
Optical inspection of cassette-filters
Continuous haze measurement in the stack and alarm system
Internally and externally emission measurements
Maintenance is carried out according to the revision guidelines including a half
yearly revision of all dust abatement systems (e.g. filter cassettes and bags).
The Measurement, display and alarm systems are also maintained accordingly.

Production of inorganic metal compounds – Lead oxide production
6 Umweltbundesamt Vienna, 2017
Table 1: Dust emissions to air. (Source: Operator Information 2016)
Origin 2013 2014 2015 ELV Max. exhaust air stream
mg/Nm³ mg/Nm³ mg/Nm³ mg/Nm³ Nm³/h
Source 1 < 0.0119 3) 5)
< 0.0122 3) 6)
< 0.0090 3) 7)
0.1 20)
29,500
Source 2 29,500
Source 3 29,500
Source 4 < 0.0121 3) 8)
< 0.0101 3) 9)
< 0.0097 3) 10)
0.1 21)
22,362
Source 5 24,000
Source 6 < 0.0119 3) 11)
< 0,0117 3) 12)
< 0.011 3) 13)
0.1 22)
48,000
Source 7 < 0.07 1)
< 0.04 2) 14)
< 0.10 1)
< 0.05 2) 15)
< 0.09 1)
< 0.05 2)
< 0.05 2) 16)
0.1 23)
24,600
Source 8 < 0.09 1)
< 0.05 1) 17)
< 0.09 2)
< 0.10 4) 18)
< 0.05 2)
< 0.09 1)
< 0.06 2) 19)
0.1 23)
8,800
All values are for dry gas at 0 °C, 1,013 mbar. No averaging periods are given in the permits.
Averaging periods: 1)
30 minutes 2) 1 hour
3) 3 hours
4) 50 minutes
5) ÖSBS 2013a
6) ÖSBS 2014a
7) ÖSBS 2015a
8) ÖSBS 2013b
9) ÖSBS 2014b
10) ÖSBS 2015b
11) ÖSBS 2013c
12) ÖSBS 2014c
13) ÖSBS 2015c
14) ÖSBS 2013d
15) ÖSBS 2014d
16) ÖSBS 2015d
17) ÖSBS 2013e
18) ÖSBS 2014e
19) ÖSBS 2015e
20) BH VILLACH 1991
21) BH VILLACH 1994
22) BH VILLACH 1993
23) BH VILLACH 1992
4.2 Water
Accruing wastewater from the production of PbO is pre-treated (physical-
chemical treatment) before being discharged into the public sewer system. Re-
quired cooling water is reused in the process. Emission limit values are set by
permit. Wastewater emissions from PbO production are regulated by the
wastewater ordinance for inorganic chemicals. Table 2 presents a summary of
water consumption and wastewater treatment. Table 3 compares emission val-
ues evaluated via self-monitoring (2015) with the respective permit and ordi-
nance emission limit values. Table 4 compares emission values evaluated via
external-monitoring (2016 & 2015) with the respective permit and ordinance
emission limit values.

Production of inorganic metal compounds – Lead oxide production
Umweltbundesamt Vienna, 2017 7
Table 2: Summary of water consumption and wastewater treatment. (Source: verbal information from 21.03.2016)
Consumption and treatment of water
Consumption of fresh water 150,000 m³/h – 200,000 m³/h cooling water (reused in the process)
Type of wastewater discharge Treated wastewater gets indirectly discharged via the communal WWTP Villach.
Ordinance Wastewaters from the production of PbO is regulated by the Ordinance on inorganic chemicals (2/8/6/3/15 Anorganische Chemikalien, Anlage A).
Emission limit values are determined by permit. External-monitoring has to be performed twice a year.
Internal treatment of wastewater from the process
Precipitation of lead
Filtration
Neutralisation
Short description of the process wastewater treatment
Lead contaminated wastewater from the production process is collected in sealed floor channels. In the in-house wastewater treatment compris-es of precipitation of lead as PbCO3 via sodium carbonate. After filtration and adjustment of the pH-value with sulphuric acid, the waste water gets discharged into the communal wastewater system and further treated in the communal WWTP Villach.

Pro
ductio
n o
f inorg
anic
me
tal c
om
pounds –
Curre
nt e
mis
sio
n a
nd c
onsum
ptio
n le
vels
8
Um
weltb
undesam
t V
ienna, 2
017
Table 3: Emission values (self-monitoring), ELV permit and Ordinance (2/8/6/3/15 Anorganische Chemikalien, Anlage A). (Source: Self-monitoring report, 2015; Permit
VL5-WA-733/1999, BH Villach, 2007)
Self-monitoring 2015
Parameter Unit Daily min. Daily max. Annual average
ELV permit Ordinance Number of samples
Q m³/d 12 230 131.33 230 245
Total P mg/l 1.5 141 66.07 51
Lead mg/l 0.1 0.563 0.11 0.5 0.5 243
Lead load g/d 1.2 33.3 14.44 50
Aluminium mg/l 0.15 10.6 1.6 243
Thallium mg/l 0.03 0.05 0.03 243
Thallium load g/d 0.36 9.2 0.36 10 243
Cadmium mg/l 0.01 0.01 0.01 0.1 0.1 26
Cadmium load g/d 0.12 2.3 1.31 10 245
Zinc mg/l 0.03 0.07 0.04 2 1 26
Zinc load g/d 0.36 11.5 4.05 200 245
Arsenic mg/l 0.03 0.1 0.03 0.1 82
Arsenic load g/d 0.36 18 4.24 10 245
T °C 35
TSS mg/l 250
pH 6.5 ‒ 9.5
Antimony mg/l 0.3
3 No exceedance due to „4 out of 5“ rule – the ordinance on wastewater defines an emission value as complying if 4 out of 5 consecutive measurements do not exceed the permitted emission
limit value and one measurement does not exceed the permitted emission limit value by more than 50%.

Um
weltb
undesam
t V
ienna, 2
017
9
Fe
hle
r! Kein
Te
xt m
it an
ge
geb
en
er F
orm
atv
orla
ge
im D
ok
um
en
t., Fe
hle
r! Kein
Te
xt m
it an
ge
geb
en
er F
orm
atv
orla
ge
im
Do
ku
men
t. 9
Pro
ductio
n o
f inorg
anic
meta
l com
pounds –
Lead o
xid
e p
roductio
n
Table 4: Emission values (external-monitoring), ELV permit and Ordinance (2/8/6/3/15 Anorganische Chemikalien, Anlage A). (Source: External-monitoring report 2015
& 2016; Permit VL5-WA-733/1999, BH Villach, 2007)
External-monitoring
Parameter Unit 19.05.2016 12.11.2015 27.05.2015 ELV permit Ordinance Method
pH - 8.4 8.7 8.5 6.5 – 9.5 DIN 38404-4
Lead mg/l 0.091 0.03 0.09 0.5 0.5 DIN EN ISO 11885
Cadmium mg/l < 0.001 < 0.001 < 0.001 0.1 0.1 DIN EN ISO 11885
Zinc mg/l 0.006 0.008 0.019 2 1 DIN EN ISO 11885
Production of inorganic metal compounds – Lead oxide production
10 Umweltbundesamt Vienna, 2017
4.3 Waste
At the reference plant, approx. 700 t hazardous and ca. 300 t non-
hazardous waste was produced in 2001 (corresponding production of PbO
and Pb-stabiliser compounds: ca. 35,000 t/a). Lead-sulphate contaminated
packaging material and lead-salts represent the major part of hazardous
waste. Non-contaminated wooden waste has the highest share of non-
hazardous waste.
4.4 Energy
The oxidation of molten lead in the Barton-furnaces is an exothermic pro-
cess. Natural gas input is required during start-up and for the complete oxi-
dation of PbO.
5 REFERENCES
BH VILLACH (1991): Bescheid BH Villach, 22.609/1/91-4 (09.04.1991)
BH VILLACH (1992): Bescheid BH Villach, 27.912/6/92-4 (30.10.1992)
BH VILLACH (1993): Bescheid BH Villach, 20.637/1/93-4 (17.03.1993)
BH VILLACH (1994): Bescheid BH Villach, 7.955/2/94-4 (24.11.1994)
BH VILLACH (2007): Bescheid Bezirkshauptmannschaft Villach, Indirect discharge of
process wastewater, VL5-WA-733/1999 (005/2007), 11.07.2007
DRAIN CONTROL-CONSULTING (2015 and 2016): External-monitoring report, Drain Control-
Consulting, 2015 & 2016
ÖSBS – Österreichische Staub- (Silikose-) Bekämpfungsstelle (2013a): Prüfbericht
Nr. 682/13
ÖSBS – Österreichische Staub- (Silikose-) Bekämpfungsstelle (2013b): Prüfbericht
Nr. 684/13
ÖSBS – Österreichische Staub- (Silikose-) Bekämpfungsstelle (2013c): Prüfbericht
Nr. 685/13
ÖSBS – Österreichische Staub- (Silikose-) Bekämpfungsstelle (2013d): Prüfbericht
Nr. 689/13
ÖSBS – Österreichische Staub- (Silikose-) Bekämpfungsstelle (2013e): Prüfbericht
Nr. 690/13
ÖSBS – Österreichische Staub- (Silikose-) Bekämpfungsstelle (2014a): Prüfbericht
Nr. 725/14
ÖSBS – Österreichische Staub- (Silikose-) Bekämpfungsstelle (2014b): Prüfbericht
Nr. 716/14
ÖSBS – Österreichische Staub- (Silikose-) Bekämpfungsstelle (2014c): Prüfbericht
Nr. 717/14

Production of inorganic metal compounds – Lead oxide production
Umweltbundesamt Vienna, 2017 11
ÖSBS – Österreichische Staub- (Silikose-) Bekämpfungsstelle (2014d): Prüfbericht
Nr. 721/14
ÖSBS – Österreichische Staub- (Silikose-) Bekämpfungsstelle (2014e): Prüfbericht
Nr. 722/14
ÖSBS – Österreichische Staub- (Silikose-) Bekämpfungsstelle (2015a): Prüfbericht
Nr. 711/15
ÖSBS – Österreichische Staub- (Silikose-) Bekämpfungsstelle (2015b): Prüfbericht
Nr. 713/15
ÖSBS – Österreichische Staub- (Silikose-) Bekämpfungsstelle (2015c): Prüfbericht
Nr. 717/15
ÖSBS – Österreichische Staub- (Silikose-) Bekämpfungsstelle (2015d): Prüfbericht
Nr. 716/15
ÖSBS – Österreichische Staub- (Silikose-) Bekämpfungsstelle (2015e): Prüfbericht
Nr. 721/15
Self-monitoring Report (2015): Self-monitoring of wastewater pre-treatment, 2015

Production of inorganic metal compounds – Zink oxide production
12 Umweltbundesamt Vienna, 2017
ZINK OXIDE PRODUCTION
6 GENERAL INFORMATION
The reference installation under discussion hereafter produces zinc oxide in dif-
ferent qualities via the indirect process (French process). The installation is
covered by the IED Annex I.
Zinc oxide is primarily used in the rubber industry as compounding material. All
kinds of sulphur – crosslinked rubbers contain ZnO as it activates the vulcanisa-
tion process.
Another major use of zinc oxide is in glass and ceramic products.
Due to the absorption properties of ultraviolet light zinc oxide, it is used in sun-
screens. Additionally ZnO is applied in pharmaceuticals and cosmetic products
for healing wounds, as a bacteriostat in medical plasters, in baby creams and
calamine lotion.
Zinc oxide is furthermore used as pigment and as additive in polymers and
paints, mainly to inhibit corrosion and for is opacity.
Zinc is a trace element, is one of the main additives of zinc to fertilisers, animal
feed and human vitamin supplements. It is also used in dental cement. Finally
zinc oxide acts as a catalyst in alkylation, oxidation, hydrogenation and desul-
phurisation reactions.
7 PRODUCTION OF ZINK OXIDE
Zink oxide is produced in via the indirect process route. The starting material is
zinc metal (primary or secondary with a purity of 92 – 99.995 %) which is melted
in a first stage at a directly heated (natural gas) reaction vessel.
The liquefied zinc is subsequently transferred to the vaporiser. The molten met-
al is vaporised by boiling depending on the sub-process. It can be carried out in
an electro thermal furnace, a muffle arch furnace or a retort. The vapour is then
oxidised in a combustion chamber with air to zinc oxide:
2 Zn + O2 2 ZnO
The product is precipitated in settling chambers, in which the fractionation of the
zinc oxide particles takes place according to their size.
The exhaust air stream is cleaned with bag filters after cooling and remaining
ZnO collected.

Production of inorganic metal compounds – Zink oxide production
Umweltbundesamt Vienna, 2017 13
8 CURRENT EMISSION AND CONSUMPTION LEVELS
8.1 Process emissions
At the reference installation 8 bag filters are operated for the abatement of
dust (ZnO). The main emission sources are the zinc furnaces, additional the
mill is equipped with an abatement system.
The emission limit value for all bag filters is 20 mg/Nm³ at standard condi-
tions (0° C, 1013 mbar and dry exhaust gas). The filter equipment has to be
maintained and malfunctioning filter hoses have to be replaced immediately.
The emission limit values must be monitored externally at least every 3
years. The last emission values from 2014 are displayed in Table 5.
The emission values for dust are usually within the rage of the emission limit
value. For filter 6 one emission value (22.8 mg/Nm3) was above the emis-
sion limit value. Filter 4 had emission values of 15.6 mg/Nm3 and
7.3 mg/Nm3. All other emission values from filters abating furnaces and a
mill were well below 10 mg/Nm3.
Figure 1:
Indirect process route
for the production of
ZnO. (according to
LVIC-S BREF 2007)
Indirect process route for the production of ZnO
Source: LVIC-S BREF (2007)

Production of inorganic metal compounds – Zink oxide production
14 Umweltbundesamt Vienna, 2017
Filter number Origin 1st
HA 2nd
HA mean
dust, mg/Nm³ dust, mg/Nm³ dust, mg/Nm³
F1 Ball mill 3.99 4.37 4.18
F2 Ash filter 3.15 3.18 3.17
F4 Zinc furnaces 15.6 7.3 11.5
F5 Furnace hood <0.39 <0.39 <0.39
F6 Zinc furnaces 22.8 16.2 19.5
F7 Zinc furnaces 0.79 0.94 0.87
F8 Zinc furnaces 2.24 1.81 2.03
Emission limit value for all bag filters: 20 mg/Nm³ as half hourly averages at 0° C, 1013 mbar and
dry gas.
All emission values represent half hourly averages at 0 °C; 1,013 hPa and dry gas. Oxygen content
as obtained.
8.2 Water
The indirect process route does not have any waste water streams and there-
fore no emissions to water occur.
Waste water can be obtained when producing zinc oxide produced via the wet
chemical process route.
8.3 Waste
Residues from the indirect process are reused in the process. No solid residues
are emitted.
Waste from the direct process in the form of a slag is either directed to landfill,
or is used in road construction.
9 REFERENCES
BREF LVIC-S (2007): Reference Document on Best Available Techniques for the
Manufacture of Large Volume Inorganic Chemicals – Solids and Others industry
from August 2007.
All other information was received in personal messages from the operator of
the reference installation.
Table 5:
Emission values of the
reference plant for the
production of ZnO via
the indirect process.
Emission values
represent
measurements from
2014. (Source: Operator
information 2016)

Production of inorganic metal compounds – Precipitated calcium carbonate production
Umweltbundesamt Vienna, 2017 15
PRECIPITATED CALCIUM CARBONATE
PRODUCTION
10 GENERAL INFORMATION
Precipitated calcium carbonate (PCC) and ground calcium carbonate (GCC)
have the same chemical formula CaCO3. Nevertheless, the formation of these
materials diverges as GCC is produced top down, whereas PCC is synthesized
bottom up. Due to different production regimes, PCC differs from GCC in, e.g.
higher purity,
control of crystal morphology,
finer crystallites (down to the nanometre range),
specific surface area,
and control of agglomeration in the final PCC product.
The properties of PCC can be adjusted to the needs of the customer by the
production conditions.
The precipitated calcium carbonate can be subsequently coated for specific ap-
plications. At the reference IPPC-installation, no coating is performed within the
installation boarders.
The main application of PCC is the paper production, as filler material and ad-
sorption agent for printing inks. Smaller amounts are used for the production of
paints, adhesives, sealants, inks, plastics, rubber, healthcare and pharmaceuti-
cals.
The hereafter described reference plant is situated next to a cement plant pro-
ducing quick lime. CO2 from calcination of limestone is ducted after scrubbing
from the cement plant to the PCC plant for the carbonisation step in the calcium
carbonate process.
The plant has a capacity of processing approx. 80,000 t/a quicklime to slaked
lime and a production capacity of approx. 400,000 t/a slurry.
The reference plant is under the regime of the IED (Annex I, activity 4.2). The
final products are transported by trucks and rail to paper mills.
11 INDUSTRIAL PROCESSES USED
The production of PCC is a multistep process. The first step is slaking of quick
lime (CaO). In this continuous slaking process, quick lime reacts in an exother-
mic process with water to slaked lime (Ca(OH)2). The milk of lime is stored in
tanks, intermediately.

Production of inorganic metal compounds – Precipitated calcium carbonate production
16 Umweltbundesamt Vienna, 2017
In a batch process scrubbed lime-kiln gas containing mainly carbon dioxide
from the neighbouring cement installation is added to the milk of lime. The
slaked lime reacts with the carbon dioxide to calcium carbonate, which crystal-
lizes subsequently from the solution. Crystallization is controlled by adjusting:
temperature (heating or cooling of the slurry may be necessary before car-
bonation),
CO2 concentration and flow rate,
agitation level,
composition of hydrated lime slurry
and presence of additives.
to obtain particles with specific morphology, size, agglomeration rate and sur-
face area.
Process scheme for the production of PCC
H2O
CO2
Ca(OH)2 storage
slaking
vertical mill
carbonisation
evaporator
centrifuge
additives
CaOclassifier
The chemical reactions in these two steps (1, 2) and the overall stoichiometric
reaction (3) are:
1. CaO + H2O → Ca(OH)2
2. Ca(OH)2 + CO2 → CaCO3 + H2O
3. CaO + CO2 → CaCO3
Figure 2:
Simplified process
scheme for the
production of PCC.
Source: Umweltbundesamt

Production of inorganic metal compounds – Precipitated calcium carbonate production
Umweltbundesamt Vienna, 2017 17
The slurry is thickened by centrifuges and dispersants are added for the final
product. Some special products are then deagglomerated using a vertical mill
and concentrated to different solid contents by means of an evaporation plant.
A simplified process scheme is shown in Figure 2.
12 CURRENT EMISSIOIN AND CONSUMPTION LEVELS
12.1 Air
No emissions to air arise in the reference plant.
The quicklime is transported fully encapsulated to the slaking container and
poured in under the water level.
Additionally, the reference plant is producing solely aqueous PCC slurries, no
dry products are made. Therefore, no dust emissions from bagging occur.
12.2 Water
Table 6 presents the treatment of waste water, the corresponding Austrian ordi-
nance and the type of discharge.
Production of inorganic metal compounds – Precipitated calcium carbonate production
18 Umweltbundesamt Vienna, 2017
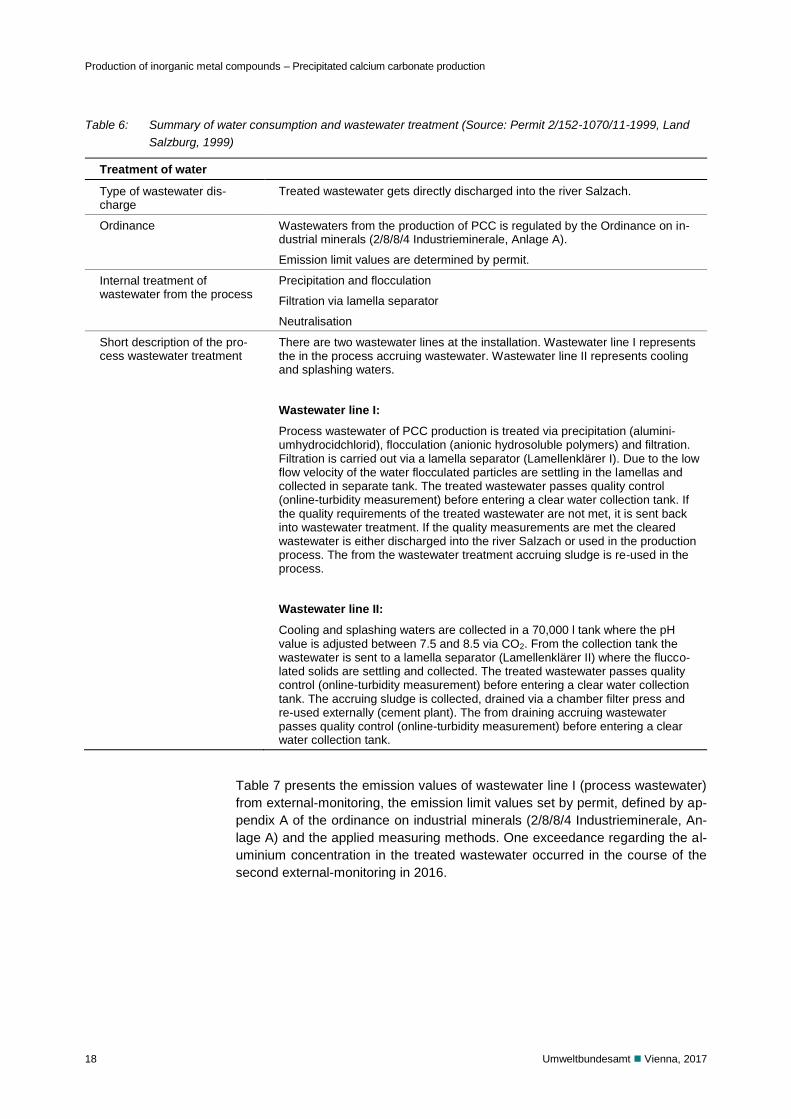
Table 6: Summary of water consumption and wastewater treatment (Source: Permit 2/152-1070/11-1999, Land
Salzburg, 1999)
Treatment of water
Type of wastewater dis-charge
Treated wastewater gets directly discharged into the river Salzach.
Ordinance Wastewaters from the production of PCC is regulated by the Ordinance on in-dustrial minerals (2/8/8/4 Industrieminerale, Anlage A).
Emission limit values are determined by permit.
Internal treatment of wastewater from the process
Precipitation and flocculation
Filtration via lamella separator
Neutralisation
Short description of the pro-cess wastewater treatment
There are two wastewater lines at the installation. Wastewater line I represents the in the process accruing wastewater. Wastewater line II represents cooling and splashing waters.
Wastewater line I:
Process wastewater of PCC production is treated via precipitation (alumini-umhydrocidchlorid), flocculation (anionic hydrosoluble polymers) and filtration. Filtration is carried out via a lamella separator (Lamellenklärer I). Due to the low flow velocity of the water flocculated particles are settling in the lamellas and collected in separate tank. The treated wastewater passes quality control (online-turbidity measurement) before entering a clear water collection tank. If the quality requirements of the treated wastewater are not met, it is sent back into wastewater treatment. If the quality measurements are met the cleared wastewater is either discharged into the river Salzach or used in the production process. The from the wastewater treatment accruing sludge is re-used in the process.
Wastewater line II:
Cooling and splashing waters are collected in a 70,000 l tank where the pH value is adjusted between 7.5 and 8.5 via CO2. From the collection tank the wastewater is sent to a lamella separator (Lamellenklärer II) where the flucco-lated solids are settling and collected. The treated wastewater passes quality control (online-turbidity measurement) before entering a clear water collection tank. The accruing sludge is collected, drained via a chamber filter press and re-used externally (cement plant). The from draining accruing wastewater passes quality control (online-turbidity measurement) before entering a clear water collection tank.
Table 7 presents the emission values of wastewater line I (process wastewater)
from external-monitoring, the emission limit values set by permit, defined by ap-
pendix A of the ordinance on industrial minerals (2/8/8/4 Industrieminerale, An-
lage A) and the applied measuring methods. One exceedance regarding the al-
uminium concentration in the treated wastewater occurred in the course of the
second external-monitoring in 2016.

Production of inorganic metal compounds – Precipitated calcium carbonate production
Umweltbundesamt Vienna, 2017 19
Table 7: Emission values from external-monitoring 12. – 13.01.2016 (EM1), 04. – 05.10.2016 (EM2), ELVs permit
and Ordinance (2/8/8/4 Industrieminerale, Anlage A) (Source: Hydrologische Untersuchungsstelle
Salzburg, external-monitoring report, 28.03.2016, Hydrologische Untersuchungsstelle Salzburg, external-
monitoring report, 27.10.2016, Permit 2/152-1070/11-1999, Land Salzburg, 1999)
Parameter Unit EM1 2016 EM2 2016 ELV Permit ELV Ordinance
Method
Q m³/d 1,121 1,682 2,000 - -
T °C 15-19 20-27 30 30 -
pH 8.22 8.03 6.5 ‒ 9.5 6.5 ‒ 9.5 DIN EN ISO 10523:2012
TSS mg/l 38 32 100 100 ÖNORM M 6274:1984
TSS load kg/d 42.6 53.8 200 - calculated
Al mg/l 0.669 2.02 1)
2 2 ÖNORM EN ISO 11885
Al load kg/d 0.75 3.4 4 - calculated
COD mg/l 32 22 75 75 ÖNORM M 6265:1991
COD load kg/d 35.9 37 150 - calculated
Sum of hydrocar-bons
mg/l < 0.09 < 0.1 5 5 ÖNORM M 6608:1996
Sum of hydrocar-bons load
kg/d < 0.1 < 0.16 10 - calculated
Anionic tensides mg/l < 0.1 < 0.1 1 - DIN EN 903:1994
Anionic tensides load
kg/d < 0.12 < 0.12 2 - calculated
Non-ionic ten-sides
mg/l < 0.1 < 0.1 - - DIN 38409-23-2
Non-ionic ten-sides load
kg/d < 0.12 < 0.12 - - calculated
1) Ordinance on industrial minerals 2/8/8/4 AEV Industrieminerale, §4.(3)Z1: In case of a measured ELV exceedance of wastewater
parameters number 2,3 or 5 to 21 of appendix A to C (includes Al) in the course of an up to 4 times a year conducted external-
monitoring, which is not higher than the 1.5-fold ELV, the external-monitoring has to be repeated. If the measured value is below
the ELV at the repeat measurment, the parameter is complying. The repeat measurement is not yet available.
12.3 Waste
Hazardous and non-hazardous wastes are generated in the reference plant
(Table 8). Hazardous waste consists predominantly of waste oil, oil contaminat-
ed materials and common office wastes. Non-hazardous waste consists pre-
dominantly of packaging materials (e.g. wood, cardboard, ferrous metals, plastic
foils) and municipal waste.
Rejected quicklime (approx. 5%) is returned to the delivering quicklime plant.
Calcium carbonate originating from the waste water treatment is analysed and
recycled onsite (PCC production) or externally (cement plant).

Production of inorganic metal compounds – Precipitated calcium carbonate production
20 Umweltbundesamt Vienna, 2017
Year Non-hazardous waste [t]
Hazardous waste [t]
Waste water [m³]
2012 27,965 2,615 474,660
2013 35,420 4,270 417,848
2014 28,250 1,196 416,094
2015 40,166 1,288 408,707
2016 36,603 3,325 548,031
12.4 Energy
Process heat is partly used for heating the plants. Additionally a natural gas
heating system (400 kW) is installed.
13 REFERENCES
Permit 2/152-1070/11-1999, Land Salzburg, 1999: Änderung der Betriebsanlage;
Gewerbe-, bau- und wasserrechtliche Genehmigung, 2/152-1070/11-1999, Land
Salzburg, 1999
HYDROLOGISCHE UNTERSUCHUNGSSTELLE SALZBURG (2016a): external-monitoring report,
28.03.2016: Betriebswasseruntersuchung, Prüfbericht, Hydraulische
Untersuchungsstelle Salzburg, 28.03.2016
HYDROLOGISCHE UNTERSUCHUNGSSTELLE SALZBURG (2016b): external-monitoring report,
27.10.2016: Betriebswasseruntersuchung, Prüfbericht, Hydraulische
Untersuchungsstelle Salzburg, 27.10.2016
Permit 2/152-1128/2-1999, Land Salzburg, 1999: Errichtung einer
Erdgasheizungsanlage; Gewerberbehördliche Genehmigung, 2/152-1128/2-1999,
Land Salzburg, 1999
Waste management concept 2016, Operator, 2016
Permit 2/152-923/3-1997, Land Salzburg, 1997: Errichtung einer Betriebsanlage;
Gewerbe- und baurechtliche Genehmigung, 2/152-923/3-1997, Land Salzburg,
1997
Permit 2/152-923/27-1999, Land Salzburg, 1999: Errichtung und Betrieb einer
vollautomatischen Kalklöschanlage; Gewerbebehördliche Genehmigung, 2/152-
923/27-1999, Land Salzburg, 1999
Table 8:
Wastes arising the
reference plant. (Source:
Operator information
2017)

Production of inorganic metal compounds – Calcium chloride production via the acid-lime neutralisation route
Umweltbundesamt Vienna, 2017 21
CALCIUM CHLORIDE PRODUCTION VIA THE
ACID-LIME NEUTRALISATION ROUTE
14 GENERAL INFORMATION
The reference installation produces calcium chloride (CaCl2) solution with varia-
ble concentrations in a batch process. CaCl2 solutions are mainly used for de-
icing, high purity solutions are also used in the paper industry.
The reference installation under discussion has a permitted annual capacity of
42,120 t of calcium chloride brine and produces on average 11,000 t per year..
The installation is permitted according to the IED Annex I, activity 4.2.
15 PRODUCTION OF CALZIUMCHLORID
In the acid-lime route for the calcium chloride production high purity lime stone
(CaCO3) is mixed with hydrochloric acid (HCl). HCl and CaCO3 react to CaCl2,
carbon dioxide (CO2) and water (H2O).
Flow diagram for CaCl2 production
ReactionCaCO3 + 2 HCl →
CaCl2 + CO2 + H2O
CO2
Limestone HCl
Neutralisation2 HCl + Ca(OH)2 →
CaCl2 + 2 H2O
Ca(OH)2
FiltrationFilter
mud
CaCl2 Brine
ConcentrationEnergy
Flaking
Drying
Bagging
CaCl2 Pellets
WaterEnergy
Water
Source: BREF LVIC-S (2007)
Figure 3: Schematic process flow diagram for CaCl2 production via the acid-lime neutralisation route according
to BREF LVIC-S

Production of inorganic metal compounds – Calcium chloride production via the acid-lime neutralisation route
22 Umweltbundesamt Vienna, 2017
In the next step, the pH value is raised by adding milk of lime (Ca(OH)2). The
increased pH value cause the precipitation of impurities from the lime stone
such as magnesium or iron salts. Silicates, also impurities from the lime stone,
and the precipitated impurities mentioned before are removed by filtration.
Source: BREF LVIC-S (2007)
Figure 3 gives an overview of the production process.
The concentration of CaCl2 in the final aqueous solution is up to 33%. Lower
concentrations are diluted on customer request.
The plant has a retention pond in size of at least the largest single container in-
cluding the areas associated.
16 CURRENT EMISSION AND CONSUMPTION LEVELS
16.1 Process emissions
The exhaust air of the production process of calcium chloride and from the HCl
storage tank is washed in an aqueous gas scrubber. The permitted emission
limit value for HCl in the released off gas is 30 mg/Nm³.
The compliance with the permitted emission limit value had to be verified by one
single acceptance test. No periodic measurements to be in compliance with the
permit are required.
HCl emissions over the period of one batch including refilling of the HCl storage
tank (equals 4 hours and 20 minutes) was measured in 2015 with 7.8 mg/Nm³
(Source: Operator information 2016).
16.2 Water
No waste water emissions from the process occur. Process water from the
aqueous scrubber to abate HCl is reused in the reactor for the production of
calcium chloride. HCl is needed for the reaction of limestone to CaCl2 and CO2.
16.3 Waste
The primary source of waste in the production process is the amount of insolu-
ble silicates in the limestone, which are filtered off and disposed.
Hazardous waste produced in the years 2010 to 2014 according to the E-PRTR
register is shown in Table 9.

Production of inorganic metal compounds – Calcium chloride production via the acid-lime neutralisation route
Umweltbundesamt Vienna, 2017 23
Year Hazardous waste in tonnes per year
2010 29
2011 32
2012 5
2013 3
2014 13
2010 29
2011 32
16.4 Energy consumption
In 2014 approx. 16.6 MWh electricity were used for production and approx.
2.2 MWh for non-production (e.g. office). Approx. 30.5 MWh heat were used for
the whole site.
17 REFERENCES
BREF LVIC-S (2007): Reference Document on Best Available Techniques for the
Manufacture of Large Volume Inorganic Chemicals – Solids and Others industry
from August 2007.
All information was received in personal messages from the operator of the ref-
erence installation.
Table 9:
Hazardous waste from
calcium chloride
production according to
E-PRTR register from
2010 – 2014.

Production of inorganic metal compounds – Metal sulphides production
24 Umweltbundesamt Vienna, 2017
METAL SULPHIDES PRODUCTION
18 GENERAL INFORMATION
The reference installation under discussion hereafter produces metals sulphides
for tribological adjustments in brake linings, abrasives and lubricants. Further-
more, the products are used in electronics, metallurgy and as polymer additives.
The products include a variety of sulphides such as iron, copper, molybdenum,
tungsten, zinc, tin, bismuth, chromium, silver and antimony sulphides. Since the
use of naturally occurring sulphides without a chemical reaction is not covered
by the IED Annex I, the description refers solely to processes were a chemical
synthesis is carried out.
The installation is covered by the IED Annex I. The installation is currently nego-
tiating the IED-permit with the local authorities.
19 PRODUCTION OF SULPHIDES
The synthetic sulphides are produced by a closed chemical reaction in a reac-
tor. Some raw materials require a pre-treatment, by e. g. grinding to enhance
the surface. The raw materials are fed into a reaction container and the chemi-
cal reaction is initiated. The resulting metal sulphides are subsequently milled,
homogenised and packaged.
20 CURRENT EMISSION AND CONSUMPTION LEVELS
20.1 Process emissions
The main pollutants in the process used for the synthesis of sulphides are:
dust
SO2
Dust emissions occur due to milling of the final products and the charging of the
reaction vessel with raw materials. The exhaust gas from the processes are
pre-cleaned in a fabric filter and subsequently collected with other waste gas
streams from non-IPPC process units. The combined exhaust gas is finally
cleaned by a High Efficiency Particulate Air filter (HEPA). The guaranteed max-
imum concentration after the central filter device is 2 mg/Nm3.
SO2 emissions are obtained in the reaction vessels. The exhaust gas from the
sulphides synthesis is washed in a 2-stage wet scrubber with lime water result-
ing in the formation of gypsum. The emission levels and the emission limit val-
ues are displayed in Table 5.

Production of inorganic metal compounds – Metal sulphides production
Umweltbundesamt Vienna, 2017 25
Reactor 1 has an emission limit value of 100 mg/Nm3 whereas in reactor 2 an
emission limit value of 150 mg/Nm3 is mandatory. SO2 emissions have to be
monitored continuously. The daily averages of both reactors in two representa-
tive months range from approximately 45 mg/Nm3 to 80 mg/Nm
3.
SO2 [mg/Nm³] Emission values Emission limit values
rea
cto
r 1
1)
feb.16 DAmin 55.3 100
MA 65.4
DAmax 75.4
mar.16 DAmin 58.7
MA 67.5
DAmax 77.5
rea
cto
r 2
2)
feb.16 DAmin 42.8 150
MA 57.3
DAmax 79.5
mar.16 DAmin 48.5
MA 60.1
DAmax 76.8
DAmin: minimum daily average within 1 month;
DAmax: maximum daily average within 1 month;
MA: monthly average.
1) dry gas, standard conditions with 3°C, no reference oxygen content (O2 as obtained).
2) dry gas, standard conditions, no reference oxygen content (O2 as obtained).
20.2 Waste
Waste occurs due to the SO2 abatement. Calcium hydroxide is used in the
scrubbers to reduce sulphur dioxide resulting in the formation of gypsum. The
waste is disposed to a landfill site.
The yearly amount of gypsum in the reference year 2015 was 396 to.
21 REFERENCES
All information was received in personal messages from the operator of the ref-
erence installation.
Table 10:
Emission limit values
and emission levels of
SO2 after wet scrubber,
continuous monitoring in
the reference months
February and March
2016.