production, dielectric property and microwave absorption property of sic(fe) solid ... ·...
TRANSCRIPT
Original papers
Ceramics – Silikáty 58 (1) 33-38 (2014) 33
PRODUCTION, DIELECTRIC PROPERTY AND MICROWAVE ABSORPTION PROPERTY OF SiC(Fe) SOLID SOLUTION POWDER
BY SOL-GEL METHOD#XIAOLEI SU, YAN JIA, XIAOQIN LIU, JUNBO WANG, JIE XU, XINHAI HE, CHONG FU, SONGTAO LIU
College of Mechanical & Electronic Engineering, Xi’an Polytechnic University,Xi’an, Shaanxi 710048, PR China
#E-mail: [email protected]
Submitted September 17, 2013; accepted March 3, 2014
Keywords: Silicon carbide, Sol-gel, Dielectric properties
SiC(Fe) solid solution powders were synthesized by sol–gel method under different reaction time, using methyltriethoxysilane as the silicon and carbon source and analytic ferric chloride as the dopant, respectively. The synthesized powders have been characterized by XRD, SEM and Raman spectra. Results show that the lattice constant decreases with increasing reaction time. The electric permittivities of SiC samples were determined in the frequency range of 8.2 ~ 12.4 GHz. Results show that the permittivity of SiC decreases with increasing reaction time. The SiC(Fe) solid solution powder with reaction time of 4 h with 2 mm thickness exhibit the best microwave absorption property in X-band range (8.2 - 12.4 GHz). The microwave absorption mechanism has been discussed.
INTRODUCTION
In recent years, electromagnetic (EM) wave absor-bing materials, such as ZnO, Fe3O4, C nanotube and SnO2 nanowires, have presented great interest because of more and more civil, commercial, and military applications in electromagnetic interference (EMI) shielding and radar cross section (RCS) reduction in the microwave (gigahertz) range [1-8]. However, compared with aforementioned absorber SiC has many excellent properties, e.g. high strength and hardness, good corrosion resistance, high thermal stability and thermal conductivity [9-11], and is a dielectric loss material, which has been used in the high-temperature components of aircraft. However, the pure SiC material presents poor absorbing ability in the gigahertz (GHz) band range. Li, Jin and Luo et al. have synthesized the Al-doped SiC powder by combustion synthesis, microwave method and thermal diffusion method, respectively, which show the better dielectric property than the pure SiC powder in X-band range due to the formation of Al Si defects [8, 12-13]. Zhao and Jiao et al. have prepared N-doped SiC powders by laser synthesis and chemical vapor deposition, respectively, which present also the better dielectric property than the undoped SiC powder in the frequency from 8.2 GHz to 12.4 GHz due to the generation of NC defects [14-15]. Li has produced the Ni-doped SiC powder by mechanically activated self
propagating high-temperature synthesis method and also presents the better dielectric property in the same frequency range [16]. Compared with Ni element, the Fe element presents similar electron configuration and shows the same effect on microstructure and dielectric property of SiC powders possibly. In addition, the sol-gel is an easy controlling method and adjusts the concentration of prepared product precisely. In the paper, SiC(Fe) solid solution powders were synthesized by sol-gel method under different reaction time, using analytic ferric chloride as dopant and analytic methyltriethoxysilane as silicon and carbon source, respectively. The electric permittivity of doped SiC powders have been determined in the frequency range of 8.2 - 12.4 GHz. The effect of reaction time on dielectric property of SiC powder has been discussed. At the same time, the microwave absorption property of prepared SiC powder has been presented.
EXPERIMENTAL
Preparation Process
The sol has been prepared using analytic methyl-triethoxysilane (MTES, CH3Si(OCH2CH3)3) as silicon and carbon source, analytic ferric chloride (FeCl3) as dopant and analytic ethanol and distilled water as solvents. The MTES has been dissolved in ethanol first, and then solid FeCl3 has been dissolved in water.
Su X., Jia Y., Liu X., Wang J., Xu J., He X., Fu Ch., Liu S.
34 Ceramics – Silikáty 58 (1) 33-38 (2014)
Both them have been mixed together with molar ratio of Fe:Si:C = 0.1:1:7. During the process of stirring for homogeneity, the pH value of the mixture was kept at 3 ~ 4 with the catalyst of HCl. The prepared sol has been placed into drying oven to xerogel at 70°C The xerogel was ground and poured into a graphite crucible inside a sintering furnace, and then calcined at 1600°C for 3 h, 4 h or 5 h in a 0.1 MPa nitrogen atmosphere for carbothermal reduction reactions with heating rate of 20°C/min. Additionally, because the excess carbon and unreacted silicon in the synthesized products will affect the accuracy of dielectric property, the products have been calcined in air at 650°C for 0.5 h to remove excess carbon, and then have been deep into the hydrofluoric acid (HF) and nitric acid (HNO3) for 24 h to remove the unreacted silicon and the other impurities. The Fe-doped SiC powders have been obtained after drying at 120°C.
Compositional, microstructureand dielectric property characterization
The products were identified by X-ray diffraction (XRD, X’Pert PRO MPD, Cu Kα). The morphology of the prepared powders was investigated by scanning electronic microscope (SEM, JSM-6360LV, JEOL, Tokyo, Japan). A Raman spectrometer (LabRAM HR800, Horbia Jobin Yvon, France) was utilized, using the 514 nm line of an Ar ion laser as the excitation source for spectroscopic measurements. Because of the low dielectric loss of paraffin, the samples for dielectric parameters measurement at room temperature were prepared by mixing the produced powders with paraffin in amass ratio of 20:80, and then the mixtures were molded into a brass flange to fabricate rectangular composite samples with the dimensions of 10.16 mm (width) × 22.86 mm (length) × 2 mm (thickness). The dielectric parameters were carried out by waveguide technique with mode TE10 in the frequency range of 8.2 ~ 12.4 GHz, with the prepared samples set in a brass holder in which fills the waveguide. After being calibrated with an intermediate of a short circuit and blank holder, reflection and transmission losses were obtained by PNA network analyzer (Agilent Technologies E8362B, Palo Alto, CA), and then both the real and imaginary parts of the permittivity were given.
Microwave absorptionproperty characterization
According to the transmission line theory, the reflection loss curves can be calculated from the complex permittivity and permeability at a given frequency as well as the thickness of microwave absorbing materials. For a single layer absorber, the reflection loss (RL) is given by reference [10]:
RL(dB) = 20 ∙ lg |(Zin – Z0)/(Zin + Z0)| (1)
where the input impedance Zin of a metal-backed micro-wave absorbing layer is given by
Zin = Z0 √µr/εr tan h (j2π √µr/εr f d/c) (2)
where Z0 is the impendency of the free space; μr and εr are the relative permeability and permittivity of the absorber, respectively; f is the frequency of the electromagnetic wave; d is the thickness of the absorber; and c is the velocity of light in free space; μr = μr′ – jμr″ and εr = εr′ – jεr″. In this study, because SiC is a dielectric loss material, μr′ and μr″ are 1 and 0, respectively.
RESULTS AND DISCUSSION
XRD results
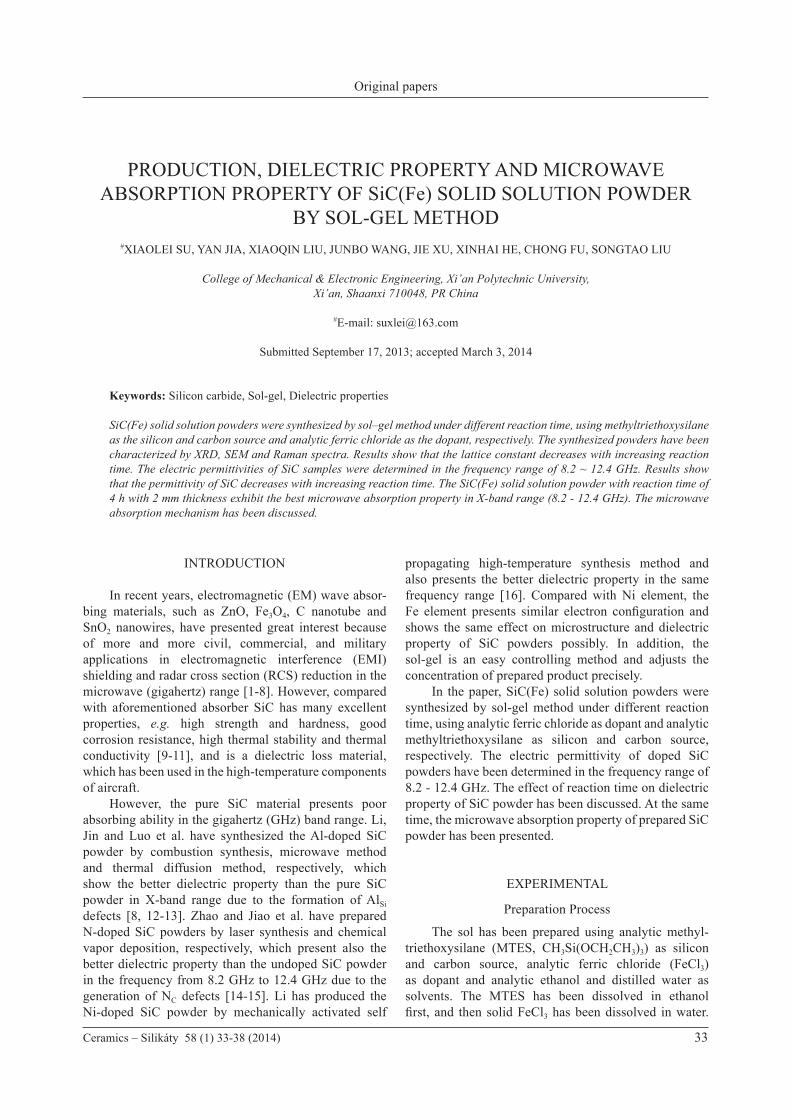
Figure 1 shows XRD patterns of the prepared SiC powders by sol-gel method under different reaction time. It can be seen that the β-SiC powders have been synthesi-zed successfully by sol-gel method under different reac-tion time. The peak intensities corresponding to β-SiC phase for all samples increase with increasing reaction time. The reason is that the extending reaction time leads to the better crystallization of SiC. Additionally, because molar ratio of Si and C atoms in MTES is 1:7, the excess carbon has been also detected in all XRD patterns before removing of carbon. Simultaneously, the Si-Fe compound phase has been observed in all produced powders. The Fe–Si compound probably was formed through the reaction between Si and Fe at the initial stage of reaction. Since the compounds in the Fe–Si system have melting points ranging from 1207°C to 1410°C and temperature of synthesizing reaction is above 1200°C, they become solidified to form Fe–Si compound during cooling[17].
In addition, the lattice constants have been calcu-lated by Scherrer formula. The lattice constants a corres-ponding to β-SiC doped by Fe with reaction time of
Figure 1. XRD patterns of the prepared SiC powders by sol-gel method under different reaction time: a) 3 h, b) 4 h, c) 5 h.
2θ (°)
β-SiCFe-SiC
Inte
nsity
(a.u
.)
20 30 40
a)
b)
c)
50 60 70 80
Production, dielectric property and microwave absorption property of SiC(Fe) solid solution powder by sol-gel method
Ceramics – Silikáty 58 (1) 33-38 (2014) 35
3 h, 4 h and 5 h are 4.365 Å, 4.362 Å, and 4.358 Å, respectively, which shows the decrease of lattice constant with increasing reaction time. Because of the covalent radius of Fe (1.17 Å) larger than that of Si (1.11 Å) the increase of lattice constant is caused by the substitution of Si atoms in SiC lattice by Fe atoms possibly, which leads to the larger lattice constants of sample (a) and sample (b) than standard value of lattice constant of β-SiC. In addition, because amounts of Fe atom entering SiC crystal and substituting the Si atoms of SiC crystal decreases due to the precipitation of Fe atoms from SiC lattice with increasing reaction time, it leads to the gradual decrease of lattice constant. Therefore, the lattice constant of sample (c) equals almost to the standard value of lattice constant of β-SiC.
SEM results
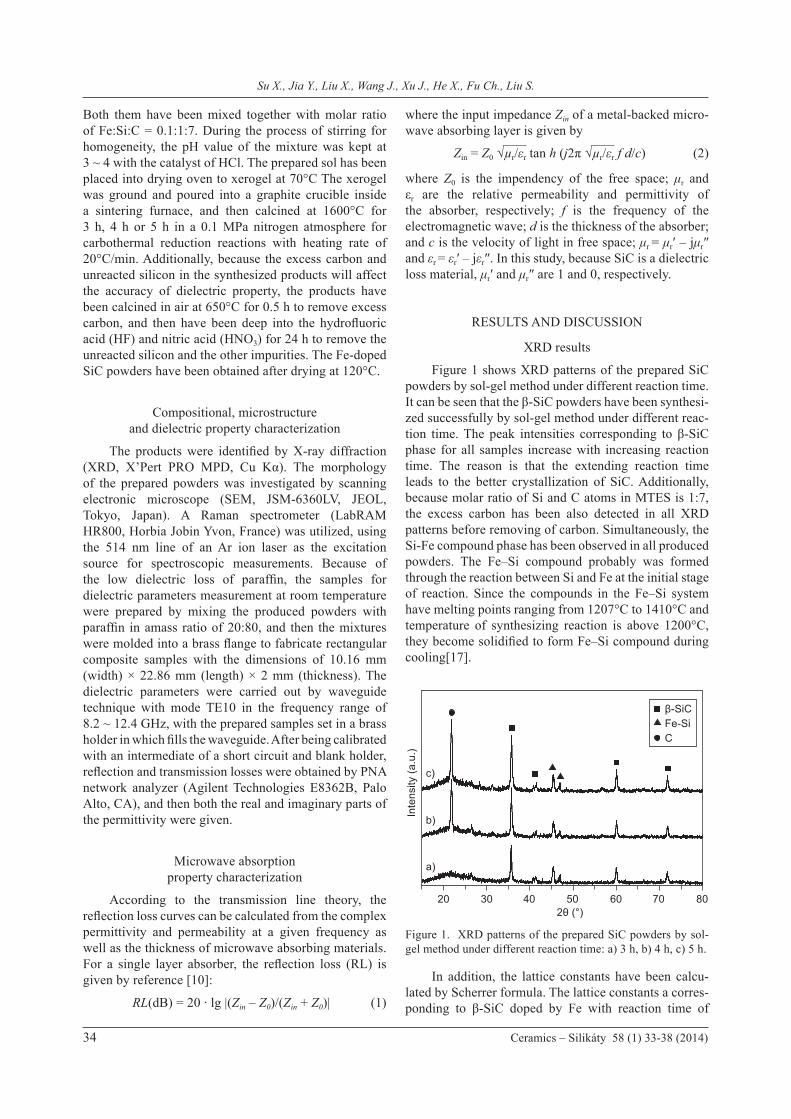
The SEM photographs of the prepared powders are shown in Figure 2. It can be seen that amounts of SiC whisker are observed in SEM photographs of sample a)
and b). The reason is that during the synthesis processing, the following reactions took place: Fe2O3 (s) + 7 Si (l) → 2 FeSi2 (l) + 3 SiO (g) (3) 2 Fe2O3 (s) + 11 Si (l) → 4 FeSi2 (l) + 3 SiO2 (s) (4) SiO2 (s) + C (s) → SiO (g) + CO (g) (5) SiO (g) + 2 C (s) → SiC (s) + CO (g) (6) SiO (g) + 3 CO (g) → SiC (s) + 2 CO2 (g) (7) 3 SiO (g) + CO (g) → SiC (s) + 2 SiO2 (s) (8) CO2 (g) + C (s) → 2 CO (g) (9) The overall reaction is:
SiO2 (s) + 3 C (s) → SiCw (s) + 2 CO (g) (10)
In addition, it can be seen that the produced SiC powder has the irregular shape and particle size increases with extending reaction time. It is consistent with XRD analysis that the increasing reaction time leads to the better crystalization and growth of SiC. Simultaneously, it presents the sintering phenomena because of the high synthesized temperature, which has been presented in Figure 2c-2.
Figure 2. SEM micrographs of the prepared SiC powders by sol-gel method under different reaction time: a) 3 h, b) 4 h, c) 5 h.
a) 3 h
c-1) 5 h
b) 4 h
c-2) 5 h
Su X., Jia Y., Liu X., Wang J., Xu J., He X., Fu Ch., Liu S.
36 Ceramics – Silikáty 58 (1) 33-38 (2014)
Raman spectra
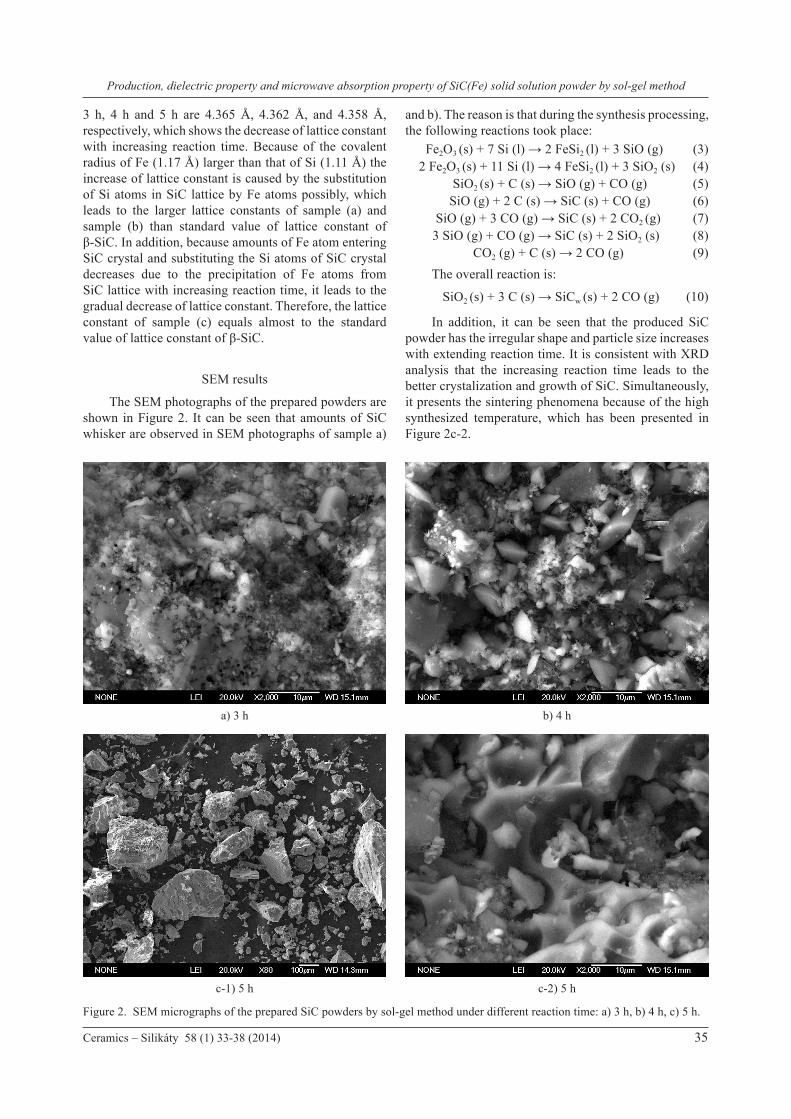
Figure 3 shows the Raman spectra of the SiC powders synthesized by sol-gel method under different reaction time. For all samples, the Raman spectra show the presence of a weak peak at 790 cm-1 and a weak peak at 960 cm-1, which correspond to the transverse optical (TO) and longitudinal optical (LO) phonon mode peaks of β-SiC, respectively [18]. The reason is that the Fe doping disturbs the SiC crystal and leads to the disappearance of TO and LO peaks possibly. In addition, any characteristic peaks corresponding to Fe–Si compounds or silica compounds are not observed, which demonstrates that the products are pure SiC. The peaks at 1580 cm-1 and 1350 cm-1 are related to the G peak of carbon (graphite like carbon, sp2 carbon) and D peak of carbon, which is indicative of the presence of C-C sp3 bonds or exist of diamond like carbon (sp3 car-bon), in β-SiC [19-20]. The ratio of integrated intensity (I(D)/I(G)) corresponds to the ratio of sp2/sp3 of bonded carbon [21]. The ratio of I(D)/I(G) in Raman spectra of prepared SiC powders decrease with increasing reaction time. It shows that the ratio of sp2/sp3 of bonded carbon decreases with reaction time extension. In addition, it can be seen that the intensities of D peak and G peak decrease with reaction time increase, indicating that both sp2 and sp3 bonded carbon amounts decrease. According to the related study [22], when the prepared powder is C-enriched SiC, it is more suitable for p-type doping than the other SiC. So, when the amounts of sp2 carbon and sp3 carbon decreases, Fe atom, entering SiC crystal and substituting Si atoms of SiC lattice, decrease with increasing reaction time. So, the extending reaction time will lead to the worse Fe-doping for SiC.
Dielectric property
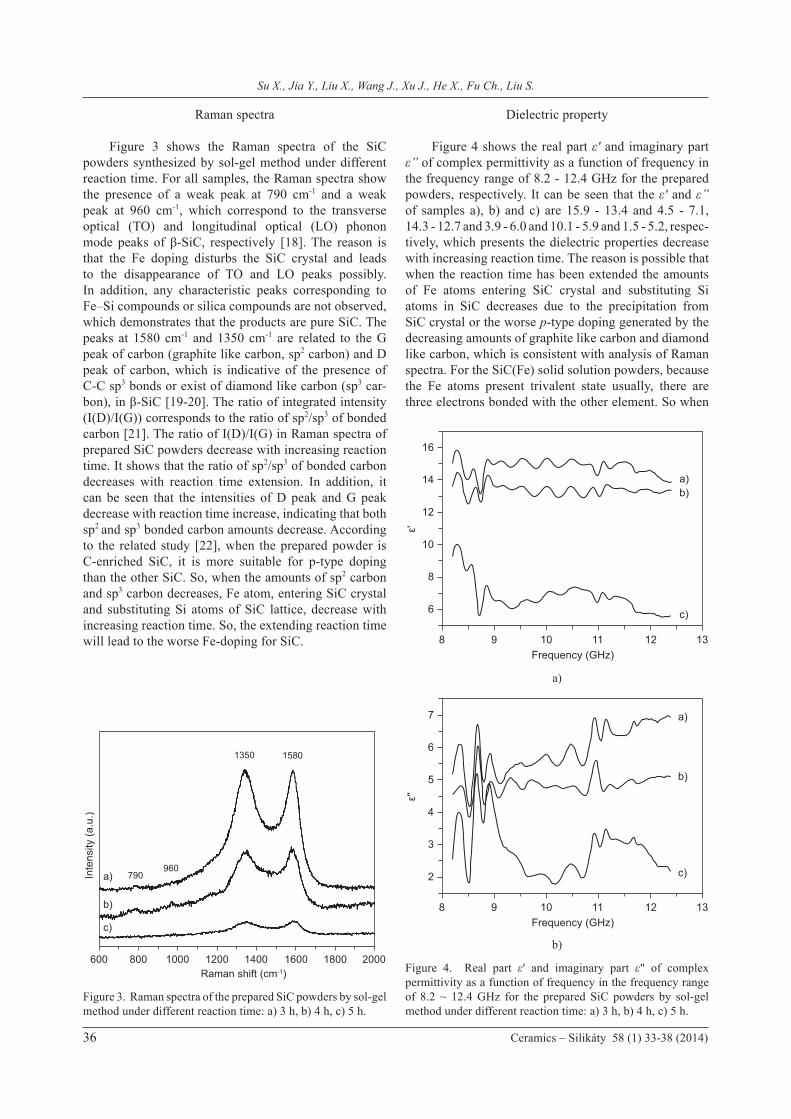
Figure 4 shows the real part ε′ and imaginary part ε” of complex permittivity as a function of frequency in the frequency range of 8.2 - 12.4 GHz for the prepared powders, respectively. It can be seen that the ε′ and ε” of samples a), b) and c) are 15.9 - 13.4 and 4.5 - 7.1, 14.3 - 12.7 and 3.9 - 6.0 and 10.1 - 5.9 and 1.5 - 5.2, respec-tively, which presents the dielectric properties decrease with increasing reaction time. The reason is possible that when the reaction time has been extended the amounts of Fe atoms entering SiC crystal and substituting Si atoms in SiC decreases due to the precipitation from SiC crystal or the worse p-type doping generated by the decreasing amounts of graphite like carbon and diamond like carbon, which is consistent with analysis of Raman spectra. For the SiC(Fe) solid solution powders, because the Fe atoms present trivalent state usually, there are three electrons bonded with the other element. So when
Figure 3. Raman spectra of the prepared SiC powders by sol-gel method under different reaction time: a) 3 h, b) 4 h, c) 5 h.
Raman shift (cm-1)
Inte
nsity
(a.u
.)
600 800
790960
1350 1580
1000
a)
b)
c)
1200 1400 1600 20001800Figure 4. Real part ε′ and imaginary part ε" of complex permittivity as a function of frequency in the frequency range of 8.2 ~ 12.4 GHz for the prepared SiC powders by sol-gel method under different reaction time: a) 3 h, b) 4 h, c) 5 h.
a)
b)
Frequency (GHz)
a)b)
c)
ε'
8
6
8
10
12
14
16
9 10 11 12 13
Frequency (GHz)
a)
b)
c)
ε''
8
2
3
4
5
6
7
9 10 11 12 13
Production, dielectric property and microwave absorption property of SiC(Fe) solid solution powder by sol-gel method
Ceramics – Silikáty 58 (1) 33-38 (2014) 37
Fe atoms entered the SiC lattice and substituted the Si atoms, Fe-doped SiC, the p-type material, has been synthesized and there will exists bound holes around FeSi defects in SiC crystal. Under the alternating electromagnetic field, these bound holes will migrate to and fro to form relaxation polarization and loss, thus leading to the higher ε′ and ε”, respectively. So the ε′ and ε” decrease with decreasing FeSi defects concentration due to reaction time extension. In addition, the ratio of sp2/sp3 of bonded carbon decrease with reaction time increasing, it leads to the lower electrical conductivity of prepared SiC powder because the electrical conductivity of sp3 C corresponding to π state is worse than that of sp2 C corresponding to σ state. It also leads to the decrease of ε′ and ε” of prepared SiC powders.
Microwave absorption property
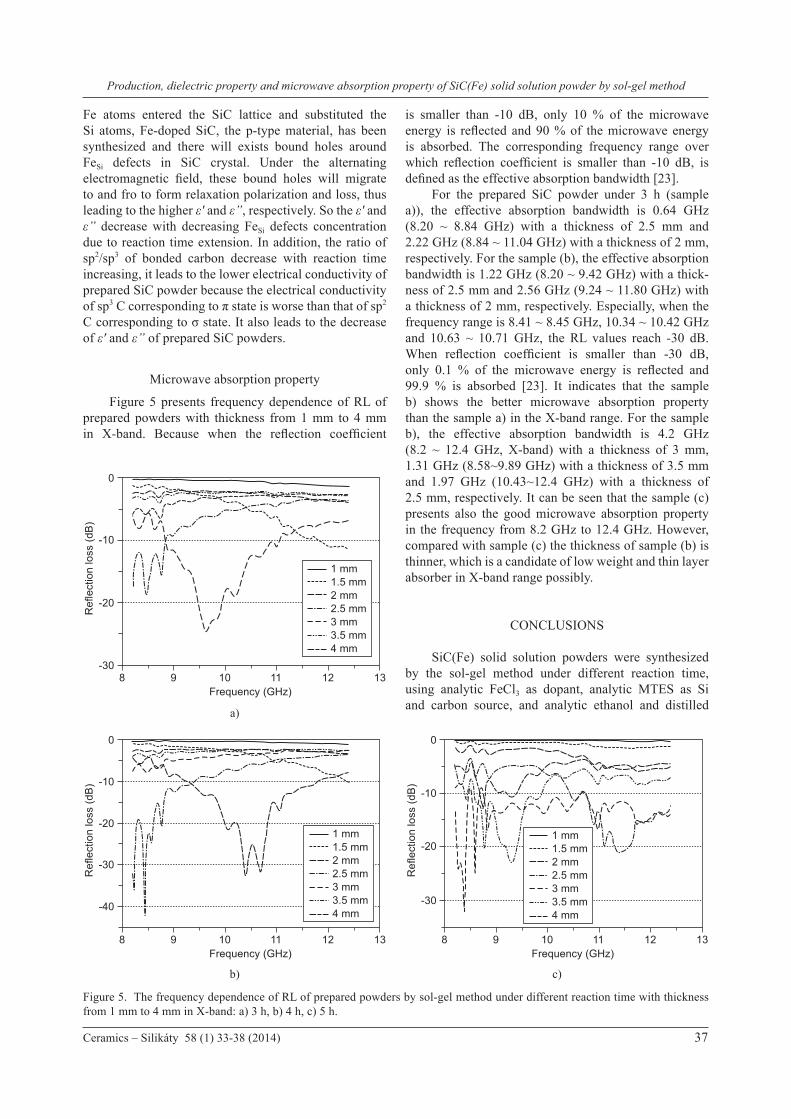
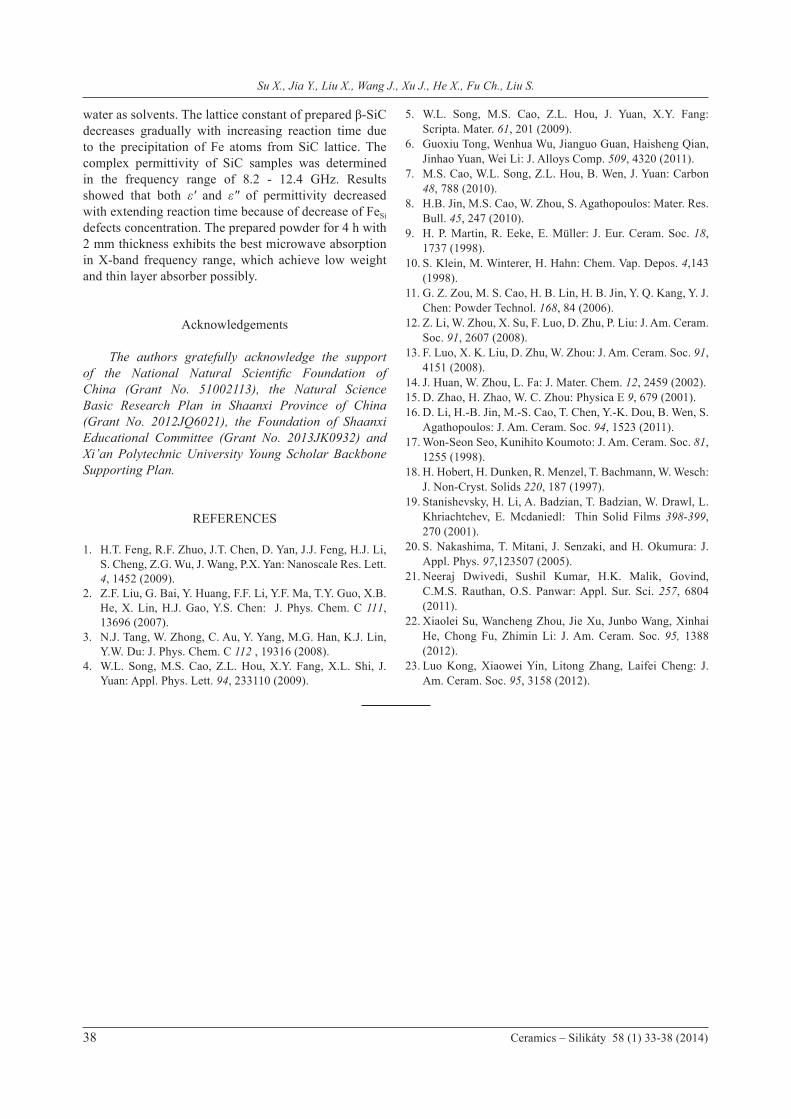
Figure 5 presents frequency dependence of RL of prepared powders with thickness from 1 mm to 4 mm in X-band. Because when the reflection coefficient
is smaller than -10 dB, only 10 % of the microwave energy is reflected and 90 % of the microwave energy is absorbed. The corresponding frequency range over which reflection coefficient is smaller than -10 dB, is defined as the effective absorption bandwidth [23]. For the prepared SiC powder under 3 h (sample a)), the effective absorption bandwidth is 0.64 GHz (8.20 ~ 8.84 GHz) with a thickness of 2.5 mm and 2.22 GHz (8.84 ~ 11.04 GHz) with a thickness of 2 mm, respectively. For the sample (b), the effective absorption bandwidth is 1.22 GHz (8.20 ~ 9.42 GHz) with a thick-ness of 2.5 mm and 2.56 GHz (9.24 ~ 11.80 GHz) with a thickness of 2 mm, respectively. Especially, when the frequency range is 8.41 ~ 8.45 GHz, 10.34 ~ 10.42 GHz and 10.63 ~ 10.71 GHz, the RL values reach -30 dB. When reflection coefficient is smaller than -30 dB, only 0.1 % of the microwave energy is reflected and 99.9 % is absorbed [23]. It indicates that the sample b) shows the better microwave absorption property than the sample a) in the X-band range. For the sample b), the effective absorption bandwidth is 4.2 GHz (8.2 ~ 12.4 GHz, X-band) with a thickness of 3 mm, 1.31 GHz (8.58~9.89 GHz) with a thickness of 3.5 mm and 1.97 GHz (10.43~12.4 GHz) with a thickness of 2.5 mm, respectively. It can be seen that the sample (c) presents also the good microwave absorption property in the frequency from 8.2 GHz to 12.4 GHz. However, compared with sample (c) the thickness of sample (b) is thinner, which is a candidate of low weight and thin layer absorber in X-band range possibly.
CONCLUSIONS
SiC(Fe) solid solution powders were synthesized by the sol-gel method under different reaction time, using analytic FeCl3 as dopant, analytic MTES as Si and carbon source, and analytic ethanol and distilled
Figure 5. The frequency dependence of RL of prepared powders by sol-gel method under different reaction time with thickness from 1 mm to 4 mm in X-band: a) 3 h, b) 4 h, c) 5 h.
a)
b) c)
Frequency (GHz)
Ref
lect
ion
loss
(dB
)
8-30
-20
-10
0
9 10 11 12 13
1 mm1.5 mm2 mm2.5 mm3 mm3.5 mm4 mm
Frequency (GHz)
Ref
lect
ion
loss
(dB
)
8
-30
-40
-20
-10
0
9 10 11 12 13
1 mm1.5 mm2 mm2.5 mm3 mm3.5 mm4 mm
Frequency (GHz)
Ref
lect
ion
loss
(dB
)
8
-30
-20
-10
0
9 10 11 12 13
1 mm1.5 mm2 mm2.5 mm3 mm3.5 mm4 mm
Su X., Jia Y., Liu X., Wang J., Xu J., He X., Fu Ch., Liu S.
38 Ceramics – Silikáty 58 (1) 33-38 (2014)
water as solvents. The lattice constant of prepared β-SiC decreases gradually with increasing reaction time due to the precipitation of Fe atoms from SiC lattice. The complex permittivity of SiC samples was determined in the frequency range of 8.2 - 12.4 GHz. Results showed that both ε′ and ε″ of permittivity decreased with extending reaction time because of decrease of FeSi defects concentration. The prepared powder for 4 h with 2 mm thickness exhibits the best microwave absorption in X-band frequency range, which achieve low weight and thin layer absorber possibly.
Acknowledgements
The authors gratefully acknowledge the support of the National Natural Scientific Foundation of China (Grant No. 51002113), the Natural Science Basic Research Plan in Shaanxi Province of China (Grant No. 2012JQ6021), the Foundation of Shaanxi Educational Committee (Grant No. 2013JK0932) and Xi’an Polytechnic University Young Scholar Backbone Supporting Plan.
REFERENCES
1. H.T. Feng, R.F. Zhuo, J.T. Chen, D. Yan, J.J. Feng, H.J. Li, S. Cheng, Z.G. Wu, J. Wang, P.X. Yan: Nanoscale Res. Lett. 4, 1452 (2009).
2. Z.F. Liu, G. Bai, Y. Huang, F.F. Li, Y.F. Ma, T.Y. Guo, X.B. He, X. Lin, H.J. Gao, Y.S. Chen: J. Phys. Chem. C 111, 13696 (2007).
3. N.J. Tang, W. Zhong, C. Au, Y. Yang, M.G. Han, K.J. Lin, Y.W. Du: J. Phys. Chem. C 112 , 19316 (2008).
4. W.L. Song, M.S. Cao, Z.L. Hou, X.Y. Fang, X.L. Shi, J. Yuan: Appl. Phys. Lett. 94, 233110 (2009).
5. W.L. Song, M.S. Cao, Z.L. Hou, J. Yuan, X.Y. Fang: Scripta. Mater. 61, 201 (2009).
6. Guoxiu Tong, Wenhua Wu, Jianguo Guan, Haisheng Qian, Jinhao Yuan, Wei Li: J. Alloys Comp. 509, 4320 (2011).
7. M.S. Cao, W.L. Song, Z.L. Hou, B. Wen, J. Yuan: Carbon 48, 788 (2010).
8. H.B. Jin, M.S. Cao, W. Zhou, S. Agathopoulos: Mater. Res. Bull. 45, 247 (2010).
9. H. P. Martin, R. Eeke, E. Müller: J. Eur. Ceram. Soc. 18, 1737 (1998).
10. S. Klein, M. Winterer, H. Hahn: Chem. Vap. Depos. 4,143 (1998).
11. G. Z. Zou, M. S. Cao, H. B. Lin, H. B. Jin, Y. Q. Kang, Y. J. Chen: Powder Technol. 168, 84 (2006).
12. Z. Li, W. Zhou, X. Su, F. Luo, D. Zhu, P. Liu: J. Am. Ceram. Soc. 91, 2607 (2008).
13. F. Luo, X. K. Liu, D. Zhu, W. Zhou: J. Am. Ceram. Soc. 91, 4151 (2008).
14. J. Huan, W. Zhou, L. Fa: J. Mater. Chem. 12, 2459 (2002).15. D. Zhao, H. Zhao, W. C. Zhou: Physica E 9, 679 (2001).16. D. Li, H.-B. Jin, M.-S. Cao, T. Chen, Y.-K. Dou, B. Wen, S.
Agathopoulos: J. Am. Ceram. Soc. 94, 1523 (2011).17. Won-Seon Seo, Kunihito Koumoto: J. Am. Ceram. Soc. 81,
1255 (1998).18. H. Hobert, H. Dunken, R. Menzel, T. Bachmann, W. Wesch:
J. Non-Cryst. Solids 220, 187 (1997).19. Stanishevsky, H. Li, A. Badzian, T. Badzian, W. Drawl, L.
Khriachtchev, E. Mcdaniedl: Thin Solid Films 398-399, 270 (2001).
20. S. Nakashima, T. Mitani, J. Senzaki, and H. Okumura: J. Appl. Phys. 97,123507 (2005).
21. Neeraj Dwivedi, Sushil Kumar, H.K. Malik, Govind, C.M.S. Rauthan, O.S. Panwar: Appl. Sur. Sci. 257, 6804 (2011).
22. Xiaolei Su, Wancheng Zhou, Jie Xu, Junbo Wang, Xinhai He, Chong Fu, Zhimin Li: J. Am. Ceram. Soc. 95, 1388 (2012).
23. Luo Kong, Xiaowei Yin, Litong Zhang, Laifei Cheng: J. Am. Ceram. Soc. 95, 3158 (2012).