process changes with impact - mi-wea.org
TRANSCRIPT

Process Changes with Impact
Michigan Water Environment Association Sustainable Energy Seminar
October 20, 2015
Nathan Cassity, Donohue & Associates
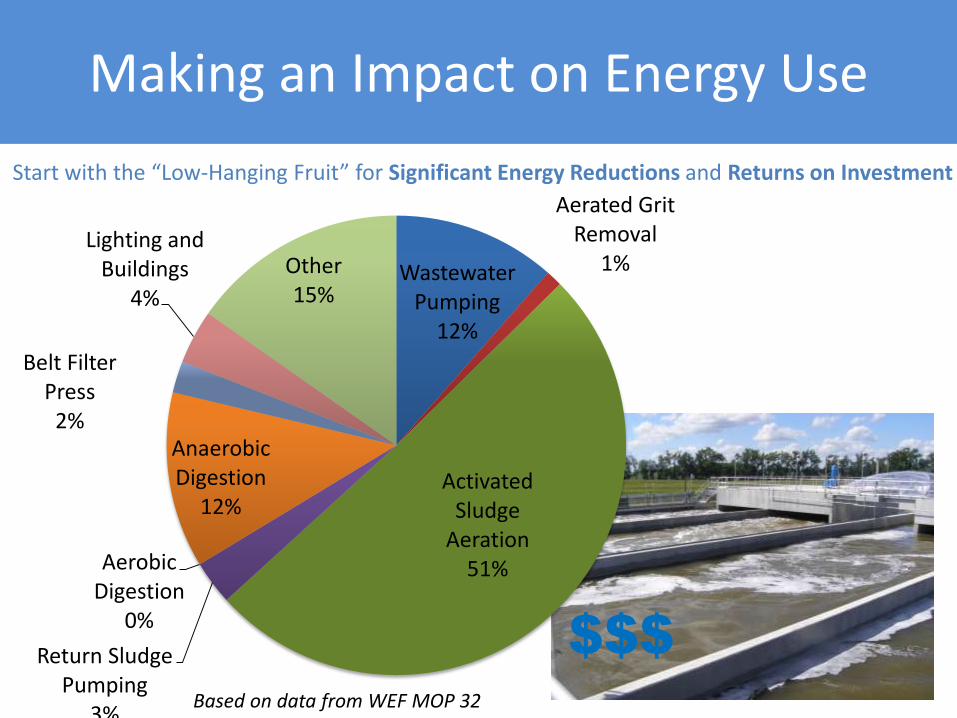
Making an Impact on Energy Use
Start with the “Low-Hanging Fruit” for Significant Energy Reductions and Returns on Investment
$$$
Wastewater Pumping
12%
Aerated Grit Removal
1%
Activated Sludge
Aeration 51%
Return Sludge Pumping
3%
Aerobic Digestion
0%
Anaerobic Digestion
12%
Belt Filter Press
2%
Lighting and Buildings
4%
Other 15%
Based on data from WEF MOP 32

Reducing Aeration Energy
High Efficiency Blowers Will Reduce Aeration Energy
Blower Sizing and Aeration System Controls Can Reduce it Even Further
Battle Creek Wastewater Treatment Plant – Battle Creek, MI • Evaluation of High-Speed Turbo Arrangements and Aeration Control
Flagg Creek Water Reclamation District – Flagg Creek, IL
• High-Speed Turbo and Most Open Valve Implementation Stickney Water Reclamation Facility (MWRDGC) – Chicago, IL
• Ammonia Based DO Control and Improved Blower Operation
Case Studies

Battle Creek, MI
Process Type: Single-Stage Activated Sludge with Nitrification
Current ADF: 9 MGD
Heavy Industrial BOD Loading: 580 mg/L Average Influent BOD
Energy Savings Rebate Incentives Available through Electricity Provider (Consumers Energy)

Blowers
Aeration Control
Aeration Energy Picture
Diffusers
Energy Evaluation Approach
1. Provide the air more efficiently
2. Reduce the amount of air Provided
Comprehensive Aeration System Study Approach:

Blower Evaluation
(3) Multi-Stage Centrifugal Blowers Turndown: Manual Inlet Throttling Max Flow: 21,000 scfm Min Flow: 13,000 scfm Age: > 30 years, motor replaced recently
(3) Positive Displacement Blowers No Turndown Capability Flow: 7,000 scfm Age: > 40 years
Firm Operating Capacity Range: 13,000 – 63,000

Existing Equipment
0
10,000
20,000
30,000
40,000
50,000
60,000
70,000
0% 20% 40% 60% 80% 100%
Air
flo
w (
scfm
)
Percent of Time Equal or Less Than
Existing blower capacity
Turndown to 20th percentile requirements
Probability Distribution Curve

Selected Arrangement
Single Core Arrangement
Work Best With Existing
Layout

Propose Equipment Upgrades
Improved Turndown
0
10,000
20,000
30,000
40,000
50,000
60,000
70,000
0% 20% 40% 60% 80% 100%
Air
flo
w (
scfm
)
Percent of Time Equal or Less Than
Remaining centrifugal blower capacity
New turbo blower capacity
New equipment sized to meet majority of demand
Greater Energy Efficiency Over Operating Range

Estimated Blower Savings
0
1,000,000
2,000,000
3,000,000
4,000,000
5,000,000
6,000,000
7,000,000
8,000,000
Current Blowers New Blowers
Esti
mat
ed
An
nu
al k
Wh
• 25% Reduction in Blower Energy Use • $121,000 in annual electricity cost savings • $139,000 incentive rebate from utility • 10-Year Payback
Anticipated Savings:

Air Requirements
Goal is to save energy by more closely matching air supply to air requirements:
0
5,000
10,000
15,000
20,000
25,000
2010 2011 2012 2013 2014
Airflow
Average Air Required (scfm) Average Air Supplied (acfm)
Observed Periods of Potential Over-Aeration -> Energy Reduction Opportunity
Estimated Avg. Annual Savings Potential: $100K

Aeration Control Strategies
Estimated $40,000 in Savings
Blower Control

Aeration Control Strategies
Estimated $80,000 in Savings
Blower Control
DO Control

Aeration Control Strategies
Estimated $100,000 in Savings
Blower Control
DO Control

Estimated Blower and Control Savings
Anticipated Savings:
0
1,000,000
2,000,000
3,000,000
4,000,000
5,000,000
6,000,000
7,000,000
8,000,000
Current System New System
Esti
mat
ed
An
nu
al k
Wh
Additional 1,420,000 kWh per year
45% Total Reduction in Aeration Energy Use
Total estimated savings of $220,000 annually

Aeration Control Strategies
Blowers
To Other Tanks/Passes
FIT
FIT
Blower Speed Adjusts to the Total
Flow Setpoint
DO
Each of 3 Passes in Every Aeration Tank
DO Control with Direct Air Flow Control
Eliminating Pressure Setpoint Can Provide Additional Energy Savings
Advanced Nutrient Control Also Evaluated (Topic For Future Presentation)

Flagg Creek, IL
Blowers
Aeration Tanks 1-4
Aeration Tanks 5-6
AVG 12 MGD

Flagg Creek, IL
Space for Additional Blower
Multistage Centrifugal/ Inlet Valve Throttling

Initial Blower Comparison
0
100
200
300
400
500
600
3,000 3,500 4,000 4,500 5,000 5,500 6,000 6,500 7,000 7,500 8,000
amp
s
Air Flow (scfm)
Existing Blower Turbo Blower
50 amps Savings

Installed Operating Results
100 amps Savings
0
100
200
300
400
500
600
amp
s
Turbo Blower Equivalent Multistage

Current Valve Operation
Throttling Both Valves At Low Flow

Most Open Valve
Blowers
Unsymmetrical Layout And Aeration Demand
Set Most Open Valve

Savings Achieved
Annual Energy Savings: 766,349 kWh
@ $0.07/kWh
Annual Cost Savings: $53,644
Energy Incentive Grants:
Illinois Clean Energy Community Foundation
$60,425 (Received)
Department of Commerce and Economic Opportunity $201,460 (Approved)
Total Capital Cost: $338,700
Out of Pocket Costs: $76,815
Anticipated Payback Period:
1.4 years
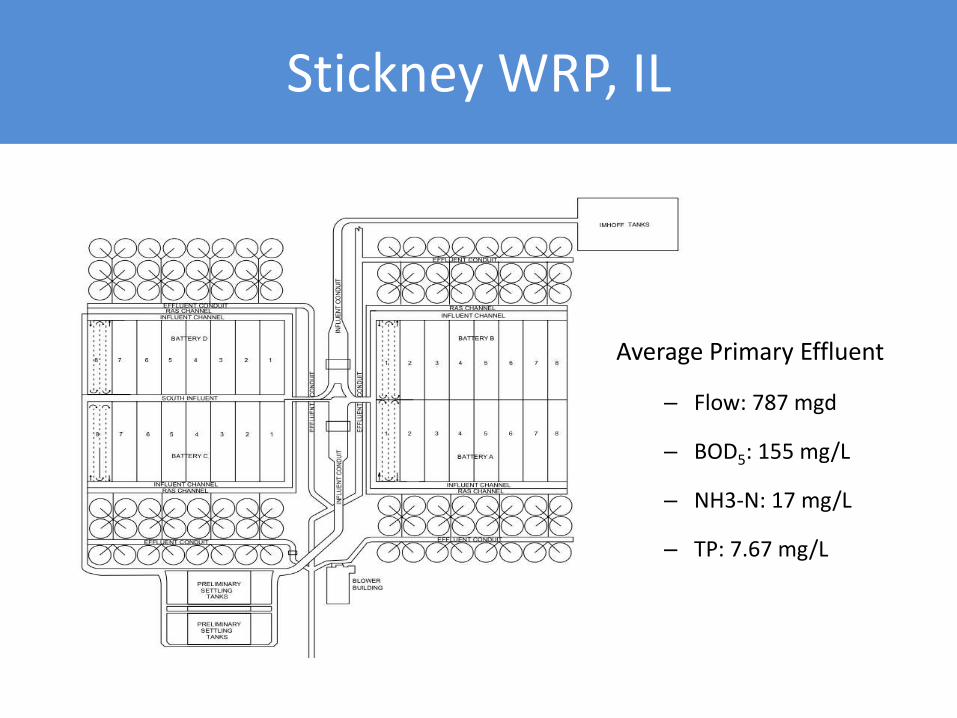
Stickney WRP, IL
Average Primary Effluent
– Flow: 787 mgd
– BOD5: 155 mg/L
– NH3-N: 17 mg/L
– TP: 7.67 mg/L

Steady State Whole Plant Model

Dynamic Aeration Model
Simplified Overall Model

0
100,000
200,000
300,000
400,000
500,000
600,000
700,000
0% 10% 20% 30% 40% 50% 60% 70% 80% 90% 100%
Air
flo
w (
scfm
)
Total Airflow Data DO Control Ammonia Control
Air Requirements Air Requirements

0
100,000
200,000
300,000
400,000
500,000
600,000
700,000
0% 10% 20% 30% 40% 50% 60% 70% 80% 90% 100%
Air
flo
w (
scfm
)
Total Airflow Data DO Control Ammonia Control
Air Requirements
DO Control 13% of Total Air
Air Requirements
DO Control Currently Limited
By Blower Controls

0
2
4
6
8
10
12
NH
3 (
mg/
L)
NH3 Control DO Control
Ammonia Based DO Control

0
100,000
200,000
300,000
400,000
500,000
600,000
700,000
0% 10% 20% 30% 40% 50% 60% 70% 80% 90% 100%
Air
flo
w (
scfm
)
Total Airflow Data DO Control Ammonia Control
Air Requirements
Ammonia Control 19% of Total Air
Air Requirements

Installed Blowers
Blower
Number
Design
Blower Size
Design
Discharge
Pressure
Average
Blower
Output
Number
of Units
Motor
Size
4 - 7 195,000 scfm 8.2 psig 230,000 scfm 4 10,000 hp
2 155,000 scfm 8.0 psig TBD 1 7,000 hp
3 70,000 scfm 8.4 psig 82,000 scfm 1 4,000 hp
Blowers

0
100,000
200,000
300,000
400,000
500,000
600,000
700,000
800,000
4 Min 4 Max 3+4 Min 3+4 Max 4+5 Min 4+5 Max 3+4+5 Min 3+4+5 Max
scfm
Blower 3
Blower 5
Blower 4
Current Blower Operation Current Blower Operation

Addition of Blower No. 2
0
100,000
200,000
300,000
400,000
500,000
600,000
700,000
800,000
3+4 Min 3+4 Max 2+4 Min 2+4 Max 4+5 Min 4+5 Max 2+4+5 Min 2+4+5 Max
scfm
Blower 3
Blower 2
Blower 5
Blower 4
Addition of Blower No 2

0
100,000
200,000
300,000
400,000
500,000
600,000
700,000
800,000
3 Min 3 Max 2 Min 2 Max 4 Min 4 Max 3+4 Min 3+4Max
2+4 Min 2+4Max
4+5 Min 4+5Max
2+4+5Min
2+4+5Max
scfm
Blower 3
Blower 2
Blower 5
Blower 4
All Blowers + Improved Big Blower Turndown Improved Blower Turndown

0
100,000
200,000
300,000
400,000
500,000
600,000
700,000
800,000
T+3 Min T+3 Max T+2 Min T+2 Max T+4 Min T+4 Max T+4+2 Min T+4+2 Max
scfm
Blower 3
Blower 2
Blower 4
Turblex
Improved Blower Efficiency

All Blowers + Improved Big Blower Turndown Payback
Blower No 2
Improved Blower
Controls New Big Blower
Two New Big Blowers
DO Control 1.0 2.2 5.6 8.2
Ammonia Control
1.0 1.9 4.6 7.1

Reducing Aeration Energy
High Efficiency Blowers Will Reduce Aeration Energy
Blower Sizing and Aeration System Controls Can Reduce it Even Further
Battle Creek Wastewater Treatment Plant – Battle Creek, MI • Evaluation of High-Speed Turbo Arrangements and Aeration Control
Flagg Creek Water Reclamation District – Flagg Creek, IL
• High-Speed Turbo and Most Open Valve Implementation Stickney Water Reclamation Facility (MWRDGC) – Chicago, IL
• Ammonia Based DO Control and Improved Blower Operation
Case Studies

Process Changes with Impact
Michigan Water Environment Association Sustainable Energy Seminar
October 20, 2015
Nathan Cassity, Donohue & Associates