proceedings of international conference on advances in
TRANSCRIPT

123
ADVANCES IN INTELLIGENT SYSTEMS AND COMPUTING 174
Proceedings of International Conference on Advancesin Computing
Aswatha Kumar M.Selvarani R.T.V. Suresh Kumar (Eds.)

Advances in Intelligent Systemsand Computing 174
Editor-in-Chief
Prof. Janusz KacprzykSystems Research InstitutePolish Academy of Sciencesul. Newelska 601-447 WarsawPolandE-mail: [email protected]
For further volumes:http://www.springer.com/series/11156

Aswatha Kumar M., Selvarani R.,and T.V. Suresh Kumar (Eds.)
Proceedings of InternationalConference on Advancesin Computing
ABC

EditorsDr. Aswatha Kumar M.M.S. Ramaiah Institute of TechnologyBengaluruIndia
Dr. Selvarani R.M.S. Ramaiah Institute of TechnologyBengaluruIndia
Dr. T.V. Suresh KumarM.S. Ramaiah Institute of TechnologyBengaluruIndia
ISSN 2194-5357 e-ISSN 2194-5365ISBN 978-81-322-0739-9 e-ISBN 978-81-322-0740-5DOI 10.1007/978-81-322-0740-5Springer New Delhi Heidelberg New York Dordrecht London
Library of Congress Control Number: 2012941516
c© Springer India 2013This work is subject to copyright. All rights are reserved by the Publisher, whether the whole or part of thematerial is concerned, specifically the rights of translation, reprinting, reuse of illustrations, recitation, broad-casting, reproduction on microfilms or in any other physical way, and transmission or information storageand retrieval, electronic adaptation, computer software, or by similar or dissimilar methodology now knownor hereafter developed. Exempted from this legal reservation are brief excerpts in connection with reviewsor scholarly analysis or material supplied specifically for the purpose of being entered and executed on acomputer system, for exclusive use by the purchaser of the work. Duplication of this publication or partsthereof is permitted only under the provisions of the Copyright Law of the Publisher’s location, in its cur-rent version, and permission for use must always be obtained from Springer. Permissions for use may beobtained through RightsLink at the Copyright Clearance Center. Violations are liable to prosecution underthe respective Copyright Law.The use of general descriptive names, registered names, trademarks, service marks, etc. in this publicationdoes not imply, even in the absence of a specific statement, that such names are exempt from the relevantprotective laws and regulations and therefore free for general use.While the advice and information in this book are believed to be true and accurate at the date of publication,neither the authors nor the editors nor the publisher can accept any legal responsibility for any errors oromissions that may be made. The publisher makes no warranty, express or implied, with respect to the materialcontained herein.
Printed on acid-free paper
Springer is part of Springer Science+Business Media (www.springer.com)

Preface
We are very happy to bring this Proceedings of International Conference on Advancesin Computing 2012 (ICAdC 2012). This Conference is being organized by the depart-ments of Information Science & Engineering, Computer Science & Engineering, andComputer Applications of M.S. Ramaiah Institute of Technology (MSRIT), Bengaluru,Karnataka, India. This programme is being organized under the Golden Jubilee celebra-tions of MSRIT (Estd. 1962). We are happy to organize the event at MSRIT, Bengaluru,where the idea for this Conference was blossomed. The participants to visit Bengaluruin July may experience rain and wind opportunities. The themes of the Conference,viz., Theoretical Computer Science, Systems and Software, and Intelligent Systems,cover the broader spectrum of computing and its advances; these are the common fac-tors of all the three departments. The Conference tries to provide the platform to allsenior and young researchers to share their knowledge as well to have networking forstrengthening their research activities. We have received overwhelming response fromall corners but could not accommodate them all. We are extremely delighted to receiveresearch contributions from different parts of the world, including Australia, UnitedKingdom, South Africa, Ethiopia, Iceland, Vietnam, Iran, and Mauritius. It is true thatthe success of such events depends on the quality of the papers and on the efforts ofthe Conference organizers. All the contributions are peer reviewed by program com-mittee members/technical committee reviewers. The reviews are focussed primarily onoriginality, quality and relevance to the theme of the Conference. As large numbers ofcontributions were accepted, it was decided to have parallel sessions so that interestedgroups may interact with other researchers in their interested research areas. We con-vey our special thanks to all the authors for submitting their research outcomes to thisConference, to the program committee/technical review committee, and to numerousreviewers who did an excellent job in guaranteeing that the articles in this volume areof good quality.

VI Preface
We also thank all the committee members for their efforts to make the Conference agrand success. The editors profoundly thank the management for the generous financialsupport extended to this Conference.
Aswatha Kumar M.Selvarani R.
T.V. Suresh Kumar

Organization
M.S. Ramaiah Institute of TechnologyInternational Conference on Advances in Computing -2012 (ICAdC-2012)
Conference General ChairK. Rajanikanth, MSRIT, Bengaluru, India
Program ChairsAswatha Kumar M., MSRIT, Bengaluru
Selva Rani, MSRIT, BengaluruT.V. Suresh Kumar, MSRIT, Bengaluru
Advisory Committee
Prof. B.N. Chatterji Indian Institute of Technology Kharagpur, KolkataDr. V. Gopalakrishna Director, Integra Micro SystemsJayanta Mukhopadhyay Indian Institute of Technology, KharagpurY. Narahari Indian Institute of Science, BengaluruS.S. Iyengar Florida International University, Miami, USADr. C.P. Ravikumar Texas Instruments India, Bangalore 560093,
IndiaRaghu Nambiar Siemens Ag, Bangalore, IndiaRavi Ramaswamy Philips Electronics India Ltd. Bangalore, IndiaDr. Shantanuchaudhury Indian Institute of Technology, DelhiDr. N.L. Sarda Indian Institute of Technology Bombay, Mumbai,
IndiaKrishna M. Kavi Dept. of CSE, Denton, Texas, USAK. Chidanandagowda Former Vc, Kuvempu University, MysoreBhabatoshchanda Indian Statistical Institute, Kolkata, IndiaK.R. Murali Mohan Department of Science e& Technology NewS. Ramesh Babu Infosys, BangaloreJohn Tsitsiklis Massachusetts Institute Of Technology, Cambridge,
USADr. G. Athithan Centre for Ai and Robotics, Bangalore, IndiaAjith Abraham Machine Intelligence Research Lab, Washington,
USAMeldal, Sigurd San Jose State University, USA

VIII Organization
Program Committee
Prof. Vasanth Honnavar Iowa State University Ames, Iowa, USAProf. Rajkumar Buyya The University of Melbourne, Melbourne, AustraliaProf. N. Sundararajan Nanyang Technological University, SingaporeProf. Ruppa Thulasiram University of Manitoba, CanadaDr. Rajib Mall Indian Institute of Technology, Kharagpur, IndiaDr. Lokesh Boregowda Honeywell Technology Solutions Lab, BangaloreDr. Shyam Vasudevarao Philips Healthcare, Philips Electronics India Ltd,
Bangalore, IndiaDr. David K. Kahaner Asian Technology Information Program (ATIP),
JapanS.R. Mahadeva Prasanna Indian Institute of Technology, GuwahatiC.V. Jawahar International Institute of Information Technology,
Hyderabad, IndiaFrancis Chi Moon Lau The University of Hong Kong, Hong KongBhabani P. Sinha Indian Statistical Institute(ISI), Kolkata, IndiaMuthu Ramachandran Leeds Metropolitan University, Leeds,
United KingdomUmapada Pal Indian Statistical Institute(ISI), Kolkata, IndiaShrishaRao International Institute of Information Technology,
Bangalore, IndiaC.B. Akki Wipro Technologies, Electronics City,
Bengaluru-560100M. Khalid Professor & Dean, VIT University, Vellore-632014,
TamilnaduN.K. Srinath R V College of Engg., Mysore Road, BengaluruNiranjan U.C. Research and Training, Manipal-576104T.N. Nagabhushan S.J. College of Engg., Mysore, IndiaV.R. Udupi Gogte Institute of Technology, Belgaum, IndiaK.S. Shreedhara UBDT College of Engineering, DavangereSriman Narayana Iyengar VIT University, Vellore, IndiaUmesh Bellur Indian Institute of Technology, Bombay, IndiaNitin Auluck Indian Institute of Technology, Ropar, IndiaVenkatesh Prasad Ranganath Microsoft Research, India (Software Engg.),
Bangalore, IndiaR. Venkatesh Babu Indian Institute of Science, Bengaluru, IndiaSundaram Suresh Nanyang Technological University, SingaporeRanga V. Narayanan Samsung INDIA SOFTWARE OPERATIONS
PVT LTD., Bangalore, IndiaAjith Bopardikar Samsung India Software Operations, Bangalore,
IndiaM.S. Dinesh Siemens Information Systems, Bengaluru, India

Organization IX
Organizing Committee
Department of Computer Science & Engg
Dr. R. SelvaraniProf. S.M. NarayanaDr. Vijaya Kumar B.P.Dr. K.G. SrinivasaAnita KanavalliSeema S.Annapurna P. PatilJagadish S.K.Jayalakshmi D.S.Monica R. MundadaSanjeetha R.A. ParkaviVeena G.S.J. GeethaT.N.R. Kumar
Ramanagouda S. PatilMamatha Jadhav V.SuvarnaChethan C.T.Sini Anna AlexSardar Vandana SudhakarMeera Devi A. KawalgiMalle Gowda M.R. ManoranjithamH.V. DivakarChandrika PrasadLeelavathi RathodRajarajeshwariSowmyarani C.N.Sunanda V.K.
Department of Information Science & Engineering
Dr. Aswatha Kumar M.Dr. Lingaraju G.M.N. RameshRajaram M. GowdaMydhili K. NairS.R. ChickerurShashidhara H.S.George PhilipT. TamilarasiSavita K. ShettyMyna A.N.Deepthi K.P.M. Krishnaraj
Rajeshwari S.B.Siddesh G.M.Pushpalatha M.N.Mohan Kumar S.Sumana M.Prashanth KambliNaresh E.Jagadeesh Sai D.Mani Sekhar S.R.Suresh Kumar K.R.Sunitha R.S.Sandeep B.L.Dayananda P.
Department of MCA
Dr . T.V. Suresh KumarS. AjithaS. JagannathaD. Evangelin GeethaMadhu BhanM. Mrunalini
Chethan VenkateshSailaja KumarSeema D.Manish KumarNiranjana Murthy M.
Technical Note
Computing power is increasing day by day, making the impossible become possible. Wecan create and visualize virtual world, speeding up time to simulate the creation of theuniverse or slowing down time to understand the interaction of the most basic particlesof matter. Technology has grown to a wider dimension in all the sectors and has madeeverything virtual, is driven by the advancement in technology. However, this seemsto apply mainly to developed nations, while developing countries still struggle withantediluvian machinery and systems. The primary sector that supplicates rapid devel-opment is intelligent computing and ICT, all are interdependent. The role of IntelligentComputing and ICT in a developing society cannot be exaggerated. Hence there is aneed for academicians to take a major role in providing a smooth takeover of advancedintelligent computing and ICT in the young mindsets and interested researchers.
The development of technology in the domain of intelligent computing, communi-cation and Information providing an end user/terminal requirement has given the wayfor integrated system design and development. Similarly, rapid advances in modern highspeed networks and wireless/mobile networks, with the support of Internet growth, haveproduced tremendous research and commercial opportunities in the areas of mobilemultimedia Networks (2G, 3G, and 4G), ubiquitous and pervasive computing systems.The main focus of this International Conference – ICAdC-2012 is to provide the bene-fits to the academicians, researchers and industrialist to bring in a smooth transition inthe developing countries. Some of them include the following.
• Provide a platform to engineers, academicians, budding research scholars, Ph.D.scholars of various Engineering Colleges/ Universities/ Institutes to show case theirresearch in the field of education and develop aptitude for writing technical papers.
• Discuss the future direction of research and new technologies, which can be helpfulin research.
• Networking the professionals from various sectors with academic institutions forbetter education and work flow.
• Promote the benefits of the applications of Standards and Ethics in the government,academia and industry.
ICAdC-2012 seeks to bring together international researchers to present paper andgenerate discussions on current research and development in all aspects of IT.

XII Technical Note
Special Emphasis will be made on the aspects of R&D development through severalpresentations of research papers and key note addresses. The conference addresses thefollowing topics: New Theoretical Computer Science, Systems and Software, Intelli-gent Systems.
We wish the dignitaries, participants and specially the organizing team in makingthis event a grand success.
About the Editors
Dr. Aswatha Kumar M. is working as Professor & Head of the Department of Informa-tion Science & Engineering since 2007. Before joining MSRIT, he has worked as Pro-fessor & Head of the Department of Computer Science & Engineering in JNN Collegeof Engineering, Shimoga, Karnataka. He has also served two decades in Governmentof Karnataka. His research interests are in the areas of Image Processing. He has pub-lished more than 40 papers in Journals and Conferences. His research papers has beenawarded as Best Papers in National as well as International Conferences. He has estab-lished new centres in association with various industries. He is also a board member ofstudies/examination boards of various universities. At present his research focuses arein the areas of document processing and medical imaging.
Dr. R. Selvarani is currently working as the Head of Department of Computer sci-ence and engineering in M.S. Ramaiah Institute of Technology, Bangalore. Earlier tothis, she was the Dean Research in Dayananda Sagar Institutions, Bangalore. She hasa dedicated teaching and research carrier spanning over 20 years in various universi-ties including the position of Head of Department of Computer Science and Engineer-ing for a period of 9 years. Two times she has been awarded the best teacher awardfrom different Institutions. Her research interest spreads over the modern approachesin the area of Software Design and Architecture, CBSD, software quality estimationtechniques, Analytical Software Engineering, Metrics and Measurements, software de-sign quality estimation and software industry process and computational models forreal time systems, service oriented architecture and cloud computing technology, Dis-tributed networks and computer networks. She has more than 40 research publicationsin peer reviewed international journals and conferences. Her research interest has leadto 2 patents on technology innovation. She has published a book in Computer scienceand Engineering and currently working on 2 research handbooks in multidisciplinarydomain. She is the Managing Editor of 2 international journals published from the re-search centre. She is the chairman/member of different board of studies/examinationsof various universities.

XIV About the Editors
Dr. T.V. Suresh Kumar is the Professor and Head of the Department of Master ofComputer Applications in M S Ramaiah Institute of Technlogy, Bangalore. He receivedhis Ph.D in Applied Mathematics from S K University, Anantapur, India. He has 20years of experience in academics and 15 years of experience in research. He is super-vising 5 Ph.D theses under Visvesvaraya Technological University, Belgaum and he hassupervised M.S, M.Tech and over 10 M.Phil theses in Computer Science. He has pub-lished over 55 research papers and authored books on Java, J2EE and Data Mining. Hehas carried out funded projects from CASSA, DRDL, DRDO and UGC and consultancyprojects from 7H Group of Companies and M S Ramaiah Dental College and Hospi-tal. He is a visiting faculty for several renowned industries such as Intel, Honey Well,SAP Labs, Wipro Technologies, Jataayu Soft, Mphasis, Integra Micro Systems, HCLTechnologies, Blue Star Infotech, L&T, Nokia, DRDO-CAIR, DRDO-CASSA, IndianInstitute of Science (Proficience) and Various Universities/Academic Institutions. He isa member of Board of Studies and Board of Exams in various institutions. He is a lifemember of ISTE and Secretary for IEEE SMC Society Bangalore Chapter. His researchand teaching interests include Object Technology, Software Engineering, Software Per-formance Engineering, System Simulation and Reliability Engineering.

Contents
New Theoretical Computer Science
Multilevel Feedback Queue Scheduling Technique for Grid ComputingEnvironments . . . . . . . . . . . . . . . . . . . . . . . . . . . . . . . . . . . . . . . . . . . . . . . . . . . . . 1Dharamendra Chouhan, S.M. Dilip Kumar, B.P. Vijaya Kumar
Location and Detection of a Text in a Video . . . . . . . . . . . . . . . . . . . . . . . . . . . . 9T.N.R. Kumar, S.K. Srivatsa, S. Murali
Hidden Markov Model with Computational Intelligence for DynamicClustering in Wireless Sensor Networks . . . . . . . . . . . . . . . . . . . . . . . . . . . . . . . 19Veena K.N., Vijaya Kumar B.P.
Assessment of Workload Using Shapely Value in Distributed Database . . . . . 31S. Jagannatha, T.V. Suresh Kumar, D.E. Geetha, K. Rajani Kanth
Modeling and Estimation of Cooperative Index for Multi-Agent SystemsUsing Execution Graph . . . . . . . . . . . . . . . . . . . . . . . . . . . . . . . . . . . . . . . . . . . . 41S. Ajitha, T.V. Suresh Kumar, D. Evangelin Geetha, K. Rajani Kanth
QoS Multicast Routing Using Teaching Learning Based Optimization . . . . . 49Anima Naik, K. Parvathi, Suresh Chandra Satapathy, Ramanuja Nayak,B.S. Panda
A New Privacy Preserving Measure: p-Sensitive, t-Closeness . . . . . . . . . . . . . 57Sowmyarani C.N., G.N. Srinivasan, Sukanya K.
Indic Language Translation in CLIR Using Virtual Keyboard . . . . . . . . . . . . 63Mallamma V. Reddy, M. Hanumanthappa
Energy Efficient Clustering and Grid Based Routing in Wireless SensorNetworks . . . . . . . . . . . . . . . . . . . . . . . . . . . . . . . . . . . . . . . . . . . . . . . . . . . . . . . . 69Amrutha K.M., Ashwini P., Divyashree K. Raj, Kavitha Rani G.,Monica R. Mundada

XVI Contents
A Comparative User-Centric Study of Digital Library Software Systems . . . 75Samaneh Ahmadi, Shiva Shirdavani, Srini Ramaswamy
Adaptive Hexa-Diamond Search (AHDS) Algorithm for Fast BlockMatching Motion Estimation . . . . . . . . . . . . . . . . . . . . . . . . . . . . . . . . . . . . . . . . 85M.K. Pushpa, S. Sethu Selvi
A Probabilistic Solution to Rendezvous Problem . . . . . . . . . . . . . . . . . . . . . . . 95Shivam Agarwal, Arup Kumar Pal, Vihang Gosavi, Hemant Gangolia
Satellite Image Feature Extraction Using Neural Network Technique . . . . . . 101T. Karthikeya Sharma, Sarvesh Babu N.S., Y.N. Mamatha
Identifying Refactoring Opportunity in an Application: A Metric BasedApproach . . . . . . . . . . . . . . . . . . . . . . . . . . . . . . . . . . . . . . . . . . . . . . . . . . . . . . . . 107Syamala Kumari Dora, Debananda Kanhar
Technologies for Cost Efficient Enterprise Resource Planning:A Theoretical Perspective . . . . . . . . . . . . . . . . . . . . . . . . . . . . . . . . . . . . . . . . . . . 113Shivani Goel, Ravi Kiran, Deepak Garg
Test Case Generation Using Activity Diagram and Sequence Diagram . . . . . 121Abinash Tripathy, Anirban Mitra
User Authentication Using Keystroke Recognition . . . . . . . . . . . . . . . . . . . . . . 131Urvashi Garg, Yogesh Kumar Meena
On Decidability and Matching Issues for Regex Languages . . . . . . . . . . . . . . 137Praveen Alevoor, Pratik Sarda, Kalpesh Kapoor
Randomized Algorithms: On the Improvement of Searching TechniquesUsing Probabilistic Linear Linked Skip Lists . . . . . . . . . . . . . . . . . . . . . . . . . . 147Yogeesha C.B., Ramachandra V. Pujeri, Veena R.S.
Review of Proposed Architectures for Automated Text Summarization . . . . . 155Tejas Yedke, Vishal Jain, R.S. Prasad
Steer-By-Wire Implementation Using Kinect . . . . . . . . . . . . . . . . . . . . . . . . . . 163Rohan Sadale, Roshan Kolhe, Sachin Wathore, Jagannath Aghav,Saket Warade, Sandeep Udayagiri
An Efficient Incentive Compatible Mechanism to Motivate WikipediaContributors . . . . . . . . . . . . . . . . . . . . . . . . . . . . . . . . . . . . . . . . . . . . . . . . . . . . . 171Mane Pramod, Sajal Mukhopadhyay, D. Gosh
Simulating Spiking Neuron for Information Theoretic Analysisin Stochastic Neuronal System . . . . . . . . . . . . . . . . . . . . . . . . . . . . . . . . . . . . . . . 183Sanjeev Kumar

Contents XVII
Nash Equilibrium and Marcov Chains to Enhance Game TheoreticApproach for Vanet Security . . . . . . . . . . . . . . . . . . . . . . . . . . . . . . . . . . . . . . . . 191Prabhakar M., J.N. Singh, G. Mahadevan
Fast Computation of Image Scaling Algorithms Using Frequency DomainApproach . . . . . . . . . . . . . . . . . . . . . . . . . . . . . . . . . . . . . . . . . . . . . . . . . . . . . . . . 201Prasantha H.S., Shashidhara H.L., K.N.B. Murthy
Word Level Script Identification of Text in Low Resolution Imagesof Display Boards Using Wavelet Features . . . . . . . . . . . . . . . . . . . . . . . . . . . . . 209S.A. Angadi, M.M. Kodabagi
Analytical Study Using Data Mining for Periodical Medical Examinationof Employees . . . . . . . . . . . . . . . . . . . . . . . . . . . . . . . . . . . . . . . . . . . . . . . . . . . . . 221Kiran Waghmare, Anusha R. Pai
Syntactic Representation of Shape of Object Using Regular Grammar . . . . . 229Saket Jalan, Pinaki Roy Chowdhury, K.K. Shukla
Message Overhead Analysis of Quorum Protocols . . . . . . . . . . . . . . . . . . . . . . 237Parul Pandey, Maheshwari Tripathi
Modified (Q, r) Policy for Stochastic Inventory Control Systems in SupplyChain . . . . . . . . . . . . . . . . . . . . . . . . . . . . . . . . . . . . . . . . . . . . . . . . . . . . . . . . . . . 247R. Bakthavachalam, S. Navaneethakrishnan, C. Elango
Single Input Variable Universe Fuzzy Controller withContraction-Expansion Factor for Double Inverted Pendulum . . . . . . . . . . . . 257Yogesh Kr. Dhanni, M.J. Nigam
Performance Evaluation of A Novel Most Recently Used FrequencyCount (MRUFC) List Accessing Algorithm . . . . . . . . . . . . . . . . . . . . . . . . . . . . 267Rakesh Mohanty, Ashirbad Mishra
Automatic Test Case Generation Using Sequence Diagram . . . . . . . . . . . . . . . 277Vikas Panthi, Durga Prasad Mohapatra
Normalized Wavelet Hybrid Feature for Consonant Classificationin Noisy Environments . . . . . . . . . . . . . . . . . . . . . . . . . . . . . . . . . . . . . . . . . . . . . 285T.M. Thasleema, N.K. Narayanan
Cuckoo Search for Inverse Problems and Topology Optimization . . . . . . . . . 291Xin-She Yang, Suash Deb
A Lock Management Framework for a Class Hierarchy Tree . . . . . . . . . . . . . 297Arvind Mohan, Gaurav Singhal, Bhaskar Biswas
XVIII Contents
Systems and Software
ECG Arrhythmia Classification Using R-Peak Based Segmentation,Binary Particle Swarm Optimization and Absolute Euclidean Classifier . . . . 303Milan S. Shet, Minal Patel, Aakarsh Rao, Chethana Kantharaj, Suma K.V.
Design of Low Power High Speed 4-Bit TIQ Based CMOS Flash ADC . . . . . 319Parvaiz Ahmad Bhat, Roohie Naaz Mir
A Reduced Complexity LDPC Decoding Algorithm Using Dynamic BitNode Selection . . . . . . . . . . . . . . . . . . . . . . . . . . . . . . . . . . . . . . . . . . . . . . . . . . . . 329Suvarna Hudgi, Siddram R. Patil
Memory Optimized Design of Reciprocal Unit . . . . . . . . . . . . . . . . . . . . . . . . . 339Mahmad M. Nadaf, R.M. Banakar, Saroja V. Siddamal
Enhanced LZW Algorithm with Less Compression Ratio . . . . . . . . . . . . . . . . 347Amit Setia, Priyanka Ahlawat
Design of High Security and Performance System for Storage DevicesUsing AES . . . . . . . . . . . . . . . . . . . . . . . . . . . . . . . . . . . . . . . . . . . . . . . . . . . . . . . 353Vinodkumar I. Bellikatti, Chetan S., Shivaputra, Kushal K.S.
Implementation of Lifting Scheme Based DWT Architecture on FPGA . . . . . 361Naagesh S. Bhat
Mobile Based E-Mail Reading System . . . . . . . . . . . . . . . . . . . . . . . . . . . . . . . . 371Azath M., Channamallikarjuna Mattihalli, Member IEEE
Design of ANFIS Controller Based on Fusion Function for LinearInverted Pendulum . . . . . . . . . . . . . . . . . . . . . . . . . . . . . . . . . . . . . . . . . . . . . . . . 379Abhishek Kumar, R. Mitra
Proposing Modified NSGA-II to Solve a Job Sequencing Problem . . . . . . . . . 387Susmita Bandyopadhyay, Arnab Das
Verification Platform for FPGA Based Architecture . . . . . . . . . . . . . . . . . . . . . 393Adesh Panwar
Implementation and Analysis of Downlink Scheduling for IEEE 802.16Using Controlled Priority Queuing . . . . . . . . . . . . . . . . . . . . . . . . . . . . . . . . . . . 399Z.M. Patel, U.D. Dalal
Mechanism for Secure Content Publishing for Reporting PlatformHosted on Public Could Infrastructure . . . . . . . . . . . . . . . . . . . . . . . . . . . . . . . 407Bhanu Prakash Gopularam, Nalini N.
A Semi-Interquartile Min-Min Max-Min (SIM2) Approach for Grid TaskScheduling . . . . . . . . . . . . . . . . . . . . . . . . . . . . . . . . . . . . . . . . . . . . . . . . . . . . . . . 415Sanjaya Kumar Panda, Sourav Kumar Bhoi, Pabitra Mohan Khilar

Contents XIX
Simulation Based Performance Comparison of Reactive RoutingProtocols in Mobile Ad-Hoc Network Using NS-2 . . . . . . . . . . . . . . . . . . . . . . . 423G. Jose Moses, D. Sunil Kumar, P. Suresh Varma, N. Supriya
Fault Tolerance for Large Scale Storage Systems . . . . . . . . . . . . . . . . . . . . . . . 429Pradeep K.R., George Philip C.
Real Time Electro-Oculogram Driven Rehabilitation Aid . . . . . . . . . . . . . . . . 435Anwesha Banerjee, Pratyusha Das, Shounak Datta, Amit Konar,R. Janarthanan, D.N. Tibarewala
A Quantitative Approach Using Goal-Oriented RequirementsEngineering Methodology and Analytic Hierarchy Process in Selectingthe Best Alternative . . . . . . . . . . . . . . . . . . . . . . . . . . . . . . . . . . . . . . . . . . . . . . . . 441Vinay S., Shridhar Aithal, Sudhakara G.
Multilanguage Based SMS Encryption Techniques . . . . . . . . . . . . . . . . . . . . . . 455M. Rajendiran, B. Syed Ibrahim, R. Pratheesh, C. Nelson Kennnedy Babu
High Speed Low Power VLSI Architecture for SPST Adder UsingModified Carry Look Ahead Adder . . . . . . . . . . . . . . . . . . . . . . . . . . . . . . . . . . 461Narayan V.S., Pratima S.M., Saroja V.S., R.M. Banakar
ASIC Primitive Cells in Modified Gated Diffusion Input Technique . . . . . . . 467R. Uma, P. Dhavachelvan
Latent Dirichlet Allocation Model for Recognizing Emotion from Music . . . 475S. Arulheethayadharthani, Rajeswari Sridhar
Investigations on the Routing Protocols for Wireless Body AreaNetworks . . . . . . . . . . . . . . . . . . . . . . . . . . . . . . . . . . . . . . . . . . . . . . . . . . . . . . . . 483Jayanthi K. Murthy, Thimmappa P., V. Sambasiva Rao
Effect of Idle Mode on Power Saving in Mobile WiMAX Network . . . . . . . . . 491Thontadharya H.J., Shwetha D., Subramanya Bhat M., Devaraju J.T.
High Speed Programmable Digital Telemetry Filter for Flight Test . . . . . . . . 501Navitha M.V., M.Z. Kurian, G. Koteswara Rao, Umashankar B.
Hierarchical Storage Technique for Maintaining Hop-Count to PreventDDoS Attack in Cloud Computing . . . . . . . . . . . . . . . . . . . . . . . . . . . . . . . . . . . 511Vikas Chouhan, Sateesh Kumar Peddoju
VHDL Synthesis and Simulation of an Efficient Genetic Algorithm Basedon FPGA . . . . . . . . . . . . . . . . . . . . . . . . . . . . . . . . . . . . . . . . . . . . . . . . . . . . . . . . 519N. Rajeswaran, T. Madhu, M. Suryakalavathi
Forensic Sketch Matching Using SURF . . . . . . . . . . . . . . . . . . . . . . . . . . . . . . . 527Dileep Kumar Kotha, Santanu Rath
XX Contents
Comparison of Configurations of Data Path Architecture DevelopedUsing Template . . . . . . . . . . . . . . . . . . . . . . . . . . . . . . . . . . . . . . . . . . . . . . . . . . . 539B. Bala Tripura Sundari, Varsha Krishnan
LDPC and SHA Based Iris Recognition for Smart Card Security . . . . . . . . . 549K. Seetharaman, R. Ragupathy
A Broker Based Architecture for Adaptive Load Balancing and ElasticResource Provisioning and Deprovisioning in Multi-tenant Based CloudEnvironments . . . . . . . . . . . . . . . . . . . . . . . . . . . . . . . . . . . . . . . . . . . . . . . . . . . . . 561Thamarai Selvi Somasundaram, Kannan Govindarajan, M.R. Rajagopalan,S. Madhusudhana Rao
Variation in Active Site Amino Residues of H1N1 Swine FluNeuraminidase . . . . . . . . . . . . . . . . . . . . . . . . . . . . . . . . . . . . . . . . . . . . . . . . . . . . 575G. Nageswara Rao, P. Srinivasarao, A. Apparao, T.K. Rama Krishna Rao
A Semantic Search Engine to Discover and Select Sensor Web Servicesfor Wireless Sensor Network . . . . . . . . . . . . . . . . . . . . . . . . . . . . . . . . . . . . . . . . 585Chinmohan Nayak, Manoranjan Parhi
Prevention of Man in the Middle Attack by Using Honeypot . . . . . . . . . . . . . . 593Mayank Tiwari, Tushar Sharma, Pankaj Sharma, Shaivya Jindal, Priyanshu
Slicing of Programs Dynamically under Distributed Environment . . . . . . . . . 601Santosh Pani, Shashank Mouli Satapathy, G.B. Mund
An Efficient Incentive Compatible Mechanism for Paid Crowdsourcing . . . . 611Shalini Gupta, Sajal Mukhopadhyay, D. Gosh
Doubling Runtime Estimations to Improve Performance of BackfillAlgorithms in Cloud Metaschedular Considering Job Dependencies . . . . . . . 621Ankur Jindal, P. Sateesh Kumar
Self-managing the Performance of Distributed Computing Systems –An Expert Control Solution . . . . . . . . . . . . . . . . . . . . . . . . . . . . . . . . . . . . . . . . . 629Ravi Kumar G., C. Muthusamy, A. Vinaya Babu, Raj N. Marndi
An Embedded Navigation System for Aiding People with Alzheimer’sDisease . . . . . . . . . . . . . . . . . . . . . . . . . . . . . . . . . . . . . . . . . . . . . . . . . . . . . . . . . . 639Siddalingesh Navalgund, Jayashree Taralabenchi, Kavana Hegde,Soumya Hegde
Software Licensing Models and Benefits in Cloud Environment:A Survey . . . . . . . . . . . . . . . . . . . . . . . . . . . . . . . . . . . . . . . . . . . . . . . . . . . . . . . . . 645Mohan Murthy M.K., Mohd Noorul Ameen, Sanjay H.A.,Patel Mohammed Yasser

Contents XXI
VLSI Architecture of Spread Sprectrum Image Watermarking Decoder . . . . 651Navonil Chatterjee, Moudud Sohid, Sudipta Chakraborty
Strategy Driven Approach for the AD HOC Network Participants Usingthe Notion of Trust and Activity . . . . . . . . . . . . . . . . . . . . . . . . . . . . . . . . . . . . . 659Shabana Sultana, C. Vidya Raj
Multicriteria Decision Analysis for Intrusion Detection Data . . . . . . . . . . . . . 667Sanjiban Sekhar Roy, Omsai Jadhav, Saptarshi Chakraborty, Swapnil Saurav,Madhu Viswanatham
Realization of the Cryptographic Processes in Privacy Preserving . . . . . . . . . 673Sumana M., Hareesh K.S.
A Privacy Preserved Integrated Framework for Location Based Trackingfor Wireless Sensor Networks . . . . . . . . . . . . . . . . . . . . . . . . . . . . . . . . . . . . . . . 679Vinoth Kumar S., Suresh R.M., Govardhan A.
Cluster Allocation Strategies of the ExFAT and FAT File Systems:A Comparative Study in Embedded Storage Systems . . . . . . . . . . . . . . . . . . . . 691Keshava Munegowda, G.T. Raju, Veera Manikandan Raju
Audio Steganography Used for Secure Data Transmission . . . . . . . . . . . . . . . . 699Pooja P. Balgurgi, Sonal K. Jagtap
An XML Parser of Efficient Updates for a Binary String: A Case Study . . . . 707J. Bhagyashala, S. Shefali
SVM-DSD: SVM Based Diagnostic System for the Detection ofPomegranate Leaf Diseases . . . . . . . . . . . . . . . . . . . . . . . . . . . . . . . . . . . . . . . . . 715Sanjeev S. Sannakki, Vijay S. Rajpurohit, V.B. Nargund
Encrypted Traffic and IPsec Challenges for Intrusion Detection System . . . . 721Manish Kumar, M. Hanumanthappa, T.V. Suresh Kumar
Intelligent Systems
An Effective User Interface Tool for Retrieval of Heart Sound andMurmurs . . . . . . . . . . . . . . . . . . . . . . . . . . . . . . . . . . . . . . . . . . . . . . . . . . . . . . . . 729Kiran Kumari Patil, B.S. Nagabhushana, Vijaya Kumar B.P.
DCell-IP: DCell Emboldened with IP Address Hierarchy for EfficientRouting . . . . . . . . . . . . . . . . . . . . . . . . . . . . . . . . . . . . . . . . . . . . . . . . . . . . . . . . . . 739A.R. Ashok Kumar, S.V. Rao, Diganta Goswami, Ganesh Sahukari
An Approach to Securing Data in Hosted CRM Applications . . . . . . . . . . . . . 747Siddharth M. Pandya, Abhishek Srikumar, Chandrika T.

XXII Contents
Alzheimer’s Disease Detection Using Minimal Morphometric Featureswith an Extreme Learning Machine Classifier . . . . . . . . . . . . . . . . . . . . . . . . . . 753M. Aswatha Kumar, B.S. Mahanand
Bidding Strategy in Simultaneous English Auctions Using Game Theory . . . 763Nirupama Pavanje
Web Personalization Based on Short Term Navigational Behaviour andMeta Keywords . . . . . . . . . . . . . . . . . . . . . . . . . . . . . . . . . . . . . . . . . . . . . . . . . . . 773Siddu P. Algur, Nitin P. Jadhav, N.H. Ayachit
A Parallel Fuzzy C Means Algorithm for Brain Tumor Segmentation onMultiple MRI Images . . . . . . . . . . . . . . . . . . . . . . . . . . . . . . . . . . . . . . . . . . . . . . 787Aarthi Ravi, Ananya Suvarna, Andrea D’Souza, G. Ram Mohana Reddy,Megha
Implementation of Web Search Result Clustering System . . . . . . . . . . . . . . . . 795Hanumanthappa M., B.R. Prakash
Data Mining in Online Social Games . . . . . . . . . . . . . . . . . . . . . . . . . . . . . . . . . 801Nazneen Ansari, Maahi Talreja, Vaishali Desai
Data Mapping in Intelligent Form Using Random Hierarchical BitFormat Enhancing the Security in Data Retrieval . . . . . . . . . . . . . . . . . . . . . . 807Rahul Gupta, Nidhi Garg, Preetham Kumar
Effective Unit Testing Framework for Automation of WindowsApplications . . . . . . . . . . . . . . . . . . . . . . . . . . . . . . . . . . . . . . . . . . . . . . . . . . . . . . 813A.N. Seshu Kumar, S. Vasavi
A New Optimization Method Based on Adaptive Social Behavior: ASBO . . . 823Manoj Kumar Singh
Design and Implementation of Interval Type-2 Single Input Fuzzy LogicController for Magnetic Levitation System . . . . . . . . . . . . . . . . . . . . . . . . . . . . 833Anupam Kumar, Manoj Kumar Panda, Vijay Kumar
Mining Negative Association Rules from Multiple Data Sourceson the Basis of Local Pattern Analysis . . . . . . . . . . . . . . . . . . . . . . . . . . . . . . . . 841T. Ramkumar, S. Selvamuthukumaran, S. Hariharan, V. Harikrishnan
Recognition of Hand Punched Kannada Braille Characters UsingKnowledge Based Multi Decision Concept: Basic Symbols . . . . . . . . . . . . . . . 847Srinath S., C.N. Ravi Kumar
Vascular Tree Segmentation in Fundus Images Using CurveletTransform . . . . . . . . . . . . . . . . . . . . . . . . . . . . . . . . . . . . . . . . . . . . . . . . . . . . . . . 859Rupu Kumari, Charul Bhatnagar, Anand Singh Jalal

Contents XXIII
A Density-Based Clustering Paradigm to Detect Faults in Wireless SensorNetwork . . . . . . . . . . . . . . . . . . . . . . . . . . . . . . . . . . . . . . . . . . . . . . . . . . . . . . . . . 865Sourav Kumar Bhoi, Sanjaya Kumar Panda, Pabitra Mohan Khilar
Ant Colony Optimization for Data Cache Technique in MANET . . . . . . . . . . 873R. Baskaran, P. Victer Paul, P. Dhavachelvan
Automatic Extraction of Kannada Complex Predicates from Corpora . . . . . 879S. Parameswarappa, V.N. Narayana
Texture Image Retrieval Using Greedy Method . . . . . . . . . . . . . . . . . . . . . . . . 885Pushpa B. Patil, Manesh B. Kokare
Multi-lingual Speaker Identification with the Constraint of Limited Data . . . 893B.G. Nagaraja, H.S. Jayanna
Improving Performance of K-Means Clustering by Initializing ClusterCenters Using Genetic Algorithm and Entropy Based Fuzzy Clusteringfor Categorization of Diabetic Patients . . . . . . . . . . . . . . . . . . . . . . . . . . . . . . . . 899Asha Gowda Karegowda, Vidya T., Shama, M.A. Jayaram, A.S. Manjunath
Hindi and English Off-line Signature Identification and Verification . . . . . . . 905Srikanta Pal, Umapada Pal, Michael Blumenstein
A Robust Method of Image Based Coin Recognition . . . . . . . . . . . . . . . . . . . . 911B.V. Chetan, P.A. Vijaya
N-Gram Based Approach to Automatic Tamil Lyric Generationby Identifying Emotion . . . . . . . . . . . . . . . . . . . . . . . . . . . . . . . . . . . . . . . . . . . . . 919Rajeswari Sridhar, Jalin Gladis D., Ganga K., Dhivya Prabha G.
Texture Analysis and Defect Classification for Fabric Images UsingRegular Bands and Quadratic Programming . . . . . . . . . . . . . . . . . . . . . . . . . . 927R. Obula Konda Reddy, B. Eswara Reddy, E. Keshava Reddy
Exploring the Pattern of Customer Purchase with Web Usage Mining . . . . . 935Paresh Tanna, Yogesh Ghodasara
Information Fusion from Mammogram and Ultrasound Imagesfor Better Classification of Breast Mass . . . . . . . . . . . . . . . . . . . . . . . . . . . . . . . 943Minavathi, Murali S., M.S. Dinesh
Design of Fuzzy PD Controller for Inverted Pendulum in Real Time . . . . . . . 955Nidhi Patel, M.J. Nigam
Classification of Kannada Numerals Using Multi-layer Neural Network . . . . 963Ravindra S. Hegadi

XXIV Contents
Content Based Image Retrieval by Combining Median Filtering, BEMDand Color Technique . . . . . . . . . . . . . . . . . . . . . . . . . . . . . . . . . . . . . . . . . . . . . . . 969Purohit Shrinivasacharya, M.V. Sudhamani
Fuzzy Geometric Face Model for Face Detection Based on Skin ColorFusion Model . . . . . . . . . . . . . . . . . . . . . . . . . . . . . . . . . . . . . . . . . . . . . . . . . . . . . 977P.S. Hiremath, Manjunath Hiremath
A Novel Approach for Prefetching of Web Pages through Clusteringof Web Users to Reduce the Web Latency . . . . . . . . . . . . . . . . . . . . . . . . . . . . . 983G.T. Raju, M.V. Sudhamani
A Neuro-Fuzzy Based Intelligent Agent for Text Based EmotionRecognition . . . . . . . . . . . . . . . . . . . . . . . . . . . . . . . . . . . . . . . . . . . . . . . . . . . . . . 991G. Sharada, O.B.V. Ramanaiah
Feature Selection for Decoding of Cognitive States in Multiple-SubjectFunctional Magnetic Resonance Imaging Data . . . . . . . . . . . . . . . . . . . . . . . . . 997Accamma I.V., H.N. Suma
A New Approach to Partial Image Encryption . . . . . . . . . . . . . . . . . . . . . . . . . 1005Parameshachari B.D., K.M.S. Soyjaudah
Fuzzy Number with Nonlinear Membership Functions to ProvideFlexibility in a Multi Objective Travelling Salesman Problem . . . . . . . . . . . . . 1011Atul Kumar Tiwari, Cherian Samuel, Vinay Pratap Singh, Vivek Saraswati
A Novel Approach for Image Retrieval Based on ROI and MultifeaturesUsing Genetic Algorithm . . . . . . . . . . . . . . . . . . . . . . . . . . . . . . . . . . . . . . . . . . . 1021K.S.Md. Musa Mohinuddin, P. Subbaiah, S. Tipu Rahaman
Ship Detection from SAR and SO Images . . . . . . . . . . . . . . . . . . . . . . . . . . . . . 1027Y. Sreedevi, B. Eswar Reddy
Automatic Speaker Recognition System . . . . . . . . . . . . . . . . . . . . . . . . . . . . . . . 1037P.M. Ghate, Shraddha Chadha, Aparna Sundar, Ankita Kambale
An Approach for Document Image Based Printed CharacterRecognition . . . . . . . . . . . . . . . . . . . . . . . . . . . . . . . . . . . . . . . . . . . . . . . . . . . . . . 1045Sushila Aghav, Shilpa Paygude
Flexibility in Supplier Selection Using Fuzzy Numbers with NonlinearMembership Functions . . . . . . . . . . . . . . . . . . . . . . . . . . . . . . . . . . . . . . . . . . . . . 1051Atul Kumar Tiwari, Cherian Samuel, Anunay Tiwari
Fuzzy Based Interference Reduction in Cognitive Networks . . . . . . . . . . . . . . 1061Lavanya G., Pandeeswari S., Shanmugapriya R.K., Umamaheswari A.
Managing Traffic Flow Based on Predictive Data Analysis . . . . . . . . . . . . . . . 1069Dhara J. Patel, Snoeji Varghese John, Fibinse Kaliangra

Contents XXV
Digital Filter Approach for ECG in Signal Processing . . . . . . . . . . . . . . . . . . . 1075Sonal K. Jagtap, M.D. Uplane
A Pattern Recognition Approach of Japanese Text Recognitionfor Template Matching . . . . . . . . . . . . . . . . . . . . . . . . . . . . . . . . . . . . . . . . . . . . . 1083Soumendu Das, Sreeparna Banerjee
Extraction of Bacterial Clusters from Digital Microscopic Imagesthrough Statistical and Neural Network Approaches . . . . . . . . . . . . . . . . . . . . 1091Chayadevi M.L., Raju G.T.
Analysis of Brain Activity for Motor Task Using SimultaneousEEG - fMRI . . . . . . . . . . . . . . . . . . . . . . . . . . . . . . . . . . . . . . . . . . . . . . . . . . . . . . 1101Sandhya M., Rose Dawn, Rajanikant Panda
K-Means Clustering Microaggregation for Statistical Disclosure Control . . . 1109Md. Enamul Kabir, Abdun Naser Mahmood, Abdul K. Mustafa
Content Based Image Retrieval Using Sketches . . . . . . . . . . . . . . . . . . . . . . . . . 1117M. Narayana, Subhash Kulkarni
Component Based Software Development Using Component OrientedProgramming . . . . . . . . . . . . . . . . . . . . . . . . . . . . . . . . . . . . . . . . . . . . . . . . . . . . . 1125Ruchi Shukla, T. Marwala
Transformation of Artistic Form Text to Linear Form Text for OCRSystems . . . . . . . . . . . . . . . . . . . . . . . . . . . . . . . . . . . . . . . . . . . . . . . . . . . . . . . . . . 1135Vishwanath C. Kagawade, Vijayashree C.S., Vasudev T.
A Fuzzy Sectional Real-Time Scheduling Algorithm Based on SystemLoad . . . . . . . . . . . . . . . . . . . . . . . . . . . . . . . . . . . . . . . . . . . . . . . . . . . . . . . . . . . . 1145Annappa B.
An Intelligent and Robust Single Input Interval Type-2 Fuzzy LogicController for Ball and Beam System . . . . . . . . . . . . . . . . . . . . . . . . . . . . . . . . . 1155Sumanta Kundu, M.J. Nigam
Adaptive Neuro Fuzzy Inference Structure Controller for RotaryInverted Pendulum . . . . . . . . . . . . . . . . . . . . . . . . . . . . . . . . . . . . . . . . . . . . . . . . 1163Rahul Agrawal, R. Mitra
Author Index . . . . . . . . . . . . . . . . . . . . . . . . . . . . . . . . . . . . . . . . . . . . . . . . . . . . . . . . 1171
Erratum
A Fuzzy Sectional Real-Time Scheduling Algorithm Based on SystemLoad . . . . . . . . . . . . . . . . . . . . . . . . . . . . . . . . . . . . . . . . . . . . . . . . . . . . . . . . . . . . E1Annappa B.
Aswatha Kumar M. et al. (Eds.): Proceedings of ICAdC, AISC 174, pp. 1–7. springerlink.com © Springer India 2013
Multilevel Feedback Queue Scheduling Technique for Grid Computing Environments
Dharamendra Chouhan1, S.M. Dilip Kumar1, and B.P. Vijaya Kumar2
1 Dept. of Computer Science and Engineering, University Visvesvaraya College of Engineering,
Bangalore, India 2 Dept. of Computer Science and Engineering,
M.S. Ramaiah Institute of Technology, Bangalore, India
Abstract. Effective and efficient job scheduling is an important aspect of Grid computing. Task scheduling becomes more complicated in a Grid environment, due to geographically distribution, heterogeneity and dynamic nature of grid re-sources. In this paper, a new computational scheduling policy called Multilevel Feedback Queue (MLFQ) scheduling, which is designed to support the alloca-tion of resources for gridlets (jobs) is proposed. Gridlets provided by the users are assigned to processing elements (PEs), and gridlets whose remaining service time is shifted between queues of the MLFQ scheduler to get completed. In MLFQ, the total architecture is divided into multiple prioritized queues. This approach provides gridlets which starve in the lower priority queue for long time to get resources. As a result, the response time of the starved gridlets decreases and overall turnaround time of the scheduling process decreases. This scheduling policy is simulated using Alea GridSim toolkit to test the performance.
Keywords: Grid computing, Job Scheduling, Multilevel feedback queue, GridSim.
1 Introduction
Grid computing is a distributed computing which has emerged for solving a large scale intensive data through sharing of resources over the network [1]. In grid compu-ting systems, there are often large amounts of resources available to be used for com-puting jobs. Scheduling in a grid computing system is not as simple as scheduling on a multi-processor machine because of several factors. These factors include the fact that grid resources are sometimes used by paying customers who have interest in how their jobs are being scheduled [2]. However, grid computing systems usually operate in remote locations so scheduling tasks for the clusters may be occurring over a net-work [3]. Job scheduling algorithms are commonly applied to grid resources to opti-mally post jobs to grid resources [4, 5]. Usually, grid users submit their jobs to the grid manager to utilize and fulfill the facilities provided by grid. The grid manager distributes the submitted jobs among the grid resources to minimize the total response time.
2 D. Chouhan, S.M. Dilip Kumar, and B.P. Vijaya Kumar
In a Grid environment, there is moderately large number of job scheduling algo-rithms proposed to minimize the total completion time of the jobs [6, 7]. These algo-rithms works on minimizing the overall completion time of the jobs by analyzing the suitable resources to be assigned to the jobs. In contrast with minimizing the overall completion time of the jobs does not necessarily result in the minimization of execu-tion time of each individual task. In this paper, we propose a new scheduling policy for grid computing which uses multilevel feedback queue technique concept to avoid the starvation of low priority jobs for a longer duration to get resources to complete their requested services. In this technique, jobs are scheduled according to their re-maining service time and they are shifted down from queue to queue as they have some remaining service time. Every queue has unique time quanta that gradually in-crease from top level to bottom level queues so that longer jobs gradually moves from top to bottom level queues for getting completed. All low priority jobs will process on intermediate queues and gets completed with minimal duration, so that all jobs will get an equal opportunity to utilize grid resources efficiently. The rest of the paper is organized as follows. Section 2 presents the related works. In Section 3 the system model for scheduling in Grid computing environment is presented. In section 4, the MLFQ scheduling technique is proposed. The simulation of the MLFQ scheduling al-gorithm using Alea GridSim is presented in section 5. Finally, section 6 concludes the paper.
2 Related Work
There has been significant research continuing to attempt to devise scheduling algo-rithms for grid environments’ problem of efficient job assignment. Some of the jobs scheduling algorithms in a grid environment are given below.
X. He et al. [9] have proposed an algorithm based on the conventional min-min al-gorithm known as QoS guided min-min which schedules the jobs requiring high bandwidth before others. F. Dong et al. [12] have proposed an algorithm called QoS priority grouping scheduling. This algorithm, considers completion time and accepta-tion rate of the jobs and the makespan of the entire system as key factors for job sche-duling. E. Ullah Munir et al. [13] have proposed a new job scheduling algorithm which makes use of grid computing environments known as QoS Sufferage. K. Etmi-nani et al. [14] have proposed an algorithm which provides a solution on basis of max-min and min-min algorithms. The algorithm discovers the situations where to adopt one of these two algorithms, based on the standard deviation of the estimated completion times of the jobs on every computing resources. L. Mohammad Khanli et al. [10, 11] have proposed a QoS based scheduling algorithm for an architecture called Grid-JQA. In this method the solution involves applying an aggregation formu-la which includes a combination of different parameters together with weighting fac-tors to perform operations on QoS.
Multilevel Feedback Queue Scheduling Technique for Grid Computing Environments 3
3 System Model
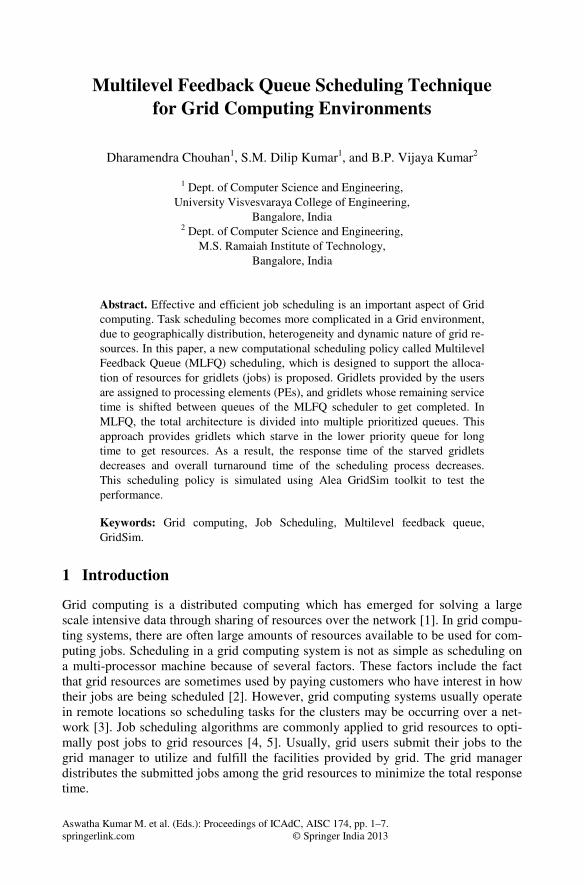
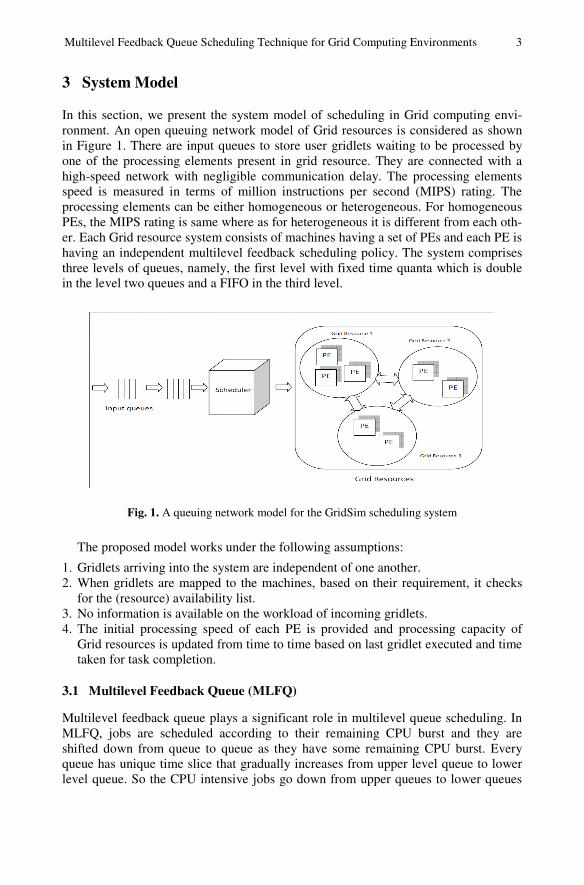
In this section, we present the system model of scheduling in Grid computing envi-ronment. An open queuing network model of Grid resources is considered as shown in Figure 1. There are input queues to store user gridlets waiting to be processed by one of the processing elements present in grid resource. They are connected with a high-speed network with negligible communication delay. The processing elements speed is measured in terms of million instructions per second (MIPS) rating. The processing elements can be either homogeneous or heterogeneous. For homogeneous PEs, the MIPS rating is same where as for heterogeneous it is different from each oth-er. Each Grid resource system consists of machines having a set of PEs and each PE is having an independent multilevel feedback scheduling policy. The system comprises three levels of queues, namely, the first level with fixed time quanta which is double in the level two queues and a FIFO in the third level.
Fig. 1. A queuing network model for the GridSim scheduling system
The proposed model works under the following assumptions:
1. Gridlets arriving into the system are independent of one another. 2. When gridlets are mapped to the machines, based on their requirement, it checks
for the (resource) availability list. 3. No information is available on the workload of incoming gridlets. 4. The initial processing speed of each PE is provided and processing capacity of
Grid resources is updated from time to time based on last gridlet executed and time taken for task completion.
3.1 Multilevel Feedback Queue (MLFQ)
Multilevel feedback queue plays a significant role in multilevel queue scheduling. In MLFQ, jobs are scheduled according to their remaining CPU burst and they are shifted down from queue to queue as they have some remaining CPU burst. Every queue has unique time slice that gradually increases from upper level queue to lower level queue. So the CPU intensive jobs go down from upper queues to lower queues

4 D. Chouhan, S.M. Dilip Kumar, and B.P. Vijaya Kumar
gradually for getting completed. Thus, lower priority queues are filled with CPU in-tensive jobs and as a result these processes start to starve for getting CPU attention. The MLFQ scheduling organizes the queues to minimize the queuing delay and op-timize the queuing environment efficiency [8].
3.2 State Diagram
The system is modeled in a state transition diagram as shown in Figure 2. As gridlets arrives to the input queue, each gridlet is selected and it acquires the requested re-sources from grid resource list. Once it acquires the requested resources, it finds the suitability of the resources and checks for the required PEs, MIPS, bandwidth and sto-rage. If the suitability is fulfilled, the scheduler assigns gridlets to the resources se-lected from the resource list. Gridlets are scheduled according to their remaining ser-vice time and they are shifted down from queue to queue as they have some remaining service time. Every queue has unique time slice that gradually increases from upper level queue to lower level queue. So the PEs intensive gridlets go down from upper queues to lower level queues gradually for getting executed. If the gridlet fails to execute at this stage then it is placed back into input queue during the course of execution for later resumption.
Fig. 2. State Diagram
4 Proposed Solution
In this section, we briefly explain the proposed solution for scheduling the jobs using MLFQ technique in Grid environment. The user submits gridlets along with the re-quirements to the Alea GridSim scheduling system. The submission of gridlets to the resources involves checking the suitability of the available PEs. If the requirement is satisfied, the gridlets are assigned to the respective resources. This technique uses a dynamic priority mechanism to schedule the gridlets to the system efficiently and maximize the resource utilization. The MLFQ scheduling model is depicted in the Figure 3. The gridlet waiting for the service is placed in the waiting queue. The grid-lets that are scheduled in the queue Q1 are executed. If the gridlets in Q1 submitted for execution do not complete in the given time quanta of Q1 then those gridlets are pushed onto the next level queue Q2. Then the gridlets pushed on to Q2 are executed

Multilevel Feedback Queue Scheduling Technique for Grid Computing Environments 5
along with the gridlets present in queue Q1. Similarly, if the gridlets in Q2 submitted for execution do not complete in the fixed time quanta of Q2 then those gridlets are pushed onto the next level queue Q3. However, the gridlets present in Q3 are executed based on FCFS scheduling policy. The shorter gridlets completes its execution quick-ly, without migrating to lower level queues. All gridlets gets an opportunity to execute and thus reduces starvation of gridlets.
Fig. 3. Multilevel Feedback Queue (MLFQ) Scheduling model
5 Simulation
In this section we show the performance of MLFQ scheduling technique trough sev-eral experiments using Alea simulator, an extension of GridSim simulation toolkit. The experiment involved 5000 jobs that were executed on 14 clusters having 806 CPUs. We run the simulation by providing input data set and it completes all the jobs submitted to the grid over a span of time. MLFQ is able to increase the machine usage by using MLFQ approach and average machine usage per day as depicted in Figure 4. The number of waiting and running jobs on an average against each day is depicted in Figure 5. MLFQ is capable of a higher resource utilization and reduction of the
Fig. 4. Percentage of average machine usage per day
Fig. 5. Average job execution per day

6 D. Chouhan, S.M. Dilip Kumar, and B.P. Vijaya Kumar
Fig. 6. CPU usage per day Fig. 7. Percentage of cluster usage
number of waiting jobs through the time and the number of waiting and running jobs per day. The requested and available CPU usage per day is shown in Figure 6. Figure 7 presents the average machine usage per cluster. Simulation results show that there is a minimization of overall response time and waiting time of gridlets.
6 Conclusion
The paper describes a new approach to schedule tasks efficiently in a grid environ-ment. We proposed a Multilevel Feedback Queue Scheduling (MLFQ) for Alea, a GridSim based simulator. The approach is based on processing capability of individu-al grid resources. Our policy provides a solution by implementing MLFQ scheduler where lower priority gridlets will complete quickly, without migrating to the lower levels of the hierarchy. So that we can achieve high times. The transportation cost and overall communication delay is considered for future work.
References
[1] Foster, I., Kesselman, C.: The Grid 2: Blueprint for a New Computing Infrastructure, IInd edn. Elsevier and Morgan Kaufmann Press (2004)
[2] Hoschek, W., Jaen-Martinez, J., Samar, A., Stockinger, H., Stockinger, K.: Data Man-agement in an International Data Grid Project. In: Buyya, R., Baker, M. (eds.) GRID 2000. LNCS, vol. 1971, pp. 77–90. Springer, Heidelberg (2000)
[3] Buyya, R., Steve Chapin, S., DiNucci, D.: Architectural Models for Resource Manage-ment in the Grid. In: IEEE/ACM International Workshop on Grid Computing (2000)
[4] Mohammad Khanli, L., Analoui, M.: Resource Scheduling in Desktop Grid by Grid-JQA. In: The IEEE 3rd International Conference on Grid and Pervasive Computing (2008)
[5] Mohammad Khanli, L., Analoui, M.: Grid_JQA: A QoS Guided Scheduling Algorithm for Grid Computing. In: The 6th IEEE International Symp. on Parallel and Distributed Computing (2007)
[6] Dong, F., et al.: A Grid Task Scheduling Algorithm Based on QoS Priority Grouping. In: Proc. of the 5th IEEE International Conf. on Grid and Cooperative Computing (2006)
[7] Etminani, K., Naghibzadeh, M.: A Min-min Max-min Selective Algorithm for Grid Task Scheduling. In: The 3rd IEEE/IFIP International Conf. on Internet, Uzbekistan (2007)

Multilevel Feedback Queue Scheduling Technique for Grid Computing Environments 7
[8] Hoganson, K.: In: Reducing MLFQ Scheduling Starvation with Feedback and Exponen-tial Averaging Consortium for Computing Sciences in Colleges, Southeastern Confe-rence, Georgia (2009)
[9] He, X., Sun, X.-H., Laszewski, G.V.: QoS Guided Min-min Heuristic for Grid Task Scheduling. J. Computer Science and Technology 18, 442–451 (2003)
[10] Mohammad Khanli, L., Analoui, M.: Resource Scheduling in Desktop Grid by Grid-JQA. In: The 3rd IEEE International Conf. on Grid and Pervasive Computing (2008)
[11] Mohammad Khanli, L., Analoui, M.: Grid_JQA: A QoS Guided Scheduling Algorithm for Grid Computing. In: The 6th IEEE International Symp. on Parallel and Distributed Computing (2007)
[12] Dong, F., Luo, J., et al.: A Grid Task Scheduling Algorithm Based on QoS Priority Grouping. In: Proc. of 5th IEEE International Conf. on Grid and Cooperative Computing (2006)
[13] Ullah Munir, E., Li, J., Shi, S.: QoS Sufferage Heuristic for Independent Task Schedul-ing. Grid J. Information Technology 6(8), 1166–1170 (2007)
[14] Etminani, K., Naghibzadeh, M.: A Min-min Max-min Selective Algorithm for Grid Task Scheduling. In: 3rd IEEE/IFIP International Conf. on Internet, Uzbekistan (2007)

Aswatha Kumar M. et al. (Eds.): Proceedings of ICAdC, AISC 174, pp. 9–17. springerlink.com © Springer India 2013
Location and Detection of a Text in a Video
T.N.R. Kumar, S.K. Srivatsa, and S. Murali
Vels University St. Joseph's College of Engg.,
Jeppiaar Nagar, Chennai - 600 119
Abstract. Recognizing and identifying the objects present in a video is a challenging task in the area of computer vision. The paper presents a method through image processing activities, to recognize a vehicle passing through a highway. The video of the vehicle is recorded and a frame, which contains the backside or front side of the vehicle, is separated for further processing. This single frame is an image, might have the vehicle object any where in it. A prior knowledge of the structure of the vehicle is used to locate the vehicle in the frame. The number plates of the vehicles normally will have significant features like with the specific background (White or Yellow) and the vehicle numbers are written in a rectangular area with these features is adopted to locate the number plate in the frame. Further segmentation is carried at character level using contour traversal method. A fourteen segment projection method is followed to recognize the characters of the segmented characters. The proposed method is able to segment and recognize the vehicles in the most of the ideal situations.
Keywords: Video to image conversion, Edge detection, Contour traversal, Character segmentation.
1 Introduction
Interest in the potential of digital images has increased enormously over the last few years, fuelled at least in part by the rapid growth of computer imaging. Users in many professional fields are exploiting the opportunities offered to access and manipulate remotely sensed images in all kinds of new and exciting ways[1]. However they are also discovering that the process of locating a desired image in a large and varied ambiance can be a source of considerable frustration[1].
Detecting the position of the text in digital images is of paramount importance in document analysis[1][2]. There are some research attempt made towards recognizing text in videos[3][4]. Image processing algorithms often consider the identification of text characters as trivial problem since those images of text characters. However the scenario is complicates when text is part of image. Image segmentation is required

10 T.N.R. Kumar, S.K. Srivatsa, and S. Murali
before the characters are being recognized. The presence and interpretation of text in these images can provide visual information in addition to possible text in the form of captions, subtitles or image objects. Input scenes are decomposed in to set of binary images where connected components are analyzed for the possible presence of text characters[3]. The process of locating text in a given image is the first step in the problem of text reading. The problem of text detection gets complex with the variations in fonts, sizes and textures. However in this case law enforcement makes the numbers written on the vehicle with normal font makes the recognition much easier.
Input is taken from a stationary camera, which continuously takes the video of the vehicles passing in front if it. To increase the performance of recognition, preprocessing activities like normalization, skew detection and correction and segmentation are performed. Quality of the video produced by the camera is not always consistent; hence it is required to preprocess the video.
The paper is organized as follows: In section 2 details about the preprocessing adopted for this application is presented. Section 3 discusses about contour traversal technique adopted to segment the rectangles present in the image. In section 4 an illustration is given about the details of segmenting the characters in a number plate. Experimental results and conclusions are presented in section 5 & 6 respectively.
2 Preprocessing
Generally all images contain some noise in the image. This noise should be removed before any further processing is done[9]. There are several standard algorithms available, which can be used for noise for removal and smoothening.
2.1 Gaussian Convolution
Gaussian convolution is typically used for image smoothing, in which large changes in intensities between adjacent pixels are diminished by weighted averaging. It uses a symmetric normalized 2-D Gaussian smoothing operator G (x, y) for its convolution kernel:
(1)

Location and Detection of a Text in a Video 11
Fig. 1. Gaussian Convolution
In Gaussian convolution method, substitution of the values of x and y as given in figure 1 and logically placing on the image to produce smoothened image. Normally, the center value of the mask is dominating as shown in table 1. The mask shown in table 1 is derived from equation (1) for =0.4.
Table 1. The Guassian Mask for before normalization (Sum of the weights =1.7722)
Table 2. The Guassian Mask for before normalization (Sum of the weights =1)
Before performing any operation the picture is converted to binary as it reduces complexity and decision is only to know the area of text in the image.

12 T.N.R. Kumar, S.K. Srivatsa, and S. Murali
Edge Detection
Edges of the objects give more details about the boundary and shape of the intermediate component. After scanning picture horizontally, if there is a change in then it is considered that point as edge point. Scanning is performed on same picture vertically and if there is any change in color, then it is considered that point as edge point. Figure 2a shows the image before edge detection and 2.b shows the edges of the image. Robert cross operator [6] is used to detect the edges
First form of Roberts Operator
Second form of Roberts Operator
Where Vf is the gradient operator

Location and Detection of a Text in a Video 13
Fig. 2a. Fig. 2b.
3 Segmentation of Number Plate
Number plates in any vehicle will have significant features, like with specific background and written on a rectangular portion. This knowledge enables the segmentation of number plates using contour traversal method, a rectangle which contains some characters. The method is illustrated below.
3.1 Contour Traversal
Contour traversal is widely used in image processing application. The chain codes are used to characterize a pixel on the contour. Chain code is a local feature, which gives the spatial association between two successive points. An arbitrary point is considered as starting point. Traversing along a contour of the object and reaching the starting point may produce a rectangle. Situation may arise where the contour traversal encounters two branches. In such situations the contour traversal is terminated.
This technique is used to recognize the closed loop present in the image. If there is more than one rectangle present in the image only bottom most rectangle where generally the number plate is present is only considered and the remaining rectangles present in the image is ignored.
Fig. 3.

14 T.N.R. Kumar, S.K. Srivatsa, and S. Murali
4 Character Segmentation and Recognition
The segmented number plate has two distinct intensities, the foreground that is generally black and the background that is generally white/yellow. Segmentation is initiated by scanning the image horizontally and vertically. When a black pixel is encountered, scanning is continued until a white pixel encountered and all the co-ordinates of the black pixel as well as the white pixel as stored in an array and check for continuity. If there is continuity in black pixel then it is a character and if there is continuity in white pixel then it is considered as gap between two characters and these characters are segmented separately.
Fig. 4.
Fig. 5.
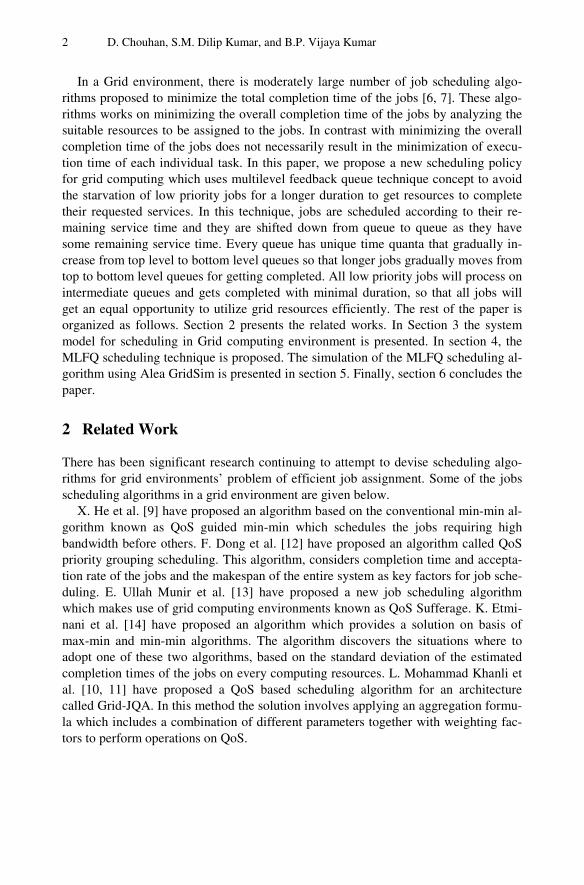
5 Character Using Projection Method
Segmented characters are taken as input to this stage of recognition[10]. A logical box with horizontal line in the middle enclosing the number is imagined. Logically divide the number in to vertically two halves. Horizontally project all left half bright pixels of the numbers on to the segments ‘f’ and ‘e’ and project all right half bright pixels of the number on to the segment ‘b’ and ‘c’.

Location and Detection of a Text in a Video 15
Fig. 6. Segmentation of the logical box in to 14 lines
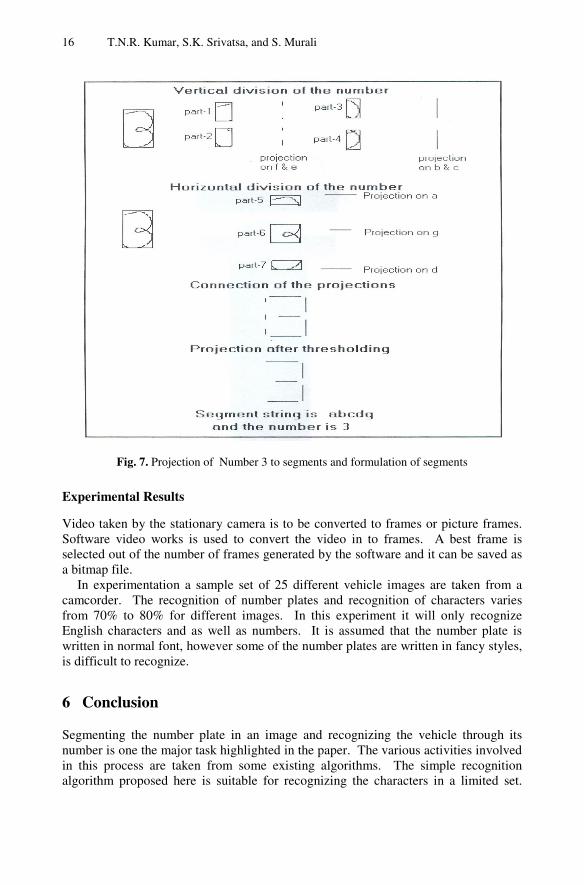
Similarly divide the numbers in to three parts horizontally. Vertically project all the pixels in the first part on to segment ‘a’, project all the pixels in the second part on to the segment ‘g’ and project all the pixels in the third part on to segment ‘d’. Determine the dynamic thresholds of each segment. These thresholds are used to find whether sufficiently large number of pixels is projected on to the corresponding segments. Considering the string segments that cross the thresholds identify the number. Figure 7 shows how the number ‘3’ is divided horizontally and vertically.
16 T.N.R. Kumar, S.K. Srivatsa, and S. Murali
Fig. 7. Projection of Number 3 to segments and formulation of segments
Experimental Results
Video taken by the stationary camera is to be converted to frames or picture frames. Software video works is used to convert the video in to frames. A best frame is selected out of the number of frames generated by the software and it can be saved as a bitmap file.
In experimentation a sample set of 25 different vehicle images are taken from a camcorder. The recognition of number plates and recognition of characters varies from 70% to 80% for different images. In this experiment it will only recognize English characters and as well as numbers. It is assumed that the number plate is written in normal font, however some of the number plates are written in fancy styles, is difficult to recognize.
6 Conclusion
Segmenting the number plate in an image and recognizing the vehicle through its number is one the major task highlighted in the paper. The various activities involved in this process are taken from some existing algorithms. The simple recognition algorithm proposed here is suitable for recognizing the characters in a limited set.

Location and Detection of a Text in a Video 17
The performance of the algorithm as a whole has shown satisfactory results, which could be used to record the vehicle numbers in database. However it is a real time activity, further enhancement specially in video processing and handling partially visible number plates are required to make it complete.
References
1. Zhong, Y., Karu, K., Jain, A.K.: Locating Text in Complex Color Images. Journal of Pattern Recognition 1.28(10), 1523 (1995)
2. Qi, W., Gu, L., Jiang, H., Chen, X.– R., Zhang, H.-J.: Integrating Visual, Audio and Text analysis for News video. Microsoft Research Publications
3. Jain, A.K., Yu, B.: Automatic Text Detection and Tracking in Digital Video. publications (2000)
4. Chanda, B., Datta Majumder, D.: Digital Image processing. Mc Graw Hill publications 5. Gonzales, R.C., Woods, R.E.: Digital Image Processing. Mc Graw Hill Publications 6. Qi, W., Gu, L., Jiang, H., Chen, X.R., Zhang, H.J.: Integrating visual, audio and text
analysis for news video. Microsoft Research Publication 7. Eakins, J., Graham, M.: Content – based Image. University of Northumbria Publication,
Newcastle 8. Vasudev, T., Hemathkumr, G., Guru, D.S., Nagabhushan, P.: Extension of 7-segment
display concept for Numeral Recognition: A simple projection method Approach. In: Proceedings of the National Conference on Document Analysis and Recognition, Mandya, p. 57 (2001)
9. Ledenbaum, M., Sergey, V., Alexander, R., Roman, S.: Moving car license plate recognition. Israel Institute of technology
10. Mike constant The principle and practices of CCTV. the benehmark for CCTV United Kingdom

Aswatha Kumar M. et al. (Eds.): Proceedings of ICAdC, AISC 174, pp. 19–30. springerlink.com © Springer India 2013
Hidden Markov Model with Computational Intelligence for Dynamic Clustering in Wireless Sensor Networks
Veena K.N.1 and Vijaya Kumar B.P.2
1 Dept. of Telecommunication Engg, JNN College of Engg, Shimoga, Karnataka, India
[email protected] 2 Dept. of Computer Science Engg,
MS Ramaiah Institute of Technology, Banglore, Karnataka, India
Abstract. Most important challenge in Wireless Sensor Networks is to improve the operational efficiency in highly resource constrained environment based on dynamic and unpredictable behavior of network parameters and applications re-quirement. In this paper we have proposed a method of clustering and analysis, to study the system behavior with respect to network parameters and applica-tions requirement. The method involves in the adoption of Fuzzy logic and Hidden Markov Model for the analysis of sensor node parameters and Compu-tational intelligence for clustering. The simulations are carried out to evaluate the performance of the proposed method with respect to different parameters of sensor networks and applications requirement.
Keywords: Wireless Sensor Networks, Clustering, Hidden Markov Model, Neural networks, Fuzzy logic.
1 Introduction
In the recent years, Wireless Sensor Networks (WSNs) has found a wide variety of applications and systems with vastly varying requirements and characteristics. As a result, the complexities of the system design issues and their requirement have increased with respect to hardware and software. Integrating sensor nodes into sophis-ticated sensing, computational and communication infrastructures to form wireless sensor networks will have a significant impact on a wide array of applications ranging from military, scientific, industrial, health-care and domestic services. Various appli-cations of WSN are Telemedicine, Habitat monitoring, Structure health monitoring, Active Volcano, Seismic monitoring, and Avalanche Victims. Wireless sensor net-works are usually a large number of sensor nodes, which are tiny, compact and low cost embedded devices, which can be readily deployed in various types of unstruc-tured environments within predefined and specified area or sometimes an approx-imate area of interest, either inside the phenomenon or very close to it. Efficiency of such systems would improve by providing distributed, localized and energy efficient techniques. Here the sensor nodes have native capabilities to detect the nearest neighbors and help to develop an ad-hoc network through a set of well-defined proto-cols. This leads to the existence of clusters of nodes, which can enhance the network

20 K.N. Veena and B.P. Vijaya Kumar
operations under network management, processing and aggregation of sensor data. Therefore there are many advantages with clustering and their analysis based on the system parameters and applications requirement. The systematic clustering by choos-ing the key parameters and response to their dynamic behavior in resource con-strained sensor networking environment will be a challenging and complex issue.
In this work, we have proposed a method of clustering and analysis to study the dynamic behavior of the system that includes sensor network parameters and applica-tions requirement. The method involves the Fuzzy Logic in fuzzifyng the sensor node parameters. Hidden Markov Model (HMM) is used in estimating a sensor node suita-ble for a particular application. We have used Kohonen Self Organization Map Neural Network (KSOM-NN) [1] as Computational Intelligence for clustering.
The organization of the paper is as follows. A brief discussion on some of the re-lated works is explained in section 2. Section 3 explains the proposed Dynamic clus-tering model. Concept of clustering is explained in section 4. The description of the proposed clustering algorithm is narrated in section 5. Simulation and results are de-scribed in section 6 and concluding remarks are given in section 7.
2 Related Works
In this section a brief discussion on the related works pertaining to Fuzzy logic, Hidden Markov Model and clustering in WSNs are discussed. In [2] fuzzy logic systems to analyze the lifetime of a wireless sensor network are presented. It uses a type-2 fuzzy membership function (MF), where a Gaussian MF with uncertain standard deviation is used to model a single node lifetime in wireless sensor networks. Clustered WSN im-plemented in [3], it implements a protocol for trade-off between loads and increase in life expectancy of the network. In [4] a two-level fuzzy logic is utilized to evaluate the qualification of sensors to become a cluster head. In the first level the qualified nodes are selected based on their energy and number of neighbors.. Then, in the second level nodes overall cooperation is considered in the whole network with fuzzy parameters are discussed. A human movement monitoring, which also adapts to the new move-ment and new sensors using hidden markov model is implemented in [5]. In [6] an ac-tion recognition framework based on an HMM, which is capable of both segmenting and classifying continuous movements for the distributed architecture of Body Sensor Networks is presented. In [7] wearable sensor network that monitors relative proximity using Radio Signal Strength indication (RSSI), and then construct a HMM system for posture identification in the presence of sensing are discussed.
A distributed, randomized clustering algorithm [8] to organize the sensors in a wireless sensor network into clusters is discussed. The algorithms generate a hie-rarchy of cluster heads and observe that the energy savings increase with the number of levels in the hierarchy. The Linked Cluster Algorithm [9] where a node becomes the cluster head, if it has the highest identity among all the nodes within one hop of it-self or among its neighbors is presented. Budget-based clustering approaches [10], message efficient distributed clustering [11] are proposed, involving autonomous sen-sor network clusters of bounded size by keeping lower overall message complexity. In [12] determination of the optimal number of clusters in an observation area is implemented.
Hidden Markov Model with Computational Intelligence for Dynamic Clustering 21
3 Dynamic Clustering Model
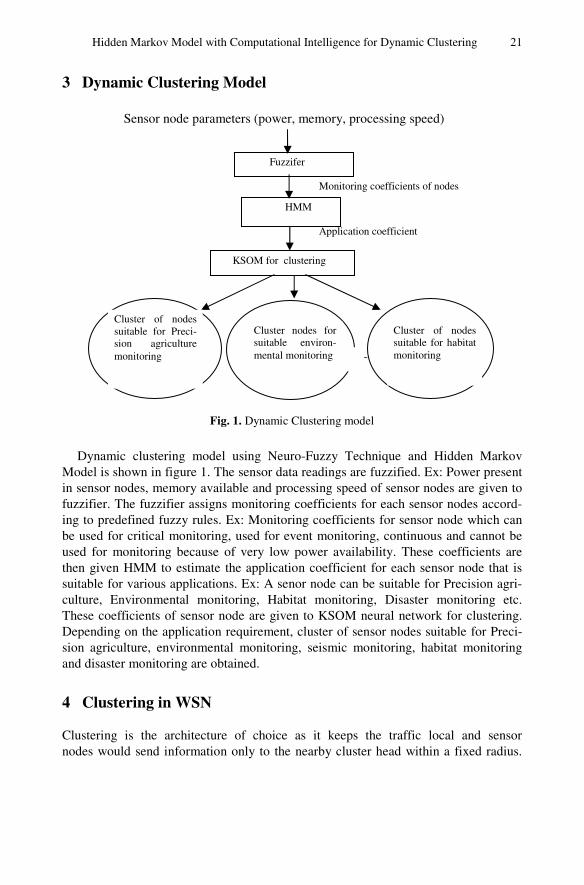
Fig. 1. Dynamic Clustering model
Dynamic clustering model using Neuro-Fuzzy Technique and Hidden Markov Model is shown in figure 1. The sensor data readings are fuzzified. Ex: Power present in sensor nodes, memory available and processing speed of sensor nodes are given to fuzzifier. The fuzzifier assigns monitoring coefficients for each sensor nodes accord-ing to predefined fuzzy rules. Ex: Monitoring coefficients for sensor node which can be used for critical monitoring, used for event monitoring, continuous and cannot be used for monitoring because of very low power availability. These coefficients are then given HMM to estimate the application coefficient for each sensor node that is suitable for various applications. Ex: A senor node can be suitable for Precision agri-culture, Environmental monitoring, Habitat monitoring, Disaster monitoring etc. These coefficients of sensor node are given to KSOM neural network for clustering. Depending on the application requirement, cluster of sensor nodes suitable for Preci-sion agriculture, environmental monitoring, seismic monitoring, habitat monitoring and disaster monitoring are obtained.
4 Clustering in WSN
Clustering is the architecture of choice as it keeps the traffic local and sensor nodes would send information only to the nearby cluster head within a fixed radius.
---
Fuzzifer
HMM
KSOM for clustering
Sensor node parameters (power, memory, processing speed)
Cluster nodes for suitable environ-mental monitoring
Cluster of nodes suitable for habitat monitoring
Monitoring coefficients of nodes
Application coefficient
Cluster of nodes suitable for Preci-sion agriculture monitoring
22 K.N. Veena and B.P. Vijaya Kumar
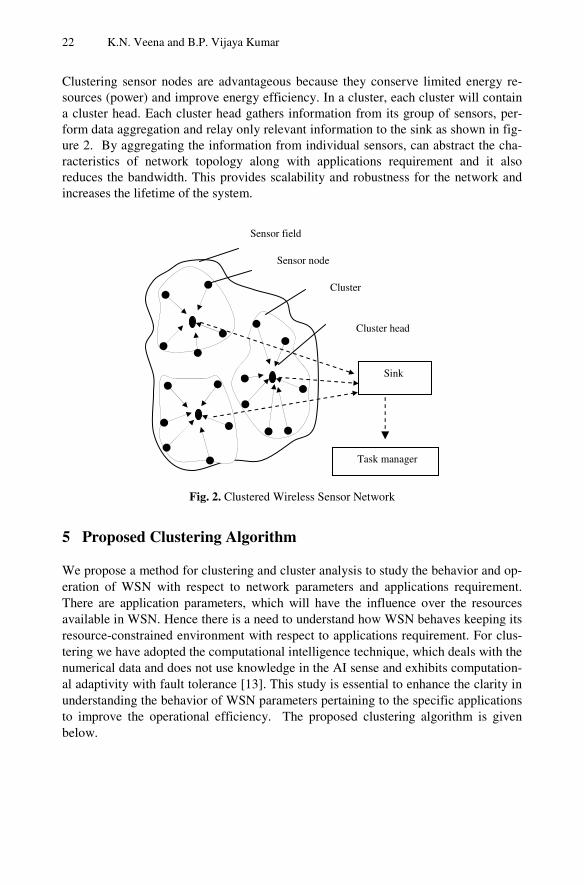
Clustering sensor nodes are advantageous because they conserve limited energy re-sources (power) and improve energy efficiency. In a cluster, each cluster will contain a cluster head. Each cluster head gathers information from its group of sensors, per-form data aggregation and relay only relevant information to the sink as shown in fig-ure 2. By aggregating the information from individual sensors, can abstract the cha-racteristics of network topology along with applications requirement and it also reduces the bandwidth. This provides scalability and robustness for the network and increases the lifetime of the system.
Fig. 2. Clustered Wireless Sensor Network
5 Proposed Clustering Algorithm
We propose a method for clustering and cluster analysis to study the behavior and op-eration of WSN with respect to network parameters and applications requirement. There are application parameters, which will have the influence over the resources available in WSN. Hence there is a need to understand how WSN behaves keeping its resource-constrained environment with respect to applications requirement. For clus-tering we have adopted the computational intelligence technique, which deals with the numerical data and does not use knowledge in the AI sense and exhibits computation-al adaptivity with fault tolerance [13]. This study is essential to enhance the clarity in understanding the behavior of WSN parameters pertaining to the specific applications to improve the operational efficiency. The proposed clustering algorithm is given below.
Sink
Task manager
Sensor field
Sensor node
Cluster
Cluster head

Hidden Markov Model with Computational Intelligence for Dynamic Clustering 23
Algorithm 1. Proposed Dynamic Clustering Algorithm
Begin 1. The sensor node parameters such as memory, power available, processing speed
of each sensor nodes is considered.
2. These sensor node parameters are fuzzified using fuzzy logic with fuzzy rules as given in Table1.
3. The fuzzifier assigns monitoring coefficient for each node, depending on its power availability, memory availability, processing speed.
4. These monitoring coefficients are given to HMM to estimate application coeffi cient for each sensor node.
5. These application coefficients are given to KSOM neural network to obtain clusters depending on the application requirement.
End
5.1 Fuzzy Logic
The model using fuzzy logic consists of a fuzzifier, fuzzy rules, fuzzy inference engine, and a defuzzifier. Input variables used are sensor node parameters such as power available in sensor node, memory and processing speed. Membership function and Fuzzy rules are applied to the sensor node parameters. The membership functions developed and their cor-responding linguistic states are represented in Table 1 and figures 3 through figure 6. The Fuzzifier assigns the monitoring coefficients for each sensor nodes.
Fig. 3. Membership function for power present in sensor node
Fig. 4. Membership function for memory available in sensor node
0 1.0 1.2 2.0 2.5 3 in mw
low medium high
0 40 50 80 90 128 in kB
low medium high

24 K.N. Veena and B.P. Vijaya Kumar
Fig. 5. Membership function for processing speed in sensor node
Fig. 6 Membership function for monitoring coefficient of sensor node
Table 1. Fuzzy rules
Power Memory Processing speed Monitoring coefficient
1 low low low Not used
2 medium medium medium critical
3 medium high medium event
4 medium medium high event
5 medium high high event
6 high high medium continuous
7 high medium high continuous
8 high high high continuous
Sensor nodes which have high power, memory and processing speed can be used for continuous monitoring. Sensor nodes with medium power, high memory and high processing speed can be used for event monitoring, sensor nodes with medium power and low memory and processing speed can be used for critical monitoring. Sensor nodes with low power and low memory and low processing speed cannot be used for monitoring.
5.2 Hidden Markov Model
A Hidden Markov Model (HMM)[14] is a statistical Markov model in which the system being modeled is assumed to be a Markov process with unobserved (hidden) states.
0 3.5 4 4.5 5 7.3 in MHz
low medium high
Not used critical event continuous
0 0.1 0.2 0.25 0.3 0.45 0.5 1 monitoring coeff

Hidden Markov Model with Computational Intelligence for Dynamic Clustering 25
s- states (application coefficients); y-observations (monitoring coefficients); a- State transition probabilities; b-output probabilities;
Fig. 7. General Architecture of a Hidden Markov Model
A Hidden Markov Model is shown in the figure 7 and it is denoted by equation 1.
λ=(п,A,B) (1)
N applications of WSN are modeled as N hidden states, with S = {S0, S1, …, SN-1} the set of hidden states, in our case N=4 and qt the hidden state at time t.
M is the number of observable parameters, M monitoring coefficients of sensor nodes are considered, with y = { y0, y1, …, yM-1} the set of observable parameters and Ot the observable state at time t.
A={aij}, the transition probabilities between the hidden states Si and Sj, where aij =P[qi+1= Sj | qt = Si], 0≤ i, j≤ N-1. B = {bj(k)} - the probabilities of the observable states yk in hidden states Sj, Where bj (k) = P[Ot = yk | qt = Sj ], 0 ≤ j ≤ N −1, 0 ≤ k ≤ M −1
The following transition state matrix probabilities and emission probabilities are con-sidered for HMM computation.
A=
1000
2.08.000
02.08.00
002.08.0
B=
100
010
04.06.0
03.007
π = {πi} - the initial hidden state probabilities, where пi = P[ q1 = S i], 0≤ i ≤ N −1.
Learning
The parameter learning task in HMM is to compute, given an output sequence or a set of such sequences, the best set of state transition and output probabilities. The task is usually to derive the maximum likelihood estimate of the parameters of the HMM given the set of output sequences. To solve this Baum–Welch algorithm is used. The Baum–Welch algorithm is a forward-backward algorithm, and is a special case of the expectation-maximization algorithm. The forward algorithm is used to compute the
y1 y2 y3 y4
S3 S2 S4
a23
b21 b23 b44 b34 b12
a34 a12
S1

26 K.N. Veena and B.P. Vijaya Kumar
probability of an output sequence given the model parameters. The Viterbi algorithm is used to find the most likely sequence of hidden states to have generated a particular output sequence, given the model parameters.
5.3 Kohonen Self-Organizing Map Neural Network (KNN)
Clustering computation is carried out using Kohonen Self–Organizing Map Neural Networks (KSOM-NN) algorithm to cluster the sensor nodes depending on the para-meters of interest. The KSOM-NN is competitive, feed forward type and unsuper-vised training neural network. They have the capability of unsupervised learning and self-organizing properties, is able to infer relationships and learn more as more inputs are presented to it. The Application coefficient of each sensor nodes is considered to cluster sensor nodes using Kohonen Self-Organizing Map Neural Networks. Cluster of sensor nodes suitable for various applications are formed. The figure 8 shows a typical example of a KSOM-NN [15] with 4 input and 20 output neurons.
Fig. 8. A typical KSOM-NN model with 4 input and 20 output neurons
Let the input pattern be: I = (I1, I2,.,I|V|), where there are |V| input neurons in the in-put layer. Now suppose there are Q neurons in the output (competitive) layer, let Oj be the jth output neuron. So the whole of the output layer will be: O= (O1,O2,.,OQ) for each output neuron Oj there are |V| incoming connections from the |V| input neurons. Each connection has a weight value W. So, for any neuron Oj on the output layer the set of incoming connection weights are: wj=(wj1,wj2,.,wj|v|). The Euclidean distance value Dj of a neuron Oj in the output layer, whenever an input pattern I is presented at the input layer, is:
==
.|V|
1i
2) ji W- iI (jD . (2)
The competitive output neuron with the lowest Euclidean distance at this stage is the closest to the current input pattern, called as winning neuron. The neighborhood size and weight updating computation are
ht=ho (1-t/T) and )( oldwIoldwneww jjj −+= α (3)
The size of the neighborhood h, starts with a big enough size and decreases with re-spect to learning iterations. Where, ht denotes the actual neighborhood size, ho de-notes the initial neighborhood size, t denotes the current learning epoch and T denotes the total number of epochs to be done. Where, α is the learning rate parameter, typical choices are in the range [0.2 . . 0.5].
Input layer
Neurons
Connection weights
Competitive output layer
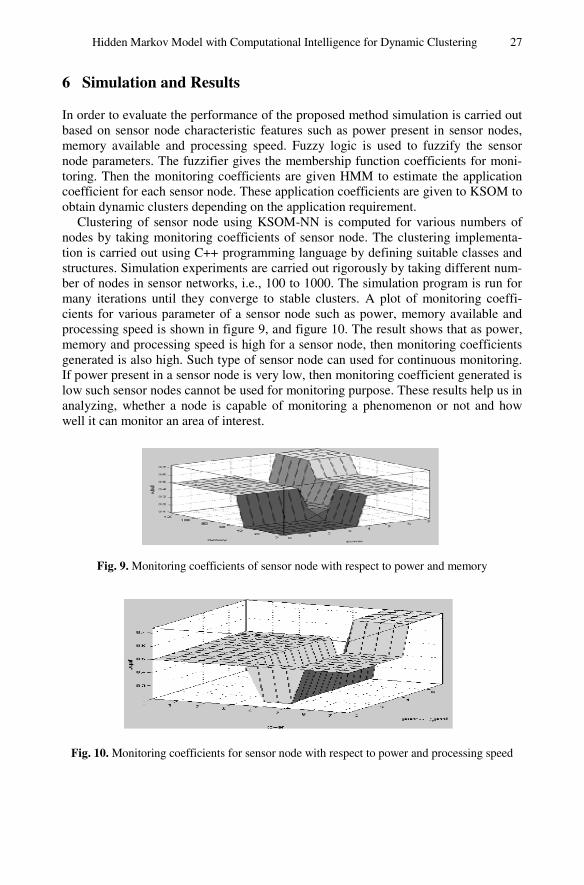
Hidden Markov Model with Computational Intelligence for Dynamic Clustering 27
6 Simulation and Results
In order to evaluate the performance of the proposed method simulation is carried out based on sensor node characteristic features such as power present in sensor nodes, memory available and processing speed. Fuzzy logic is used to fuzzify the sensor node parameters. The fuzzifier gives the membership function coefficients for moni-toring. Then the monitoring coefficients are given HMM to estimate the application coefficient for each sensor node. These application coefficients are given to KSOM to obtain dynamic clusters depending on the application requirement.
Clustering of sensor node using KSOM-NN is computed for various numbers of nodes by taking monitoring coefficients of sensor node. The clustering implementa-tion is carried out using C++ programming language by defining suitable classes and structures. Simulation experiments are carried out rigorously by taking different num-ber of nodes in sensor networks, i.e., 100 to 1000. The simulation program is run for many iterations until they converge to stable clusters. A plot of monitoring coeffi-cients for various parameter of a sensor node such as power, memory available and processing speed is shown in figure 9, and figure 10. The result shows that as power, memory and processing speed is high for a sensor node, then monitoring coefficients generated is also high. Such type of sensor node can used for continuous monitoring. If power present in a sensor node is very low, then monitoring coefficient generated is low such sensor nodes cannot be used for monitoring purpose. These results help us in analyzing, whether a node is capable of monitoring a phenomenon or not and how well it can monitor an area of interest.
Fig. 9. Monitoring coefficients of sensor node with respect to power and memory
Fig. 10. Monitoring coefficients for sensor node with respect to power and processing speed

28 K.N. Veena and B.P. Vijaya Kumar
.
Fig. 11. Cluster formed with respect to application requirement
Fig. 12. Time for computation to form clusters with respect to parameters of sensor node
The figure 11 shows the number of clusters formed with respect to application coefficient of sensor nodes in WSN. The results show that the number of clusters formed is dependent of the number of parameters of sensor nodes chosen and the ap-plication requirement. These results are essential and can be easily used in various applications depending on the critical region of interest. For example, nodes which can be used for continuous monitoring are suitable for precision Agriculture, and nodes which can be used for event monitoring are suitable for monitoring of seismic area. The computation time for clustering is measured with respect to application and number of sensor nodes as shown in figure 12. These results show on how the indi-vidual parameters affect the formation of cluster and its size. These results would be used in real time decision making applications and in adaptive systems.
N= 1000
N= 500
Num
ber
of c
lust
ers
form
ed
0 1 2 3 4
8
7
6
5
N=100
Application coefficient
Tim
e fo
r co
mpu
tatio
n
Number of parameters
N= 1000
N= 500
N=100
1.8 1.6 1.4 1.2 1.0
0.8
0 1 2 3 4

Hidden Markov Model with Computational Intelligence for Dynamic Clustering 29
7 Conclusion
In this work we have proposed a method for clustering and their analysis to study the dynamic behavior of the cluster formation based on the system parameters and appli-cation requirements. The technique involves the adoption of computational intelli-gence to form clustering and analyzing sensor node parameters in WSN. We have used computational intelligence, Neuro-Fuzzy techniques and Hidden Markov Model for the above computations. The simulations are carried out to evaluate the perfor-mance of the proposed method with respect to different parameters of sensor net-works and applications requirement. Since we are analyzing and estimating sensor nodes depending on the application requirement, proactive decisions can be taken. The decisions can be redeployment of sensor nodes , when we estimates some of the sensor cannot be used for monitoring because of very low power, or sensor nodes are less in number for a particular application requirement. This method of study would give scope for more understanding the chaotic behavior of environment and system parameters of WSN to enhance the operational efficiency.
References
1. Haykin, S.: Neural Networks: A Comprehensive foundation, 2nd edn. Macmillan college publishing, Newyork (1995)
2. Shu, H.: Analysis Using Interval Type-2 Fuzzy Logic System. IEEE Transactions on Fuzzy Systems 16(2), 416–427 (2008)
3. Azad, I., Mashhad, I.: CFGA: Clustering Wireless Sensor Network Using Fuzzy Logic and Genetic Algorithm, Wireless Communications. In: 7th International Conference on Net-working and Mobile Computing (WiCOM), September 23-25, pp. 1–4 (2011)
4. Torghabeh, N.A.: Cluster head selection using a two-level fuzzy logic in wireless sensor networks. In: 2nd International Conference on Computer Engineering and Technology (ICCET), April 16-18, vol. 2, pp. V2-357 – V2-361 (2010)
5. Guenterberg, E., Ghasemzadeh, H., Bajcsy, R.: A Method for Extracting Temporal Para-meters Based on Hidden Markov Models in Body Sensor Networks With Inertial Sensors. IEEE Transactions on Information Technology in Biomedicine 13(6), 1019–1030 (2009)
6. Guenterberg, E., Ghasemzadeh, H., Loseu, V., Jafari, R.: Distributed Continuous Action Recognition Using a Hidden Markov Model in Body Sensor Networks. In: BodyNets 2008, Proceedings of the ICST 3rd International Conference on Body Area Networks (2008) ISBN: 978-963-9799-17-2
7. Quwaider, M., Biswas, S.: Body posture identification using hidden Markov model with a wearable sensor network. In: Proceedings of the ICST 3rd International Conference on Body Area Networks ICST, BodyNets 2008, Brussels, Belgium, pp. 978–963 (2008) ISBN: 978-963-9799-17-2
8. Bandyopadhyay, S., Coyle, E.J.: An Energy Efficient Hierarchical Clustering Algorithm for Wireless Sensor Networks. In: IEEE INFOCOM (2003)
9. Baker, D.J., Ephremides, A.: The Architectural Organization of a Mobile Radio Network via a Distributed Algorithm. IEEE Transactions on Communications 29(11), 1694–1701 (1981)
10. Tzevelekas, L., Stavrakakis, I.: Directed Budget-Based Clustering for Wireless Sensor Networks. In: IEEE International Conference, MASS (October 2006)

30 K.N. Veena and B.P. Vijaya Kumar
11. Krishnan, R., Starobinski, D.: Efficient clustering algorithms for self organizing wireless sensor networks. Ad Hoc Networks 4(1), 36–59 (2006)
12. Wang, L.-C., Liu, C.-M., Wang, C.-W.: Optimizing the Number of Clusters in a Wireless Sensor Network Using Cross-layer Analysis. In: IEEE International Conference, MASS (October 2004)
13. Witold, P., Vasitakos, A.: Computational Intelligence in Telecommunication Networks. CRC press LLC, USA (2001)
14. Karray, F.O., De Silva, C.: Soft Computing and Intelligent System Design Theory, Tools and Applications. Pearson Education (2004)
15. Vijay Kumar, B.P., Venkataram, P.: Reliable Multicast routing in Mobile networks: a Neural Network approach. IEE Proc.-Communication 150(5), 377–384 (2003)
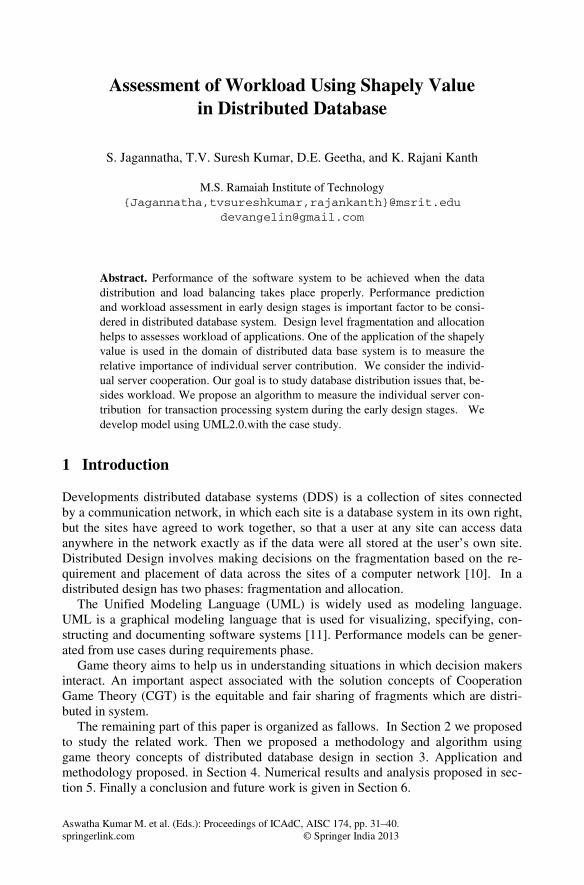
Aswatha Kumar M. et al. (Eds.): Proceedings of ICAdC, AISC 174, pp. 31–40. springerlink.com © Springer India 2013
Assessment of Workload Using Shapely Value in Distributed Database
S. Jagannatha, T.V. Suresh Kumar, D.E. Geetha, and K. Rajani Kanth
M.S. Ramaiah Institute of Technology {Jagannatha,tvsureshkumar,rajankanth}@msrit.edu
Abstract. Performance of the software system to be achieved when the data distribution and load balancing takes place properly. Performance prediction and workload assessment in early design stages is important factor to be consi-dered in distributed database system. Design level fragmentation and allocation helps to assesses workload of applications. One of the application of the shapely value is used in the domain of distributed data base system is to measure the relative importance of individual server contribution. We consider the individ-ual server cooperation. Our goal is to study database distribution issues that, be-sides workload. We propose an algorithm to measure the individual server con-tribution for transaction processing system during the early design stages. We develop model using UML2.0.with the case study.
1 Introduction
Developments distributed database systems (DDS) is a collection of sites connected by a communication network, in which each site is a database system in its own right, but the sites have agreed to work together, so that a user at any site can access data anywhere in the network exactly as if the data were all stored at the user’s own site. Distributed Design involves making decisions on the fragmentation based on the re-quirement and placement of data across the sites of a computer network [10]. In a distributed design has two phases: fragmentation and allocation.
The Unified Modeling Language (UML) is widely used as modeling language. UML is a graphical modeling language that is used for visualizing, specifying, con-structing and documenting software systems [11]. Performance models can be gener-ated from use cases during requirements phase.
Game theory aims to help us in understanding situations in which decision makers interact. An important aspect associated with the solution concepts of Cooperation Game Theory (CGT) is the equitable and fair sharing of fragments which are distri-buted in system.
The remaining part of this paper is organized as fallows. In Section 2 we proposed to study the related work. Then we proposed a methodology and algorithm using game theory concepts of distributed database design in section 3. Application and methodology proposed. in Section 4. Numerical results and analysis proposed in sec-tion 5. Finally a conclusion and future work is given in Section 6.

32 S. Jagannatha et al.
2 Related Work
Various researchers made significant contribution to distributed databases and shapely value and its applications. In [15] author address forming procurement networks for items in supply chain management. Procurement networks involves a bottom-up as-sembly of complex production, assembly, and exchange relationships through suppli-er selection and contracting decisions based on cooperative game theory concepts. In [17][18] author describes cooperative profits during the cooperation, which seriously affects the efficiency and effectiveness. So it is necessary to allocate cooperative profit reasonably among members to improve the cooperative relationship between members in stability of supply chain. In [16] this paper the author address marginal contribution of each sensor the observation of spatially correlated sensor field, and can be used to allocate the probability of each sensor’s being measured in proportion to its contribution using shapely value. In [6] authors describes the coalitional games were used in the domain networks and it is used in measure the relative importance of individual nodes. Author develops exact analytical formulas for computing.
In [8][16][6] author describes the Supply chain Profit allocation issue based on the game theory concepts. In [4] [3] the author considers how to design coordination strategies to achieve the coordination in decentralized supply chain, considering dif-ferent types of pricing, and they propose the algorithm for sharing of revenue by supply chain coordination. In [16] author proposed two model ie Stackelberg model and Cournot model for a multistage cooperation. A multi-stage cooperation and com-petition model based on flexibility in port service supply chain. In [15] this paper au-thor addresses the interruptible load management by allocation and quantification of wholesale price spike. The Shapley value in cooperative game theory is applied to al-locate the benefit among the participants. In [10] author investigate the performance of Marginal cost (MC) and Shapley value (SH) mechanisms for the sharing the cost of multicast transmissions. The supply chain coordination mechanism between supply and demand are addressed in [9].
In all the approaches, the researchers use application of shapley value in supply chain management system. Some authors address the cooperation game theory con-cept by allocation of cost sharing by cooperative mechanism and some address the node centrality, domain networks and it is used in measure the relative importance of individual nodes. Authors do not consider the application of shapley value in server cooperation in transaction processing system. Using Shapley value concept authors do not consider the performance analysis, workload assessment of server in distributed database system during early design stages. Keeping these in view we propose an al-gorithm to predict the performance of distributed database system during early stages of software system and assess the workload of the server. We use the shapely value for computing the individual server workload.

Assessment of Workload Using Shapely Value in Distributed Database 33
3 Methodology
3.1 Proposed Methodology
The algorithm for the proposed methodology is given below. The algorithm uses the procedure to compute the server cooperation using the shapely value for assesses the workload of the server and also used to measure the relative importance of individual nodes.
Step 1. We propose the network infrastructure by considering the number of servers which are connected in high speed LAN
Step 2. We propose the applications and identify the functional requirements, data requirements, and identify important scenarios of the system.
Step 3. Based on the function requirements, develop use case diagram by using UML.
Step 4. Identify the entity, relation ship among the entities, types of attributes in each entity. Draw E-R diagram and develop global conceptual schema using E-R diagram
Step 5. In a given application identify the set of query that arise, data requirement of the server and propose deployment environment.
Step 6. Attribute usage matrix determines the exact number of attributes is associated with other attributes and identify the possible predicates and develop pre-dicate usage matrix. These matrix which helps for fragmentation.
Step 7. Divide the global schema into a set of horizontal, vertical and mixed frag-ments.
Step 8. Fragment in step seven are distributed into the proposed system architec-ture. ie allocate these fragments into servers using allocation algorithm .
Step 9. Identify the probability of server interacting with the other server for compu-ting the transaction. The results are input to the step ten in computing the shapley value.
Step 10. The details of Shapley value computation is given in the section 3.3.
3.2 Preliminaries
A cooperative game with transferable utility [1] is defined as the pair (N; v) where N = {1,2,…..n} the set of players and v : 2N R is a real-valued mapping with v(φ) = 0. The concept of Shapley value, which was developed axiomatically by Shapley [2], takes into account the relative importance of each player to the game in deciding the payoff to φ(N, v) = (φ1(N, v); φ2(N, v) ; φn(N, v)) the Shapley value of the transfer-able unit game (N, v). Mathematically, the Shapley value, φi(N, v), of a player i is given by,
φi(N; v) = )}(}){({
!
)1||(|!|
\
CviCvn
CnC
iNC
−−−⊆
where φi(N; v) is the expected payoff to player i.

34 S. Jagannatha et al.
3.3 Algorithm for Calculating Shapley Value :(Step 10 of Methodology)
Input the number of servers N for all scenarios S do
Develop Use case model U Develop global schema Fragment and allocate in proposed system architecture. for all use case U do Input coalition function V ie the probability each server contribution with other server Input V(1,2,….. N) ←100 (All combination of servers) for i ← 1 to N do v(i) ← 0 end for for i ← 1 to N do for j ← i + 1 to N do input V(i, j) end for; end for {calculate the shapley value } for i ← 1 to N do Generate the permutation of servers for each server do
Compute shapley value ie individual server workload end for end for
end for.
4 Application and Methodology
4.1 Description of the Problem
The banking system we have considered is highly distributed in nature. The database of the application deployed in these servers where application resides. We consider three servers customer accounts, Loans, and the Employees for illustrative purpose and we assume that data base index exist in three servers. We focus on transaction of the customer, loan processing, employee salary, leaves monitoring, attendance, que-ries etc. The data base fragments are allocate in to these three servers using allocation algorithm given in[5].
4.2 Illustration
The important scenario as represented in use case diagram in figure 1. Identify the major entity and attributes and draw ER diagram, develop global conceptual schema for example Customer Accounts, Employee, Loan, Leave, Customer Transaction, Salary are in the global conceptual schema. The major transaction is deposit, with-drawn, loan processing, balance enquiry; know the status of salary, Status of leave etc. The attribute usage and predicate usage matrix are shown in the table 1 and
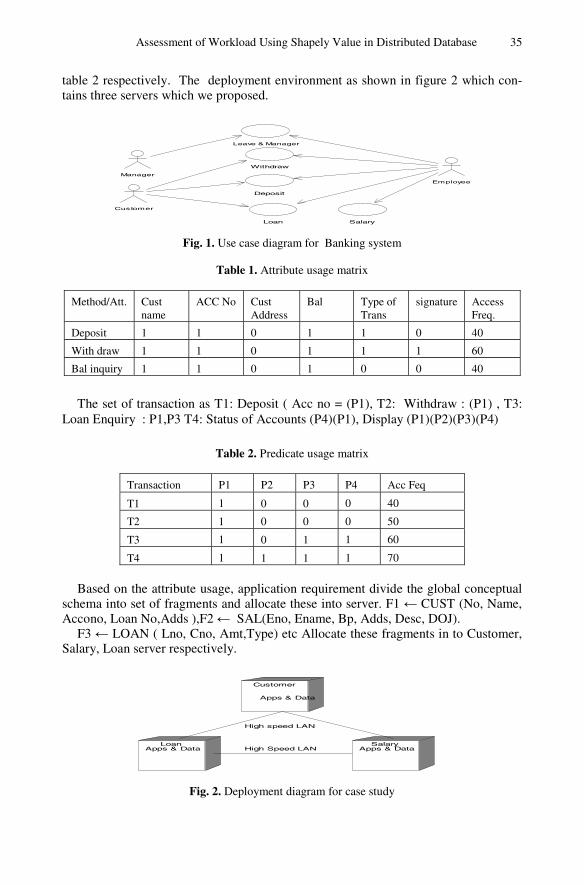
Assessment of Workload Using Shapely Value in Distributed Database 35
table 2 respectively. The deployment environment as shown in figure 2 which con-tains three servers which we proposed.
Customer
Salary
Deposit
Withdraw
Loan
Employee
Manager
Leave & Manager
Fig. 1. Use case diagram for Banking system
Table 1. Attribute usage matrix
Method/Att. Cust name
ACC No Cust Address
Bal Type of Trans
signature Access Freq.
Deposit 1 1 0 1 1 0 40
With draw 1 1 0 1 1 1 60
Bal inquiry 1 1 0 1 0 0 40
The set of transaction as T1: Deposit ( Acc no = (P1), T2: Withdraw : (P1) , T3: Loan Enquiry : P1,P3 T4: Status of Accounts (P4)(P1), Display (P1)(P2)(P3)(P4)
Table 2. Predicate usage matrix
Transaction P1 P2 P3 P4 Acc Feq
T1 1 0 0 0 40
T2 1 0 0 0 50
T3 1 0 1 1 60
T4 1 1 1 1 70
Based on the attribute usage, application requirement divide the global conceptual schema into set of fragments and allocate these into server. F1 ← CUST (No, Name, Accono, Loan No,Adds ),F2 ← SAL(Eno, Ename, Bp, Adds, Desc, DOJ).
F3 ← LOAN ( Lno, Cno, Amt,Type) etc Allocate these fragments in to Customer, Salary, Loan server respectively.
Loan SalaryApps & Data
Customer
Apps & Data
Apps & Data
High speed LAN
High Speed LAN
Fig. 2. Deployment diagram for case study
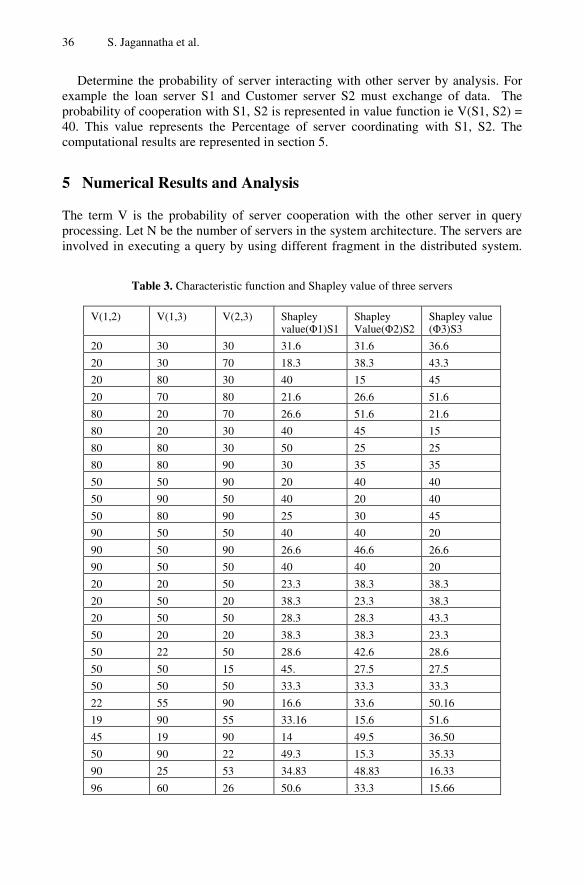
36 S. Jagannatha et al.
Determine the probability of server interacting with other server by analysis. For example the loan server S1 and Customer server S2 must exchange of data. The probability of cooperation with S1, S2 is represented in value function ie V(S1, S2) = 40. This value represents the Percentage of server coordinating with S1, S2. The computational results are represented in section 5.
5 Numerical Results and Analysis
The term V is the probability of server cooperation with the other server in query processing. Let N be the number of servers in the system architecture. The servers are involved in executing a query by using different fragment in the distributed system.
Table 3. Characteristic function and Shapley value of three servers
V(1,2) V(1,3) V(2,3) Shapley value(Φ1)S1
Shapley Value(Φ2)S2
Shapley value (Φ3)S3
20 30 30 31.6 31.6 36.6
20 30 70 18.3 38.3 43.3
20 80 30 40 15 45
20 70 80 21.6 26.6 51.6
80 20 70 26.6 51.6 21.6
80 20 30 40 45 15
80 80 30 50 25 25
80 80 90 30 35 35
50 50 90 20 40 40
50 90 50 40 20 40
50 80 90 25 30 45
90 50 50 40 40 20
90 50 90 26.6 46.6 26.6
90 50 50 40 40 20
20 20 50 23.3 38.3 38.3
20 50 20 38.3 23.3 38.3
20 50 50 28.3 28.3 43.3
50 20 20 38.3 38.3 23.3
50 22 50 28.6 42.6 28.6
50 50 15 45. 27.5 27.5
50 50 50 33.3 33.3 33.3
22 55 90 16.6 33.6 50.16
19 90 55 33.16 15.6 51.6
45 19 90 14 49.5 36.50
50 90 22 49.3 15.3 35.33
90 25 53 34.83 48.83 16.33
96 60 26 50.6 33.3 15.66
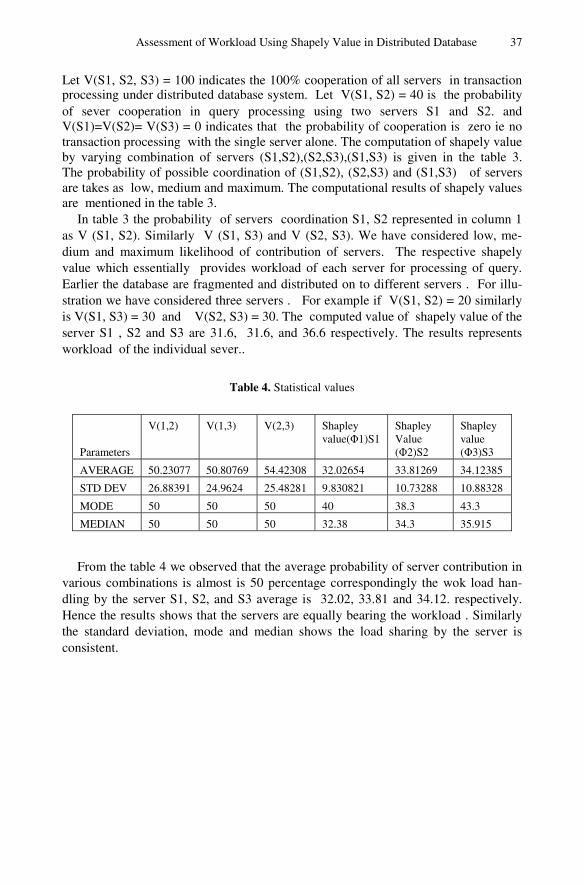
Assessment of Workload Using Shapely Value in Distributed Database 37
Let V(S1, S2, S3) = 100 indicates the 100% cooperation of all servers in transaction processing under distributed database system. Let V(S1, S2) = 40 is the probability
of sever cooperation in query processing using two servers S1 and S2. and V(S1)=V(S2)= V(S3) = 0 indicates that the probability of cooperation is zero ie no transaction processing with the single server alone. The computation of shapely value by varying combination of servers (S1,S2),(S2,S3),(S1,S3) is given in the table 3. The probability of possible coordination of (S1,S2), (S2,S3) and (S1,S3) of servers are takes as low, medium and maximum. The computational results of shapely values are mentioned in the table 3.
In table 3 the probability of servers coordination S1, S2 represented in column 1 as V (S1, S2). Similarly V (S1, S3) and V (S2, S3). We have considered low, me-dium and maximum likelihood of contribution of servers. The respective shapely value which essentially provides workload of each server for processing of query. Earlier the database are fragmented and distributed on to different servers . For illu-stration we have considered three servers . For example if V(S1, S2) = 20 similarly is V(S1, S3) = 30 and V(S2, S3) = 30. The computed value of shapely value of the server S1 , S2 and S3 are 31.6, 31.6, and 36.6 respectively. The results represents workload of the individual sever..
Table 4. Statistical values
Parameters
V(1,2) V(1,3) V(2,3) Shapley value(Φ1)S1
Shapley Value (Φ2)S2
Shapley value (Φ3)S3
AVERAGE 50.23077 50.80769 54.42308 32.02654 33.81269 34.12385
STD DEV 26.88391 24.9624 25.48281 9.830821 10.73288 10.88328
MODE 50 50 50 40 38.3 43.3
MEDIAN 50 50 50 32.38 34.3 35.915
From the table 4 we observed that the average probability of server contribution in various combinations is almost is 50 percentage correspondingly the wok load han-dling by the server S1, S2, and S3 average is 32.02, 33.81 and 34.12. respectively. Hence the results shows that the servers are equally bearing the workload . Similarly the standard deviation, mode and median shows the load sharing by the server is consistent.
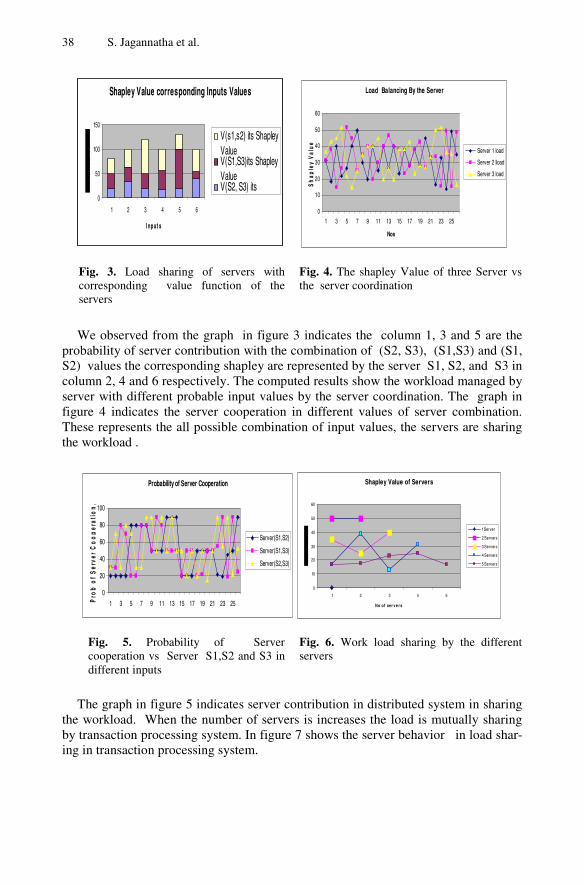
38 S. Jagannatha et al.
Shapley Value corresponding Inputs Values
0
50
100
150
1 2 3 4 5 6
I nput s
V(s1,s2) its ShapleyValueV(S1,S3)its ShapleyValueV(S2, S3) its
Load Balancing By the Server
0
10
20
30
40
50
60
1 3 5 7 9 11 13 15 17 19 21 23 25
Nos
Sh
aple
y V
alu
e
Server 1 load
Server 2 lload
Server 3 load
Fig. 3. Load sharing of servers with corresponding value function of the servers
Fig. 4. The shapley Value of three Server vs the server coordination
We observed from the graph in figure 3 indicates the column 1, 3 and 5 are the
probability of server contribution with the combination of (S2, S3), (S1,S3) and (S1, S2) values the corresponding shapley are represented by the server S1, S2, and S3 in column 2, 4 and 6 respectively. The computed results show the workload managed by server with different probable input values by the server coordination. The graph in figure 4 indicates the server cooperation in different values of server combination. These represents the all possible combination of input values, the servers are sharing the workload .
Probability of Server Cooperation
0
20
40
60
80
100
1 3 5 7 9 11 13 15 17 19 21 23 25Pro
b o
f S
erve
r C
oo
per
atio
n.
Server(S1,S2)
Server(S1,S3)
Server(S2,S3)
Shapley Value of Servers
0
10
20
30
40
50
60
1 2 3 4 5
No of ser ve r s
1 Server
2 Servers
3 Servers
4 Servers
5 Servers
Fig. 5. Probability of Server cooperation vs Server S1,S2 and S3 in different inputs
Fig. 6. Work load sharing by the different servers
The graph in figure 5 indicates server contribution in distributed system in sharing the workload. When the number of servers is increases the load is mutually sharing by transaction processing system. In figure 7 shows the server behavior in load shar-ing in transaction processing system.
Assessment of Workload Using Shapely Value in Distributed Database 39
6 Conclusion
In this paper we proposed an algorithm for assessing the workload of the sever. in dis-tributed database system in early design stages. We address the relative importance of each server by computing SV in the proposed architecture. The key requirements are to understand the importance of each server which are involved in processing a query. We model the application with UML and simulate using C language and report the results. Further the system can be simulate and find the various performance parame-ters as response time, system utilization and queue length average waiting time, idle time of the server, average service time, average time between arrival, and result can be reported.
References
1. Anda, B., Dreiem, H., Sjoberg, D.I.K., Jorgensen, M.: Estimating Software development Effort based on Use Cases – Experiences from Industry, http://www.idi.ntnu.no/emner/tdt4290/docs/faglig/ uml2001-anda.pdf
2. Petriu, D., Woodside, M.: Analysing Software Requirements Specifications for Perfor-mance. In: Proceedings of the 3rd International Workshop on Software and Performance, Rome, Italy, July 24 - 26, pp. 1–9 (2002)
3. Cruijssena, F., Borma, P., Fleurena, H., Hamers, H.: Insinking: a methodology to exploit synergy in transportation (2004)
4. Liu, G.-Q., Zhang, F.-H.: Research on Supply Chain Coordination with the Consideration of Pricing and Transportation Cost. In: Proceedings of the IEEE International Conference on Automation and Logistics, Qingdao, China (September 2008)
5. Huang, Y.F., Chen, J.H.: Fragment Allocation in Distributed Database Design. Journal of Information Science and Engineering 17, 491–506 (2001)
6. Yi, C.-H.: Using Modified Shapley Value to Determine Revenue Allocation within Supply Chain. In: 2009 International Conference on Information Management, Innovation Man-agement and Industrial Engineering (2009), doi:10.1109/ICIII.2009.26, Jkl;h 978-0-7695-3876-1/09 $25.00 © 2009 IEEE
7. Shapley, L.S.: A Value for N-Person Games. In: Kuhn, H.W., Tucker, A.W. (eds.) Contri-butions to the Theory of Games, vol. I. Princeton University Press, Princeton (1950)
8. Chen, L., Shen, M., Chen, C.: A Research in Supply Chain Profit Allocation Based on Co-operation Game Theor. In: 2010 International Conference on System Science, Engineering Design and Manufacturing Informatization (2010), doi:10.1109/ICSEM.2010.152, 978-0-7695-4223-2/10 $26.00 © 2011 IEEE
9. Hu, L.-Y., Chungu, Y.-Q., Jiang, Z.-S.: Research on the Coordination Mechanism Model of the Three-level Supply. In: Chain HU 2007, 14th International Conference on Manage-ment Science & Engineering, Harbin, P.R.ChinaKjl, August 20-22 (2007)
10. Garg, N., Grosu, D.: Performance Evaluation of Multicast Cost Sharing Mechanisms. In: 21st International Conference on Advanced Networking and Applications (AINA 2007) (2007) 0-7695-2846-5/07 $20.00 © 2007
11. Myerson, R.B.: Game Theory: Analysis of Conflict. Harvard University Press, Cambridge (1997)

40 S. Jagannatha et al.
12. Narayanam, R., Narahari, Y.: A Shapley Value Based Approach to Discover Influential Nodes in Social Networks. IEEE Transactions on Automation Science and Engineering, IEEE TASE (2010)
13. Navathe, S., Karlapalem, K., Ra, M.: A mixed fragmentation methodology for initial dis-tributed database design. Journal of Computer and Software Engineering 3(4), 395–426 (1995)
14. Byun, S.-S., Moussavinik, H., Balasingham, I.: Fair Allocation of Sensor Measurements Using Shapley Value. In: 2009 IEEE 34th Conference on Local Computer Networks (LCN 2009), Zürich, Switzerland, October 20-23 (2009)
15. Zhang, S., LiSs, Q.: Application of Cooperative Game Theory to Benefit Allocation of In-terruptible Load Management (2011) 978-1-4244-6255-1/11/$26.00 © 2011 IEEE
16. Sun, S., Zhang, J.: Tai’anEvolutionary Game Analysis on the Effective Coopetition Me-chanism of Partners within High Quality Pork Supply Chain Support by National Science Foundation in China (No. 70572100) (2008) 978-1-4244-2013-1/08/$25.00 © 2008 IEEE
17. Chandrashekar, T.S., Narahari, Y.: A Shapley Value Analysis to Coordinate the Formation of Procurement Networks. In: Proceedings of the 3rd Annual IEEE Conference on Auto-mation Science and Engineering, Scottsdale, AZ, USA, September 22-25 (2007)
18. Yan, J., Zhang, Y.: Supply Chain Business Process Reengineering Directed by the Project. In: Proceedings of the IEEE International Conference on Automation and Logistics, Jinan, China, August 18 - 21 (2007)
19. Wang, L., Zhou, Y.: Research on Cooperation Profit Allocation in Three-stage Supply Chain Based on Distribution Channel (2008) 978-1-4244-2108-4/08/$25.00 © 2008 IEEE
20. http://www.omg.org 21. Zheng, Y., Zhang, S., Chen, X., Liu, F.: Application of Modified Shapley Value in Gains
Allocation of Closed-loop Supply Chain under. Third-Party Reclaim Energy Procedia 5, 980–984 (2011)
Aswatha Kumar M. et al. (Eds.): Proceedings of ICAdC, AISC 174, pp. 41–48. springerlink.com © Springer India 2013
Modeling and Estimation of Cooperative Index for Multi-Agent Systems Using Execution Graph
S. Ajitha, T.V. Suresh Kumar, D. Evangelin Geetha, and K. Rajani Kanth
M.S. Ramaiah Institute of Technology {ajithasankar,rajanikanth.kundurthi}@gmail.com
{sureshkumar,degeetha}@msrit.edu
Abstract. A multi-agent system (MAS) is a system composed of multiple interacting intelligent agents. MAS can be used to solve problems that are difficult or impossible for an individual agent to solve. The different characteristics of MAS help in solving highly complex distributed problems. One of the important characteristics of MAS is its cooperative nature. This character helps different agents to interact with each other by exchanging messages. One of the major challenges in MAS is quantifying the cooperation between agents. In this paper, we propose a new methodology to compute the cooperative index of MAS in the early stages of its development. For this calculation, execution graph is used to model the software specifications. The proposed methodology is illustrated with a case study and the results are compared with the cooperative index obtained from the Unified Modeling Language (UML) sequence diagram.
Keywords: Multi-Agent Systems, Cooperative Index, Execution Graph.
1 Introduction
Multi Agent System has grown in popularity as a feasible solution to complex distributed information system where it is assumed that the computational components are autonomous in nature. The main characteristic of agent includes autonomy, co-operation, pro-activeness, social ability, mobility. Against this background a wide range of software engineering paradigms have been devised. Several agent oriented software engineering methodologies and different architectures have been proposed by different authors [11-12] [15 - 16]. Cooperation is the primary characteristic of multi agent system where the overall system exhibits significantly greater functionality than the individual components. The agents in MAS cooperate with each other in the system in some way to accomplish some goal. Such cooperation can be communicative in that the agents communicate by sending and receiving of signals/messages with each other in order to cooperate. The agent cooperation has received a considerable amount of attention in the MAS literature.
Performance is one of the important quality attributes that to be addressed along with the development of any software system. As the communication between the

42 S. Ajitha et al.
agents plays a vital role in the performance, it is necessary to address the performance issues of cooperating agents. There are various approaches for predicting the performance of software systems in the early stages of software development. Software performance engineering (SPE) coined by Connie U Smith is a methodical quantitative approach for constructing software systems to meet the performance requirements. The advantages of SPE includes increased productivity, improved quality and effectiveness of the resulting software product, controlled cost of the sustaining hardware and software, enhanced productivity during implementation and testing. SPE methodology covers performance data gathering, quantitative analysis, prediction strategies, management of uncertainties, data presentation and tracking, model verification and validation, critical successes factors and performance design principles. SPE coined by Smith consists of two models called software execution model and system execution model. The software execution model is represented by the Execution Graph (EG). The data required for performance prediction are annotated in the execution graph. Solving the software execution model provides the data required for the machine model (system execution model) [7].
In this paper, we are proposing a methodology to quantify the cooperation among the agents in MAS with the help of execution graph by considering the cooperative characteristics of agents at the early stages of Software Development Life Cycle (SDLC). The remaining part of the paper is organized as follows: Section 2 presents a brief related work in the area of cooperation in MAS and SPE; the methodology for calculating Co-operative index using execution graph is explained in section 3; the proposed methodology is illustrated with a case study in section 4; the conclusion and future work are discussed in Section 5.
2 Related Work
Nicholos R Jennings, Katia Sycara and Michael Wooldridge discussed an overview of research and development activities in the field of autonomous agents and multi-agent systems in [19]. They aim to identify key concepts and applications, and to indicate how they relate to one-another. In their paper, some historical context to the field of agent-based computing is given, contemporary research directions are presented and a range of open issues and future challenges are highlighted. Agent cooperation is one of the well studied areas of MAS. Many classic theories are applied in the research of cooperation: logic theory, game and economic theory and Petri-net etc. A series of cooperation models are put forward based on these theories [10] [14] [18] [20]. As cooperation has attracted so many researchers, the current state of the art is captured in [4]. A cooperative game theory (CGT) for coalition formation in multi-agent systems is proposed in [3], where a novel model for the cooperative game has been used. The implementation of cooperation is enforced in terms of coalition formation and algorithms for their formation are discussed. A metric suite for the communication of MAS is suggested and a demonstration is provided to prove that a well balanced communication is related to high levels of Quality of Service measured

Modeling and Estimation of Cooperative Index for Multi-Agent Systems 43
by response times in [13]. Software Performance Engineering (SPE) has evolved over the past years and has been demonstrated to be effective during the development of many large systems [8]. The extensions to SPE process and its associated models for assessing distributed object-systems are discussed in [6]. [3] Describes the use of SPE-ED, a performance-modeling tool that supports SPE process, for early life cycle performance evaluation of object–oriented systems. The transformation of Unified Modeling Language (UML) models into execution graphs and predicting the performance at the early stages of the software system is illustrated with a case study in [9]. Software performance engineering (SPE) has been established as a strong area of research in software engineering. Huge literature is available on SPE for distributed systems. A very little amount of research is carried out to assess the performance for MAS in the early stages of SDLC. Cooperative index can be used in the assessment of software performance [1]. Sequence diagram is used as a model to calculate the cooperative index in [1]. Various representations are used for modeling performance characteristics of software systems in the literature. However, initially, most of the researchers have used execution graph as the performance model for assessing the performance in the early stages of the software development. Hence, we propose to use the execution graph as the performance model to quantify the cooperative index between the agents. In this paper, a methodology is proposed to augment the communication between the agents in the execution graph and to compute the cooperative index from the execution graph.
3 Proposed Methodology
Cooperation between agents is defined as how effectively agents respond to the request of its neighbor agent. We have modeled the scenario of cooperation of agents with its neighbor by message passing. We have defined a term called Cooperative Index (CI) which quantifies the cooperation between the agents by considering the number of messages an agent received from the neighbor, the number of messages forwarded by the agent to the neighbor, the total number of messages generated by the agent for accomplishing its own task and the number of messages sent out of the total number of messages generated to accomplish the agents own task. We have formulated this model by considering the models developed in [21]. In the proposed methodology, the annotated Execution Graph is used to predict the Cooperative Index of agents in MAS. An execution graph is a graph, whose nodes represent one (or more than one) sets of actions (actors) and edges represent control transfer between them. According to [8], an EG node can be of basic node, expanded node, repetition node, case node, pardo node and split node. Each node is weighted by the demand-vector representing the resource usage by the node. We have devised a vector called as communication vector which is represented by 4-tuple to represent the message passing type between the agents. The 4-tuple is of the form (F, R, Sr, Sp) where “F” represents the number of messages forwarded by an agent to another agent, “R” represents the number of messages received by an agent, “Sr” represents the number of messages send by an agent to other agents for its own work to be processed, “Sp”

44 S. Ajitha et al.
represents the messages for its self process. Depending upon the type of the request, values are assigned to the 4-tuple. If there is no action for any of the element in the 4-tuple a value “0” is assigned for the corresponding element, otherwise the name of the agent involved in that action is assigned to the corresponding element. A sample 4-tuple vector is given below:
RU (U, A1, A1, A1) “RU” Request from User “U “ The message was forwarded by user “A1” A1 (agent) received a message for activity RU “A1” A1 (agent) generated a message for its own process and send to other agent “A1” A1 (agent) has self process.
We propose an algorithm to model the software specification with execution graph and annotate with communication vector.
4 Numerical Results
The MAS we have considered is based on supply chain management (SCM) systems [17]. Agents are autonomous and can operate in open electronic environments that are now becoming very popular which is the case with SCM. The proposed MAS include five agents namely Manager Agent (MA), Production Agent (PA), Inventory Agent (IA), Supply Agent (SA) and Delivery agent (DA) in a Supply Chain Management (SCM) system. While following their own goals, the agents work in cooperation in order to achieve the common ultimate goal to maximize the overall profit.
while (Agent exists) loop Initialize the elements of the 4-tuple {F = 0; R = 0; Sr = 0; Sp = 0} Get all Execution Graph while (Execution Graph Exits) loop do (for all the nodes in the Execution Graph) if (the value of the element in the 4-tuple is matched with agent)
then increment the corresponding element count by 1
endif enddo endwhile

Modeling and Estimation of Cooperative Index for Multi-Agent Systems 45
Fig. 1. Execution Graph with communication vector
Fig. 2. Execution graph for Case Study
Fig. 3. Execution Graph for Production Agent Fig. 4. Execution Graph for Manager Agent Fig 1 represents a general model for execution graph with the communication
vector for the agents in MAS. Fig 2 represents the execution graph in the high level view for the SCM system. Fig 3 represents the execution graph for the particular agent Manager and Fig 4 represents the execution graph for the production agent for a request from the user. Similarly we can construct the execution graph for other agents also. From the execution graph, the Co-operative index of each agent is calculated with the help of the equation 1.
Co (i) = Ru * Wai + (1- Ru)* Gai (1)
Wa w i if Sa Fa 00 otherwise where w i ∑ F R∈NS F
Ga g i if ∑ Ta∈N 00 otherwise where g i ∑ S∈N∑ T∈N
RP(U,MA,0,0) PS(MA,PA,0,0)
S(0,0,0,MA)
S(0,0,0,MA)
DP(PA,MA,0,0)
RS(0,0,MA,0)
PU(MA,U,0,0)
A(0,R1,0,0)
B(A2,0,0,A1)
L(F,R,Sr,Sp)
K(F,R,Sr,Sp)
X(F,R,Sr,Sp)
Q(F,R,Sr,Sp)P(F,R,Sr,Sp)
A2(F,R,Sr,Sp)
M(F,R,Sr,Sp) A1(F,R,Sr,Sp)
N(F,R,Sr,Sp)
Basic Node
Alternate Node
<<DA>>
<<SA>>
<<IA>>
<<PA>>
<<MA>> Expanded Node
PS(MA,PA,0,0) RC(PA,IA,0,0)
S(0,0,0,PA)
RS(0,0,PA,0)
RP(0,0,IA,0)
SC(IA,PA,0,0)
Parallel Node
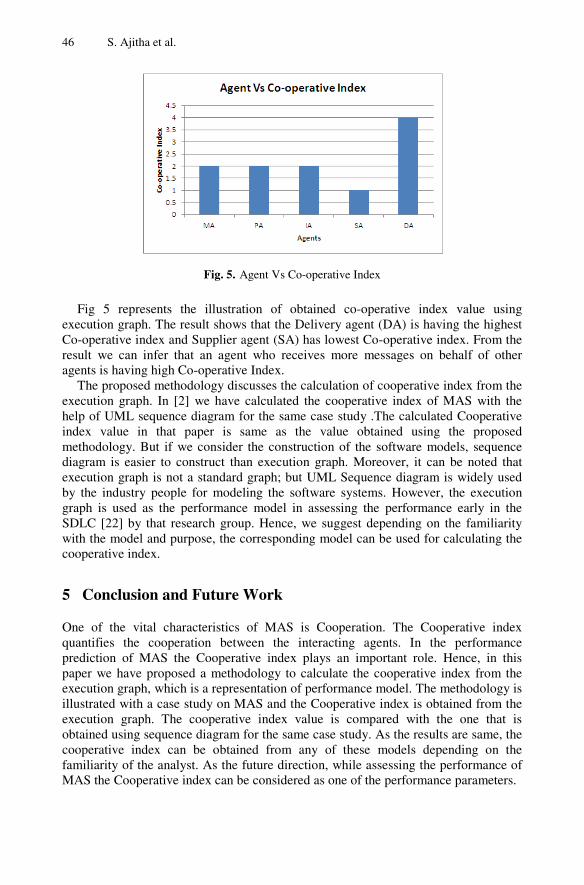
46 S. Ajitha et al.
Fig. 5. Agent Vs Co-operative Index
Fig 5 represents the illustration of obtained co-operative index value using execution graph. The result shows that the Delivery agent (DA) is having the highest Co-operative index and Supplier agent (SA) has lowest Co-operative index. From the result we can infer that an agent who receives more messages on behalf of other agents is having high Co-operative Index.
The proposed methodology discusses the calculation of cooperative index from the execution graph. In [2] we have calculated the cooperative index of MAS with the help of UML sequence diagram for the same case study .The calculated Cooperative index value in that paper is same as the value obtained using the proposed methodology. But if we consider the construction of the software models, sequence diagram is easier to construct than execution graph. Moreover, it can be noted that execution graph is not a standard graph; but UML Sequence diagram is widely used by the industry people for modeling the software systems. However, the execution graph is used as the performance model in assessing the performance early in the SDLC [22] by that research group. Hence, we suggest depending on the familiarity with the model and purpose, the corresponding model can be used for calculating the cooperative index.
5 Conclusion and Future Work
One of the vital characteristics of MAS is Cooperation. The Cooperative index quantifies the cooperation between the interacting agents. In the performance prediction of MAS the Cooperative index plays an important role. Hence, in this paper we have proposed a methodology to calculate the cooperative index from the execution graph, which is a representation of performance model. The methodology is illustrated with a case study on MAS and the Cooperative index is obtained from the execution graph. The cooperative index value is compared with the one that is obtained using sequence diagram for the same case study. As the results are same, the cooperative index can be obtained from any of these models depending on the familiarity of the analyst. As the future direction, while assessing the performance of MAS the Cooperative index can be considered as one of the performance parameters.

Modeling and Estimation of Cooperative Index for Multi-Agent Systems 47
References
1. Ajitha, S., Suresh Kumar, T.V., Geetha, D.E., Rajanikanth, K.: Early Performance Prediction of Co-operative Multi-Agent Systems. In: International Conference on Modeling Optimization and Computing, April 9-10. Elsevier Publications (2012)
2. Ajitha, S., Suresh Kumar, T.V., Rajanikanth, K.: A Quantitative Frame Work For Early Prediction of Cooperation in Multi agent systems. Technical Report, Department of MCA, MSRIT (2011)
3. Adel, G., Habib, R., Reza, M.: A Novel Algorithm for Coalition Formation in Multi-agent Systems using Cooperative Game Theory. In: Proceedings of the ICEE, May 11-13, IEEE (2010), doi:978-1-4244-6760-0
4. Abdellah, B., Ranjeev, M., Boukhtouta, A., Berger, J.: Distributed Intelligent Systems. Spring US, US (2009)
5. Smith, C.U., Williams, L.G.: Performance Engineering Evaluation of Object Oriented Systems with SPE-ED. In: Marie, R., Plateau, B., Calzarossa, M.C., Rubino, G.J. (eds.) TOOLS 1997. LNCS, vol. 1245, pp. 135–153. Springer, Heidelberg (1997)
6. Smith, C.U., Williams, L.G.: Performance Engineering Models of CORBA-based distributed-object systems. Performance Engineering Services and Software Engineering Research (1998)
7. Smith, C.U.: Performance Engineering of Software Systems. Addison-Wesley, Reading (1990)
8. Smith, C.U., Williams, L.G.: Performance Solutions: A Practical Guide to Creating Responsive, Scalable Software. Addison-Wesley, Boston (2002)
9. Geetha, D.E., Reddy, R.M., Suresh Kumar, T.V., Rajanikanth, K.: Performance Modelling and Evaluation of e-commerce Systems Using UML 2.0. In: Eighth ACIS International Conference on Software Engineering, Artificial Intelligence, Networking and Parallel/Distributed Computing (2007)
10. Hashel, E.A.: A Conceptual agent Cooperation Model for Multi-agent Systems’ Team Formation Process. In: Third 2008 International Conference on Convergence and Hybrid Information Technology, pp. 12–20 (2008)
11. Giunchiglia, F., Mylopoulos, J., Perini, A.: The Tropos software development methodology: Processes, Models and Diagrams. In: Third International Workshop on Agent-oriented Software Engineering (July 2002)
12. Caire, G., Leal, F., Chainho, P., Evans, R., Garijo, F., Gomez, J., Pavon, J., Kearney, P., Stark, J., Massonet, P.: Agent oriented analysis using MESSAGE/UML
13. Gutierrez, C., Garcia, M.I.: A Metric Suite for the Communication of Multi-agent Systems. J. Phys. Agents 3(2), 7–15 (2009)
14. Kotb, Y.T., Beauchemin, S.S., Barron, J.L.: Petri Net-Based Cooperation in Multi-Agent Systems. In: Fourth Canadian Conference on Computer and Robot Vision (2007)
15. Padgham, L., Winikoff, M.: Prometheus: A methodology for developing intelligent agents. In: Third International Workshop on Agent-Oriented Software Engineering (July 2002)
16. Wooldridge, M.J., Weiß, G., Ciancarini, P. (eds.): AOSE 2001. LNCS, vol. 2222, pp. 101–108. Springer, Heidelberg (2002)
17. Moyaux, T., Chaib-draa, B., D’Amours, S.: Multiagent based Supply Chain Management. Springer, Heidelberg (2006)
18. Michael, W., Nicholas, R.J.: The Cooperative Problem-Solving Process. Journal of Logic and Computation 9(4), 563–592 (1999)
19. Nicholas, R.J., Katia, S., Michael, W.: A Roadmap of Agent Research and Development. Autonomous Agents and Multi-agent Systems 1(1), 7–38 (1998)

48 S. Ajitha et al.
20. Semsar-Kazerooni, E., Khorasani, K.: A Game Theory Approach to Multi-Agent Team Cooperation. In: American Control Conference, USA, pp. 4512–4518 (June 2009)
21. Urpi, A., Bonucceli, M., Giordano, S.: Modelling Cooperation in Mobile Adhoc Networks:a Formal Description of Selfishness. In: Proceedings of the WiOpt 2003 (2003)
22. http://www.pergeng.com
Aswatha Kumar M. et al. (Eds.): Proceedings of ICAdC, AISC 174, pp. 49–55. springerlink.com © Springer India 2013
QoS Multicast Routing Using Teaching Learning Based Optimization
Anima Naik1, K. Parvathi2, Suresh Chandra Satapathy3, Ramanuja Nayak1, and B.S. Panda1
1 MITS, Rayagada, India {animanaik,ramanuja.nayak}@gmail.com
[email protected] 2 CUTM, Paralakhemundi
[email protected] 3 ANITS, Vishakapatnam
Abstract. The QoS multicast routing problem is to find a multicast routing tree with minimal cost that can satisfy constraints such as bandwidth, delay. This problem is NP Complete. Hence, the problem is usually solved by heuristic or intelligence optimization. In this paper, we present a Teaching learning based optimization method to optimize the multicast tree. A fitness function is used to implement the constraints specified by the Quality of Service conditions. The experimental results dealt with relations between the number of nodes, edges in the input graph and convergence time, the optimal solution quality comparison with other evolutionary techniques. The results reveal that our algorithm performs better than the existing algorithms.
Keywords: Multicast, QoS, routing, teaching learning based optimization, fitness function.
1 Introduction
The rapid development in network multimedia technology enables more and more real-time multimedia services such as video conferencing, on-line games, distance education etc. to become mainstream internet activities. These services often require the network to provide multicast capabilities. Multicast refers to the delivery of packets from a single source to multiple destinations. The central problem of QoS routing is to set up a multicast tree that can satisfy certain QoS parameters. However, the problem of constructing a multicast tree under multiple constraints is NP-Complete [1]. Hence, the problem is usually solved by heuristic or intelligence optimization.
In QoS multicast routing, each node or link has some parameters associated with it. These parameters are used to determine the most efficient path from the source to the destinations. Thus, these network resources must be handled and shared in such a way that the most optimal solution can be obtained for the QoS multicast routing problem with minimal cost. This cost is determined by the parameter values associated with

50 A. Naik et al.
each link which may be present in a chosen path from a source to a destination. Genetic Algorithms(GA) and Ant Colony Optimization(ACO)[2] have also been used to solve this problem. Particle Swarm Optimization(PSO)[3][4] technique is applied to solve the QoS multicast routing. Besides this other algorithm based on quantum mechanics named as Quantum-Behaved Particle Swarm Optimization (QPSO) was proposed [5]. Later on PSO along with Genetic Algorithm (GA) was introduced which become hybrid genetic algorithm and particle swarm Optimization (HGAPSO) [6] to solve multicast QoS routing. A tree based PSO has been proposed in [7] for optimizing the multicast tree directly. However, the performance depends on the number of particles generated. Another drawback of the algorithm is merging the multicast trees, eliminating directed circles and nested directed circles are very complex. In this paper we have use Teaching Learning based Optimization techniques for optimization of QoS multicast routing problems.
The TLBO method is based on the philosophy of teaching learning processes effect of the influence of a teacher on the output of learners in a class. Here, output is considered in terms of results or grades. The teacher is generally considered as a highly learned person who shares his or her knowledge with the learners. The quality of a teacher affects the outcome of the learners. It is obvious that a good teacher trains learners such that they can have better results in terms of their marks or grades. We have used this concept of algorithm for optimization of QoS multicast routing problems.
The rest of this paper is structured as follows. Section 2 discusses the Multicast Routing problem formulation in computer network. Section 3 presents the Concepts of Teaching learning based Optimization technique. Section 4 presents the TLBO algorithm for multicast routing. Section 5 details the experimentation carried out and presents the discovered results. The paper concludes with a discussion on the observations.
2 Multicast Routing Problem Formulation
A QoS multicast routing problem is usually involved in several constraints. In this paper, we simplify the QoS constraints and mainly focus on the band-width-delay constrained least cost multicast routing problem.
Communication network can be modeled as an undirected graph , , where is the set of all nodes representing routers or switches, is the set of all edges representing physical or logical connection between nodes. Each link , ∈ in has three weights , , , , , associated with it, in which positive real values , , , , , denote the available bandwidth, the delay and the cost of the link respectively. Given a path , connected any two nodes x, y in G, it can be presumed that:
The delay of a path is the sum of the delays of the links , :
, ∑ ,, ∈ , (1)
The available bandwidth of , is considered as the bottle neck bandwidth of , :

QoS Multicast Routing Using Teaching Learning Based Optimization 51
, min ,, ∈ , (2)
In QoS transmission of real time multimedia service, the optimal cost routing problem with delay and bandwidth constrained can be described as follows: Given , , a source node , and a multicast member set ⊆ , the problem is to find the multicast tree , from source s to all destinations ∈ , where ⊆ , and must satisfy the following conditions:
min ∑ ,, ∈ (3)
∑ , ∀, ∈ , ∈ (4)
, , ∀ ∈ (5)
Where , is the set of links in the path from source nodes to destination in the multicast tree. Relation (3) means that the cost of multicast routing tree should be minimum. Relation (4) means that the delay requirement of QoS, in which is the permitted maximum delay value of real time services. And relation (5) guarantees the bandwidth of communication traffic, in which is the required minimum bandwidth of all applications.
3 Teaching Learning Based Optimization
This optimization method is based on the effect of the influence of a teacher on the output of learners in a class. Like other nature-inspired algorithms, TLBO [11] is also a population based method that uses a population of solutions to proceed to the global solution. A group of learners are considered as the population. In TLBO, different subjects offered to learners are considered as different design variables for the TLBO. The learning results of a learner is analogous to the ‘fitness’, as in other population-based optimization techniques. The teacher is considered as the best solution obtained so far.
There are two parts in TLBO: ‘Teacher Phase’ and ‘Learner Phase’. The ‘Teacher Phase’ means learning from the teacher and the ‘Learner Phase’ means learning through the interaction between learners.
3.1 Teacher Phase
In our society the best learner is mimicked as a teacher. The teacher tries to disseminate knowledge among learners, which will in turn increase the knowledge level of the whole class and help learners to get good marks or grades. So a teacher increases the mean learning value of the class according to his or her capability i.e. say the teacher will try to move mean towards their own level according to his or her capability, thereby increasing the learners’ level to a new mean . Teacher will put maximum effort into teaching his or her students, but students will gain knowledge according to the quality of teaching delivered by a teacher and the quality

52 A. Naik et al.
of students present in the class. The quality of the students is judged from the mean value of the population. Teacher puts effort in so as to increase the quality of the students from to , at which stage the students require a new teacher, of superior quality than themselves, i.e. in this case the new teacher is .
Let be the mean and be the teacher at any iteration . will try to move mean towards its own level, so now the new mean will be designated as . The
solution is updated according to the difference between the existing and the new mean given by
_ = (6)
where is a teaching factor that decides the value of mean to be changed, and is a random number in the range [0, 1]. The value of can be either 1 or 2, which is again a heuristic step and decided randomly with equal probability as
= 1 0,1 2 1 (7)
This difference modifies the existing solution according to the following expression
, , _ (8)
3.2 Learner Phase
Learners increase their knowledge by two different means: one through input from the teacher and the other through interaction between themselves. A learner interacts randomly with other learners with the help of group discussions, presentations, formal communications, etc. A learner learns something new if the other learner has more knowledge than him or her. Learner modification is expressed as
1: Randomly select two learners and , where , = , + ( − ) , = , + ( − ) Accept if it gives a better function value.
4 The TLBO Algorithm for Multicast Routing
The TLBO-based algorithm for solving multicast routing are overviewed as follows. The process is initialized with a group of random learners (solutions). Then determine the best teacher among the learners which have the best fitness value. Subsequently in each time interval learners improved based upon teacher and themselves.
Initialization of individuals
To apply the TLBO method for multicast routing problems, we use the “individual” to replace the “learner”. In the initialization process, a set of individuals is created at random. Individual ’ position at iteration 0 can be represented as the vector

QoS Multicast Routing Using Teaching Learning Based Optimization 53
0 0 , 0 , … … … , 0 (9)
where is the number of network nodes of individual corresponds to the generation update quantity covering all network nodes.
Before starting the TLBO algorithm, we can remove all the links, which their bandwidth are less than the minimum of all required thresholds . If in the refined graph, the source node and all the destination nodes are not in a connected sub-graph, this topology does not meet the bandwidth constraint. In this case, the source should negotiate with the related application to relax the bandwidth bound. On the other hand, if the source node and all the destination nodes are in a connected sub-graph, we will use this sub-graph as the network topology in our TLBO algorithm.
Evaluation Function Definition
We defined the evaluation function f given in Equation (10) as the evaluation value of each individual in population. The evaluation function f is a reciprocal of the performance criterion in Equation (3).It implies the smaller the value of individual T, the higher its evaluation value.
∏ ∈ ∏ ∈∑ ∈ (10)
, (11)
1, ,, , . (12)
Where is the penalty function, and the value of the 0.5 in the paper.
5 Experimental Results
We have performed simulation to investigate the performances of multicast routing algorithms based on TLBO algorithm. The source and the destination are randomly generated. The bandwidth and delay of each link are uniformly distributed in range [10,50] and [0,50ms] respectively. The cost of each link is uniformly distributed in range [0,200].
To analyze the performance of the proposed algorithm, different sets of input were generated and the algorithm was tested for varying number of nodes and edges. In Table 1, we have compared the running times between genetic algorithm (GA), immune algorithm(IA), ant colony algorithm (ACO), Particle Swarm Optimization (PSO) and (Teaching learning based Optimization)TLBO algorithm for different combinations of node and edge.

54 A. Naik et al.
Table 1. Comparison of running time (in s)
Nodes Edges TLBO PSO ACO IA GA 20 32 0.08 0.21 0.27 0.35 0.48 40 89 0.19 0.38 0.45 0.51 0.63 80 172 0.80 1.36 1.42 1.48 1.59 120 239 1.32 1.97 2.68 3.12 3.16 160 336 3.46 4.18 5.37 5.82 7.72 180 371 5.12 6.46 8.19 8.93 9.85 200 427 6.89 8.36 9.73 10.26 11.25
Fig. 1. Convergence behavior
Table 2. The optimal solution quality comparison
Algorithm Optimal Sub-optimal Invalid TLBO 89.4% 9.7% 0.9% PSO 81.2% 17.5% 1.3% GA 78.4% 19.4% 2.2% IA 78.9% 19.6% 1.5% ACO 79.9% 18.2% 1.9%
Table 1 results clearly show that the running time of TLBO algorithm grows very
slowly with the size of the network and the running times of TLBO is smaller than GA’s ,IA’s and ACO’s and PSO’s . This behavior has been shown in the Fig. 1. Therefore, the proposed TLBO algorithm is very effective. Furthermore, for the same multicast routing, we made 300 simulations by TLBO algorithm against GA[8],immune algorithm(IA)[9], ACO algorithm [10] and PSO algorithm. The computation results are shown in Table 2.We can find that TLBO algorithm performances better than GA, IA, ACO, PSO. So our proposed PSO algorithm has good performance.
20 40 60 80 100 120 140 160 180 2000
2
4
6
8
10
12
No. of nodes
Run
ning
tim
e in
s
Comparision of running Time
PSO
TLBO
ACOIA
GA

QoS Multicast Routing Using Teaching Learning Based Optimization 55
6 Conclusion
Multicast routing problem arises in many multimedia communication applications, computing the band-width-delay constrained least-cost multicast routing tree is a NP-complete problem. In this paper, a novel multicast routing algorithm based on the TLBO algorithms is proposed. The experimental results show that this algorithm has better performance and efficiency.
References
[1] Wang, Z., Crowcroft, J.: Quality of service for supporting multimedia application. IEEE Journal on Selected Areas in Communication 14, 1228–1234 (1996)
[2] Lhotská, L., Macaš, M., Burša, M.: PSO and ACO in Optimization Problems. In: Corchado, E., Yin, H., Botti, V., Fyfe, C. (eds.) IDEAL 2006. LNCS, vol. 4224, pp. 1390–1398. Springer, Heidelberg (2006)
[3] Kennedy, J., Eberhart, R.C.: Particle Swarm Optimization. In: Proceeding of the IEEE International Conference Neural Networks, pp. 1942–1948 (1995)
[4] Jin, X., Bai, L., Ji, Y., Sun, Y.: Probability Convergence based Particle Swarm Optimization for Multiple Constrained QoS Multicast Routing. Proceeding of the IEEE, 412–415 (2008)
[5] Sun, J., Liu, J., Xu, W.-b.: QPSO-Based QoS Multicast Routing Algorithm. In: Wang, T.-D., Li, X., Chen, S.-H., Wang, X., Abbass, H.A., Iba, H., Chen, G.-L., Yao, X. (eds.) SEAL 2006. LNCS, vol. 4247, pp. 261–268. Springer, Heidelberg (2006)
[6] Li, C., Cao, C., Li, Y., Yu, Y.: Hybrid of genetic algorithm and particle swarm optimization for multicast QoS routing. In: IEEE International Conference on Control and Automation, pp. 2355–2359 (2007)
[7] Wang, H., Meng, X., Li, S., Xu, H.: A tree-based particle swarm optimization for Multicast routing. Computer Networks 54, 2775–2786 (2010)
[8] Wang, Z., Shi, B.: Solution to Qos multicast routing problem based on heuristic genetic algorithm. Journal of Computer, China Computer Federation, 55–61 (January 2001)
[9] Liu, F., Feng, X.J.: Immune algorithm for multicast routing. Chinese Journal of Computer, 676–681 (June 2003)
[10] Carrillo, L., Marzo, J.-L., Fabrega, L., Vila, P., Guadall, C.: Ant colony behaviour as routing mechanism to provide quality of service. LNCS, pp. 418–419. Springer, Berlin (2004)
[11] Wang, Z., Sun, X., Zhang, D.: A PSO-Based Multicast Routing Algorithm. In: Third International Conference on Natural Computation, ICNC 2007 (2007), doi: 0-7695-2875-9/07 $25.00 © 2007
[12] Rao, R.V., Savsani, V.J., Vakharia, D.P.: Teaching–learning-based optimization: A novelmethod for constrained mechanical design optimization problems. Computer-Aided Design 43, 303–315 (2011)
[13] Satapathy, S.C., Naik, A.: Data Clustering Based on Teaching-Learning-Based Optimization. In: Panigrahi, B.K., Suganthan, P.N., Das, S., Satapathy, S.C. (eds.) SEMCCO 2011, Part II. LNCS, vol. 7077, pp. 148–156. Springer, Heidelberg (2011)

Aswatha Kumar M. et al. (Eds.): Proceedings of ICAdC, AISC 174, pp. 57–62. springerlink.com © Springer India 2013
A New Privacy Preserving Measure: p-Sensitive, t-Closeness
Sowmyarani C.N.1, G.N. Srinivasan2, and Sukanya K.1
1 Department of Computer Science and Engineering, MSRIT, Bangalore
2 Department of Information Science and Engineering, RVCE, Bangalore
[email protected], [email protected], [email protected]
Abstract. Preserving a sensitive data has become a great challenge in the area of research under data privacy. There are popular approaches such as k-anonymity, t-closeness [1] and l-diversity which are effective measures for preserving privacy. These techniques lead to solving many of the privacy issues. But all these measures suffer from one or the other types of attacks. To minimize these attacks, a new measure called p-sensitive, t-closeness is introduced. This measure will preserve the sensitive data by distributing different values of sensitive attribute according to t-closeness approach by introducing p-sensitivity, by minimizing attacks and improving the efficiency and utility of the data. This technique is termed as p-sensitive, t-closeness which satisfy p-sensitivity and t-closeness for a table by relaxing the threshold value t, so that; it will satisfy the p sensitivity to overcome many of limitations of previous approaches.
Keywords: k-anonymity, t-closeness, p-sensitivity, p-sensitive, t-closeness.
1 Introduction
There are popular approaches to preserve privacy[5] in the field of data privacy. But, many of the techniques have their own limitations. The proposed technique is p-sensitive, t-closeness, will overcome many of limitations of other popular techniques such as k-anonymity [2] and t-closeness. Our technique will overcome skewness attack and similarity attack, since there is sensitivity concept applied on t-closeness. This would be a great advantage to preserve sensitive attribute values. There is a need of better techniques which will overcome many types of attacks from which the present techniques are suffering and increase the utility of data. Increase in utility of data [4] is very important to achieve which prevents information loss, as researchers need the data to utilize for the analysis or different purpose in the field of research. P-sensitive, t-closeness will overcome limitations of many of techniques and minimize the data loss. It satisfies the condition for table in which the minimum p number of distinct values will be there for sensitive attribute under the specific threshold value t.

58 C.N. Sowmyarani, G.N. Srinivasan, and K. Sukanya
2 Proposed Approach
The new measure states that, the table which satisfies t-closeness should also satisfies p-sensitivity. The records of table are distributed in such a way that, it should satisfy the p-sensitive property and threshold level should not go beyond relaxation limit trelax. The threshold t can be relaxed up to t relax under which it satisfies the p-sensitivity. In such a way that, utility of data should not decrease and correlation among the Qi group.
Definition1. Quasi-identifier [2] (Qi): Qi is a set of attributes in a table, which cannot identify individual by itself, but can identify individual by linking with external table.
Definition2. (k-anonymity property): The k-anonymity property for a anonymized data is satisfied if every combination of key attribute values in anonymized data occurs k or more times.
Definition3. (p-sensitive, k-anonymity property ): The anonymized data satisfies p-sensitive k-anonymity property [3] if it satisfies k-anonymity, and for tuples in each Qi with the identical combination of key attribute values that exists in anonymized data, the number of distinct values for each sensitive attribute occurs at least p times within the same group.
Definition4. (p-sensitive, t-closeness): The table T satisfies p-sensitive, t-closeness property, if it satisfies t-closeness with the threshold value ranging from t to trelax, and each Qi-group has at least p distinct categories of the sensitive attribute.
3 P-Sensitive, t-Closeness
The table1 shows the original data which can have 4 records in one equivalence class.
Table 1. Original data
Zip_code Age Salary Disease 47977 21 360000 Heart Attack 47901 57 430000 Heart Attack 47982 47 380000 Diabetes 47904 45 590000 Diabetes 47609 34 143000 Brain Tumour 47605 21 600000 Bladder Cancer 47654 23 360000 Brain Tumour 47609 30 650000 Brain Tumour 47604 10 230000 Flu 47602 45 230000 Gastritis 47678 50 160000 Neck Pain 47903 21 467000 Neck Pain
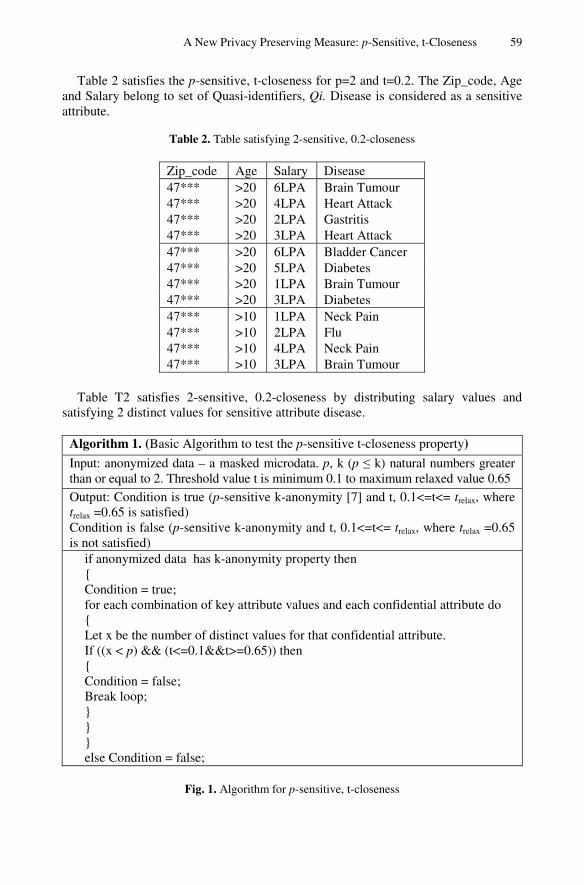
A New Privacy Preserving Measure: p-Sensitive, t-Closeness 59
Table 2 satisfies the p-sensitive, t-closeness for p=2 and t=0.2. The Zip_code, Age and Salary belong to set of Quasi-identifiers, Qi. Disease is considered as a sensitive attribute.
Table 2. Table satisfying 2-sensitive, 0.2-closeness
Zip_code Age Salary Disease 47*** >20 6LPA Brain Tumour 47*** >20 4LPA Heart Attack 47*** >20 2LPA Gastritis 47*** >20 3LPA Heart Attack 47*** >20 6LPA Bladder Cancer 47*** >20 5LPA Diabetes 47*** >20 1LPA Brain Tumour 47*** >20 3LPA Diabetes 47*** >10 1LPA Neck Pain 47*** >10 2LPA Flu 47*** >10 4LPA Neck Pain 47*** >10 3LPA Brain Tumour
Table T2 satisfies 2-sensitive, 0.2-closeness by distributing salary values and
satisfying 2 distinct values for sensitive attribute disease.
Algorithm 1. (Basic Algorithm to test the p-sensitive t-closeness property)
Input: anonymized data – a masked microdata. p, k (p ≤ k) natural numbers greater than or equal to 2. Threshold value t is minimum 0.1 to maximum relaxed value 0.65
Output: Condition is true (p-sensitive k-anonymity [7] and t, 0.1<=t<= trelax, where trelax =0.65 is satisfied) Condition is false (p-sensitive k-anonymity and t, 0.1<=t<= trelax, where trelax =0.65 is not satisfied)
if anonymized data has k-anonymity property then { Condition = true; for each combination of key attribute values and each confidential attribute do { Let x be the number of distinct values for that confidential attribute. If ((x < p) && (t<=0.1&&t>=0.65)) then { Condition = false; Break loop; } } } else Condition = false;
Fig. 1. Algorithm for p-sensitive, t-closeness

60 C.N. Sowmyarani, G.N. Srinivasan, and K. Sukanya
The main concept behind this technique is to combine the advantages of t-closeness and p-sensitive, k-anonymity. So that, it will overcome the skewness attack [4] and similarity attack [4] without losing the correlation among Qi attributes. The algorithm in figure1 tests that, if the table satisfies the p-sensitive, t-closeness, then it should satisfy the t-closeness and p-sensitive, k-anonymity for threshold value range between t to trelax.
The quasi-identifier attribute values are generalized and suppressed within the same equivalence class to anonymize the data. In Table 2, the first equivalence class, the values of the sensitive attribute disease is having more than 2 distinct values satisfying 2-sensitivity as value of p>=2. There is always trade-off between the utility and threshold value. As the threshold value decreases, utility will also decreases.
As the t value relaxed to higher levels, utility will increase. But at the same level, the privacy [6] should also be preserved.
4 Experimental Set-Up and Results
A set of experiments were conducted for an test data consisting of 10000 tuples randomly selected from the Adult dataset from the UC Irvine Machine Learning Repository [10]. In all the experiments, we considered age, education_num, work class and sex as the set of quasi-identifier attributes; and occupation as the sensitive attribute. Micro data p-sensitive t-closeness was enforced in respect to the quasi-identifier consisting of all 6 quasi-identifier attributes and 1 occupation sensitive attribute. Although many values of k and p were considered, due to space limitations, we present in this paper only a small subset of the results.
Fig. 2. Time efficiency for different to (p,k) values in terms of seconds

A New Privacy Preserving Measure: p-Sensitive, t-Closeness 61
Figure 2 shows the resulting values for t value ranging from 0.45 to 0.65. Data sample is randomly chosen as 10000 tuples from adult dataset.
5 Comparison
Table 3. Comparison of privacy models v/s attack models
Privacy Models
Attack Models
Attribute disclosure
Skewness attack
Membership disclosure attack
Similarity attack
Data utility loss
k-anonymity
p-Sensitive, k-anonymity
t-closeness
Table 3 shows comparison of privacy models with respect to their attacks. K-anonymity fails to protect attribute disclosure [4]. p-sensitive, k-anonymity undergoes membership disclosure and t-closeness will include data utility loss. Our approach is compared with other privacy models such as, k-anonymity, p-Sensitive k-anonymity, and t-closeness. The results shows there are no attacks and the data quality is improved by relaxing the threshold level up to trelax. to improve the data quality.
6 Conclusion
In this paper, the anonymization [8] is done using generalization [8] and suppression method. Most of the popular techniques will employ these methods. But, generalization and suppression will cause the numerical attributes generalizes to become categorical which is one of the disadvantage. The closeness cause the records distributed evenly throughout the table by impairing correlation between quasi-identifiers and sensitive attributes [9] by preserving privacy. The open challenge for many of the popular techniques such as, k-anonymity, t-closeness is, there is no specific computational approach to reach them for a specific data to be anonymized. The combined feature of applying p-sensitivity and threshold for achieving closeness, causes overcoming the skewness attack and similarity attack which will be an added advantage. The further work will be extending the concept of sensitivity to notice the trade-off between threshold and sensitivity in detail.
62 C.N. Sowmyarani, G.N. Srinivasan, and K. Sukanya
References
[1] Li, N., Li, T., Venkatasubramanian, S.: Closeness: A New Privacy Measure for Data Publishing. IEEE Trans. Knowl. Data Eng. 22(7), 943–956 (2010)
[2] Sweeney, L.: k-anonymity: a model for protecting privacy. International Journal on Uncertainty, Fuzziness and Knowledge based Systems, 557–570 (2002)
[3] Truta, T.M., Vinay, B.: Privacy protection: p-Sensitive k-anonymity property. In: Proceedings of the 22nd on Data Engineering Workshops. IEEE Computer Society, Washington, DC (2006)
[4] Domingo-Ferrer, J., Torra, V.: A Critique of k-Anonymity and Some of Its Enhancements, pp. 990–993 (2008)
[5] Agrawal, R., Srikant, R.: Privacy-preserving data mining. In: Proc. SIGMOD 2000, pp. 439–450 (2000)
[6] Verykios, V.S., Bertino, E., Fovino, I.N., Provenza, L.P., Saygin, Y., Theodoridis, Y.: State-of-the-art in privacy preserving dat mining. In: Proc. of ACM SIGMOD, pp. 50–57 (2004)
[7] Truta, T.M., Vinay, B.: Privacy protection: p-sensitive k-anonymity property. In: 2nd International Workshop on Privacy Data Management PDM 2006, p. 94. IEEE Computer Society, Berlin (2006)
[8] Vijayarani, S., Tamilarasi, A., Sampoorna, M.: Analysis of Privacy Preserving K-Anonymity Methods and Techniques. In: Proceedings of the International Conference on Communication and Computational Intelligence 2010, Kongu Engineering College, Perundurai, Erode, T.N.,India, December 27-29, pp. 540–545 (2010)
[9] Wu, Y., Ruan, X., Liao, S., Wang, X.: P-Cover K-anonymity model for Protecting Multiple Sensitive Attributes. In: The 5th International Conference on Computer Science & Education, Hefei, China, August 24-27 (2010)
[10] Newman, D.J., Hettich, S., Blake, C.L., Merz, C.J.: UCI Repository of Machine Learning Databases, UC Irvine (1998), http://www.ics.uci.edu/~mlearn/MLRepository.html

Aswatha Kumar M. et al. (Eds.): Proceedings of ICAdC, AISC 174, pp. 63–67. springerlink.com © Springer India 2013
Indic Language Translation in CLIR Using Virtual Keyboard
Mallamma V. Reddy and M. Hanumanthappa
Bangalore University, Psychology Building,
Jnanabharathi Campus Bangalore [email protected]
Abstract. Natural Language is the primary medium for human communication. Function of a Natural Language (NL) is to communicate semantic content of its expressions directly to unravel this task we used the notion of Virtual Key-boards. Virtual Keyboards are commonly used as an on-screen input method in devices with no physical keyboard. This paper presents the usage of Virtual Keyboards the aim is to build a machine that could communicate in Natural Language particularly for Kannada to Telugu and vice-versa. It is designed us-ing Unicode Character Set “UTF-8”, achieves Translation of characters, words and sentences from source language text to target language. We have built the Bilingual Dictionary for Kannada-Telugu which consists around 1000 words. The experimental results and their performance are analyzed using Precision and Recall as described in this paper.
1 Introduction
There is a dramatic increase in the quantum of knowledge and information resulting in increase in the production of books and other multimedia communication materials including Compact Discs - Read Only Memory (CD-ROM). These repositories of knowledge are the bridges between information generators and the information users. The success of such a repository is completely dependent upon how tactfully the rec-orded knowledge is well organized and retrieved. To do this CLIR [1] is used.
Cross Language Information Retrieval (CLIR) is the retrieval of relevant informa-tion for a query expressed in native language. While retrieval of relevant documents is slightly easier, analyzing the relevance of the retrieved documents and the presenta-tion of the results to the users are non-trivial tasks. To accomplish this task, we present our Kannada Telugu and Telugu Kannada CLIR systems as part of Ad-Hoc Bilingual task. We take a query translation based approach using bi-lingual dictiona-ries [2] shown in Fig 1. Both Kannada and Telugu use the “UTF-8” / western win-dows encode and draw their vocabulary mainly from Sanskrit.
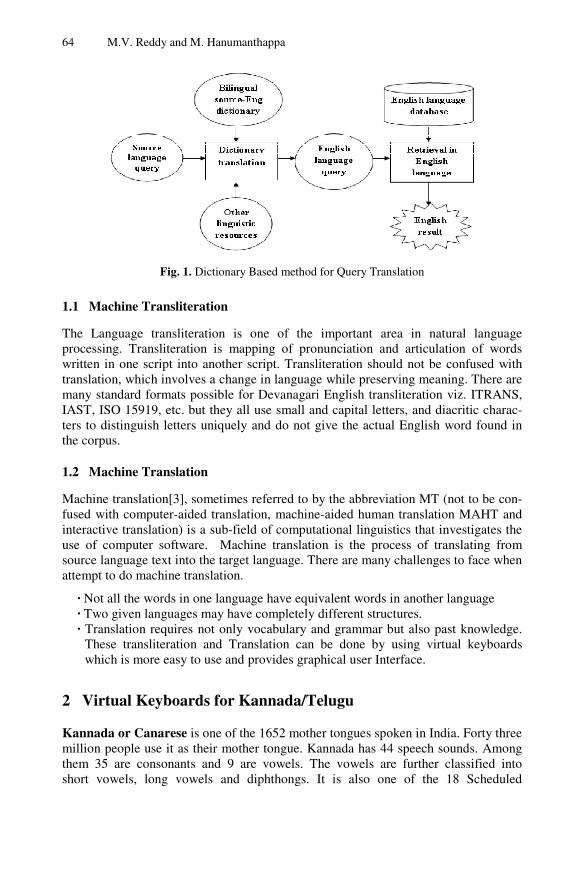
64 M.V. Reddy and M. Hanumanthappa
Fig. 1. Dictionary Based method for Query Translation
1.1 Machine Transliteration
The Language transliteration is one of the important area in natural language processing. Transliteration is mapping of pronunciation and articulation of words written in one script into another script. Transliteration should not be confused with translation, which involves a change in language while preserving meaning. There are many standard formats possible for Devanagari English transliteration viz. ITRANS, IAST, ISO 15919, etc. but they all use small and capital letters, and diacritic charac-ters to distinguish letters uniquely and do not give the actual English word found in the corpus.
1.2 Machine Translation
Machine translation[3], sometimes referred to by the abbreviation MT (not to be con-fused with computer-aided translation, machine-aided human translation MAHT and interactive translation) is a sub-field of computational linguistics that investigates the use of computer software. Machine translation is the process of translating from source language text into the target language. There are many challenges to face when attempt to do machine translation.
· Not all the words in one language have equivalent words in another language · Two given languages may have completely different structures. · Translation requires not only vocabulary and grammar but also past knowledge.
These transliteration and Translation can be done by using virtual keyboards which is more easy to use and provides graphical user Interface.
2 Virtual Keyboards for Kannada/Telugu
Kannada or Canarese is one of the 1652 mother tongues spoken in India. Forty three million people use it as their mother tongue. Kannada has 44 speech sounds. Among them 35 are consonants and 9 are vowels. The vowels are further classified into short vowels, long vowels and diphthongs. It is also one of the 18 Scheduled

Indic Language Translation in CLIR Using Virtual Keyboard 65
Languages included in the VIII Schedule of the Constitution of India is recognized as the Official and Administrative language of the state of Karnataka [4]. It belongs to the Dravidian family of languages. Within Dravidian, it belongs to the South Dravi-dian group. The Dravidian languages stand apart from other family of Indian languag-es like Indo Aryan, Sino Tibetan and Austro Asiatic by having distinctive structural differences at phonological, morphological, lexical, syntactic and semantic levels.
Telugu ( ెలుగు) is a Central Dravidian language primarily spoken in the state of Andhra Pradesh, India, where it is an official language [5]. According to the 2001 Census of India, Telugu is the language with the third largest number of native speak-ers in India (74 million), 13th in the Ethnologue list of most-spoken languages world-wide, and most spoken Dravidian language. We have designed The Virtual keyboard for Kannada/Telugu as shown in Fig 2. (a) and (b).
Fig. 2. (a). Kannada Virtual Keyboard (b). Telugu Virtual Keyboard
3 Experimental Setup
Several corpora were collected to estimate the parameters of the proposed models and to evaluate the performance of the proposed approach. The corpus BUBShabdaSaga-ra-2011 for training consisted of 1000 words in dictionary for Kannada/Telugu. The training corpus composed of a bilingual word list. In the experiment, the performance of word translation extraction was evaluated based on precision and recall rates at the word. Since, we considered exactly one word in the source language and one transla-tion in the target language at a time.
The word level recall and precision rates were defined as follows:
(1)
(2)

66 M.V. Reddy and M. Hanumanthappa
4 Results and Performance
Cross Language Information Retrieval Tool [6] is built by using the ASP.NET as front end and Database as back end, the Kannada/Telugu is encrypted by using the “UTF-8” [7] /Encoding system. Telugu and Kannada and vice-versa are the source language and the target language, respectively, in our query translation. All the expe-riments carried out here involve the same set of Kannada/Telugu queries and the same query expansion [8], translation and retrieval method. The only difference between the experimental conditions is in what dictionaries are used in the query translation. We have trained the systems with corpus size of 200, 500 and 1000 lexicons and sen-tences respectively. Performances of the systems were evaluated with the same set of 500 distinguished sentences/Phases that were out of corpus. The experiment results as shown in Fig 3 and Fig 4.
Fig. 3. Sample Results for Word
Fig. 4. Sample Results for Sentences
From the experiment we found that the performances of our systems are signifi-cantly well and achieves very competitive accuracy by increasing the corpus size as shown in Fig 5.
Fig. 5. Performance Graph
Indic Language Translation in CLIR Using Virtual Keyboard 67
5 Conclusion
Dictionary-based query translation has been widely used in CLIR because of its sim-plicity and the increasing availability of machine-readable bilingual lexicons. We have presented our Kannada→Telugu and Telugu→Kannada CLIR system developed for the Ad-Hoc bilingual Task. Our approach is based on query Translation using bi-lingual dictionaries. We focused on translation of lexis and sentences, which has been demonstrated to be one of most effective ways to obtain more accurate translations. The implementation results are shown above with evaluation metric. The proposed method can be easily extended to other language pairs that have different sound sys-tems without the assistance of pronunciation dictionaries. Further paragraph transla-tion is to be carried out as part of Ad-Hoc bilingual task for Kannada to Telugu, Telu-gu to Kannada.
Acknowledgments. The support of the University Grant Commission (UGC), India, is gratefully acknowledged. The author would also like to acknowledge the help and support from Dr. M. Hanumanthappa, for his valuable guidance and suggestions which helped me a lot to write this paper. This paper is in continuation of the major research project entitled Cross-Language Information Retrieval sanctioned to Dr. M. Hanumanthappa, PI-UGC-MH, Department of Computer Science and Applications by UGC carried out at the Bangalore University, Bangalore, India.
References
1. Daelemans, W., Sima’an, K., Veenstra, J., Zavrel, J.(eds): Different Approaches to Cross Language information Retrieval, number 37 in Language and Computers: Studies in Prac-tical Linguistics, Amsterdam, Rodopi (2001)
2. Reddy, M.V., Hanumanthappa, M.: Dictionary Based Word Translation in CLIR Us-ing Cohesion Method. In: Proceedings of the 6th National Conference; INDIACom 2012 Com-puting For Nation Development, February 23-24, Bharati Vidyapeeth’s Institute of Com-puter Applications and Management, New Delhi (2012)
3. Homiedan, A.H.: Machine Translation 4. The Karnataka Official Language Act". Official website of Department of Parliamentary
Affairs and Legislation. Government of Karnataka (2007) (retrieved June 29, 2007) 5. http://en.wikipedia.org/wiki/Telugu_language 6. Reddy, M.V., Hanumanthappa, M.: CLIR Project (English to Kannada and Telugu),
http://bangaloreuniversitydictionary-menu.asp 7. http://www.ssec.wisc.edu/~tomw/java/unicode.html#x0C80 8. Pingali, P., Varma, V.: Hindi and Telugu to English Cross Language Information Retrieval
at CLEF 2006. In: Working Notes for the CLEF 2006 Workshop (Cross Language Adhoc Task), Alicante, Spain, September 20-22 (2006)

Aswatha Kumar M. et al. (Eds.): Proceedings of ICAdC, AISC 174, pp. 69–74. springerlink.com © Springer India 2013
Energy Efficient Clustering and Grid Based Routing in Wireless Sensor Networks
Amrutha K.M., Ashwini P., Divyashree K. Raj, Kavitha Rani G., and Monica R. Mundada
Department of CSE, MSRIT, Bangalore
Abstract. A wireless sensor network is a deployment of massive numbers of small, inexpensive, self powered devices that can sense, compute and communicate with other devices for the purpose of gathering local information to make global decisions about a physical environment. Wireless Sensor Networks are tightly constrained in terms of transmission power, onboard energy, processing capacity and storage, and thus require careful resource management. We mainly have LEACH(Low Energy Adaptive Clustering Hierarchy) and PEGASIS(Power Efficient Gathering in Sensor Information Systems) protocols. But LEACH doesn’t support distribution of cluster heads optimally and PEGASIS has the overhead of data delay. This proposed approach emphasizes on increasing network lifetime via efficient routing path ands , efficient energy consumption.
Keywords: Wireless Sensor Networks- WSN, Cluster Head- CH, Base Station- BS
1 Introduction
This approach emphasizes on increasing the life-span of the network by optimum selection and distribution of the Cluster Heads (CH), thus increasing energy efficiency of the network.
2 Assumptions and Dependencies
• Base Station (BS) is immobile. • All sensor nodes in the network are energy constrained. • Nodes in the network are not dynamic while the CHs are being selected. • All the nodes are present in the X-Y co-ordinate system with left bottom
corner as the origin. • All sensor nodes are scattered within the range.
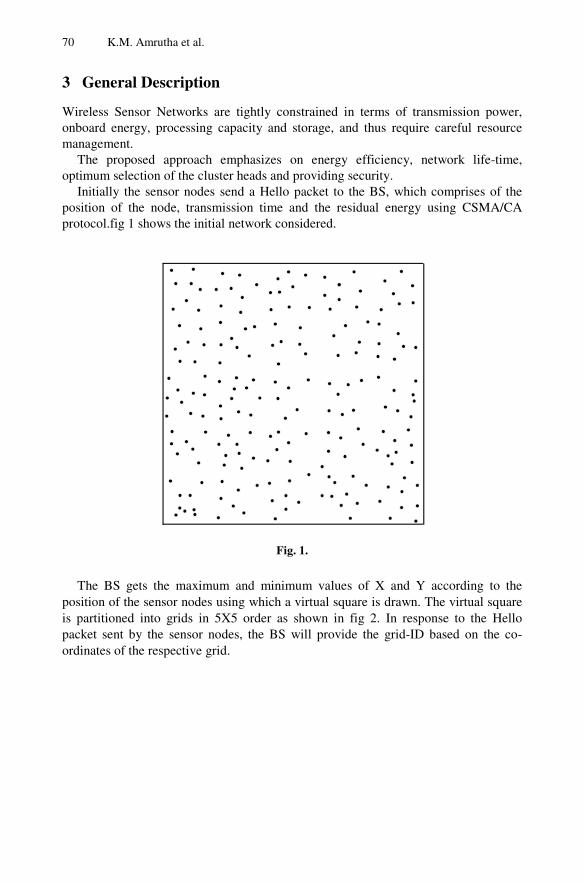
70 K.M. Amrutha et al.
3 General Description
Wireless Sensor Networks are tightly constrained in terms of transmission power, onboard energy, processing capacity and storage, and thus require careful resource management.
The proposed approach emphasizes on energy efficiency, network life-time, optimum selection of the cluster heads and providing security.
Initially the sensor nodes send a Hello packet to the BS, which comprises of the position of the node, transmission time and the residual energy using CSMA/CA protocol.fig 1 shows the initial network considered.
Fig. 1.
The BS gets the maximum and minimum values of X and Y according to the position of the sensor nodes using which a virtual square is drawn. The virtual square is partitioned into grids in 5X5 order as shown in fig 2. In response to the Hello packet sent by the sensor nodes, the BS will provide the grid-ID based on the co-ordinates of the respective grid.

Energy Efficient Clustering and Grid Based Routing in Wireless Sensor Networks 71
Fig. 2.
And only one CH is selected for every grid, i.e., the one which has the least transmission time.
The BS sends a message to the CH which includes the following fields, Source, Destination, MAC addresses of all its subscribed nodes and the neighboring CH-ID. The CH multicasts an advertising message to all its subscribed nodes .The subscribed nodes will save the MAC address of its CH for secure data transmissions.
Compute the value ‘k’, which is equal to total number of nodes divided by number of grids formed. If the number of nodes, say p in each zone <<k, then assign the sensor nodes to the cluster in neighboring grids. As each node maintains the address of all its neighboring nodes, it checks for all its neighbors one by one according to the grid IDs’, and if found averagely densed, then the nodes are added to it until it reaches value k. Repeat this until all the p nodes are distributed to its neighbors.
Now find the position (side) of the BS with respect to the virtual square, such that the CHs in the row nearest to that, communicates with it.
When the BS receives query from the user, it will forward to the CHs’ in the nearest row/column based on its position, and from which it sends to its neighboring CHs’ along the same line as shown in fig(c) forming 5 virtual linear chains in the network.

72 K.M. Amrutha et al.
Fig. 3.
Now the CH transmits the query to its subscribed nodes using the combination of FDMA and TDMA protocols. In each allotted slot, FDMA is used for transmission and reception of data.
Based on the query the data is aggregated in each cluster, and is forwarded along the same virtual chain via CHs’ to the CH which actually communicates with the BS.
i.e, The last CH in each zone refers the MAC address in the routing table for the CH from which it received the query, to send the aggregated data. This is repeated until all the aggregated data from different CH nodes reaches the CH which communicates with BS and hence sends the data to BS.
And finally the CHs’ nearest to the BS will send the aggregated from all the CHs’ in its row (if BS is on left or right side of the square (network)) or column (if BS is above or below the square (network)) as shown in fig 4 to the BS. From which the data is processed and sent back to the user.

Energy Efficient Clustering and Grid Based Routing in Wireless Sensor Networks 73
Fig. 4.
In the second round, the node within the same CH with the next least transmission time and highest residual energy is selected as CH and notified. This step is continued until all the subscribed nodes in the cluster become CH.
4 Proposed Algorithm
Step 1: Initially, send the HELLO packets to the BS, containing position of all the nodes in the network along with their energy level. Determine the minimum and maximum values of X and Y based on the position of the sensor nodes and plot the virtual square, which is being partitioned into 5X5 grids.
Step 2: A node with least transmission time in each grid is selected as CH and then a virtual chain is formed along the CHs’ in the same line based on the position of BS.
Step 3: Once the network is divided into 5X5 grids, transmit the query from BS to all the CHs’ in the nearest row/column, from which it is propagated to all other CHs’ along the virtual chain. Now the data is aggregated in each grid based on the query and are sent in the reverse order of its arrival until the initial CH collects all the aggregated data from other CHs’ along the virtual chain, which communicates and hence sends data to the BS.
Step 4: For the next coming rounds, select the CH from same cluster which has the next least transmission time and highest residual energy.
Goto Step 3.

74 K.M. Amrutha et al.
5 Future Enhancements
For very large networks, data accuracy can be provided by using a cache memory in the nodes. When the BS receives the data, it checks the accuracy using CRC. If the data is accurate the BS sends an ACK, else NAK is sent to the CH to resend the data present in the cache memory.
References
1. Li, Q., Aslam, J., Rus, D.: Hierarchical Power-Aware Routing in Sensor Networks. In: Proc. DIMACS Wksp. Pervasive Net. (May 2001)
2. Xu, Y., Heidemann, J., Estrin, D.: Geographyinformed Energy Conservation for Ad-hoc Routing. In: Proc. 7th Annual ACM/IEEE Int’l. Conf. Mobile Comp. and Net., pp. 70–84 (2001)
3. Lindsey, S., Raghavendra, C.: Power-Efficient Gathering in Sensor Information Systems. In: Lindsey, S., Raghavendra, C. (eds.) IEEE Aerospace Conf. Proc. 3(9-16), pp. 1125–1130 (2002)
4. Manjeshwar, A., Agarwal, D.P.: Routing Protocol for Enhanced Efficiency in Wireless Sensor Networks. In: 1st Int’l. Wksp. on Parallel and Distrib. Comp. Issues in Wireless Networks and Mobile Comp. (April 2001)
5. Park, S., Savvides, A., Srivastava, M.B.: SensorSim: A Simulation Framework for Sensor Networks. In: Proceedings of the 3rd ACM International Workshop on Modeling, Analysis and Simulation of Wireless and Mobile Systems, Boston, MA (2000)
6. Park, S., Savvides, A., Srivastava, M.B.: Simulating Networks of Wireless Sensors. In: Proceedings of the 2001 Winter Simulation Conference (2001)
7. The Network Simulator – ns-2, http://www.isi.edu/nsnam/ns/Hung-ying Tyan, Design, Realization and Evaluation of a Component-based Compositional Software Architecture for Network Simulation, PhD thesis, Department of Electrical Engineering, The Ohio State University (2002)
Aswatha Kumar M. et al. (Eds.): Proceedings of ICAdC, AISC 174, pp. 75–83. springerlink.com © Springer India 2013
A Comparative User-Centric Study of Digital Library Software Systems
Samaneh Ahmadi1, Shiva Shirdavani1, and Srini Ramaswamy2
1 Esfahan University, Iran [email protected] [email protected]
2 ABB India Corporate Research, Bangalore
Abstract. User-centric services and service provisioning has been a strong motivator for modern internet technologies, and, in particular, Web 2.0 technologies. Of particular interest to this study is its ability to have widespread societal impact. Hence in this work we assess the impact of such advancements in how one widespread societal function works, i.e. libraries; and we study digital libraries and their associated software systems that are being critically impacted by such technologies. Thus the objective of this paper is to derive several overarching standards and criteria for building user-centric digital libraries from both a technical (structure) and utilitarianism dimensions and explore two different Digital Libraries (Dspace Software - Khazar University and Green stone Software - New Zealand Digital library) with their corresponding software systems. Using quantitative methods of comparison we conclude, that while both Digital libraries and their associated software systems have some advantages for their users, they also have several disadvantages.
Keywords: Digital Library, Digital Library Software, Green Stone, Dspace.
1 Introduction
The two principal building blocks that are used in the improvement of digital libraries (DLs) are the Internet and the World Wide Web. According to statistical reports the World Wide Web (or the web) has been one of the great successes in the history of computing and this connected collection of information across the Internet around the world is a significant step forward for mankind. The web and its associated technologies have led to fundamental and rapid development of DLs. In order to manage and control huge collections of artefacts over long periods of time, libraries are often early adaptors new technologies; this includes microfilm, through online information services, and CD-ROMs, etc. The internet and web are thus pervasive technologies used by existing and new libraries to make immense societal impact on the current and future generations of humankind; for example, social search engines such as Aardvark [1,2] are an attempt to establish trust with their clients by concentrating on question and answering techniques. This study focuses on defining

76 S. Ahmadi, S. Shirdavani, and S. Ramaswamy
characteristics for such a user-centric digital library; as a case study we explore a quantitative evaluation method for comparing two digital library efforts with associated software systems.
2 Background
Several publishers and libraries became involved in building online collections of scientific journals in the late 1980s. According to mercury technical reports series [3] the Mercury Electronic Library project at Carnegie Mellon University between 1987 and 1993 was one of the first steps to create a campus digital library. The advanced computing infrastructure at Carnegie Mellon was built by Mercury that consisted of a high-performance network, a fine computer science department, and the norm of innovation for university libraries. Mercury and CORE cooperated further on numerous other projects to use scanned images of journal articles.
Projects like Mercury, CORE, and Tulip were not envisioned as a long production system.[4] Each of them had technically limitations, for example, they suffered from the small size of the collections provided to researchers. The arrival of the web and the common availability of web browsers went a long way towards solving the problem of user interface development. Though web browsers were a good start, they were not ideal for a digital library; however, they have the huge advantage that they can be on all standard computers and operating systems, thereby addressing the availability issue from a user-centric perspective. In the mid-1990s, publishers’ began establishing avenues to provide scientific journals online. When commercial publishing on CD-ROM had increased as a vital part of the industry, few journals were accessible online. Thus users of online information services were expanding faster than printed material and most of the major publishers of scientific journals have got along rapidly to electronic publishing, such as the approach taken by the Association for Computing Machinery (ACM) and the IEEE; as well as the large commercial publishers including Elsevier, John Wiley, and Academic Press, and by societies such as the American Chemical Society, and by university presses, including M.I.T. Press. [5]
3 Digital Library Definition
In literature once can fund find different definitions for DLs and these are named in a variety of ways by its various stakeholders. According to Adams and Blandford [6], librarians refer to them as databases and people in arts and humanities name them electronic archives. In the UK and Western Europe, DLs are referred to as digital surrogates, being regarded as substitutes for traditional libraries in their role of collections of validated and structured information[7]. Leiner [8] stated a DL is a collection of services and information objects that are available digitally. Information objects can be defined as anything in a digital format such as books, journal articles and sounds, since DLs organize and present information objects to users, and support them in dealing with these objects. In Brown [9] the authors treat DLs as an archive, and explore some of the challenges associated in developing smaller digital archives

A Comparative User-Centric Study of Digital Library Software Systems 77
for internal use, specifically from an education and pedagogical perspective. Lang [10] described that the goal of a DL is to improve access for all users. However, DL is a widely accepted term describing the use of digital technologies to acquire, store, preserve and provide access to information and material originally published in digital form or digitized from existing print, audio-visual and other forms.
Additional to above goal for DLs, new DLs should address another important purpose, which is related to their users (customers). Today DLs are typically centred around specific user communities who are mainly interested in these services; hence they have been built to meet the discipline-specific needs, without much rationale for fixed concepts on how these collections are typically managed. While creators and users improve and grow; the systems need to address overarching issues that relate to organizing information, retrieving it, establishing quality control, standards, and services. Such an approach will allow us to find new and creative answers to these age-old questions in providing meaningful information to the wider society.
4 Digital Library Evaluation Criteria
In literature, researchers have identified various criteria to evaluate DLs. Such evaluation criteria have been adopted to address needs arising from characteristics such as library type, library purpose [9], library mission, library patrons, etc. For example across the various literatures we surveyed, the following have been used as criteria in order to evaluate DLs.
4.1 Collection
Wealth and diversity of resources, how much the collection of library are capable to meet its patrons’ needs and fulfill information needs of target users.
4.2 Information Organization and Representation
Which metadata, subject scheme or classification system the library uses. How do these tools help to facilitate of information search and retrieval library materials?
4.3 Technology
What is the fundamental technology? Is it a database, commercial system or open source software? Does the library offer any documentation on the technology or architectural form they have working to build the library?
4.4 Interface Features
Consists of such issues as browsing, searching, navigation, results display etc. Some of the main considerations in this connection are:
• Option of basic and advanced search modes • easy to use is the interface • easy to learn is the interface

78 S. Ahmadi, S. Shirdavani, and S. Ramaswamy
• What retrieval performances have been provided? • How customizable are consequence displays? (e.g. brief vs full
description of the item) • Does the interface offer any explanation or customization facilities
such as book marking, saving search history, creating or modifying objects inside the library?
• How are fonts, images, icons and button labels designed? • Document declaration condition (regarding to images and digitized
recourses) • Audio and video information search and retrieval situation
(regarding to multimedia DLs) • Does the interface track usability standards and principles?
4.5 Standards
Does the library use some standards relating to metadata, interoperability, accessibility and knowledge organization?
4.6 Documentation
Does the library offer any information on its policies and guidelines considering target users, collection improvement, digitization and preservation, standards and tools used to support and preserve the library?
Libraries are one of main information centers in societies. According to some authors the rapid growth of World Wide Web and its technologies and tools have lead to a reduced role of libraries to some extent. The internet and related informational websites have thus created a competitive environment for libraries. To sustain, libraries should try to play their fundamental role as a useful information center for their patrons. One of the means by which libraries can still differentiate and maintain their competitive advantage for their patrons is by making available reliable and accurate information than what is available on the internet. Leveraging and utilizing 2.0 technologies is a current and recent trend by libraries. Given the public’s acceptance of the internet, implementing DLs from a user-centric perspective can still enhance and revitalize the role libraries in modern society.
In general, library performs three main tasks, which consist of collecting, cataloging, and retrieving resources that are of importance to their users. Certainly there are other additional tasks that were mentioned in our literature survey, such as library management, library preservation, and so on. Our primary consideration in selecting the following special categories and sub-categories discussed below is to cater to the primary library tasks. From this perspective, we select particular elements that are of importance to a user-centric library system. Using these insights, we then analyze some recent DLs and associated software system (Greenstone and Dspace). Hence through this study we have derived certain categories and sub- categories that can enhance the user centric nature of library and compare and contrast two competing DLs and associated software systems to draw some insights.

A Comparative User-Centric Study of Digital Library Software Systems 79
To conduct this effort, we adopted a combined framework to determine various evaluation criteria (some identified by pervious research works) and evaluate their applicability to open-source library software systems. Using Greenstone and Dspace as examples we then explore the purpose of these libraries and in particular the main mission for any digital library is to be user-centric for its users. Our framework is categorized into four sub- characteristic categories, and each sub-category includes certain characteristics that are deemed important for successfully developing such user-centric DL systems. The major categories we propose here include the following:
4.6.1 General Information The purpose of this category is to offer general information about the software. In fact, instead of long descriptions about the software and their history / background, readers need to be able to gain such information quickly. The general information category is divided to four sub-categories such as About, URL, membership, license, language support and use. Actually general information can enumerate a kind of library policy and development strategy in the case of DLs software systems.
4.6.2 Design and Customization Just like storefronts in a mall /shopping lane, design and customization of DLs play the role of ‘buy-in’ from their clients. Here we identify the role of design and customization on DLs that enhance user experience; these include: stable release, search modes, developer / development status, type, program language used, and protocol supported. Indeed library building, ordnance of building, classification of materials that is related to search mode, special facilities and services for members and patrons in a classic library and so on are important to attract and satisfy users are also important for DLs.
4.6.3 Security and Access Security and information privacy are the cornerstone of issues that helps sites gain trust of their users. DLs must endure that their patrons are assured of security and privacy, topics central to their adoption. One of the issues related to security of DLs are copyrights. Other sub-categories of interest there include access, file upload, and privacy policy.
4.6.4 Collaborative Tools As mentioned earlier, the main difference between web2.0 and web1.0 is related to communication. Web2.0 enhances communication among users. To address this gap, some employ social software tools to support user collaboration. Most websites use at least one or more such tools to connect with their users. So the use of collaborative tools in DLs such as blog, email, FAQ, training materials (inform of catalogue or brochure files and social medias) are all key aspects of a user-centric DL system.
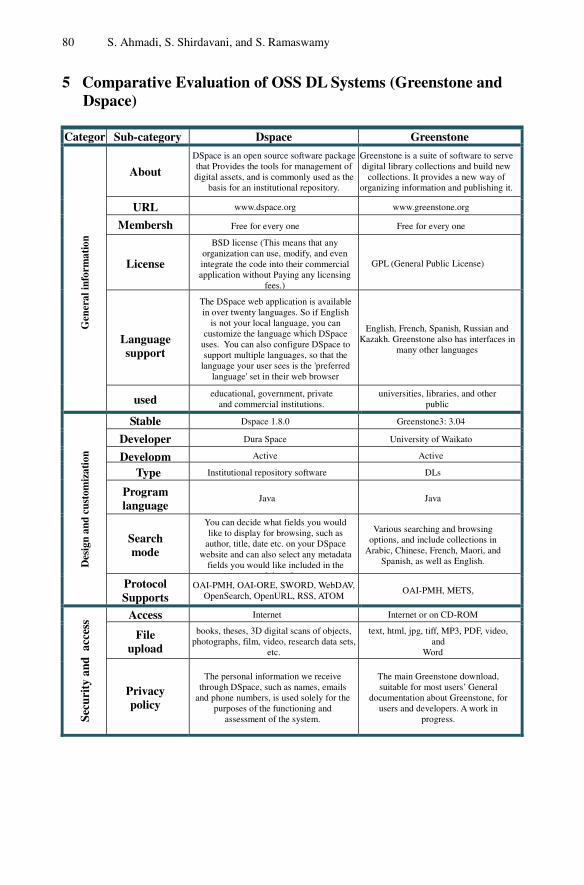
80 S. Ahmadi, S. Shirdavani, and S. Ramaswamy
5 Comparative Evaluation of OSS DL Systems (Greenstone and Dspace)
Categor Sub-category Dspace Greenstone
G
ener
al in
form
atio
n
About DSpace is an open source software package that Provides the tools for management of digital assets, and is commonly used as the
basis for an institutional repository.
Greenstone is a suite of software to serve digital library collections and build new
collections. It provides a new way of organizing information and publishing it.
URL www.dspace.org www.greenstone.org
Membersh Free for every one Free for every one
License
BSD license (This means that any organization can use, modify, and even integrate the code into their commercial application without Paying any licensing
fees.)
GPL (General Public License)
Language support
The DSpace web application is available in over twenty languages. So if English
is not your local language, you can customize the language which DSpace
uses. You can also configure DSpace to support multiple languages, so that the
language your user sees is the 'preferred language' set in their web browser
English, French, Spanish, Russian and Kazakh. Greenstone also has interfaces in
many other languages
used educational, government, private
and commercial institutions. universities, libraries, and other
public
Des
ign
and
cust
omiz
atio
n
Stable Dspace 1.8.0 Greenstone3: 3.04
Developer Dura Space University of Waikato
Developm Active Active
Type Institutional repository software DLs
Program language
Java Java
Search mode
You can decide what fields you would like to display for browsing, such as
author, title, date etc. on your DSpace website and can also select any metadata
fields you would like included in the h i f
Various searching and browsing options, and include collections in
Arabic, Chinese, French, Maori, and Spanish, as well as English.
Protocol Supports
OAI-PMH, OAI-ORE, SWORD, WebDAV, OpenSearch, OpenURL, RSS, ATOM
OAI-PMH, METS,
Secu
rity
and
acc
ess Access Internet Internet or on CD-ROM
File upload
books, theses, 3D digital scans of objects, photographs, film, video, research data sets,
etc.
text, html, jpg, tiff, MP3, PDF, video, and
Word
Privacy policy
The personal information we receive through DSpace, such as names, emails
and phone numbers, is used solely for the purposes of the functioning and
assessment of the system.
The main Greenstone download, suitable for most users’ General
documentation about Greenstone, for users and developers. A work in
progress.