proceedings ipl symposium kyoto, 2012iplhq.org/icl/wp-content/uploads/2012/12/ipl2012-11_paris...ipl...
TRANSCRIPT

Proceedings of IPL Symposium
Paris, 2012
UNESCO Headquarters, Paris 21 November 2012
Kyoji Sassa Kaoru Takara Bin He (Editors)
Organized by
International Consortium on Landslides
ISBN 4-9903382-1-9 C3051

Content Symposium Programme 1 Chapter 1 Bedding Landslide Formation Mechanism and Traits in Lesser
Khingan Mountain 4
Chapter 2 Using High density Resistivity Method to research on permafrost landslide
10
Chapter 3 Large scale simulation of watershed mass transport – a case study of Tsengwen reservoir watershed
18
Chapter 4 Networking, Linkage and Coordination for Disaster Risk Reduction: A Case Example from South Asia Disaster Knowledge Network (SADKN)
26
Chapter 5 Lessons Learned in the Development of Landslide Early Warning System in Indonesia
30
Chapter 6 Distribution and characteristics of landslides induced by the Varzeghan Ahar earthquake doublet (Mw=6.4 and Mw=6.3) in 2012 in Azerbaijan e Sharghi, northwest of Iran
35
Chapter 7 A New Approach to the Landslide Early Warning Using the Chemical Composition Fluctuation in the Leakage from Susceptible Slopes
43
Chapter 8 Increasing awareness: the role of non structural measures in landslides disaster reduction
51
Chapter 9 Post failure Mobility and the Importance of Stress Ratio in Strength Evaluation
57
Chapter 10 Mechanical Mathematical Modelling and Monitoring for Landslides
63
Chapter 11 A Comparative Analysis of Landslide Susceptibility by WAA and SINMAP Model
69
Chapter 12 Experimental researches on technical state, design and operation of reinforced concrete anti landslide structures for seismic dangerous of UKRAINE
81
Chapter 13 Technical Cooperation Project to Develop Landslide Risk Assessment Technology along Transport Arteries in Vietnam
86
Chapter 14 Identification of rainfall induced shallow landslides on mountain terrain
89

IPL Symposium 2012 Time: 9:00-18:00 on 21 November (Wednesday) 2012
Venue: Room XVI (Ground Floor of Bonvin Building), UNESCO Headquarters, Paris Opening Session (9:00-9:10)
Greeting
Gretchen Kalonji (UNESCO), Assistant Director General of Natural Science Sector
together with Badaoui Rouhban (former director for Disaster reduction of UNESCO), Chair
of IPL Award Committee
Facilitator Bin He, Disaster Prevention Research Institute (DPRI), Kyoto University, Japan
Part 1 (9:10-11:15) Proposal of New IPL Projects
Chairpersons: Matjaz Mikos, Alexander Strom
9:10-9:25 Malaysia Che Hassandi
Abdullah Slope Data Acquisition along Highways in Sabah State for hazard assessment and mapping
9:25-9:45 Honduras Luis Eveline
Aníbal Godoy
Latin-American Congress on Landslides by GIS and RS in Tegucigalpa, Honduras ; Study on geological disasters focusing on landslides in and around Tegucigalpa City, Honduras
9:45-10:00 Croatia Željko Arbanas Study of landslides in flysch deposits of North Istria, Croatia: sliding mechanisms, geotechnical properties, landslide modeling and landslide susceptibility
10:00-10:15 Czech Adam Emmer Database of Glacial Lake Outburst Floods (GLOFs)
10:15-10:30 ADPC N.M.S.I.
Arambepola Introducing Community-based Early Warning System for Landslide Hazard Management in Cox's Bazaar Municipality, Bangladesh
10:30-10:45 Serbia Biljana
Abolmasov Study of slow moving landslide Umka near Belgrade, Serbia
10:45-11:00 Nigeria Igwe Ogbonnaya Landslides in West Africa: impacts, mechanism and management
11:00-11:15 Brazil Renato Eugenio
de Lima Characterization of landslides mechanisms and impacts as a tool to fast risk analysis of landslides related disasters in Brazil
(Note for Part 1: 10 minutes for presentation, 5 minutes for discussion, except the IPL project from Honduras-15 minutes for presentation, 5 minutes for discussion)
11:15-11:30 Break
1

Part 2 (11:30-16:45) Results of IPL Projects, WCoEs, and other research
Session 1
(11:30-12:30) Chairpersons: Zeljko Arbanas, Renato E. de Lima
11:30-11:45 China Wei Shan Bedding Landslide Formation Mechanism and Traits in Lesser Khingan Mountain
11:45-12:00 China Ying Guo Using High-density Resistivity Method to research on permafrost landslide
12:00-12:15 Chinese
TaipeiKo-Fei Liu Large scale simulation of watershed mass transport – a case study of
Tsengwen reservoir watershed
12:15-12:30 India Surya Prakash
-An Initiative for Development of a Web-based Self Study Programme for Landslide Risk Management. -Networking, Linkage and Coordination for Disaster Risk Management with a case example from South Asia Disaster Knowledge Network
12:30-14:00 Lunch
Session 2
(14:00-15:15) Chairpersons: Ko-Fei Liu, Mohammadreza Mahdavifar
14:00-14:15 Indonesia Teuku Faisal FathaniLesson Learned in the Development of Landslide Early Warning System in Indonesia
14:15-14:30 Iran P. Memarian
M. Mahdavifar
Distribution and characteristics of landslides induced by the Varzeghan earthquakes(Mw=6.4 and Mw=6.3) in 2012 in Azerbaijan-e-Sharghi, northwest Iran
14:30-14:45 Iran Z. Shoaei A New Approach to the Landslide Early Warning Using the Chemical Composition Fluctuation in the Leakage from Susceptible Slopes
15:00-15:15 Mexico A. IrasemaIncreasing awareness: the role of non-structural measures in landslides disaster reduction
15:15-15:30 Break
Session 3
(15:30-16:45) Chairpersons: Hideaki Marui, Teuku Faisal Fathani
15:30-15:45 Nigeria IGWE OgbonnayaPost-failure Mobility and the Importance of Stress Ratio in Strength Evaluation
15:45-16:00 Russia Svalova Valentina Mechanical-Mathematical Modelling and Monitoring for Landslides
16:00-16:15 Srilanka A A Virajh Dias A Comparative Analysis of Landslide Susceptibility by WAA and SINMAP Model
2

16:15-16:30 Ukraine Iurii Kaliukh Some results of field surveys building structures for landslide’s resistance in Carpathian's mountains region of Ukrain
16:30-16:45 Vietnam Dinh Van Tien Technical Cooperation Project to Develop Landslide Risk Assessment Technology along Transport Arteries in Vietnam
16:45-17:00 Korea Sangjun IM Identification of rain-induced shallow landslides on mountain terrain
Closing Session (17:00-17:15)
Concluding Remark Giuseppe Arduino, Programme Specialist in Hydrological/Geological Sciences, UNESCO
Office, Jakarta
Closing Address Kaoru Takara, ICL Vice President, Disaster Prevention Research Institute (DPRI), Kyoto
University
(Note for Part 2: 15 minutes for presentation, 5 minutes for question/answer.)
Committee Meetings (17:30-18:30) Each committee may have its own meeting in a different location within the room.
3

��
�������Proceedings�of�the�IPL�Symposium,�UNESCO,�Paris,�2012�
�
Bedding� Landslide� Formation� Mechanism� and� Traits� in� Lesser�Khingan�Mountain�
Hua�Jiang�(1),�Wei�Shan�*(1),�Zhaoguang�Hu�(1)�,�Ying�Guo(1)�,�Chunjiao�Wang(1)�1) Northeast�Forestry�University,�Harbin,�China,�150040 [email protected]�
�
Abstract� In� China’s� Heilongjiang� Province,� Bei’an� to�Heihe� freeway�utilizes� the�original� second�class�highway�to� widen� and� expand� for� freeway,� widen� subgrade� of�some� sections� locate� in� tailing� edge� of� the� landslides,�influenced� by� the� landform,� geological� condition� and�climate� factors,� are� in� unstable� states,� bring� great�difficulties� to� widening� and� expanding� implementation.�In�the�process�of�landslide�researching,�firstly�identify�the�space� form� of� landslide,� analyze� the� formation�mechanism�of� landslide,� evaluate� the� stability� condition�and� the� development� tendency� of� landslide,� and� then�determine�the�prevention�and�treatment�measures.�Took�the�Bei'an�to�Heihe�freeway�K178+530�section�landslide�as�the� research� object,� employed� the� field� survey,�topographic� mapping,� geological� drilling,� indoor� test,�numerical� simulation,� field� monitoring� and� theoretical�analysis� methods� to� carry� an� integrated� study� on� the�formation� mechanism� of� the� landslide.� Study� results�show� that:� the� K178+530� landslide� belongs� to� bedding�landslide,� rupture� surface� is� located� at� the� bottom� of�subgrade�spoil�and�silty�clay;�during�survey,�the�landslide�is� in� the� limit� equilibrium� state,� directly� affects� the�stability� of� subgrade� slope;� atmospheric� precipitation,�snowmelt�water�and�seasonally�frozen�soil�thawing�water�provide� a� continued� water� source� for� landslide,� surface�water� and� ground� water� supply� the� Quaternary� pore�water� by� infiltration� and� lateral� runoff� through� surface�cracks� and� shallow�high�permeability� rock� and� soil,� low�permeability� rock� and� soil� under� the� loose� overburden�form� aquiclude,� rock� and� soil� of� the� aquiclude� are�saturated�to�be�soften�form�rupture�surface;�the�landslide�have�seasonal,�gradual,�low�angle�characteristics.�
�Keywords� freeway,� bedding� landslide,� formation�mechanism,�stability���Introduction�
Landslide�is�a�natural�phenomenon�that,�rock�and�soil�on�the� slope,� affected� by� river� scour,� groundwater� activity,�earthquake,� artificial� cutting� slope� and� other� factors,�under� the� action� of� gravity,� slide� down� along� a� weak�plane�or�zone�(Kong�et�al.�2008;�Qiao�2002).�High�grade�highway�constructed�in�mountain�area,�due�to�its�special�geology,� geomorphology,� hydrology� and� climatic�condition,� often� appear� landslide� hazards� (Sun� et� al.�
2008).� Landslide� often� interrupts� the� traffic,� affect� the�normal� transportation� of� highway,� large�scale� landslide�can�block�the�river,�destroy�highway,�destruct�factory,�has�great� harms�on� building� and� traffic� facility� in�mountain�area�(Zhu�et�al.�2007;�Li�et�al.�2011).�
Bei’an�to�Heihe�highway�utilizes�the�original�second�class� highway� to� widen� and� expand� for� freeway� in�Heilongjiang�province�of�China,� in�the�first�stage�project�construction�process,�many� sections� subgrade� and� slope�of�K159+000�K184+000�section�which�traverses�the�Lesser�Khingan� Mountains� occurred� landslide,� in� the� most�serious� K176+500�K179+300� section,� the� subgrade� lost�stability�due�to�landslides�after�construction,�were�forced�to� change� the� route� to� build� (Shan� et� al.� 2012).� Design�stage� investigation� results� show� that� some� sections� are�located� in� landslide� body� (see� Fig.� 1),� affected� by�landform,� topography,� rainfall,� freeze�thaw� and� other�factors,�foundations�are�in�unstable�state,�bring�enormous�difficulties� to� widening� and� expanding� implementation�(Jiang�et�al.�2012).�
Therefore,� need� comprehensively� analyze� the�mechanism,� scale� and� hazard� of� landslide;� accurately�reflect� the� characteristic,� occurrence� and� development�law�of� landslide,�so�that�can�employ�effective�prevention�and� remediation� measures� in� the� freeway� construction�period� (Long� et� al.� 2010).�This� article� took� the�Bei'an� to�Heihe�freeway�K178+530�section�landslide�as�the�research�object,� employed� field� survey,� topographic� mapping,�geological� drilling,� indoor� test,� numerical� simulation,�field� monitoring� and� theoretical� analysis� methods� to�carry�an�integrated�study�on�the�formation�mechanism�of�the�landslide.�
��
Natural�geographic�condition�of�study�area�
The� study� area� is� located� in� the�China's� Lesser�Khingan�Mountain� island� permafrost� region.� The� climate� of� the�area�belongs�to�continental�monsoon�climate,�the�spring�gets�warm�quickly,�the�summer�is�tepidity�and�rainy,�the�autumn� gets� cool� fast,� the�winter� is� long� and� cold.� The�annual� average� temperature� is� �0.6 ,� the� lowest�temperature�is��48.1 ,�the�highest�temperature�is�35.2 ;�the� frost� free� period� is� short,� only� 90�125� days.� The�average� annual� precipitation� is� 530�552mm,� and� the�rainfall�concentrates�in�July�to�September�of�the�summer,�accounts� for� about� 61�67%�of� annual� total� precipitation.�
4

Jiang�Hua,�Shan�Wei*,�Hu�Zhaoguang–Bedding�Landslide�Formation�Mechanism�and�Traits�in�Lesser�Khingan�Mountain�
The�ground�surface�of�the�area�can�form�seasonal�frozen�soil,�the�time�of�ground�reaching�maximum�frozen�depth�is� the� late� of�May,� and� the�maximum� seasonal� freezing�
depth� is� 2.26�2.67m.� There� are� many� island� permafrost�distributed�in�the�cheuch.��
�
�
Figure�1�Aerial�view�of�Bei’an�to�Heihe�freeway�landslide�section�
�
The�research�area�is�hilly�topography,�relative�height�difference� is� not� big,� and� part� of� slope� is� steep.� The�tectonic�is�in�the�Wuyun�Jieya�new�rift�zone,�the�south�is�Shuhe� upwarping� zone� and� the� north� is� Handaqi�virgation.�Surface�exposed�stratum:�the�upper�Cretaceous�Nenjiang� formation,� Tertiary� Pliocene� series� Sunwu�formation,�and�Quaternary�Holocene�series�modern�river�alluvium� and� stack� layers.� Rock� is� bedded,� weak�cementation�and�weathering�resistant�ability,�weathering�depth� is� larger,� near� surface� portion� substantially�weathered.�According� to� the� aquiferous�medium,� supply�and� drainage� conditions,� groundwater� is� divided� into�Cretaceous� pore� water,� Tertiary� pore� water� and�Quaternary�pore�water�three�kinds.�
��
Field�survey�
We� carried� out� geological� survey� and� topographic�mapping� work� in� the� study� area,� found� five� landslides�distributed�in�the�study�section,�this�article�aimed�at�the�K178+530�landslide,�as�show�in�the�Fig.�1�“C”�area.�
The�landslide�is�located�in�the�valley.�The�flat�shape�of�landslide�body�presents�a�tongue�(see�Fig.�2).�There�are�
conspicuous� arc� dislocation� and� ponding� on� the� tailing�edge� of� the� landslide,� upheaval� on� the� front� of� the�landslide�and�cracks�on�the�surface�of�the�landslide�body�(see�Fig.�3).�
�
�
Figure�2�Topography�of�the�K178+530�landslide�region.�
5

Proceedings�of�the�IPL�Symposium,�UNESCO,�Paris,�2012
�
�
Figure�3�Landform�characteristics�of�the�K178+530�landslide�
�
Geological�exploration�
To� survey� the� geological� condition� of� the� landslide,� we�arranged�4�drilling�holes� and�6� resistivity�measure� lines,�drilling� holes� position� as� shown� in� Fig.� 2.� According� to�the� drilling� and� resistivity� surveying� results,� drew� the�
engineering� geological� profile� (see� Fig.� 4).�Deformations�monitoring� equipments,� temperature� and� pore� water�pressure� sensors� were� respectively� embedded� in� the�drilling�holes.�
�
�
Figure�4�K178+530�landslide�engineering�geological�profile.�
�
The� surface� of� landslide� area� mainly� consists� of�Tertiary�pebbly� sandstone�and� subgrade� spoil,�high�void�ratio� and�weak� integrity.� There� are�many� cracks� on� the�subgrade�spoil�surface,�and�large�free�water�in�the�cracks.�Underlying� subgrade� spoil� and� silty� clay,� completely�weathered�mudstone�and�sandstone�are�relatively�dense.�
Through�indoor�test,�permeability�coefficient�of�subgrade�spoil� is�6.19×10�8cm/s,�silty�clay� is�3.84×10�8cm/s,�Tertiary�pebbly� sandstone� is� 4.11×10�4cm/s,� completely�weathered�mudstone� is� 6.34×10�6cm/s,� and� completely� weathered�sandstone�is�2.12×10�7cm/s.�There�are�many�cracks�on�the�slope� surface� and� the� permeability� coefficient� of� the�
6

Jiang�Hua,�Shan�Wei*,�Hu�Zhaoguang–Bedding�Landslide�Formation�Mechanism�and�Traits�in�Lesser�Khingan�Mountain�
upstream� pebbly� sandstone� is� larger,� the� permeability�coefficient�of�the�subgrade�spoil�and�silty�clay�is�smaller,�when�the�water�penetrates�downward�and�accumulates�at�the� bottom� of� subgrade� spoil� and� silty� clay,� the� water�content� of� it� increased� gradually,� shear� strength�decreases� significantly.� This� judgment,� the� landslide�belongs�to�bedding�landslide,�rupture�surface�is�located�at�the�bottom�of�subgrade�spoil�and�silty�clay.�
��
Landslide�stability�numerical�simulation�Limit�equilibrium�method�is�the�most�mature�method�in�landslide�stability�study.�The�limit�equilibrium�method�is�characterized� in� that� only� considers� static� equilibrium�
condition�and�soil�Mohr�Coulomb�failure�criterion,�need�assume� rupture� surface� during� calculating.� Compared�with� limit� equilibrium,� finite� element� method� namely�considers�the�soil�static�equilibrium,�also�meets�the�strain�compatibility� and� stress� strain� constitutive� relation,� can�serve� as� a� more� rigorous� theoretical� system� for� slope�stability� analysis,� it� needn’t� assume� the� shape� and�position� of� rupture� surface,� determines� the� stability� of�landslide�through�stress�and�strain�analysis.�
Based� on� geological� survey� and� indoor� test� results,�employed� the� finite� element� method� to� simulate� the�safety� factor� of� K178+530� landslide.� Rock� and� soil� finite�element�calculation�parameters�are�shown�in�Tab.�1.�
�
Table�1�Physical�and�mechanical�parameters�of�K178+530�landslide�calculation�model.�
Rock�and�soil�name� Unit�weight(g/cm3)�
Cohesion�(kPa)�
Friction�angle�
(degree)�
Modulus�of�elasticity�(MPa)�
Poisson's�ratio�
Subgrade�spoil� 1.87 13 1.5� 0.63� 0.47Silty�clay� 1.91 14.2 7.2� 2.2� 0.43Pebbly�sandstone� 1.98 5.9 31� 28� 0.22Completely�weathered�mudstone�and�sandstone 1.76 23.4 11� 58� 0.35Highly�weathered�mudstone�and�sandstone� 1.83 35.6 13� 75� 0.33Moderately�weathered�mudstone� 1.89 48.3 17� 90� 0.30
�
During�surveying,� the�subgrade�spoil�water�content�is�37.1%�and�saturation�is�0.953,�slity�clay�water�content�is�28.7%� and� saturation� is� 0.925,� the� slope� safety� factor� is�1.02,� the� landslide� total� deformation� before� damage� is�shown�in�Fig.�5.�The�landslide�is�in�the�limit�equilibrium�
state,� when� the� surface� soil� saturated� with� water� or�abandon� soil� loading� or� filling� subgrade,� the� landslide�will� slide,� and� directly� affect� the� stability� of� subgrade�slope.�
�
�
Figure�5�K178+530�Landslide�total�deformation�cloud�map�before�damage.�
�
Field�monitoring�After� surveying,� we� began� to� collect� monitoring� data,�found� that� ZK1� and� ZK2� deformation� monitoring� pipe�were�sheared�respectively�in�the�depth�of�6.5m�and�4.2m�under� the� ground;� dislocation� on� the� landslide� trailing�edge� increased,� striation� appeared� on� the� both� sides� of�landslide,� cracks�on� the� landslide�body� increased.�Based�
on� these� data� and� phenomena,� judged� that� the� slope�occurred� slide.� At� that� same� time,� employed� GPS� to�monitor� the� tube� nozzle� moving� data� (see� Fig.� 6),� and�paid�attention�to�the�pore�water�pressure�data�(see�Fig.�7),�ground� temperature� data� (see� Fig.� 8)and� deformation�data�of�ZK3,� the�vertical� and�horizontal�displacement�of�ZK3�were�very�small.�
7

Proceedings�of�the�IPL�Symposium,�UNESCO,�Paris,�2012
The� landslide� began� to� slide� at� the� rainy� season,�pore� water� pressure� of� the� region� was�max� of� the� year,�and�reached�the�steady�state�until�winter,� the�maximum�horizontal� displacement� respectively� reached� 32.2� and�60.0m,� the� landslide� formation� is� mainly� influenced� by�precipitation.�The�landslide�slid�again�in�the�spring�melts�
period�of�the�following�year,�the�seasonal�frozen�soil�layer�of� the� area� was� completely� melted� at� that� time,� pore�water� pressure� increased� rapidly,� and� the� maximum�horizontal� displacement� respectively� reached� 50.8� and�91.5m,� landslide� sliding� again� is� mainly� influenced� by�frozen�soil�melting�and�snowmelt.�
�
0
2000
4000
6000
8000
10000
12000
10-7
-22
10-9
-20
10-1
1-19
11-1
-18
11-3
-19
11-5
-18
11-7
-17
11-9
-15
11-1
1-14
12-1
-13
12-3
-13
12-5
-12
12-7
-11
12-9
-9
Time (d)Hor
izon
tal d
ispl
acem
ent(c
m)
131.0m from the centerline(ZK1)33.0m from the centerline(ZK2)
�
Figure�6�Curve�of�nozzle�horizontal�displacement�changes�with�time.�
-5
05
1015
2025
3035
40
10-7
-22
10-8
-21
10-9
-20
10-1
0-20
10-1
1-19
10-1
2-19
11-1
-18
11-2
-17
11-3
-19
11-4
-18
11-5
-18
11-6
-17
11-7
-17
11-8
-16
11-9
-15
Time (d)
Pres
sure
(kPa
) 3.2m under ground6.5m under ground
�
Figure�7�Curve�of�ZK3�pore�water�pressure�changes�with�time.�
-6
-2
2
6
10
14
18
22
10-7
-22
10-8
-21
10-9
-20
10-1
0-20
10-1
1-19
10-1
2-19
11-1
-18
11-2
-17
11-3
-19
11-4
-18
11-5
-18
11-6
-17
11-7
-17
11-8
-16
11-9
-15
Time (d)Tem
pera
ture
()
0.5m under ground
1.0m under ground
1.5m under ground
2.0m under ground
2.5m under ground
�
Figure�8�Curve�of�ZK3�ground�temperature�changes�with�time.�
�
8

Jiang�Hua,�Shan�Wei*,�Hu�Zhaoguang–Bedding�Landslide�Formation�Mechanism�and�Traits�in�Lesser�Khingan�Mountain�
�Landslide�formation�mechanism�Formation� and� development� of� the� landslide� is� mainly�affected� by� the� landform,� climate� and� water,� geological�condition�and�other�factors.�
Topography� condition:� topography� of� landslide� is�upper� steep� and� lower� gentle,� around� high� and�intermediate�low(see�Fig.�9),�is�avail�for�surface�water�and�ground� water� to� assemble� in� landslide;� the� rupture�surface�is�so�gentle�to�retain�water�for�a�long�time.�
The� effect� of� climate� and� water:� atmospheric�precipitation,� snowmelt�water�and� seasonally� frozen� soil�thawing� water� constantly� supply� the� Quaternary� pore�water.�Under�the�action�of�water,�unit�weight�of�the�slide�body�increases�and�shear�strength�of�rupture�surface�rock�and�soil�decreases.�
Geological� condition:� surface� cracks� and� shallow�high� permeability� rock� and� soil� provide� infiltration� and�lateral�runoff�channel�for�surface�water�and�ground�water;�dense� subgrade� spoil� and� silty� clay� form� aquiclude,�subgrade� spoil� and� silty� clay� of� the� aquiclude� are�influenced�by�the�Quaternary�pore�water�to�be�saturated,�shear� strength� decrease� dramatically� and� form� rupture�surface.��
�
Figure�9�Landform�vector�graph�of�landslide�region�
�
Conclusions�This�article�employed�the�geological�survey,� topographic�mapping,� geological� drilling,� geophysical� exploration,�indoor� test,� numerical� simulation,� field�monitoring� and�theoretical�analysis�methods�to�carry�an�integrated�study�on� the� formation� mechanism� of� the� Bei'an� to� Heihe�freeway�K178+530�landslide,�drew�the�conclusions�that:�
The� K178+530� landslide� belongs� to� bedding�landslide,� rupture� surface� is� located� at� the� bottom� of�subgrade�spoil�and�silty�clay.�
During� survey,� the� landslide� is� in� the� limit�equilibrium�state,�directly�affects�the�stability�of�subgrade�slope.�
Atmospheric� precipitation,� snowmelt� water� and�seasonally�frozen�soil�thawing�water�provide�a�continued�water� source� for� landslide;� surface� water� and� ground�water� supply� the� Quaternary� pore� water� by� infiltration�and� lateral� runoff� through� surface� cracks� and� shallow�high� permeability� rock� and� soil;� low� permeability� rock�and�soil�under�the�loose�overburden�form�aquiclude,�rock�and�soil�of�the�aquiclude�are�saturated�to�be�soften�form�rupture�surface.�
Due�to�the�special�climate,�landform�and�geological�condition,�the�landslide�have�seasonal,�gradual,�low�angle�characteristics.��
�Acknowledgments�
This� work� was� financially� supported� by� the� key� science�and�technology�project�of�Heilongjiang�Communications�Department� “Study� on� Subgrade� Stability� Controlling�Technology� of� Freeway� Expansion� Project� Permafrost�Melt�and�Landslides�Sections”�(2011318223630).�
���*Corresponding� author:�Wei� Shan� (1965�� ),�male,�professor,�doctor�of�Engineering,�doctoral�tutor.�Research�interests:�disaster�prevention�and�mitigation�of�road�and�bridge�engineering.�Email:�[email protected]��References�(in�the�alphabetical�order)�
Jiang�H,�Shan�W�(2012)�Formation�mechanism�and�stability�analysis�of� Bei’an�Heihe� Expressway� expansion� project� K178+530�landslide.�Advanced�Materials�Research�368�373:953�958�
Kong� FL,� Chen� C,� Sun� GJ� (2008)� Application� of� multi�electrodes�electrical�method�to�landslide�investigation�in�Qingjiang�Shuibuya�Reservoir.� Chinese� Journal� of� Engineering� Geophysics� 5(2):201�204�
Li�DQ,�Han�WX,�Pang�MK�(2011)�Seepage�analysis�of�landslide�under�condition�of�water�level�falling�in�Three�Gorges�Reservoir.�Water�Resources�and�Power�29(1):85�88�
Long�JH,�Guo�WB,�Li�P�(2010)�Creep�property�of�soil�in�sliding�zone�of�loess� landslide.� Chinese� Journal� of� Geotechnical� Engineering�32(7):1023�1028�
Qiao�JP�(2002)�Structure�and�shape�of� landslide.�Chinese�Journal�of�Rock�Mechanics�and�Engineering�21(9):1355�1358�
Shan� W,� Jiang� H,� Cui� GH� (2012)� Formation� mechanism� and�characteristics�of�the�Bei’an�to�Heihe�Expressway�K177�landslide.�Advanced�Materials�Research�422:663�668�
Sun� QH,� Xu� HW,� Zhang� YQ� (2008)� Application� of� high� density�resistivity�method� in� highway� road� landslide�prediction.� Journal�of�Guizhou�University�of�Technology�37(6):101�105�
Zhu� YS,� Li� HJ,� Cao� NE� (2007)� Finite� element� method� research� on�road� slide� stability� analysis.� Journal� of� Highway� and�Transportation�Research�and�Development�24(4):39�42�
9

�������Proceedings�of�the�IPL�Symposium,�UNESCO,�Paris,�2012�
�
Using� High�density� Resistivity� Method� to� research� on� permafrost�landslide�
Wei�Shan(1),�Zhaoguang�Hu(1),�Hua�Jiang(1),�Ying�Guo(1)�,�Chunjiao�Wang(1)�1) Northeast�Forestry�University,�Harbin,�China,�150040 [email protected]�
�
Abstract� Bei’an� to� Heihe� expressway� utilizes� the�original�second�class�highway�to�widen�and�expand�for�expressway,� it� is� restricted� by� the� original� location� of�old� road,� widen� subgrade� of� some� sections� locate� in�tailing� edge� of� the� landslides.� The� formation� and�development� of� the� landslide� at� K178+530� section� of�Bei’an�Heihe� Expressway� mainly� affected� by� the�topography,� engineering� geology,� hydrology� and�climate� characteristics.� Special� topography,� loose�stratum,� active� groundwater,� intense� freeze�thaw�erosion� and� human� engineering� activities� are�material�conditions�and�power�factor�of�the�landslide.�In�process�of� landslide� researching,�we�use�geological�drilling�and�high� density� resistivity� method� to� research� formation�mechanism� of� landslide� group� along� the� expressway.�The� results� show� that:� the� high�density� resistivity�technology� and� the� drilling� exploration� come� to� the�same� result� at� the� position� of� the� landslide� sliding�surface;� the� landslide� soil� resistivity� values� show� a�significant�difference�before�and�after� the� landslide.�At�the�period�when�the� landslide�had�not�yet� formed,� the�landslide�resistivity�value�had�no�obvious�stratification,�and� had� no� mutation� phenomenon� of� the� resistivity.�After�the�formation�of�the�landslide,�the�resistivity�value�at� the� sliding� surface� location� showed� significant�stratification,�and�the�resistivity�values�of�its�upper�and�lower�were�more�obvious�differences.�
�Keywords� Landslide,� Movement� Mechanism,� Drilling�exploration,�High�density�resistivity�method.���Foreword�
Landslide�is�a�natural�phenomenon�that,�rock�and�soil� on� the� slope,� affected�by� river� scour,� groundwater�activity,� earthquake,� artificial� cutting� slope� and� other�factors,�under�the�action�of�gravity,�slide�down�along�a�weak�plane�or�zone�(Gu�TF�et�al.�2009;�He�YX�et�al.�1991).�High�grade�highway�constructed�in�mountain�area,�due�to� its� special� geology,� geomorphology,� hydrology� and�climatic� condition,�often�appear� landslide�hazards� (Hu�ZG� et� al.� 2011).� Landslide� often� interrupts� the� traffic,�affect�the�normal�transportation�of�highway,�large�scale�landslide�can�block�the�river,�destroy�highway,�destruct�factory,�has�great�harms�on�building�and�traffic� facility�
in�mountain�area�(Li�TL�et�al.�2003;�Liu�LH�et�al.�2007;�Hu�RL�et�al.�2010).�
Researches� on� landslide� in� cold� regions�were� less�in�Lesser�Khingan�Range�of�Heilongjiang�province.�It�is�high� latitudes� permafrost� regions,� the� ground� slope� in�landslide�area� is� low� (Yang�T�et� al.� 2010;�Hu�LW�et� al.�2005;� Duan� YH� 1999).� The� formation� mechanism� and�movement� characteristics� of� landslide� have� their�particularity.� At� present,� the� theory� and� practice� were�immature�in�this�research.�
This�article�units�the�results�of�drilling�exploration�and� high�density� resistivity� method� to� research� on�formation�mechanism�of�landslide�in�permafrost�region.�Study� area� is� at� K178+530� section� of� Bei’an�Heihe�expressway,� located� in� Lesser� Khingan� Range� central�region,� in� the� high� latitude� permafrost� degradation� of�China.� We� use� drilling� exploration� to� survey� the�landslide� geologic� characteristic,� uniting� the� high�density�resistivity�method�to�detect�the�resistivity�of�the�landslide.� analysing� landslide� geologic� characteristics�variation� and� internal� physical� characteristics,�endeavouring� to� find� a� new� breakthrough� in� the�research�on�this�type�of�landslide.�
��
General�situation�of�the�study�area�
Geographical�conditions�of�the�study�area�The� study� area� geographical� position� showed� in�
figure� 1.� It� locates� in� Lesser� Khingan� Range� central�region,� in� the� high� latitude� permafrost� degradation� of�China.� The� climate� of� the� area� belongs� to� continental�monsoon� climate,� the� spring� gets� warm� quickly,� the�summer�is�tepidity�and�rainy,�the�autumn�gets�cool�fast,�the� winter� is� long� and� cold.� The� annual� average�temperature�is��0.6 ,�the�lowest�temperature�is��48.1 ,�the�highest�temperature�is�35.2 ;�the�frost�free�period�is�short,� only� 90�125� days.� The� average� annual�precipitation� is� 530�552mm,� and� the� rainfall�concentrates� in� July� to� September� of� the� summer,�accounts�for�about�61�67%�of�annual�total�precipitation.�The�ground�surface�of�the�area�can�form�seasonal�frozen�soil,� the� time� of� ground� reaching� maximum� frozen�depth� is� the� late� of� May,� and� the� maximum� seasonal�freezing� depth� is� 2.26�2.67m.� There� are� many� island�permafrost�distributed�in�the�cheuch.�
10

Wei�Shan,�Zhaoguang�Hu���Using�High�density�Resistivity�Method�to�research�on�permafrost�landslide�
K178+530� landslide� located� at� the� left� side� of� the�embankment�road,�as�showed�in�figure�2.�Road�abandon�soil� and� subgrade� filling� soil� slide� along� the� gully,�The�178+530�landslide�presents�a�tongue�shape,�and�its�width�is� 20� ~� 30� meters,� its� acreage� is� about� 5000m2,� the�distance� from� toe� to� rear� edge� is� about� 200m,� the�
elevation�of�toe�is�254m,�and�the�elevation�of�rear�edge�is�285m.�Leading�edge�of�the�landslide�pushes�up�humus�soil� of� original� ground� surface� to� slide� forward.� And�arcuate�dislocation�in�the�rear�edge,�the�dislocation�was�in�rang�of�widen�subgrade.�There�is�trees�tilt�at�leading�edge�of�the�landslide.�
�
�Figure�1�K178+530�section�geographical�position�
�Figure�2�K178+530�landslide�photo�
11

�Proceedings�of�the�IPL�Symposium,�UNESCO,�Paris,�2012
�Study�area�engineering�geological�conditions�In� our� research,� we� did� drilling� exploration,� and� 4�drilling�holes�were� arranged� in� the� area,� the�depths�of�these� drill� holes� are� 14� ~� 26m,� drilling� holes�arrangement�are�shown�in�Figure�3.��
�Figure�3�Drilling�holes�arrangement�of�K178+530�section�
In� the� research� section� the� soil� distribution� is� as�follow:� Quaternary� loose� sediment,� tertiary� pebbly�sandstone,� Cretaceous� mudstone� and� sandstone.�Geological� profile� as� shown� figure� 4.� Subgrade� soil:�yellow� and� very� wet,� that� is� mainly� loose� hybrid�material� including� tertiary� pebbly� sandstone,�
Cretaceous�mudstone� and� sandy�mudstone,� it� is� loose�when�dry,�and�soft�plastic�once�saturated.�Clay:�yellow,�soft� and� plasticity,� dry� strength� and� large� toughness.�Silty� clay� located� in� the� depth� of� 1.5~3.8m� on� upper�sector� of� landslide,� and� in� the� depth� of� 0~6.7m� on�middle� and� lower� sector� of� landslide,� and� there� are�more�than�one�sand�sandwich� layers� in�silty�clay� layer,�single�layer� thickness� is� about� 1~10cm,� which� greatly�increases� the� ability� of� water� permeability.� Tertiary�pebbly� sandstone:� located� in� the�depth�of� 3.8~4.5m�on�the� upper� sector� of� the� landslide,� and� its� component�including� long� stone� and� sand� mineral,� weathered� ,�slightly� wet,� and� minus� cement� with� loose� sand� and�good�gradation,� the�ability�of�water�permeability� is�vey�good.�Weathered� siltstone:� yellow,� it� is� located� in� the�depth�of�4.5~14.3m�on�the�upper�sector�of�the�landslide.�Sandy� structure,� bedding� construction� and� bad�permeability.� Weathered� mudstone:� yellow� or� black�grey,�muddy�structure�and�layered�structure,�poor�water�resistance� to� soften,� and� bad� water� permeability.�Strongly� weathered� mudstone:� black�grey,� muddy�structure� and� layered� structure rocks� in�unconsolidated.� Medium� weathered� mudstone:� brow�and�black�grey�muddy�structure�and�layered�structure.�
�
�Figure�4�Geological�profile�of�K178+530�section�
�Landslide�formation�mechanism��The� formation� and� development� of� K178+530� section�landslide�mainly�affected�by�the�topography,�engineering�geology,� hydrology� and� climate� characteristics,� specific�geography,� inattentive� layer,�active�groundwater,� intense�freeze�thaw�erosion�and�human�engineering�activities�are�material�conditions�and�power�factor�of�the�landslide�(Li�YH�et�al.�2002;�Zhu�YS�et�al.�2007).�
The� landslide� belongs� to� superficial� and� bedding�landslide� in� permafrost� region,� sliding� rapidly.� In� the�rainy� season� and� melting� period� in� spring� landslide� is�easy� instability.� tympanic� cracks� on� the� landslide� are�
beneficial� to� permeate� and� stockpile.� High� permeable,�surface� soil� grit� layer� and� silty� clay� in� weathered� sand�provides� passage� for� water� infiltration.� The� infiltration�capacity�in�lower�mudstone�and�siltstone�was�very�small,�and� formed� water�resisting� layer,� Rainfall,� snowmelt�water,� fissure� water� and� thawed� frozen� soil� which�Produced� water� were� cut� off� by� frozen� soil� and�impervious� layer� in� the� process� of� infiltration.� It� is� the�main�cause�that�the�area�form�landslides.�In�late�July�2010,�the�landslide�started�to�slide.�
Freezing� and� thawing� have� far�reaching�consequences� for� the� landslide,� exhibiting� intermittent�
12

Wei�Shan,�Zhaoguang�Hu���Using�High�density�Resistivity�Method�to�research�on�permafrost�landslide�
slide�and�bench�slope,�and�there�are�Drumlin�fields�on�the�landslide�slope.�
Slip� surface� of� upper� sector� is� in� the� depth� of� 4.5�meters,� located� at� the� interface� of� gravel� sand� and�siltstone,�the�soil�under�sliding�surface�is�siltstone�of�weak�penetrating�power.� Slip� surface� of� the�middle� and� lower�sectors� is� in� the� depth� of� 6.5� meters,� located� at� the�interface�of�silty�clay�and�mudstone,�the�soil�under�sliding�surface�is�mudstone�of�weak�penetrating�power.�
��Based�on�High�density�resistivity�method�for�surveying�landslide�
High�density�resistivity�method�measuring�line�layout�During� application� of� high� density� resistivity�method� in�K178+530� section,� we� use� 2DRES� 2D� high�density�resistivity� method� inversion� software� to� inverse� least�square�method,�inversion�of�the�program�we�use�is�based�on� least� square� method� which� based� on� quasi�Newton�algorithms�for�Nonlinear�optimization,�and�module�width�is� set� to� one�second� unit� electrode� spacing� to� improve�monitoring�precision.�To�ensure�depth�and�accuracy,�the�unit�electrode�spacing�is�3.0�meters�in�the�test,�sounding�almost�30�meters.��
At� the� K178+530� landslide� section,� as� the� centre� of�the� landslide� 9� high� density� resistivity� method� survey�lines�have�been�emplaced,�as�shown�in�Figure�5.��
Along� the� slope� tendency� laying� a� total� of� 5� survey�lines,�which�was�named�as�the�longitudinal�1,�2,�3,�4�and�5�respectively,�electrodes�numbers�arrangement�as�follows:�from�medial�divider�of� road� to� leading�edge�of� landslide�orientation� layout� 1~60� in� turn.� The� position� of�longitudinal�1�and�5�survey�lines�are�5�meters�out�of�both�sides� of� the� landslide;� Longitudinal� 2� and� 4� are� on� the�landslide,�at�the�distance�of�about�2.5m�from�the�edge�of�the� landslide� respectively.� Longitudinal� 3� is� on� the�landslide,� located� in� the�middle� of� landslide.�We� laid� 4�survey� lines� perpendicular� the� direction� of� landslide,�which�were�named�as�the�transverse�1,�2,�3�and�4.�and�the�
location�are�30�m,�90�m,�110�m�and�140�m��away�from�the�trailing� edges�of� landslide,� electrode� codes�number� 1~60�are� decorated� from� left� to� right.� During� the� test�procedure,�Winner�arrangement�method�is�all�used.�Five�Detection� times�of� each�survey� line,� the�date� is� June� 1st,�2010,�September�10th,�2010,�November�1st,�2010,�and�June�10th,�2011,�respectively.�
�Figure�5��The�high�density�resistivity�measuring�line�
��
Contrast� resistivity� value� of� different� positions� on� the�landslide��Figure�6�showed�the�resistivity�inversion�images�along�the�centre� of� landslide� soil� (measuring� line� V3).� The�measuring�line�was�from�median�strip,�respectively�going�through�the�landslide�rear�edge�,�drilling�ZK2�and�drilling�ZK1� location�and� stretching� into� 177m�along� landslide� to�where� is� 32m� distance� from� forefront� of� landslide,� the�distance�of� landslide�back�edge,�drilling�ZK2�and�drilling�ZK1�location�from�the�first�electrode�respectively�are�9m,�and�42m,�and�96m.�From�the�figure,�we�can�knew�that�the�resistivity�of�landslide�soil�layered�apparently.�
�Figure�6�the�inversion�images�of�landslide�soil�resistivity�on��September�10,�2010�
Drilling� 1� position� was� away� from� the� first�electrode� 96�meters.� Depth� 0 2.1�meters� is� silty� clay,�which� containing� about� 15%� of� the� organic� matter� as�
grass� roots,� and� resistivity� value� is� 20� 67� � � m;�Depth�2.1 6.7�meters� is�silty�clay,� there�are�weathered�sand�samdwich�on�the�local�scale,�and�resistivity�value�is�
13

�Proceedings�of�the�IPL�Symposium,�UNESCO,�Paris,�2012
15 32� � �m;�Depth�6.7 8.0meters� is�mudstone,�and�its�structure�is�pieces,�and�resistivity�value�is�46 54m;� Depth� 8.0 26� meters� is� gray� mudstone,� where� is�close�to�ground�water�level�or�below�ground�water�level�in�the�underground,�and�resistivity�value�smaller�is�1035 m.� In� 0 2.1� meters� depth� is� silty� clay� that�contains�a�lot�of�grassroots,�water�down�the�plant�roots�to� infiltrate� is� easy;�Below�6.7�meters� is�mudstone,� the�permeability� coefficient� is� small,� water� is� difficult� to�infiltrate,�forming�water�resisting�layer.�Water�is�easy�to�gather� in� the� top�surface�of�mudstone� layer,�mudstone�in�water� softening�disintegration� and� easy� to� form� the�sliding� surface.� Due� to� the� local� weathered� sand�samdwich,� the� silty� clay� in� 2.1 6.7meters� depth� can�make�water� infiltrate�easily.�That� site’s� resistivity�value�was�as�shown�Figure�6�and�Figure�7.�
Drilling�2�position�distance�the�first�electrode�of�42�meters,� in� 0 4.5� meters� depth,� resistivity� value� was�10 27 m,� the� surface� layer� roadbuilding� abandon�soil� give� priority� to� silty� clay� (Depth� 0 3.8� meters),�resistivity� value� is15 27 m,� resistivity� value� of� sand�gravel� (Depth3.8 4.5meters)� is� 10 22 m.� Depth�4.5 9.7�meters�is�siltstone,�and�resistivity�value�is�2554� � � m.� Depth� 9.7 14.6� meters� is� sandstone,� and�resistivity�value� is�21 43 � �m;� In� the�4.5�meters,� the�position� of� sand� gravel� and� siltstone� handover,� the�resistivity� apparent� stratification.� Depth� 0 4.5meters,�the� soil� is� good� permeability,� water� infiltrates� easily;�Below� 4.5� meters� is� siltstone,� particles� smaller� and�seepage� ability� is� poor,� forming� water�resisting� layer.�The�soil�infiltration�to�4.5�meters�depth�location�is�easy�to�gather�and�form�the�sliding�surface.�These�resistivity�values�were�shown�as�Figure�6�and�Figure�8.�
-14
-12
-10
-8
-6
-4
-2
015 20 25 30 35 40
Resistivity �•m
Dep
thm
X-91.5mX-88.5mX-85.5m
-10
-8
-6
-4
-2
015 20 25 30 35 40
Resistivity �•m
Dep
thm
X-49.5mX-46.5mX-43.5m
����Figure�7�resistivity�curve�of�drilling�1�position�����������������������Figure�8�resistivity�curve�of�drilling�2�position�
The� resistivity� value� at� the� slip� surface� location�showed� significant� stratification,� and� the� resistivity�values� of� its� upper� and� lower� were� more� obvious�
differences.� According� to� the� typical� characteristic� of�the� slip� surface,� we� can� infer� the� position� of� sliding�surface�as�shown�in�figure�9.�
�Figure�9�Infer�the�position�of�sliding�surface�of�Line�V3�
�According� to� the� mutations� and� layering� of�
resistivity�value�at�landslide�position,�we�concluded�the�transverse� sliding� surfaces� position� of� landslide,� as�
shown� in� figure� 10�and� 11,� there�were� resistivity� images�of� measuring� line� H1� and� the� measuring� line� H2� on�September� 10,� 2010.� The� shape� of� Landslide� was�
14

Wei�Shan,�Zhaoguang�Hu���Using�High�density�Resistivity�Method�to�research�on�permafrost�landslide�
approximately� circular�arc�or� inverted� trapezoidal.�The�place� near� the� central� position� of� landslide� sliding�surface�was�deepest.�They�were�4.5�m�and�6.5�m�depth.�
The�position�both�walls�of�landslide�was�the�shallowest,�about�1�~�1.5�m�depth.�
�Figure�10�Infer�the�position�of�sliding�surface�of�Line�H1�� �
��
Figure�11�Infer�the�position�of�sliding�surface�of�Line�H2�
�Contrast�on�soil�resistivity�value�in�and�out�of�the�landslide�From� landslide� rear� edge� 90� meters� position,�perpendicular� to� the� landslide� line� (the�measuring� line�H2)� as� an� example,� we� contrasted� on� soil� resistivity�value� in� In� and� out� of� the� landslide.� Figure� 12� was�resistivity�image�of�measuring�line2�on�November�1�2010.�From� the� figure� we� could� know� that� resistivity� value�
image� out� of� the� landslide� only� appeared� higher�resistivity� in� the� surface,� resistivity� basically� presented�decreasing� along�with� the�depth.�The� resistivity� values�in�and�out�of� landslide�soil�were�obviously�differences.�There�were�mutations� and� layered� resistivity� values� in�sliding�surface.�These�resistivity�values�in�up�and�down�position�of�soil�layers�have�obvious�difference.�
�Figure�12�the�inversion�images�of�landslide�soil�resistivity�of�Line�H2�on�November�1�2010��
Figure�13�was�soil�resistivity�curve�in�landslide�and�figure�14�was�soil�resistivity�curve�out�of�landslide.�Both�resistivity�value�curve�of�difference�characteristics�
showed�that�the�resistivity�in�and�out�of�landslide�had�obviously�difference.�
15

Proceedings�of�the�IPL�Symposium,�UNESCO,�Paris,�2012
-10
-8
-6
-4
-2
00 10 20 30 40
Resistivity �•m
Dep
thm
-20
-15
-10
-5
00 10 20 30 40
Resistivity �•m
Dep
thm
������Figure�13�soil�resistivity�curve�in�landslide����������������������Figure�14�soil�resistivity�curve�outside�landslide�
��
Conclusions�
This� article� combines� drilling� exploration� and� high�density� resistivity� method� survey� on� the� formation�mechanism� and� geology� characteristics� of� K178+530�landslide,� and� master� their� formation� mechanism� of�landslide� in� permafrost� area� and� internal� dynamic�variation�of�soil,�and�obstain�conclusions�:�
(1)� The� landslide� belongs� to� superficial� and�bedding�landslide� in�permafrost�region,�sliding�rapidly.�The� soil� of� sliding� surface� is� silty� clay,� which� is� loose�when�dried,�and�soft�plastic;�snowmelt�water,�rainwater�and�fissure�water�provide�water�source�for�the�landslide;�tympanic� cracks� on� the� slope� are� beneficial� to�atmospheric� precipitation� pool� in� landslide� and�permeate� to� landslide,� high� permeability� of� landslide�soil� mass� provide� passage� for� water� infiltration;�mudstone� and� sandstone� with� low� permeability� form�aquifuge;�silty�clay�above�the�aquifuge� is� influenced�by�infiltration� water� to� reach� saturation,� forming� rupture�surface.� freezing� and� thawing� have� far�reaching�consequences� for� the� landslide,� exhibiting� intermittent�slide�and�bench�slope,�and�there�are�Drumlin� fields�on�the�landslide�slope.�
(2)� Resistivity� images� of� the� soil� outside� the�landslide� appear� high� resistivity� values� only� in� the�surface,� as� the� depth� increases,� and� resistivity� values�render� essentially� monotone� decreasing;� In� the�landslide� sliding� surface� location,� resistivity� rendering�mutation� hierarchies,� it� is� much� obvious� different�between�upper�and�lower�soil�resistivity�values�change.�According� to� the� characteristics� of� this� anomaly�mutations,� we� can� conduct� the� differential� sliding�surface� position� of� feature� flags� in� practice.� Using� the�high�density� resistivity�method� to� survey� the� landslide�and� its� surrounding,� accurately� to� detect� the� landslide�resistivity� value� at� different� locations,� according� to�characteristic� of� resistivity� value,� and� combined� with�drilling� results,� to� determine� the� position� of� sliding�
surface:�at�rear�edge,�the�position�of�sliding�surface�was�at�the�depth�of�3.2�meters�apart�from�the�ground;�at�30�meters�apart� from�rear�edge,� sliding�surface�was�at� the�depth� of� 4.5� meters;� at� the� middle� landslide,� sliding�surface� was� at� the� depth� of� 6.5� meters;� near� the�landslide� toe,� sliding� surface� was� at� the� depth� of� 4�meters,�at�toe�position,�sliding�surface�was�at�the�depth�of�2.5�meters.�
(3)�The�high�density�resistivity�technology�and�the�drilling� exploration� come� to� the� same� result� at� the�position� of� the� landslide� sliding� surface.� It� concludes�that� the� high�density� resistivity� technology� is� a� quick,�economic�and�reliable�test�method�at�site.�It�can�quickly�and� correctly� measure� the� position� of� the� landslide�sliding�surface�when�high�density�resistivity�technology�and� the� drilling� exploration� are� used� together,� it� can�prove� correctly� reference� to� Linear� engineering�positioning�and�the�relevant�project�measure.�
�Acknowledgments�
This� work� was� financially� supported� by� Heilongjiang�Communications� Department� project� and� subtopic� of�the� western� communication� science� and� technology�project� “Study� on� Subgrade� Stability� Controlling�Technology� of� Expressway� Expansion� Project�Permafrost�Melt�and�Landslides�Sections”.�*Corresponding� author:� Wei� Shan� (1965�� ),� male,�
professor,� doctor� of� Engineering,� doctoral� tutor.�Research� interests:� disaster� prevention� and� mitigation�of�road�and�bridge�engineering.�Email:�[email protected]��References�(in�the�alphabetical�order)�
Duan� YH� (1999)� Basic� characters� of� geo�hazards� and� its�development� trend� in�China.�Quaternary�Sciences.�19(3):�208�216.�
16

Wei�Shan,�Zhaoguang�Hu���Using�High�density�Resistivity�Method�to�research�on�permafrost�landslide�
Gu� TF,� Wang� JD,� Lu� X,� Meng� YL.� Characteristics� and� stability�analysis�of�accumulations�landslide�No.3�in�Tuoba�of�Southeast�Tibet.�Journal�of�Natural�Disasters,�2009.�
He� YX.� Application� of� D.C.Electric� Sounding� for� the� Permafrost�Exploration� along� Xinjiang�Xizang� Highway� [J].Journal� of�Glaciology�and�Geocryology,�1991.�
Hu�ZG,� Shan�W.�Application�of�Geological�Drilling� combined�with�High�density� resistance� in� Island� Structure� Permafrost� Survey.�The� International� Conference� on� Electronics,� Communications�and�Control�(ICECC2011).�
Hu�XW,�Tang�HM,�Liu�YR�(2005)�Verificatio�verification�of�transfer�coefficient� method� applied� to� landslide� stability� analysis� by�physical�model�test.�Rock�and�Soil�Mechanics.26(1):63�66.�
Hu�RL,�Wang�SS�(2010)�Main�feature�and�identification�method�of�sliding�surfaces� in� soil� and� rock� slopes.� Journal�of� Engineering�Geology.�18(1):�35�40.�
Li�TL,�Zhao�JL,�Li�P.�Analysis�on�the�Characteristics�and�Stability�of�the� No.� 2� Landslide� of� 102� Landslide� Group� on� Sichuan�Tibet�Highway.�Journal�of�Catastrophology,2003.�
Liu�LH,�Zhu�DY�and�Liu�DF�(2007)�Discussion�on�multiple�solutions�of� safety� factor� of� a� slope.� Rock� and� Soil� Mechanics,� 28� (8):�1661�1664.��
Li�YH,�Zhang�XY,�Cui�ZJ,�et�al�(2002)�Periodic�coupling�of�debris�flow�active� periods� and� climate� periods� during� Quaternary.�Quaternary�Sciences.�22(4):�340�347.�
Yang�T,�Zhou�DP,�Ma�HM,�et�al�(2010)�Point�safety�factor�method�for� stability� analysis� of� landslide.� Rock� and� Soil�Mechanics.31(3):971�975.�
Zhu�YS,�Li�HL,�Cao�NE,�et�al�(2007)�Finite�element�method�research�on� road� slide� stability� analysis.� Journal� of� Highway� and�Transportation�Research�and�Development.24�(4):39�42�
�
17

��
�������Proceedings�of�the�IPL�Symposium,�UNESCO,�Paris,�2012�
�
Large�scale�simulation�of�watershed�mass�transport�–�a�case�study�of�Tsengwen�reservoir�watershed�
Ko�Fei�Liu�(1,2),�Yi�Chin�Chen(2),��Ying�Hsin�Wu(1)�1)�Department�of�Civil�Engineering,�National�Taiwan�University,�Taipei,�Taiwan.�+886�2�3366�4366�2)�Hydrotech�Research�Institute,�National�Taiwan�University,�Taipei,�Taiwan.�
�
Abstract�We� present� the� large� scale� simulation� of�watershed� mass� transport,� including� landslide,� debris�flow� and� sediment� transport.�A� case� study� of� Tsengwen�reservoir�watershed�under� the�extreme� rainfall� triggered�by� the� typhoon� Morakot� is� run� for� verification.� This�approach� integrates� volume�area� relationship� formula�with� inventory�method�to�predict� time�varying� landslide�volume� and� distribution.� Then,� debris� flow� model,�DEBRIS�2D,� is� used� to� simulate� the� mass� transport� of�debris�flow�from�hillslope�to�fluvial�channel.�Finally�a�1�D�sediment� transport� model,� NETSTARS,� is� used� for�hydraulic� and� sediment� routing� in� river� and� reservoir.�The�results�give�a�very�good�agreement�with�the�sediment�concentration�variation�recorded�downstream.�
�Keywords�large�scale�simulation,�watershed,�DEBRIS�2D,�sediment�transport,�landslide��Introduction�
Landslide,� debris�flow,� and� sediment� transport� are�frequent� phenomenon� in� the� mountainous� area� in�Taiwan.�These�three�interrelated�geological�phenomenon�can� cause� the� mass� transport� from� the� hillslope� to� the�alluvial�fan.�When�typhoon�strikes�Taiwan,�heavy�rainfall�triggers�high�density�of�landslides�in�slopeland.�Then�the�deposit�material�from�landslides�is�mixed�with�rainfall�or�overland�flow�to�become�debris�flow�flowing�downstream�along� hillslope� or� fluvial� channel.� Finally,� mass� from�landslides�or�debris�flows�transports� into� fluvial� channel�to� increases� river� sediment� concentration.� This� chain� of�mass�transport�presents�multi�hazard�potential�to�human�lives,� property� and� water� resource� infrastructures.� A�comprehensive� approach� to� investigate� and� model� this�mass� transport� process� has� become� a� critical� issue� for�disaster�mitigation� and�water� resources�management� in�Taiwan.�
In� the� past� decades,� there� are� various� models�developed� to� simulate� landslides,�debris� flows,� sediment�transport� process� individually.� As� for� landslide,�researchers� has� used� empirical� or� physical� models� to�evaluate�the�landslide�susceptibility�(Guzzetti�et�al.,�2005�Chang�and�Chiang,��2009)�and�estimate�landslide�volume�(Khazai�and�Sitar,�2000;�Guzzetti�et�al.,�2009;�Klar�et�al.,�2011).� For� debris�flow� simulation,� several� numerical�models,�i.e.�FLO�2D,�RAMMS,�and�DEBRIS�2D,�have�been�
widely�used�in�debris�flow�assessment�(O’Brien�et�al.�1993;�Liu�and�Huang�2006,�Liu�et�al.,�2012).�Especially,�Liu�et�al.�(2012)� find� that� DEBRIS�2D� can� simulate� the� granular�debris� flow�triggered�by� landslide�very�well.� In�sediment�transport�studies,�various�hydraulic�models�are�developed�for� the� simulation�of� sediment� transport,� e.g.�HEC�RAS,�NETSTARS,�and�CCHE2D�(Rathburn�and�Wohl,�2001;�Lee�at�al.,�1997;�Lee�and�Hsieh,�2003;�Huang�et�al.,�2006).�
However,� a� comprehensive� model� for� simulating�this�coupled�mass�transport�process�has�not�seen.�In�this�study,� we� proposed� a� integrated� approach� to� simulate�watershed� mass� transport� process,� including� landslide,�debris�flow,� and� sediment� transport� from� slopeland� to�fluvial� channel.�A� case�of�Tsengwen� reservoir�watershed�under�extreme�rainfall�triggered�by�the�typhoon�Morakot�is�run�for�verification.��
In�what�follows�we�briefly�introduce�the�models�for�landslide,� debris� flow� and� sediment� transport.� The�procedure�of�this�integrated�simulation�is�also�presented.�Finally,� the� case� study� of� Tsengwen� watershed� is�demonstrated.�
�Methodology�
This� integrated� approach� can� be� separated� into�three�parts:��landslide�volume�estimation�and�generation,�debris�flow� simulation,� and� sediment� transport.� Firstly,�we�developed�a�model�of�landslide�volume�estimation�by�mapping� landslide� inventory�and�calculating� the�volume�production� of� individual� landslide� by� volume�area�relation.� Then,� we� calibrated� the� relations� between�rainfall� and� landslide� volume� to� develop� this� model.�Secondly,�we�treat�the�outputs�of�landslide�volume�as�the�initiation�condition�input�for�the�debris�flow�simulation,�and� then� simulate� transport� of� landslide� mass� using�DEBRIS�2D.� Finally,� we� use� the� simulation� results� of�DEBRIS�2D� to� be� the� sedimentary� boundary� condition�input� of� NETSTARS� to� simulate� the� hydraulic� and�sediment�transport�in�channel�and�reservoir.�The�detailed�descriptions�of�each�model�as�below:�
�Landslide�volume�model�
We� collect� event�based� inventory� data� covered�landslides�triggered�by�typho0n�and�heavy�rainfall�data�to�develop� empirical� relations� between� landslide� volume�and� rainfall.� Landslide� scars� in� the� inventory� were�
18

Liu�K�F,�Chen�Y�C,�Wu�Y�H�–�Large�scale�simulation�of�watershed�mass�transport�
mapped� manually� by� comparing� the� Formosa�2� and�SPOT�4� satellite� images� taken� before� and� after� typhoon�events.� Then,� the� volume� of� individual� landslide� was�estimated�by�using�a�volume�area�relation�as�below:�
�
L LV A��� ����������������������������������[1]��
where�VL� [m3]� is� landslide� volume;�AL� [m
2]� is� landslide�area;� �� and� �� are� calibrated� parameters.� To� link� the�landslide� volume� with� rainfall� variables,� Uchihugi’s�empirical� equation� (Uchihugi,� 1971)� was� used� to� model�the�volume�of�landslide�(Fig.�1):��
�
0( )rLV KA P P� � �����������������������������[2]��
where� K� and� r� is� calibrated� parameters;� A� is� area� of�watershed;� P� is� cumulative� rainfall,� and� P0� is� a� critical�rainfall�threshold.�The�parameters�K�and�r�are�calibrated�parameters�for�minimum�root�mean�square�error.��
�Figure�1��Landslide�volume�model.�
�Fig.� 1� shows� the� volume� change� for� different�
cumulative�rainfall.�Although�this�curve�is�obtained�from�event�based�data,�but�we�can� interpret� it�as� the� increase�of�volume�in�time�for�a�landslide.�Put�it�in�another�words,�if�this�landslide�event�occurs�suddenly�and�all�debris�slide�down� at� the� same� time,� we� still� treat� it� as� produced�gradually� in�time.�When�the�volume�is�small,� it�will�stay�in�the�original�location.�The�mass�will�slide�down�only�if�the�accumulative�mass�is�large�enough.��
With� this� interpretation,� hydrograph� of� the�landslide� volume� production� can� be� calculated� by� [2].�Volume� production� from� landslide� in� a� specified� time�interval�can�be�calculated�by�[3]�as�
�( ) ( 1)L L LV V t V t� � � � ���������������������������[3]�
�The� locations� of� landslide� are� determined� by� two�
approaches�in�this�model:� inventory�method�and�logistic�regression�model.� In�the� inventory�method,�we�assumed�
that� new� landslides� tend� to� be� reactivated� where� the�landslide� existed� before� in� the� past� event,� and� small�landslides�occurred�prior�to�large�landslide,�i.e.�landslides�occurred� in� the� order� of� its� size� sequentially.� On� the�other� hand,� we� also� use� logistic� regression� model� to�predict� the� landslide� probability.� For� the� logistic�regression� analysis,� we� weight� the� relationship� of�landslide� inventory� and� 11� independent� variables,�including�topographical�properties,�distances�to�different�geographical� features,� cumulative� rainfall,� and� lithology.�After�calibration�and�verification,�the�resulting�regression�model�of�landslide�inventory�is���
�logit( ) 1.390 0.025 0.382
0.085 0.012 0.0810.158 0.199 0.1290.001078 1.496.
y Elv Slp SinCos Wtn FaultRoad Ridge RiverRc Gel
� � � � � � �� � � � � �� � � � � �� � � �
���[4]�
�where�Elv�is�elevation�(m);�Slp�is�slope�( );�Sin�and�Cos�are�aspect� (1);�Wtn� is� witness� index� (1);� Fault,�Road,�Ridge,�and�River�are��distances�(m)�from�the�given�input�location;�RC� is� cumulative� rainfall� (mm);� Gel� are� lithology� (1)�coefficients�and�� listed�in�Tab.� 1.�Using�[4],�the� landslide�probability�can��be�evaluated�as���
�exp[logit( )]
1 exp[logit( )]ypy
�� .������������������������������[5]�
�where exp[ ] stands for the exponential function. The occurrence locations of landslide are determined by the grids with the probability in descending order. However, using logistic regression model, i.e. [4], the landslide volume is still undetermined. Therefore, in this study, we use the inventory method to predict the landslide volumes and distributions. �Table�1�Input�coefficients�of�lithology�for�Equation�[4]�
Lithology�Name� Abbreviation CoefficientsChangchihkeng Formation Cc 0.141Peiliao shale Pa �1.549Tangenshan Sandstone Tn �0.679Ailiaochiao Formation Al �0.756Chutouchi Formation Ct �0.118Maopu Shale Mp �0.055Terrace Deposits t �2.593alluvium a �0.187Hunghuatzu Formation Hh 0.392Sanming Shale Si 0.303Lushan Formation Ls �2.001�
Debris�flow�transport�simulation�Being� mixed� with� water� from� rainfall� or� overland� flow,�landslide� material� on� slopeland� forms� debris� flow� and�transports� downstream� into� the� fluvial� channel.� In� this�study,�this�process�is�simulated�by�DEBRIS�2D�model�(Liu�
19

Proceedings�of�the�IPL�Symposium,�UNESCO,�Paris,�2012
and�Huang,� 2006).� The� fundamental� theory� of� DEBRIS�2D� is� based� on� the� mass� and� momentum� conservation�with� shallow� water� assumption� and� depth�averaging�method.�The�adopted�constitutive�relation�between�shear�stress�and�strain�rate�is�proposed�by�Julien�and�Lan�(1991).�The�governing�equations�are�all�in�conservative�form�and�the� Cartesian� coordinates.� The� mass� conservation�equation�is�
�
0uH vHH
t x y� ��
� � �� � �
.����������������������[6]�
�The�x��and�y�momentum�conservation�equations��are�
�
2
0
2 2
cos
1cos sin ,
u HuH uvH BgHt x y x
uHgH gHx u v
�
� �
�
�� � �� � � �
� � � ��
� � �� �
���[7]
�
�
2
0
2 2
1cos cos ,
v HvH uvHt x y
vB HgH gHy y u v
� �
�
�� �� �
� � �� �
� � � �� � �
[8]
�
�where�H�=�H(x,y,t)�is�debris�flow�depth;�B�=�B(x,y)�is�bed�topography� which� assumed� to� be� fixed;� u� and� v� are�depth�averaged� velocities� in� x�� and� y�direction�respectively,�and�they�are�functions�of�spatial�variables�x,�y�and�temporal�variable�t;�tan��is�the�average�bottom�bed�slope;� �� � is� debris�flow� density,� which� is� assumed� to� be�constant;� g� is� the� gravitational� acceleration;� 0 �is� yield�stress� ,�which� represents� the�material�property�of�debris�flow.� However,� due� to� the� fixed� bed� topography,� the�erosion�effect�is�not�considered�during�the�simulation.�In�DEBRIS�2D,� an� initiation� condition� for� any� originally�stationary�debris�pile�is��
�2 22
0tancos
B H B Hx x y y g H
�
� �� � � �� � � �� �� � � � �� � � �� �� � � �� � � � � �
.��[9]�
�Equation�[9]�means�that�debris�flow�can�move�only�if�the�pressure�and�gravitational�effects,�i.e.�two�terms�on�LHS,�exceed�the�yield�stress�effect,�i.e.�RHS.��
For�DEBRIS�2D�simulation,�the�main�input�is�debris�flow�mass�volume�distribution.�The�input�of�mass�volume�V,� is�the�dry�debris�volume�Vd�obtained�by�the� landslide�volume� model� divided� by� the� equilibrium� volume�concentration�Cv�(%)�of�debris�flow�(Takahashi,�1981)�
�
tantan tanw
vw
C� �
� � � ��
� � ,����������������������[10]�
�
where��w� is�water�density;��� is� the�density� of�dry�debris�(around� 2.65� g/cm3);�� �is� internal� friction� angle� (about�37o)�;���is�average�bottom�slope�angle�in�the�field.��
With� the� total� debris� flow� volume� V� and� the�distribution�obtained�by�the�landslide�volume�model�and�a�yield� stress�measured� from�the� field�or�estimated�with�similar�soil�composition,�we�can�simulate�the�transport�of�all�landslide�volume.�
�From� the� simulated� result� of� DEBRIS�2D,� we� can�obtain�the�locations�that�debris�flow�flows�into�creek�and�the� volumes� for� sediment.� Then,� these� inputs� in� space�and� time� is� used� for� sediment� transport� simulation� in�rivers.���Sediment�transport�To� model� sediment� transport� process� in� creek� and�reservoir,� we� used� NETSTARS� (Network� Sediment�Transport�Model�for�Alluvial�River�Simulation)�(Lee�et�al.,�1997).� NETSTARS� is� a� quasi�2D� numerical� model� for�hydraulic�and�sediment�routing�in�alluvial�channels.��The�flow�in�channel�can�be�divided�into�several�stream�tubes�that� all� physical� properties� will� be� averaged� over� one�stream�tube�cross�section.�For�unsteady�hydraulic�routing,�the� de� Saint� Venant� equations� is� used� and� reads� (take�flow�in�x�direction�for�example)��
�
0A Qt x
� �� �
� �����������������������������������[11]�
�for�continuity�equation,�and�
�2
0fQ Q QgA gAS qt x A x A
��� �� � �
� � � � �� �� � �� � ��������[12]
��
for� momentum� equation.� In� [11]� and� [12],� A� is� channel�cross�sectional� area;� Q� is� flow� discharge;� q� is� lateral�inflow/outflow�discharge�per�unit�length;���is�momentum�correction� coefficient;� �� is� water� surface� elevation;� Sf� is�friction� slope;�K� is� channel� conveyance� and�K=(A/n)R2/3�where� n� and�R� are�Manning’s� coefficient� and� hydraulic�radius�respectively.�
Based� on� the� result� of� hydraulic� routing,� flow�condition� in� the�channel�can�be�obtained�and� is�applied�as� the� input� of� sediment� transport� calculation.� As� for�sediment� routing,� NETSTARS� considers� two� flow�conditions,� including� equilibrium� and� non�equilibrium�one.� If� the� flow� condition� is� equilibrium,� the� total�transport� capacity� of� sediment� load�Qs� is� calculated� by�the�total�load�equations�as�below:�
�
(1 ) 0s dtQ Apx t
� �� � �
� �,����������������������������[13]�
�where�Adt�is�the�amount�of�sediment�deposition/scouring�per� unit� length� of� stream� tube;� p� is� bed� sedimentary�deposit� porosity,� and� (1�p)� stands� for� the� volumetric�
20

Liu�K�F,�Chen�Y�C,�Wu�Y�H�–�Large�scale�simulation�of�watershed�mass�transport�
sediment� concentration� (Julien,� 2002).� Equation� [13]� is�also�referred�to�as�the�1�D�Exner�equation.�
On� the� other� hand,� for� non�equilibrium� flow�condition,�the�separate�treatment�method�includes�three�equations,�which� are� the� sediment� continuity,� sediment�concentration� convection�diffusion� equation� and� bed�load� equation.� The� Rouse� number� is� used� to� separate�suspended�and�bed�load.�Particle�with�Rouse�number�>�5�is� treated� as� bed� load,� but� suspended� load� if� Rouse�number���5.�The�sediment�continuity�equation�is�
�
1
(1 ) 0N
b dtt k
k
Q Ap q Cx t x �
� � �� � � �
� � � � ,�����������������[14]�
�where� Qb� and� qt� are� bed� load� transport� rate� and� flow�discharge� � in� stream� tube� respectively;� Ck� is� depth�averaged� concentration� of� suspended� sediment� of� size�fraction� k.� This� Ck� is� calculated� using� the� convection�diffusion�equations�as�
�
l
k t k kt k t x k z
r
C A C Cq C A k S hk
t x x x z� � �� � � � � �� � � �� � � �� � � � �� � � �
,�[15]�
�where� kx� and� kz� are� longitudinal� and� transverse�dispersion�coefficients;�At�is�area�across�stream�tube;�h�is�flow� depth;� Sk� is� source� term� of� suspended� sediment� of�size� fraction� k,� and� it� considers� the� effect� of� sediment�resuspension�and�deposition.,�Therefore,�the�evolution�of�channel�bed�can�also�be�assessed�during�the�simulation.�
For�NETSTARS�simulation,�there�are�two�categories�of� input.� The� first� category� is� topography� and� channel�cross�section� data,� and� the� other� one� is� the� BCs� at� the�upstream� and� downstream� boundaries.� For� hydraulic�routing,� a� discharge� hydrograph� is� needed� at� the�upstream� boundary,� and� a� rating� curve� at� the�downstream� boundary.� For� sediment� routing,� both� the�inflow� suspended�load� concentration� and� bed�load�discharge� are� required� at� the� upstream� boundary.� The�zero� concentration� gradient� is� imposed� at� the�downstream�end.�Besides,�the�simulation�result�obtained�by� DEBRIS�2D� is� also� inputted� as� lateral� mass� input�during�the�NETSTARS�simulation.��Case�Study�–�Tsengwen�reservoir�watershed�
Introduction�Tsengwen�reservoir�watershed,�with�total�drainage�area�of�480�km2,�is�located�in�south�west�Taiwan,�as�is�shown�in�Fig.� 2.� Elevation� ranges� from� 126�m� near� the� Tsengwen�dam� (marked� as� square� in� Fig.2)to� 2,610� m� at� the�upstream� boundary� which� is� the�Mount� Ali� (marked� as�triangular� in� Fig.� 2).� There� are� 15� sub�watersheds.�Lithological� setting� in� this� watershed� is� dominated� by�sandstones� and� shale� with� weak� rock� strength� of� 10~64�MPa�(Taiwan�Central�Geological�Survey,�2012).�Based�on�the� data� from� the�Water� Resources�Agency,�Ministry� of�Economic� Affairs� of� Taiwan� (2008),� the� annual�
precipitation� of� Tsengwen� reservoir� watershed� is� about�2,800� mm,� of� which� 90%� in� the� wet� season� (May–September).�During� this�wet� season,� the�main� source�of�precipitation� is� typhoons.� The� heavy� rainfall� from�typhoons�usually�causes�numerous�landslides�and�debirs�flow� in� this� watershed� and� brings� abundant� sediment�into�the�reservoir.��
�During� August� 5�10,� 2009,� typhoon�Morakot� set� a�new�rainfall�record�for�a�single�typhoon�event�in�Taiwan.�The�record� is�3,059�mm�at� the�Mount�Ali�gaging�station�in� the� Tsengwen� watershed.� This� extreme� rainfall�induced� countless� landslides� and� produced� a� great�quantity�of�sediment,�which�approximately�equals�to�the�total�sediment�volume�producting�in�the�past�19.5�years�in�the� Tsengwen� reservoir� watershed.� (Strong� Engineering�Consulting�Co.,�2011)�
Therefore,� we� simulate� the� mass� transport� in� this�large�watershed�with�extreme�rainfall�hydrograph,�shown�in�Fig.�3,�caused�by�typhoon�Morakot.��
�Landslide�volume�The� landslide� volume� triggered� by� the� past� 8� typhoon�events�ranges�from�0.21±0.09 to 49.86±6.36 Mm3.�Typhoon�Morakot� triggered� the� largest� landslide� volume� in� this�watershed,� accounting� for� 88%� of� the� total� landslide�volume� from� 8� typhoon� events.� The� landslide� area� and�total�volume�of�each�typhoon�is�shown�in�Fig.�2.�
As� in� Chen� et� al.� (2012),� from� 153� samples,� the�volume�area� realtion� for� the� Tsengwen� watershed� is�obtained�as��
�1.2680.202L LV A� ����������������������������������[14]�
�
�Figure� 2� The� distribution� of� sub�watersheds� in� the� Tsengwen�reservoir� watershed� and� landslide� inventory� of� 8� different��typhoon�event.����
21

��
�������Proceedings�of�the�IPL�Symposium,�UNESCO,�Paris,�2012�
�
�Figure�3�Hydrograph�of�rainfall�and�simulated�landslide,�debris� flow,�sediment�and�measured�sediment�discharges.�The�locations�of�landslides�relating�to�the�peak�a�and�b�are�marked�in�the�Fig.�4.�
�All� parameters� of� landslide� volume� model,� i.e.�
equation� [2],� for� the� 15� sub�watersheds� are� shown� in�Table�2.�The�root�mean�square�errors�range�from�1.87×10⁴�to�4.65×10⁵�m3�and�percentage�error� is�between� 17%�and�53%.�The�exponent�of�the�model�r�in�[2],�ranging�from�2.4�to� 3.0,� implies� that� relatively� small� rainfall� increase� can�result�in�large�increase�of�the�triggering�landslide�volume.�The�final�output�of�the�total�landslide�volume�in�typhoon�Morakot� is� 49,075,413� m3,� and� the� landslide� discharge�hydrograph�is�also�shown�in�Fig.�3.�
�Debris�flow�transport�simulation�The� distribution� of� the� final� debris� flow� deposition� and�the� fluvial� channels� (Water� Resources� Agency,�Ministry�of�Economic�Affairs�of�Taiwan,�2008)�are�both�shown� in�Fig.�3.�The�discharge�hydrograph�of�total�debris�flow�and�channel�sediment�inflow�are�both�shown�in�Fig.3.�In�Fig.3,�there� are� two� peaks� of� debris� flow� discharge.� The� first�peak�comes�from�the�landslide,�located�at�point�a�in�Fig.4,�triggered� in� the� W14� sub�watershed� with� the� volume�discharge�of�2.46�Mm3�per�hour.�The�second�peak�is�from�the�landslide�located�at�point�b�in�the�W2�sub�watershed.�
�
�Figure� 4� Final� distribution� of� mass� using� DEBRIS�2D,� sub�watershed� is�marked�as�W1�W15.�The� locations�a�and�b�causes�the�corresponding�peaks�a�and�b�in�Fig.�3.�
�
22

Liu�K�F,�Chen�Y�C,�Wu�Y�H�–�Large�scale�simulation�of�watershed�mass�transport�
�Table�2�All�parameters� for� landslide�volume�model,� i.e.� [2],�and� the�volumes�of� landslide�and� fluvial� channel� inflow� for� the� 15� sub�watersheds�in�the�Tsengwen�reservoir�watershed.�The�fraction�of�total�fluvial�channel�inflow�volume�to�landslide�one�is�33.9%.�
watershed�ID�
A�(Km2)�
P0�(mm)� K� r� RMSE�
(m3)�
Percent�error��(%)�
Landslide�Volume��(m3)�
channel�Inflow�volume
(m3)�W1� 28.2� 156� 0.35� 2.7 1.26×10⁵ 43� 1,970,125� 668,087W2� 45.8� 156� 0.22� 2.9 4.65×10⁵� 41� 8,384,991� 3,605,216W3� 64.6� 400� 0.15� 3.0 3.30×10⁵� 19� 12,428,657� 2,950,378W4� 31.3� 400� 0.32� 2.8 7.81×10⁴ 25� 2,186,534� 474,199W5� 22.3� 400� 3.14� 2.6 8.00×10⁴ 23� 2,497,126� 549,704W6� 19.3� 159� 7.77� 2.5 1.95×10⁵ 43� 2,545,912� 853,018W7� 31.8� 159� 0.94� 2.8 2.17×10⁵ 53� 3,078,364� 1,211,712W8� 22.5� 159� 2.22� 2.7 9.20×10⁴ 34� 1,953,766� 369,982W9� 17.5� 120� 6.28� 2.4 2.39×10⁴ 30� 585,776� 155,834W10� 14.7� 120� 2.73� 2.5 1.87×10⁴ 37� 403,793� 86,137W11� 36.7� 400� 3.27� 2.5 6.06×10⁴ 25� 1,685,969� 918,750W12� 45.0� 400� 1.78� 2.6 4.09×10⁴ 17� 1,636,836� 700,049W13� 21.5� 805� 65.12� 2.4 7.26×10⁴ 17� 2,986,346� 1,214,953W14� 23.2� 175� 0.86� 2.9 1.47×10⁵ 19� 5,264,517� 2,136,202W15� 24.7� 120� 2.43� 2.6 3.66×10⁴ 18� 1,466,701� 723,947
Total 49,075,413� 16,618,171�
The� detailed� alluvial� channel� sediment� inflow�volume� for� each� sub�watershed� is� also� listed� in� Tab.� 2.�From� the� simulation� result,� the� total� fluvial� channel�sediment� inflow� volume� from� debris� flow� is� about�16,618,171� m3.� So� the� ratio� of� sediment� inflow� to� total�landslide� volume� is� about� 33.9%,� and� it� is� very� close� to�the� averaged� value� 33.3%� in� Taiwan� (value� published� in�the� official� website� of� Morakot� Post�Disaster�Reconstruction�Council�(2012).�
�Sediment�transport�As�for�NETSTARS�simulation,�we�have�to�input�the�cross�sections�along�the�channel�and�water/sediment�inflow�at�the�upstream�boundary.�
The� input� of� 240� cross�sections� in� fluvial� channel�and� reservoir� are� obtained� by� digital� elevation� model�(DEM),� which� is� measured� by� LiDAR� with� 1� meter�resolution� and� published� by� WRA� (Water� Resources�Agency).��
The� water� inflow� discharge� hydrograph� at� the�upstream�boundary� is� determined� by� area� ratio�method�from� transferring� the� measured� discharge� hydrograph�recorded�at�Dap�gauging�station�(location�marked�as�the�hollow�circle�in�Fig.�2.)�
The� sediment� rating� curve� is� obtained� by� the�measured� datum� of� the� suspended� sediment�concentrations�and�the�river�discharges�recorded�in�Dapu�gauging�station.�The�rating�curve�is�
�1.91180.6833sQ Q� ����������������������������������[15]�
�with�an�acceptable�R2�of�0.9421.�In�this�study,�we�use�the�water� flow� discharge� with� [15]� to� obtain� the� sediment�inflow�discharge�at�the�upstream�boundary.��
In�Fig.�5,�the�simulation�result�of�sediment�discharge�is� plotted� by� the� blue� line,� and� the� sediment� discharge�measured� at� the�Tsengwen�dam� is�marked�by� the�green�box.� When� the� cumulative� rainfall� exceeds� the� critical�rainfall�(05:00AM~12:00PM�on�Aug.�7),�landslides�start�to�form� in� all� sub�watersheds.� � The� peak� of� sediment� and�debris�flow�discharge�happens�at�the�same�time,�i.e.�8:00�AM�on�Aug.�9,.�This�peak�comes�from�the�large�landslide�located�at�point�a�in�Fig.3�in�the�W14�sub�watershed.�The�value� of� this� peak� discharge� is� 6.5 106� Ton/hr� which� is�approaches�the�measured�value�of�6.8 106�Ton/hr�at�11:00�AM�on�Aug.�9.�
�
�Figure� 4� Sediment� rating� curve.� The� unit� of� sediment� yield� is�ton�per�one�day�
��
23

��
�������Proceedings�of�the�IPL�Symposium,�UNESCO,�Paris,�2012�
However,� the� simulation� result� shows� that� the�starting�time�of�concentration� increase� is�one�day�ahead�of�the�measured�data.�This�is�due�to�the�water�discharge�hydrograph�at�the�upstream�boundary.�In�our�simulation,�the� input�discharge� is�determined�by� the�measured� flow�discharge�at�Dap�station�in�the�downstream�with�the�area�ratio� method.� So� the� upstream� hydrograph� starts� too�early.� Therefore,� the� input� hydrograph� causes� the�advance�of�initialization�time�in�the�simulation.�
The� comparison� of� the� simulation� and� measured�sediment�concentration�of�time�variation�is�shown�in�Fig.�6.� The� time� difference� between� the� two� peaks� from�simulated�and�measured�data�is�4�hours.�This�is�also�due�to� the� early� start� of� the� assumed� input� discharge.�Although� the� starting� time� of� concentration� increase�from�simulation� is�different� from�the�measured�one,� the�tendency�of�the�concentration�of�time�variation�is�similar.�So�if� input�discharge�hydrograph�is�determined�by�other�rainfall�runoff� model,� such� as� HEC�HMS,� a� better�simulated�result�acn�be�obtained.�
�Figure�6�Comparison�of�sediment�centration�between�simulated�result�and�measured�data�at� the�Dapu�gaging�station�The�time�difference�between�the�simulated�and�measured�peak�is�4�hours;�and�1�day�for�the�starting�time�of�concentraion�increase.�
�Concluding�remarks�
We� conduct� a� large� scale� mass� transport� simulation�including� landslide,� debris� flow� and� sediment� transport�in� a� large� watershed.� The� case� of� Tsengwen� reservoir�watershed�under� the� extreme� rainfall� event� triggered�by�typhoon�Morakot�is�run�for�verification.�In�the�integrated�simulation� approach,� we� can� obtain� the� time�varying�distribution� and� volume� of� landslides.� Then,� following�the�output�of�landslide�model,�the�debris�flow�model,�i.e.�DEBRIS�2D,� is� able� to� simulate� the� mass� transport�process� for� the� whole� watershed.� This� simulation� then�provides� the� lateral�mass� input� into� the� fluvial� channel.�Finally,� the� sediment� model,� NETSTARS,� is� used� to�estimate� the� time�varying� sediment� transport�concentration�in�the�fluvial�channel.��
As�is�verified�by�the�measured�sediment�discharge�at�downstream,� the� simulation� result� of� Tsengwen�watershed� � shows� a� agreement� of� the� trend� of� the�concentration� variation.� However,� the� peak� time�prediction� is� early� then� the� real�measured� data.� This� is�due�to�the�early�start�of�upstream�input.�A�rainfall�runoff�model� (e.g.� HEC�HMS,� ANN� model,� etc.)� can� provide�
better� time� variation� even� without� real� measurement�from�upstream�location.��
With� this� comparison,� the� integrated� approach� for�large� scale� mass� transport� simulation� seems� reasonable�and� practical� and� also� provides� reasonable� result.�Although�early�arrival�of�the�peak�is�not�precise,�but�this�result� can� still� be� used� as� warning� mechanism� where�early� arrival� gives� more� time� for� preparation.� This�approach� can� also� give� the� sediment� information� in� the�fluvial� channel� and� reservoir� as� the� reference� for� the�Tsengwen�reservoir�operation.��
�Acknowledgments�
The� authors� would� like� to� thank� the� Water�Resources� Agency,� Ministry� of� Economic� Affairs� of�Taiwan� for� financial� support� of� this� research� and�many�valuable�and�detailed�hydrological�datum.���References�(in�the�alphabetical�order)�
Central� Geological� Survey� (2012)� Surveys� of� Characteristic� of�Engineering� Rock� Masses� on� hillslopes.� (in� chinese)� URL:�http://envgeo.moeacgs.gov.tw/moeapaper/rock/rock_main.htm�[2012�6�10].�
Chang� KT,� Chiang� SH� (2009)� An� integrated� model� for� predicting�rainfall�induced�landslides.�Geomorphology�105(3�4):�366�373.�
Chen� YC,� Chang� KT,� Chiu� YJ,� Lau,� SM,� Lee� HY� (2012)� Quantifying�rainfall�controls�on�catchment�scale�landslide�erosion�in�Taiwan,�Earth�Surface�Processes�and�Landforms.�DOI:�10.1002/esp.3284.�
Guzzetti� F,� Ardizzone� F,� Cardinali� M,� Rossi� M,� Valigi� D� (2009)�Landslide� volumes� and� landslide� mobilization� rates� in� Umbria,�central� Italy.� Earth�and�Planetary� Science� Letters�279(3�4):� 222�229.�
Huang�SL,�Jia�YF,�Wang�SS�(2006)�Numerical�modeling�of�suspended�sediment�transport�in�channel�bends.�Journal�of�hydrodynamics,�18(4):�411�417.�
Julien� P� Y� (2002)� River� mechanics,� Cambridge� university� press,�United�Kingdom.�(ISBN:�0521529700)�
Julien�P�Y,�Lan�Y�(1991)�Rheology�of�hyperconcentration.�Journal�of�Hydraulic�Engineering�ASCE,�117(3):346�353.�
Khazai�B,�Sitar�N�(2000)�Assessment�of�seismic�slope�stability�using�GIS�modeling.�Annals�of�GIS.�6(2):�121�128.�
Klar�A,�Aharonov�E,�Kalderon�Asael�B,�Katz�O� (2011)�Analytical�and�observational� relations� between� landslide� volume� and� surface�area.�Journal�of�geophysical�research�116(F2):�F02001.�
Lee�HY,�Hsieh�HM,�Yang� JC,�Yang�CT� (1997)�Quasi�two�dimensional�simulation�of�scour�and�deposition�in�alluvial�channels.�Journal�of�Hydraulic�engineering�ASCE,�123(7):600�609.�
Lee� HY,� Hsieh� HM� (2003)� Numerical� Simulations� of� Scour� and�Deposition� in� a� Channel� Network.� International� Journal� of�Sediment�Research.�18(1):�32�49.�
Liu�KF,� �Huang�MC�(2006)�Numerical�simulation�of�debris�flow�with�application�on�hazard�area�mapping.�Computational�Geosciences.�10:�221�240.�
Liu� KF,�Wu� YH,� Chen� YC� (2012)� Comparison� between� FLO�2D� and�DEBRIS�2D�on�application�of�assessment�of�granular�debris� flow�hazard.�submitted.�
Morakot� Post�Disaster� Reconstruction� Council,� Executive� Yuan,�(2012)�URL:�http://88flood.www.gov.tw/eng/�[2012�8�8]�
O’Brien�J�S,�Julien�P�Y,�Fullerton�W�T�(1993)�Two�dimensional�water�flood�and�mudflood�simulation.�Journal�of�hydraulic�engineering,�ASCE.�119(2):244�260.�
24

Liu�K�F,�Chen�Y�C,�Wu�Y�H�–�Large�scale�simulation�of�watershed�mass�transport�
Rathburn� S� L,� Wohl� E� E� (2001)� One dimensional� sediment�transport�modeling� of� pool� recovery� along� a�mountain� channel�after�a�reservoir�sediment�release.�Regulated�Rivers:�Research�&�Management.�17(3):�251�273.�
Reichenbach�P,�Cardinali�M,�Galli�M,�Ardizzone�F�(2005)�Probabilistic�landslide�hazard�assessment�at� the�basin�scale.�Geomorphology�72(1):�272�299.�
Strong�Engineering�Consulting�Co.� (2011)�2011�Tsengwen� reservoir�sedimentation� measurements.� South� Region� Water� Resources�Office,�Water�Resources�Agency,�MOEA�of�Taiwan.�
Takahashi�T� (1981)�Debris� flow.�Annual�Review�of�Fluid�Mechanics,�13:57�77.�
Uchiogi� T� (1971)� Landslides� due� to� one� continual� rainfall.� JSECE.�23(4):�79.�(in�Japanese)�
Water� Resources� Agency� (2008)� Hydrological� Yearbook� of� Taiwan�Republic�of�China�2007�Part�I���Rainfall.�Water�Resources�Agency,�Ministry�of�Economic�Affair�of�Taiwan.�
� �
25

�Proceedings�of�the�IPL�Symposium,�UNESCO,�Paris,�2012�
�
�
Networking,�Linkage�and�Coordination�for�Disaster�Risk�Reduction:�A�Case�Example�from�South�Asia�Disaster�Knowledge�Network�(SADKN)�
�Surya�Parkash�
National�Institute�of�Disaster�Management,�Delhi�110002,�INDIA,�[email protected]�
�
Abstract Disaster� Risk� Reduction� (DRR)� requires� an�integrated� and� holistic� approach� by� all� stakeholders� in�the�disaster�affected�areas.�The�efforts�made� in� isolation�by�any�individual�or�organization�may�not�suffice�to�meet�the� immense�amount�of�physical�resources,� information,�knowledge,� skills� and� experiences� needed� for� effective�and�efficient�DRR.� �Thus,�the�pooling�of�resources�and�a�synergized�convergence�is�desired�among�all�stakeholders�through� networking,� linkage� and� coordination� for�integrating� the� initiatives�made� by� different� disciplines,�sectors�and�programmes�at�local,�provincial,�national�and�international�levels.��
The� paper� cites� an� example� of� the� South� Asian�Disaster�Knowledge�Network�(SADKN)�established�by�the�SAARC� Disaster� Management� Centre� (SDMC)� at� the�regional� level� and� its� linkages� with� the� other� networks�like� India� Disaster� Knowledge� Network� (IDKN)� at� the�national�level.�It�attempts�to�link�the�various�programmes�and�activities�as�well� as�organizations� in� the� region� that�contribute� towards� disaster� risk� reduction� directly� or�indirectly.�It�has�also�established�a�coordinated�response�mechanism� for� DRR� in� the� region.� However,� the� main�emphasis�of�the�paper�lies�in�emphasizing�the�importance�of� networking,� linkage,� coordination� and� integration� in�DRR.���Keywords:�Networking,�Linkage,�Coordination,�Disaster�Risk�Reduction,�Integration���Introduction�
Disasters� have� been� affecting� adversely� the� lives,�economy�and�environment�of� the�people,�particularly� in�the� developing� countries� like� India,�Nepal,� Pakistan,� Sri�Lanka,� Bangladesh� etc.� Although� several� attempts� were�made�by� the� concerned�national� and� state� governments�in� the� respective� countries� yet� no� effective� outcomes�could�be�achieved.�A�review�of�the�disaster�management�system� led� to� the� conclusion� that� no� government� or�agency� can� succeed� in� effectively� reducing� the� disaster�risks� in� isolation� until� all� kinds� of� stakeholders� are�involved� into� the� process� in� a� partnership� mode� of�participation.� Sometimes� even� the� physical� resources,�knowledge� and� experiences� are� not� sufficient� enough�with�the�concerned�specific�stakeholders� if�these�are�not�pooled� together� during� the� disaster� times.� However,�
every� stakeholder� do� have� some� capacity� in� terms� of�different� types� of� resources,� knowledge� and� experiences�to�meet�the�needs�for�disaster�risk�assessment,�prevention,�mitigation,� preparedness,� response� and� recovery.�Therefore,�a�system�has�been�devised�to�network�all�these�capacities�through�a�well�laid�out�and�defined�system�that�helps� in� knowing� the� existing� capacities� within� every�stakeholder� in� the� system� and� utilizing� the� same� in�reducing� the� disaster� risks� for� humanitarian� and�environmental�well�being.��
Another�critical�observation�that�has�been�made�in�management� of� the� disaster� risks� is� lack� of� adequate�linkages� among� different� programmes,� activities� and�plans� related� to� development� /� safety.� Disaster� risk�management� was� looked� upon� separately� from� the�developmental� activities.� This� has� led� to� shortages� of�funds� and� human� resources� available� for� disaster� risk�reduction.� However,� if� appropriate� linkages� can� be�established�among�the�different�programmes�/�projects�/�activities� in� any� disaster� affected� area,� it� will� help� in�avoiding� duplication� of� activities� and� will� complement�the�resources�available�for�disaster�risk�reduction.�
Further�observations�on�networking�and�linkages�led� to� the� identification� of� issues� related� coordination�and� integration� of� these� initiatives.� As� most� of� these�projects� /� programmes� are� governed� independently� by�different� departments� /� organizations,� the� coordination�among� them� seems� lacking.� Hence,� the� new� disaster�management� system�has� also� considered� these� issues� of�coordination� and� integration� of� efforts� for� disaster� risk�reduction.�
The� paper� attempts� to� discuss� the� above�said�issues� of� networking,� linkage,� coordination� and�integration� for� disaster� risk� reduction,� with� a� case�example�from�south�Asia�disaster�knowledge�network.� It�would� be� worthwhile� to� mention� here� that� National�Institute� of� Disaster� Management,� New� Delhi� has� been�mandated�by�the�Disaster�Management�Act�2005�in�India�to�carry�out�activities�related�to�networking,� linkage�and�coordination� for� DRR,� indicating� its� importance� in� the�new�disaster�management�framework�of�the�country.��Networking�Networking�is�a�process�of�bringing�people�together�for�a�common� cause� with� mutually� beneficial� interests� in� a�society� or� a� community.� It� promotes� collaborations� in�
26

Parkash�Surya�–�Networking,�Linkage�and�Coordination�for�Disaster�Risk�Reduction:�A�Case�Example�from�SADKN�
regional� programmes,� including� technical� cooperation,�capacity�development,� the�methodologies� and� standards�for�hazard�and�vulnerability�monitoring�and�assessment,�the� sharing� of� information� and� effective�mobilization� of�resources� for� supporting� national� and� regional� efforts.�The� networks� undertake� and� publish� regional� /� sub�regional� baseline� assessments� of� the� disaster� risk�reduction�status,�according�to�the�needs�identified�and�in�line� with� their� mandates.� It� helps� in� establishing� or�strengthening� linkage� and� coordination� for� integrated�research,� training,� education� and� capacity� development�in� the� field� of� disaster� risk� reduction.� It� provides� an�operational� mechanism� for� sharing� and� exchange� of�resources,�knowledge,�skills,�information�and�experiences.�Thus,� there� is� a� need� to� develop� working� partnerships�among�different�stakeholders�who�are�expected�to�play�an�important�role�in�DRR.�
Who�should�join�the�network?�� Officials� from� UN� Organizations,� Government� or�
semi�government� organizations� dealing� with� various�aspects�of�disaster�management��
� Volunteers� and� Social� Workers� from� Non�Governmental�and�Civil�Society�Organisations�
� Officials� and� field� workers� from� Local,� District,�Provincial,� National� and� International� level�organizations��
� Representatives� of�multilateral� and� bilateral� agencies�supporting� projects� and� programmes� pertaining� to�disaster�management�
� Academicians,� researchers� and�� other� professionals�involved� in� disaster� management� capacity�development,�training�and�research�
� Corporate� and� other� private� sector� professionals� in�the�disaster�management�related�fields,�including�risk�management�and�the�insurance�sector�
�Linkage��Linkages� focus�on�the�programmes�and�activities�related�to� disaster� risk� reduction� in� the� different� organizations�and� sectors� for� evolving� partnerships� among� these�stakeholders� in� implementation�of� the� risk�management�process�effectively.�
It� can� help� in� collaborative� research� activities�with� other� stakeholders� in� the� country� and� globally� in�coordination� with� the� regional� and� international�organizations.� The� activities� establish� linkages� with�governments� at� different� levels,� other� organizations� and�NGOs� for� an� integrated� and� holistic� disaster� risk�reduction� in�partnership�with� the�affected�communities.�It� helps� in� preparing� institutional� agreements� with�government� agencies,� NGOs� and� the� industry� to� secure�funds� for� the� DRR� activities.� For� example,� the� social�welfare� programmes� at� community� level� and�developmental�activities�in�the�disaster�affected�areas�can�always� be� linked� to� the� disaster� risk� reduction�programme�and�activities.�
Linkages� will� also� help� each� agency� /�organization� fulfil� its� own� mission.� Few� programs� have�the� sufficient� resources� available� to� address� the�sometimes� overwhelming� number� of� problems� faced� by�the� stakeholders� in� the� affected� area.� Increasingly,� such�programs� are� looking� to� strong� collaboration� and�linkages�with�other�service�agencies�to�meet�these�needs.�Thus,� linkages� and� collaborations� are� particularly�beneficial� where� lack� of� resources,� skill,� knowledge,�information�and�experience�are�significant�problems.�
Most� of� the� individuals� /� organizations� who� are�engaged� in� DRR� activities� or� services,� generally� have�experienced� the� negative� consequences� of� fragmented�and� disintegrated� service� systems.� but� the� linkages�provide�a�formalized�approach�to�linkages�of�programmes,�services� and� activities� among� different� agencies.� The�different� stakeholders� have� developed� strategies� to�develop� linkages�with�other�programmes� in� the� affected�area�to�increase�the�capacity�of�their�programmes.�These�linkages� involve� efforts� to� coordinate� with� different�stakeholders� and� efforts� to� provide� continuous� services�for�DRR�activities.��Coordination�and�Integration�Under� this� new� paradigm,� a� formal� structure� for�continuity�of�services�and�a�process�to�oversee�system�level� coordination� among� agencies� is� established.�While� specific� goals�would� vary� from�organization� to�organization,� such� systemic� reform� would� enable�stakeholders� to� create� a� collaborative� infrastructure�that,� in� turn,�would� allow�programmes� to� implement�DRR�activities�more�effectively.�The�coordination�and�integration�activities�are�� Stakeholder� specific� focussing�on� their�needs�with�
appropriate� services� as� opposed� to� fitting� the�affected�communities�into�a�predefined�programme�
� Holistic� offering� comprehensive� services� from� a�variety�of�agencies�that�are�designed�to�respond�to�affected�community’s�multiple�needs:�housing,�food,�water,�sanitation�etc.�
� Flexible,� i.e.� the� response� action� changes� as� the�stakeholder’s�needs�change�
� Collaborative� means� multiple� agencies� can� work�together� freely� without� any� interference� with� the�assistance�process�
� Accountable� to� encourage� the� affected�community’s�input�to�the�comprehensive�DRR�plan,�adhering�to�standards�or�accepted�best�practices�for�DRR,� establishes� and� tracks� qualitative� and�quantitative� outcome� measures,� and� evaluates�activities� /� services� on� the� basis� of� community�satisfaction.�
Currently,�most�DRR�programmes�function�as�a�series�of� parallel� programmes� with� their� own� sources� of�funding,� leadership,� and� constituencies.� � In� the�environment�that�would�emerge�after�converting�from�parallel� services� to� an� integrated� delivery� system,�cooperation�on�the�stakeholder's�behalf�would�replace�
27

competition.� Collaboration� would� eliminate�duplication�of�services�and�execution�of�inappropriate�services.� Systemic� reform� on� this� scale� requires�structural� and� administrative� changes� at� different�levels.�As�a�first�step�toward�revamping�DRR�system�to�cater� to� the� multiple�needs� of� the� stakeholders,� a�mechanism�is�suggested�that�would�help�� Coordinate� planning� among� disparate� agencies�
based�on�stakeholder’s��needs�assessments�� Devise� financing� strategies� that� would� allow� for�
blended�funding�and�strive�for�equitable�allocation�of�resources�among�agencies�
� Establish�a�vehicle�for�resolving�any�problems�that�emerge�in�implementation�of�integrated�services.�
Coordination� may� involve� contracts� or� linkage�agreements,� or� other� mechanisms� to� ensure� an�efficient� DRR� system� for� all� stakeholders.� In�collaborative�relationships,�difficulties�can�arise� if�one�entity� feels� taken� advantage� of,� perceives� that� the�other� is� deriving�more� benefits� from� the� association,�receives�more�credit,�or�believes�that�power�is�unequal�between� the� two� groups.� Balance� is� central� to� an�effective� collaboration� that� satisfies� the� expectations�and�needs�of�all�involved.���A� Case� Example� of� a� Regional� Network� from� South�Asia�Disaster�Knowledge�Network�(SADKN)�
SDMC� was� set� up� in� October� 2006� at� the� premises� of�National�Institute�of�Disaster�Management�in�New�Delhi.�The� Centre� has� the� mandate� to� serve� eight� Member�Countries� of� South� Asia� Association� of� Regional�Cooperation�(SAARC)���Afghanistan,�Bangladesh,�Bhutan,�India,� Maldives,� Nepal,� Pakistan� and� Sri� Lanka� �� by�providing�policy�advice�and�facilitating�capacity�building�services� including� strategic� learning,� research,� training,�system� development� and� exchange� of� information� for�effective� disaster� risk� reduction� and� management� in�South�Asia.� It� is� networking� through� the�National� Focal�Points� of� the� Member� Countries� with� the� various�Ministries,� Departments� and� Scientific,� Technical,�Research� and� Academic� institutions� within� and� outside�the� Government� working� on� various� aspects� of� disaster�risk�reduction�and�management.���South�Asian�Disaster�Knowledge�Network� (SADKN)� is� a�gateway� to� knowledge� and� information� on� disaster� risk�management� in� South� Asia.� It� acts� as� the� common�platform� for� sharing� knowledge� and� information� among�the�multiple�stakeholders�of�the�member�countries�of�the�South� Asian� Association� for� Regional� Cooperation�(SAARC)� on� the� inter�disciplinary� and� cross�sectoral�issues� of� disaster� risk� assessment,� risk� prevention,�mitigation�and�preparedness�and�disaster�response,�relief,�recovery� and� reconstruction.� It� provides� ready� access� to�clear,� understandable� and� user�friendly� information�about� real� time,� impending� and� historical� disasters,�details�of�hazards,�vulnerabilities�and�risks�of�disasters�in�
structured� layers�of�digitized�maps� in�WebGIS�platform,�and�wealth�of�resources,�references,�images�and�videos�on�practically�every�aspect�of�disaster�management�that�the�users�would�be�interested�to�know.�
The� SADKN� provides� decision� makers� with� the�instant� geospatial� support� for� assessing� risks� and�communicating� about� hazards� and� the� exposure� that�vulnerable� people� and� infrastructure� have� to� these�hazards�and�assist� them� in� locating�disaster�occurrences�and� probable� fall� outs,� and� taking� important� decisions�regarding� evacuation,� damage� and� loss� assessment,�recovery�and�risk�reduction.�It�has�dynamic�features� like�Disaster� Dashboard,� Real� Time� Weather� Forecasts,�Networks,� Discussion� Forum,� Chats� and� Blogs,� FAQs,�Kids� Corner� etc.� that� enable� the� users� to� meet� and�interact� with� each� other� to� share� their� experiences� and�find�solutions�to�their�problems�and�issues.�It�provides�an�environment� to� encourage� people� to� create,� learn,organize,� share,� use� and� reuse� knowledge� on� disaster�management.��The� SADKN� (http://www.saarc�sadkn.org/network.aspx)�is� a� network� of� networks,� with� one� regional� and� eight�national� portals,� that� would� involve� the� national,�provincial� and� local� governments,� international�organizations,� scientific,� technical� and� academic�institutions,� non�government� organizations,� media� and�corporate�sectors,�communities�and�individuals� in�South�Asia�in�sharing�knowledge�and�good�practices�on�disaster�management.��The� SADKN� intends� to� create� one� stop� unified� point� of�access� to� disaster� management� knowledge� and� services�and� thereby� accelerate� and� improve� the� quality� of�disaster�mitigation�and�response�in�the�region.��India� Disaster� Knowledge� Network� (IDKN)� –� Example�of�National�Level�Network�India� Disaster� Knowledge� Network� (IDKN)� is� a� web�portal�(http://www.idkn.gov.in)�,�that�offers�a�broad�array�of� resources� and� services,� such� as� knowledge�collaboration,� networking,� maps,� emergency� contact�information� system� and� several� other� valuable�informations� related� to� Natural� disasters.� IDKN� is� an�essential�tool�to�share�information�for�Managing�disasters.�The�main�goal�of�IDKN�is�to�create�an�easy�to�use�unified�point� of� access� to� disaster�management� knowledge� and�services� and�hence� an� accelerated� and� Improved�quality�of��disaster�mitigation�and�response.�Its�main�aims�are:��
� Provide� consolidated� source� of� disaster�related�information� and� services.� Information� includes� the�definition� of� different� hazards� its� Geographic�distribution,� Vulnerability� of� India� (state� level),�Preparedness�and�Mitigation�measures�etc.��
� Minimize� loss� of� life� and� property� by� creating�awareness�at�all�levels��
28

Parkash�Surya�–�Networking,�Linkage�and�Coordination�for�Disaster�Risk�Reduction:�A�Case�Example�from�SADKN�
� Provide�a�platform�to�share�knowledge�and�create�an�environment� to� learn� about� disaster� management�through�interactive�process.���
ICL’s�Networks�on�Landslides�–�An�Inititiave�ICL� has� examined� the� proposals� for� initiating� thematic�and� regional� networks� on� landslides� during� its� 10th�anniversary�meeting� in� January�2012�at�Kyoto,� Japan�and�decided� to� establish� these� networks� to� promote� its�thematic� and� regional� activities� on� landslide� risk�reduction,� environmental� conservation� and� heritage�protection,�as�part�of��its�joint�activities�with�UN�ISDR�in�the� International� Programme� on� Landslides.� This� will�help� to� intensify� the� collaboration� among� ICL�members�as�well�as�enhance�cooperation�with�the�non�ICL�member�organizations.��The�following�3�regional�networks�have�been�approved.�
i. ICL�Adriatic�–�Balkan�Network�ii. ICL�Latin�–�American�Network�iii. ICL�North�–�East�Asia�Network�
Besides�the�regional�networks,�5�thematic�networks�have�also�been�approved.�These�include�
i. ICL�Landslide�Risk�Management�Network�ii. ICL�Capacity�Development�Network�iii. ICL�Landslides�in�Cold�Regions�Network�iv. ICL� Landslides� and�Cultural� &�Natural�Heritage�
Network�v. ICL�Landslide�Monitoring�and�Warning�Network�
�In� addition� to� the� above�said� networks,� ICL�has� already�been�working�on�a�Landslide�School�Network�that�tries�to�bring� together� the�experts�and�organizations�engaged� in�landslide�education,�training�and�research.���Conclusion�The�discussions� in�the�paper� lead�to�the�conclusion�that�networking,� linkage,� coordination� and� integration� for�disaster�risk�reduction�activities�are�crucial�aspects�of�any�disaster� risk� management� framework� or� system.� � The�establishment� of� networks� such� south� asia� disaster�knowledge� network� (SADKN)� � at� the� regional� level� and�India�Disaster�Knowledge�Network�at�the�national�levels,�has� actually� promoted� and� encouraged� the� disaster� risk�reduction� activities� at� local,� national,� regional� and�international� levels.� Similar� initiatives�made� recently� by�the�international�consortium�on�landslides�in�establishing�the�3�regional�and�5�thematic�networks�on�landslides�are�likely� to� contribute� significantly� in� landslides� risk�reduction.� However,� the� effectiveness� and� efficacy� of�these� networks� would� depend� upon� better� linkages,�coordination� and� integration� of� the� programmes� and�activities� among� various� stakeholders.� Hence,� an�appropriate� mechanism� and� a� good� structural�arrangement� is� a� pre�requisite� to� the� successful�implementation�of�landslide�networks�by�the�ICL.���
Acknowledgments�
The� author�would� like� to� thank�Dr.� Satendra,� Executive�Director,� National� Institute� of� Disaster� Management,�New� Delhi� for� his� kind� support� and� encouragement� in�writing� this� paper.� Special� thanks� are� also� due� to� the�International�Consortium�on�Landslides�for�providing�the�opportunity�to�publish�this�paper.��References�(in�the�alphabetical�order)�
http://www.idkn.gov.in�http://www.saarc�sadkn.org�
29

Proceedings of the IPL Symposium, UNESCO, Paris, 2012
Lessons Learned in the Development of Landslide Early Warning System in Indonesia
Teuku Faisal Fathani(1), Dwikorita Karnawati(2) 1) Universitas Gadjah Mada, Department of Civil and Environmental Engineering, Yogyakarta, Jl. Grafika No. 2, 55281,
Indonesia
2) Universitas Gadjah Mada, Department of Geological Engineering, Yogyakarta, Jl. Grafika No. 2, 55281, Indonesia
Abstract Since developed in 2007, landslide early warning system (EWS) in Indonesia has kept improving and many lessons learned can be gained. At the earlier stage of development, the system was only focused on technical aspects. The equipment for landslide monitoring and early warning was developed with the simple and low cost devices, followed by the use of advanced technology to produce the automatic devices with data recorder and devices connected to the online monitoring system. However, the technical approach did not ensure the success of the system, hence, socio-eco-cultural approach is also required. The system was developed based on collaborative framework of multiple stakeholders. Integrated application of the system has been able to respond the community need to improve the preparedness and respond to the occurring disaster. The future challenge is to broaden the implementation of the system globally, improve the effectiveness of the monitoring, early warning analysis, and the visualization of the monitoring results.
Keywords: community development, preparedness, landslide monitoring, socio-technical strategic approach, risk assessment.
Introduction
Landslide prone areas are widely spread in Indonesia; therefore, a collaborative effort is necessary to reduce the risk. Landslide risk in several areas is mainly controlled by geological, geotechnical, and hydrological conditions and can be initiated by high rainfall intensity and earthquake. The vulnerability to landslide is worsened by land use change where agriculture is practiced in the areas with slopes.
The main issue to solve is the increasing density of the population in the landslide prone areas because those areas are generally fertile and have high economic values. The construction of slope revetment is very costly, hence, could not be applied to all areas. Furthermore, people relocation to safer areas is proven to a challenge due to socio-eco-cultural issues. On the other hand, the potential of ground movement keeps increasing due to the increase in rain intensity, earthquake occurrence, and human disturbance on the slope (Karnawati et al., 2005;
Karnawati and Fathani, 2008). One of the protective efforts for people living in the areas prone to landslide is the application of early warning and monitoring system involving community participation to increase their preparedness in facing the disaster.
The early warning system requires a set of monitoring and warning devices that works simultaneously and is coordinated in the disaster mitigation effort. Prior to the installment of the landslide early warning and monitoring system, preliminary investigation and survey are required to understand the physical condition, as well as the social, economic, and cultural condition of the local community. The next phase is design and installation of the adaptive early warning and monitoring devices, followed by intensive training to the local community on how to operate and maintain the devices (Fathani et al., 2010).
This paper discusses the lessons learned from the long experience of the implementation of community based landslide early warning and monitoring system in Indonesia. One of the challenges is to ensure that the low cost and simple landslide detection devices can be applied effectively and even can be made by the local community. Next is how to integrate the design and the implementation of the advanced technology for landslide early warning and monitoring system and the last is the application of the system can be well coordinated with central and local government, universities, private sectors, NGOs, and disaster preparedness team.
Stage of Development of Landslide Monitoring and Early Warning System
Based on a long experience on the implementation of landslide disaster risk reduction, one of the effective efforts of landslide mitigation is by developing low cost and simple landslide early warning and monitoring system in order for the local community to be able to operate and maintain the systems. In some of the study areas, the local community is able to reproduce the system to be applied in their area with a continuous support from the government, private sectors and other related institutions. The steps in developing the landslide early warning and monitoring system can be elaborated as follows:
30

Proceedings of the IPL Symposium, UNESCO, Paris, 2012
a. Conducting survey and investigation to thegeological, geotechnical, and hydrologicalconditions, landslide inducing factors, the extent ofthe landslide prone areas and the condition of thepeople living in the landslide prone areas. Thesurvey and investigation aim at determining thelocation of the installation of the landslide earlywarning and monitoring devices.
b. Designing low-cost and adaptive monitoring andwarning devices for certain areas. The design isbased on the results of the survey; therefore, thetechnical system is adjusted to the differentconditions of the areas and local community.
c. Carrying out socialization and training to improvethe capacity of the disaster preparedness team andthe community living in the landslide prone area sothat they can operate and maintain the systems.
d. Installing the technical system and conductingconsultation on the operation and maintenance ofthe devices and performing simple analysis based onthe data obtained from the monitoring devices. Testand calibration of the devices are required to ensurethe accuracy of the monitoring.
The applied landslide early warning and monitoring system is integrated system between technical system and community based social system (Fathani and Karnawati, 2010). In this system, the disaster preparedness team and the local community must participate actively in supporting the technical network. The effectiveness of the system depends on the initiative and active participation of the disaster preparedness team supported by the government (Karnawati, et al., 2011).
Through the application of landslide early warning and monitoring system, both aspects, namely technical and social aspects can be integrated. The operational and maintenance of the monitoring devices and warning system can be implemented and the capacity of the local community and their ability to respond to disaster can be improved (Andayani et al., 2008). On principle, through the system the local community is expected to be motivated and able to carry out landslide mitigation on their own.
The development phase of the devices began with low cost simple monitoring devices, followed by automatic devices with data recorder, and real-time warning and monitoring devices that will be discussed in the next section. Moreover, the development process of monitoring devices such as rain gauge, extensometer, tiltmeter, inclinometer, pore pressure sensor and other devices will also be discussed.
Simple and Low-cost Technology for Landslide Monitoring
Low cost simple ground movement monitoring devices has been developed by Universitas Gadjah Mada (UGM) starting from 2007. First, simple extensometer, tiltmeter and raingauge were developed and installed in Central Java Province and East Java Province.
The first model is a manual reading extensometer made of wood and brass. The devices was equipped with anglemeter and compass to read the ground movement in three directions. Then, paper-recorded extensometer type that measure relative movement between 2 cross sections points of soil cracks. This type of extensometer has better accuracy compared to the manual extensometer. The rain gauge is also installed in the landslide prone area to compare the reading of ground movement to rainfall data. The whole system is connected to the alarm system to give warning to the local community on the possibility of landslide.
The application of the landslide early warning and monitoring system was developed with consideration to the socio-eco-cultural approach to support the technical aspect. The system starts to show some success in the areas where it is applied. One of the examples is the landslide occurring in Kalitelaga Village, Banjarnegara Regency on November 7th 2007 that was detected 4 hours prior to the occurrence. The local community, consisting of 35 families, evacuated to a safe place after hearing the warning and avoided the landslide that damaged 10 houses (Fathani and Karnawati, 2010). The application of low cost and simple landslide early warning and monitoring system in Kalitelaga is shown in Figs. 1 and 2.
Figure 1 Automatic extensometer installed at the upper slope at a densely populated area.
Figure 2 A manual extensometer could detect a collapsed slope and warns the community to evacuate.
Movement direction
Manual extensometer
31

TF. Fathani, D. Karnawati – Lessons learned in the development of landslide early warning system in Indonesia
Fig. 1 shows an automatic extensometer installed at the upper part of an unstable slope in order to monitor the ground movement, whereas 40 houses are located at the lower slope. Meanwhile, Fig. 2 shows the manual reading extensometer at the upper part of collapsed slope. This manual extensometer warned the local community about 4 hours before the occurrence of landslide and saved 35 families living at the hazard prone area.
The monitoring devices should be maintained in order to be able to send warning sign to the fieldserver and central operator which then passes on to the local community so that they can take necessary actions. The local government should determine how the information of disaster signs can be delivered to the community and how the authority should decide when the community should evacuate (Fig. 3). The simple devices commonly can deliver the warning sign directly and can be heard by everyone. After that, the head of the village or the head of the disaster preparedness team appoints the team responsible to deliver the status change for landslide and mobilize the people to evacuate.
The scheme is proven to run smoothly during landslide occurrence in Kalitelaga Village, Banjarnegara Regency on November 7, 2007. The team delivered the evacuation order from the head of the village. They mobilized the community to evacuate to a safe place while conducting monitoring the slope condition.
Figure 3 Arrangement of detection for landslide signs and evacuation order at village level.
Real-time Landslide Monitoring
In a high level of danger and or landslide occurrence with huge impact, real-time landslide monitoring can be used. The monitoring devices generally used comprises rain gauge, extensometer, tiltmeter, inclinometer, multi-layer movement meter, pipe strain gauge, pore pressure sensor, etc. The monitoring results by the devices are recorded in a fieldserver. The power issue is solved by using solar cell.
The devices transfer the data to a fieldserver that passes the data to a cloud network that can be accessed real time through website and can be disseminated and discussed in the social media.
The application of technical system in an area can be differed from other areas, depending on the physical and social conditions of the area. Fathani et al. (2011) gives warning criteria for rainfall-induced landslide in Central Java. Warning criteria are obtained based on the monitoring and the result of analysis on the effect of rainfall intensity and cumulative rainfall on the initiation of ground movement monitored by the devices. Furthermore, the combination of rainfall threshold that initiate slope movement can be analyzed to determine warning criteria that differ from one area to another.
The illustration of the mechanism of the monitoring system, data transfer and the warning system can be seen in Fig. 4. The system is used to provide real-time monitoring information. Various devices are used to monitor the rainfall, water table fluctuation, surface deformation and the movement on the slip surface.
The recorded data is then processed by the microcontroller and transferred to a fieldserver. A program that can receive, save, analyze, and send data to the central server from time to time is installed in the fieldserver. The determination of danger condition and the necessity of evacuation are decided by the program automatically or manually by a trained official who is standby in the central server. In the customary use, the maximum distance of the radio frequency is 2-4 km Line of Sight (LOS) between the sensor and local server while the distance from the local server to the central server is between 10 to 20 km (LOS) and even can be increased to 100 km. The central server has a receiver, PC and a monitor to display the rainfall data and ground movement. If the PC is connected to the internet, then the data will be uploaded automatically and can be accessed via internet or disseminated through sms blasting or social media.
Landslide Monitoring Devices
In the left side of Fig. 4, various landslide early warning and monitoring devices are shown. The devices are developed by Universitas Gadjah Mada (UGM) in cooperation with Indonesian National Disaster Management Agency (BNPB), Provincial and District Disaster Management Agency (BPBD), Ministry for the Development of Disadvantaged Regions (KPDT), the International Consortium on Landslides (ICL) and Kyoto University. The developed monitoring system and the connection can be seen in Fig. 5.
Extensometer and tiltmeter are the most common devices used to monitor surface deformation. As they are installed in the soil surface, they can easily be moved to other locations. This is not possible for the monitoring devices for slip surface movement such as inclinometer, multi-layer movement meter and pipe strain gauge.
32

Proceedings of the IPL Symposium, UNESCO, Paris, 2012
Figure 4 Mechanism of the monitoring system, data transfer and the warning system
The basic principle of extensometer is that the device is installed in between 2 points, one of which is installed on the moving ground. An invar wire or composite wire is connected to the devices at a stable ground and to the potentially unstable ground on the other end. When ground movement occurs, indicated by a change in the relative distance between 2 cross section points, the invar wire will be pulled or loosened. This will activate the sensor and the data recorder. The upper ground extensometer has been installed to monitor ground movement in a mining site in East and South Kalimantan as shown in Fig. 6. The international mining company prefers to utilize a rotary light signal, instead of a sound alarm system due to the noise from heavy equipment at the mining site.
An extensometer has mechanical and electrical mechanism. The mechanical system is supported by spring system that can hold the extension of invar wire to 20-40 m. The extensometer has 2 sensors that areabsolute rotary encoder sensor and tilt sensor. Theabsolute rotary encoder sensor is used to detect a groundmovement with the accuracy of 0.1 mm. The rotaryencoder works with pulley and spring system. Micro-electromechanical systems (MEMS) are used on tiltsensor to measure a change in the slope variation. Therecorded data are among other ground movement (mm)and changes in slope variation (degree) which are thensent to the fieldserver to be processed.
Another commonly used monitoring device is tiltmeter. Tiltmeter is used to monitor changes in slope inclination in the landslide prone areas. Tiltmeter measures changes in slope inclination in X and Y axis with accuracy up to 0.1 degree. It can also measure the diagonal angle value of ground movement direction. The newly developed extensometer and wireless tiltmeter are shown in Fig. 5. The tiltmeter will be further developed using sensor with higher resolution i.e. 0.01 degree.
The developed rain gauge uses the common tipping bucket system, as seen in Fig. 5. It calculates the number of times the buckets tip and converts it to rainfall unit (mm/hours). The data is transmitted to a data logger and can be seen in the LCD monitor. All the monitoring devices are equipped with alarm and rotary light if needed, that can give warning to the community before a disaster happens. The warning criteria can be adjusted to the fieldserver or directly on the monitoring device.
Figure 5 Newly developed devices for landslide monitoring on a network diagram of telemetric system.
Extensometer
Tiltmeter
Automatic Rainfall Recorder (ARR)
Fieldserver: Data acquisition, Data logger
RF module Transmitter
RF module Receiver
PC based monitoring
Internet monitoring
Inclinometer
Multi-layer movement meter
Strain gauge
Pore water pressure sensor
Early Warning
Central Operator
Landslide Field Central Operating
System
Yellow : Caution
Orange: Preparation
Red : Evacuation
Digital Extensometer (Upperground)
Wireless Tiltmeter and its controller
Fieldserver for data acquisition and data loger
Interface for real-time landslide monitoring data on PC/web
Radio Frequency Module Receiver
PC-based monitoring
Automatic Rainfall Recorder (ARR)
Pore water pressure sensor
Warning service
33

Proceedings of the IPL Symposium, UNESCO, Paris, 2012
Figure 6 Installation of digital extensometer at a mining site.
Discussion
Many lessons learned can be gained during the implementation of landslide early warning system in Indonesia. Not only best practices but also failure are obtained. If the local community is not able to operate and maintain the technical system so that it cannot function optimally, it is considered failure. Meanwhile, lost devices can be reduced considerably since the social approach is applied to the local community.
Collaboration and cooperation among various parties can increase the effectiveness of the system significantly. The government, universities, NGOs, and private sectors are responsible to implement the landslide early warning system. Up until now, this landslide EWS has been implemented in Java Island, Kalimantan Island and Sulawesi Island in Indonesia and will be installed in a mining area in Myanmar (Fig. 7).
From the elaboration on the long experience in implementing early warning system in Indonesia and regional area of South East Asia, it can be concluded that the system needs to integrate technical system supported by social system through the involvement of community participation. Using this approach, the technical skill and social skill can be improved simultaneously and can support the landslide early warning system program.
Figure 7 Location of Landslide EWS installation (2007-2012).
The stage of EWS development starts with the technical and social surveys. Afterward the design of the devices can be conducted, following by the determination of warning criteria and the installation-operation-maintenance of the devices. The above phase can be achieved by performing regular training and evacuation drills to increase the community preparedness. For years, the efforts have shown satisfying results in various areas. The installations of the system in the pilot areas in several islands have received full support and commitment from the local community and local authority. The next challenge is to widen the scope of the program and integrate the result of monitoring data with other related institutions. The collaboration and cooperation among various stakeholders are the key to realize community resilience in anticipating disaster.
Acknowledgments
The research is supported by the Asian Joint Research Project for Early Warning of Landslides by International Consortium of Landslides (ICL), Universitas Gadjah Mada (UGM), and DPRI Kyoto University. The projects were financially supported by the Ministry of National Education and being recognized as IPL-158.
References
Andayani B, Karnawati D, Pramumijoyo S, (2008) Institutional frame work for community empowerment towards landslide mitigation and risk reduction in Indonesia. Proc. of the 1st World Landslide Forum, IPL–ISDR. Tokyo. pp. 57-59.
Fathani T F, Karnawati D, (2010) Early warning of landslide for disaster risk reduction in Central Java Indonesia. Early Warning of Landslides, eds. K. Sassa and Y.Yueping. Geological Publishing House, Beijing, China. pp. 159-166.
Fathani T F, Karnawati K, Sassa K, Fukuoka H, (2010) Low-cost and adaptive technology to support a community-based landslide early warning system in developing countries. Disaster Reduction Hyperbase-Asian Application (DRH-Asia), eds. Kameda H, et al. (EDM-NIED Editorial Team). pp. 89-97.
Fathani T.F., Karnawati D., Legono D., and Faris, F. (2011): Development of Early Warning System for Rainfall-induced Landslide in Indonesia. Proceeding of the 2nd International Workshop on Multimodal Sediment Disaster: Asian Cloud Network on Disaster Research. Tainan, Taiwan. pp. 103-113.
Karnawati D, Ibriam I, Anderson M G, Holcombe E A, Mummery G T, Renaud J P, Wang Y, (2005) An initial approach to identifying slope stability controls in Southern Java and to providing community-based landslide warning information. Landslide Hazard and Risk, eds. T. Glade, M.G. Anderson & M. J. Crozier, John Wiley and Sons, New York. pp. 733-763.
Karnawati D, Fathani T F, (2008) Mechanism of earthquake induced landslides in Yogyakarta Province, Indonesia. The Yogyakarta Earthquake of May 27, 2006, Star Publishing Company Inc., Belmont, CA, pp. 8-1 to 8-8.
Karnawati D, Fathani T F, Wilopo W, Setianto A, Andayani B, (2011) Promoting the hybrid socio-technical approach for effective disaster risk reduction in developing countries. Disaster Management and Human Health Risk II, eds. Brebbia CA, Kassab AJ, Divo EA. WIT Press., Southampton, UK. pp. 175-182.
Digital extensometer
Rotary light signal
Cilacap (2011)
Banjarnegara (2007)
Karanganyar (2008-2009)
Situbondo (2007)
South Kalimantan (2009)
South Sulawesi (2008)
Myanmar (2012)
34

� � ��
Proceedings�of�the�IPL�Symposium,�UNESCO,�Paris,�2012�
Distribution� and� characteristics� of� landslides� induced� by� the� Varzeghan�Ahar�earthquake�doublet�(Mw=6.4�and�Mw=6.3)� in�2012� in�Azerbaijan�e�Sharghi,�northwest�of�Iran�
ParhamMemarian(1),� Mohammadreza�Mahdavifar(2)
1)�Geotechnical�Engineering�Research�Center,�International�Institute�of�Earthquake�Engineering�&�Seismology�(IIEES),�Tehran,�Iran�2)�Geotechnical�Engineering�Research�Center,�International�Institute�of�Earthquake�Engineering�&�Seismology�(IIEES),�Tehran,�Iran,�email:�[email protected] �
Abstract�In�this�paper�earthquake�induced�landslides�and�other� geotechnical� phenomena� due� to� August� 11th� 2012�Varzeghan�Ahar� earthquake� doublet� (Mw=6.4� and�Mw=6.3)� in� the� Varzeghan,� Ahar� and� Heris� regions�(located� in� Azerbaijan�e�Sharghi� province� of� Iran)� are�investigated.� A� 4� day� site� visit� managed� 17� days� after�earthquake� occurrence,� in� order� to� determine� types� of�earthquake�induced� landslide,� and� their� distribution� and�concentration.The� most� abundant� landslide� types� were�rock� falls� and� rock� slides.�The� farthest� recorded� rock� fall�was� approximately� 60� kilometers� far� from� the� second�earthquake� epicenter,� and� the� volume� of� the� largest�recorded� rockslide� is� 20000� cubic�meters�with� a� 5�meter�high�scarp.�Several�rock�fall�zones,�some�with�more�than��100� rock� falls� were� recorded� as�well.� Soil� falls,� soil� slides�and� one� soil� flow� are� distinguished� in� the� earthquake�struck� areas.� The� number� of� soil� slides� is� less� than�expected� for� an� earthquake� with�Mw>6� which� is� due� to�low�moisture� content� of� slopes� in� the� summer�when� the�earthquake� occurred.� Other� � geotechnical� phenomena�related� to� earthquake� are� distinguished� including� four�liquefaction� zones� and� two� sinkholes,� which� the� greater�one�have�a�width�of�10�meters�and�depth�of�3�meters.�
Keywords� Varzeghan�Ahar� Earthquake,� earthquake�induced� landslides,� earthquake�induced� geotechnical�phenomena��
Introduction�
Earthquake�induced�landslides�have�an�important�role�in�fatalities,�and�financial� losses�resulted�from�earthquakes.�In� many� earthquakes,� the� resulting� landslides� have�caused�as�much�or�more�damage�than�the�other�effects�of�seismic� shaking� (Wilson� and�Keefer� 1985).� In� this� paper�earthquake�induced� landslides� and� other� geotechnical�phenomena� due� to� Varzeghan�Ahar� earthquake� doublet�are�investigated.�On� August� 11th� 2012,� two� earthquakes� with� eleven�minutes� time� delay� and� magnitudes� of� Mw=6.4� and�Mw=6.3�struck�Ahar�and�Varzeghan�regions�in�northwest�of� Iran� at� 16:53� and� 17:04� local� time,� respectively.� The�
epicenter� of� first� earthquake� was� 23� kilometers� west� of�Ahar� and� the� second� one� was� about� 50� kilometers�northeast� of� Tabriz,� which� were� 13� kilometers� far� from�each� other.� Focal� depth� of� both� events� was� about� ten�kilometers� with� strike�slip�mechanism(Zare� et� al.� 2012).�These� events� resulted� in� 258� fatalities� and� about� 1380�injuries� and� caused� severe� damages� to� the� villages� and�cities�in�the�region�(Official�Reports�2012).�
Most� fatalities� and� injuries� were� reported� from�Bajebaj,� Gouradareh� and� Dabanou� villages� and�Varzeghan�city.��
Maximum�intensity�of�the�earthquake�in�the�scale�of�EMS98� was� VIII+� at� epicenter� zone� (especially� in�Varzeghan� city� and� villages� of� epicenter� zone);� the�intensity� was� VII,� VI� and� V� for� Ahar,� Heris� and� Tabriz�cities,�respectively.�First�event�epicenter�location�and�iso�intensity�map�are�illustrated�in�Fig.�1�&�2,�respectively.�
��
�Regional�setting�
�Climate�Varzeghan�Ahar�region�located�in�northwest�of�Iran�has�a�Mediterranean� climate,� characterized� by� seasonality� in�temperature.�Such�a�climate� in�most�places� in�the�world�has� mild� and� rainy� winters� and� long,� hot� and� dry�summers;�but�the�winter�of�the�Mediterranean�climate�in�northwest�of�Iran�is�cold�and�snowy.�The�precipitation�of�the� region� is� affected� by�Mediterranean�wet� air�masses,�cold�northern�weather� effects,� and� temperature� changes�near� Oroumieh� Lake.� Based� on� Ahar� meteorological�station� data� (19� kilometers� far� from� first� earthquake�epicenter),� mean� annual� precipitation� of� the� region�ranges�between�205�and�340�mm.�Annual�precipitation�in�the� earthquake� year� was� 316.4� mm� and� the� last� rain�before� the� earthquake,�was� on�August� 1st� 2012,� (10� days�before� the� earthquake)� when� 4� mm� of� precipitation�occurred,� total�precipitation�from�1st�May�to� 11th�August�when� the� earthquake� occurred� (more� than� three�month�period)�was�109.6�mm�(IRMO�2012).��
35

P.�Mem
Figure�2012)�
Figure�double
�TopogStudy�Iran,�i1320� tVillag
�GeologThe�Vof� sedsedimCretaccompoweathpredo
marian,�M.�R.�Ma
1�Epicenter�m
2� Iso�intenset�(zare�et�al.�2
graphic�and�Gearea� locatin
is�a�mountainto� 2860� metes�are�located
gic�settingVarzeghan�Ahdimentary� an
mentary� depoceous�througosition,� deghering.� Marminate.�Base
ahdavifar�
map�of�first�Var
sity� map� of�2012)�
eographic�setng� in� Azerbanous�region�wters� above� sed�in�the�regio
har� area� is�und� volcanic�sits,�most� ofgh�Quaternargree� of� conrl,� Sandstoned�on�1:250,00
zeghan�Ahar�e
Varzeghan�A
tting�aijan�e�shargwith�altitudeea� level.� 4� ton.�
underlain�by�rocks� and� uf� which� rangry.�The�rocks�nsolidation� ane� and� Vo00�geologica
event�(Zare�et�
Ahar� earthqua
hi� province�s�ranging�frotowns� and� 2
a�wide�varieunconsolidatge� in� age� frovary�greatly�and� depth�olcanic� rocl�maps�of�Ah
al.�
ake�
of�om�236�
ety�ted�om�in�of�
cks�har�
and�Tarea�1.�Qu2.�Pli3.�Ol4.� Msand5.�Cr
Marlhigh�lands
GeotAhar
Varzlands
EarthDue�besiddata,deterand�d
falls�Ahar
descrclassslidecohesprea
due�t
DisruRocklandsHundfromsome
rock�Tabrepicemotirocks
and sseversheepvillagdestro
Tabriz�Poldainclude:�uaternary�depiocene�congloigocene�dasit
Miocene� gypsstone;�etaceous�marBecause� of�s)� and� moupotential� o
slides�in�the�r
technical� phr�earthquake
Many� geoteeghan�Ahar�slides,�liquefa�
hquake�induceto�lack�of�podes� studying,�a�site�visit�wrmine� earthqdistribution.�.Many� landsbesides� one�r�earthquake.In� the� beribed� based�ified� seismics�and� falls� inrent�slides�inads�and�flowsRecorded� lato�Varzeghan�
upted�rock�fallk� disrupted�slide� types� idreds�of�rock
m�the�earthque�are�shown�iFig.� 7� showsfall� zones�
iz� and� 50� kenter,� bouldon� and� the�s�on�the�in�siSome losses lides such as: ral� rock� slidp�from�a� flocge, and manoyed due to ro�
asht� (Fig.� 3)�
posits�includiomerate�and�tic�breccias.�siferous� and
rl,�molasses�alandslide�senntainous� topof� landslidinregion�suppo
henomena� re�
echnical� pheearthquake,�action�and�si
ed�landslidesst�earthquakg� documentswas�organizedquake�induce
slides� includisoil� flow� w��low� landslion� Keefer� cc� landslides�n� rock,�disrun�soil,�coheres�in�soil�(Keefandslides� andn�Ahar�earthq
ls�and�slides�landslides�
induced� by�k�falls�and�sluake�epicentein�Fig.�5�&�6.�s� rocks� trajeof� Varzegh
kilometers� faders� has� fall
resultant� sctu�boulders�iwere occurrethe�Khaje�Ahdes� immediack�were�killey trees were
ock fall in Gou
the�main� fo
ing�terraces�asiltstone;�
d� silty� marl
and�sandstonnsitive� formpography,� thng;� existencorts�this�fact.�
resulted� fro
enomena� ocincluding�diinkholes.��
ke�aerial�phots,� maps� andd�17�days�afteed� landslides
ing� rock�andwere� induced�
ides� are� caclassificationin� five� gro
upted�slides�aent�slides�in�rfer�1984).�d� probable�quake�are�illu
are� the� mearthquakeslides�up�to�60er�were�distin
ectory� of� onehan�Ahar� eafar� from� thelen� due� to�cratches� creis�shown�in�Fed because ofhar�road�wasately� after�ed by rock falle broken anuradareh villa
rmations� of�
and�alluvium
,� siltstone� a
ne;�ations� (suchhe� region� hae� of� old� hu
om� Varzegh
ccurred� due�ifferent� types
tos�of�the�regd� other� exister�earthquakes� characteris
d�soil� slides�aby� Varzegh
ategorized� an.� Keefer� (19oups:� disrupand� falls� in� srock,�and�late
landslide� zoustrated�in�Fi
most� comms� (Keefer� 1980�kilometersnguished,�wh
e�of� the� fartharthquake� ne� second� evstrong� grou
eated� by� fallFig.�8.�f these rock fs�blocked�dueearthquake,�l near Choupa
nd gardens wage.
the�
ms;�
and�
h� as�as� a�uge�
an�
to�s�of�
gion,�ting�e�to�tics�
and�han�
and�984)�pted�soil,�eral�
ones�ig.4.�
mon�84).��far�hich�
hest�near�vent�und�ling�
falls e�to�40�
nlarwere
36

Proceedings�of�the�IPL�Symposium,�UNESCO,�Paris,�2012
Figure�3�Geology�map�of�the�study�area
�
Figure�4�Earthquake�induced�landslides�and�probable�landslide�zones
37

P.�Memarian,�M.�R.�Mahdavifar�
�
��
Figure�5�Rock�slide�in�the�Sattar�khan�Dam�access�road�(zare�et�al.�2012)�
�
Figure� 6� Rock� slide� accompanying� with� rock� fall� near�Nasriabad�e�ghadim�village�
�
Figure�7�Rock�fall�trajectory�
�
��
Figure�8�Scratches�resulted�from�falling�rocks�
�
Figure�9�Soil�block�slide�3�kilometers�northwest�of�Choupanlar�village�
�
Figure�10�Soil�block�slide�near�Karavigh�village�
���
38

Proceedings�of�the�IPL�Symposium,�UNESCO,�Paris,�2012
Coherent�Soil�slides�After� disrupted� rock� falls� and� rock� slides� the� most�abundant�types�of�landslides�are�soil�block�slides�and�soil�slumps;�but�despite�high�sensitivity�of� formations�of� the�region,�number�of� these� landslides� is� lower� than�what� is�expected.� This� is� probably� because� earthquake� has�occurred�in�the�season�of�summer�when�the�ground�was�dry.�Ground�moisture� is� one�of� the�most� important� and�facilitating� factors� in�soil�coherent� landslides�occurrence�(Keefer� 1984).� The� occurrence� of� seismic� soil� coherent�landslides�in�near�springs,�rivers�and�wet�regions�support�this� fact.�For� instances�a�soil�block�slide�occurred� in� the�vicinity�of� a� spring�near�Bajebaj�Choupanlar� road,� and�a�soil�block�slide�triggered�next�to�Dourigh�chaay�river�near�Karavigh� village.� Also� several� soil� slides� occurred� in� a�humid�valley�3�kilometers�northeast�of�Choupanlar�village�(Fig.�9�&�10).�
Coherent�rock�slides�and�disrupted�soil�falls�In� earthquakes,� coherent� rock� slides� and� soil� falls� are�infrequent� comparing� to� two� previous� landslide� classes�(Keefer�1984).�The�number�of�soil�falls�and�coherent�rock�slides�due�to�Varzeghan�Ahar�earthquake�was�low�as�well.�Though,�one�of�the�biggest�and�most�important�recorded�landslides�was�a�big�reactivated�rock�block�slide.��
Soil�lateral�spreads�and�flows�Soil�lateral�spreads�Lateral� spreading� is� defined� as� the� mostly� horizontal�deformation� of� gently� sloping� ground� as� a� result� of� soil�liquefaction�(Rauch�and�Martin�2000).�
Two� lateral� spreads� occurred� during� Varzeghan�Ahar� earthquake,� the� first� one�with� length� of� about� 100�meters�and�width�of�8�meters�was�in�Nosham�plain�near�Gamand� village,� the� cracks� were� developed� up� to� 20�meters�far�from�the�river�(Fig.�11).�The�settlement�due�to�this� lateral� spreading� was� approximately� 0.5� meter.�Another� lateral� spreading� was� developed� 1� kilometer�south� of� SheikhRajab� village� in� the� vicinity� of� Aaji�chay�River.�
�
Figure� 11� Lateral� spreading� in� Nosham� plain� near� Gamand�Village�with�0.5�meter�settlement�of�the�river�bank��
Soil�flow�Because� the� Varzeghan�Ahar� earthquake� occurred� in� a�dry� season,� slopes� were� dry� and� only� one� soil� flow�occurred�during�the�earthquake.�This�soil�flow�was�found�near�Bajebaj�Choupanlar�road,� in�the�vicinity�of�a�spring�on� the� upper� part� of� a� slope.� As� a� result� of� earthquake�shaking�a�soil�block�slide�was�initiated�on�the�slope�which�then�was�converted�to�a�soil�flow�near�the�spring�(Fig.�12).���
�
Figure� 12� Soil� flow� near� Bajebaj�Choupanlar� road� (zare� et� al.�2012)�
Reactivated�landslidesSome� old� landslides� reactivated� during� Varzeghan�Ahar�earthquake;� the�most� important�one�was�a�big� rockslide�in�the�Bajebaj�Choupanlar�road.�The�scarp�height�of�this�rock�slide�is�5�meters�and�the�maximum�width�and�length�are� 95� and� 60� meters,� respectively.� About� 20000� cubic�meters� of� rock� mass� has� been� moved� due� to� this� rock�slide�(Fig.�13�&�14).�New�cracks�were�tracked�50�meters�far�from� the� main� scarp� which� shows� considerable�movement�of� the� rock�mass�during� the�earthquake.�Slip�surface�slope�of�the�slide�is�about�25�degrees.�
Other� instances� of� reactivated� landslides� due� to�Vaezeghan�Ahar� earthquake� are�Nasiraabaad� village� soil�slides� (in� marly� deposits)� with� about� 0.5� to� 1� meter�downward�movement�and�a� soil� slumps� in� the�northern�parts� of� Choupanlaar� village� and� south� parts� of�Saariyarghan� village.� As� mentioned� before,� most� of�reactivated� landslides� are� located� in� regions� with� high�ground�moisture�as�well.�
39

P.�Memarian,�M.�R.�Mahdavifar�
Figure�13�Rock�slide�mass�with�about�5�meters�depth�
Liquefaction�and�sinkholesLiquefaction�prone�areas�as�well�as�recorded�sinkholes�are�shown�in�Fig.�15.��Liquefaction�Liquefaction� is� defined� as� the� transformation� of� a�granular� material� from� a� solid� to� a� liquefied� state� as� a�consequence� of� increased� pore� water� pressure� and�reduced�effective�stress� (Marcuson� 1978).� Increased�pore�water� pressure� is� often� induced� by� the� tendency� of�granular� materials� to� compact� when� subjected�to�earthquake�induced�cyclic�shear�deformations.��
Liquefaction� zones� were� found� in� Nosham� and�Lavarik� plains� near� Marjanlaar� and� Gamand� villages,�respectively�as�well�as�near�Karavigh�village.�The�recorded�liquefaction� zones� materials� differ� from� small� grained�sand�to�silt�(Fig.�16�&�17).�
�Sinkhole�Two�sinkholes�were�recorded�related�to�Varzeghan�Ahar�earthquake;�the�first�one�located�near�the�access�bridge�of�Markid�on�the�river�bed�with�a�diameter�of�approximately�2� meters.� The� second� and� bigger� one� located� near�Marjanlar� village,� the� sinkhole� diameter� is� about� 10�meters� and� its� cracks� were� developed� up� to� 15� meters�from�the�sinkhole�(Fig.�18).��
Only�25�meters�farther�and�on�the�river�bed�a�liquefaction�zone� was� found� which� relates� to� the� big� sinkhole�occurrence.�
�
Figure�14�Bajebaj�Choupanlar�road�rock�slide�scarp�
��
Summary�and�Conclusions�
Varzeghan�Ahar� earthquake� triggered� many� landslides�and�other�geotechnical�phenomena.�
A�big� reactivated� rock� slide�with�more� than�20,000�cubic� meters� of� mass� volume� and� several� rock� falls�including�rock� fall�zone�with�more�than� 100�rock� falls,�a�soil� flow,� two� lateral� spreading� zones,� two� liquefaction�zones,�and�two�sinkholes�were�among�them.���
Disrupted� landslides� such� as� rock� falls,� rock� slides,�and� soil� falls� are� affluent� in� the� landslide� struck� region,�but�coherent�landslide�types�are�much�less�than�expected.�
Moisture�content�of� slope�has�an� important� role� in�the�occurrence�of� coherent� landslides�especially� in� soils.�Taking� into� account� the� existence� of� landslide� sensitive�marly� sedimentary� deposits� all� over� the� area� as� well� as�mountainous� topography,� the� Varzeghan_Ahar�earthquake�(Mw=6.4)�was�strong�enough�to�trigger�large�number�of� coherent� landslides� in� the� region,� but�only� a�few� landslides� of� this� type� occurred� as� a� result� of� low�moisture� content� of� slopes.� As� mentioned� before�Varzeghan�Ahar� earthquake� occurred� in� summer� when�the�slopes�were�almost�dry,�last�rain�had�occurred�10�days�before�earthquake�with�4�mm�of�precipitation,�and�total�precipitation� from� 1st� May� to� 11th� August� when� the�earthquake� occurred� (more� than� three� month� period)�was� 109.6� mm,� all� these� circumstances� resulted� in� low�water� content� of� slopes� as� the� reason� of� low� coherent�landslides�occurrence�and�reactivation.�
5 meters
40

Proceedings�of�the�IPL�Symposium,�UNESCO,�Paris,�2012
Figure�15�Liquefaction,�liquefaction�probable�zones,�and�sinkholes�due�to�earthquake�
Figure�16�Liquefaction�in�the�vicinity�of�Marjanlar�village�
�
Figure�17�Liquefaction�zone�in�the�vicinity�of�Marjanlar�village�
41

P.�Memarian,�M.�R.�Mahdavifar�
Figure� 18� Sinkhole� with� ten� meters� width� in� the� vicinity� of�Marjanlar�village�
�References�
IRAN� Meteorological� Organization� (IRMO)�Bureau� of� Meteorology�east�Azerbaijan�statistics.�http://www.eaz.ir/english/
Keefer� D� K� (1984)� Landslides� caused� by� earthquakes.� Geological�Society�of�America�Bulletin�95�(4):�406–421.�
Marcuson�W� F� (1978)� Definition� of� terms� related� to� liquefaction.�Journal�of�Geotechnical�Engineering,�ASCE.�104(9):�1197�1200.�
Official� report� from� Legal� Medicine� organization� and� National�DisaterManagement� Organization� of� Azerbaijan�e�sharghi,�Sources:�http://www.bohraan.com/NewsDetail.aspx?itemid=1524http://www.khabaronline.ir/detail/235338/�
Rauch�A�F,�Martin� J�R� (2000)�EPOLLS�model� for�predicting�average�displacements� on� lateral� spreads.� Journal� of� Geotechnical�Engineering,�ASCE.�126(4):�360�371.�
Wilson� R,� Keefer� D� K� (1985)� Predicting� areal� limits� of� earthquake�induced� landsliding.� U.S.� Geological� Survey� Professional� Paper�1360:�317–345.
Zare� M,� Kalantari� A,� Ansari� A,� Haghshenas� E,� Davoodi� M,�Mostafazadeh�M� (2012).� Perliminary� report� of� Varzeghan�Ahar�earthquake�doublet�11�August�2012.�IIEES.�
��
42

��
�������Proceedings�of�the�IPL�Symposium,�UNESCO,�Paris,�2012�
�
A�New�Approach�to�the�Landslide�Early�Warning�Using�the�Chemical�Composition�Fluctuation�in�the�Leakage�from�Susceptible�Slopes�
�
Zieaoddin�Shoaei(1),�Iman�Kermani(2)��1)�Soil�Conservation�and�Watershed�Management�research�Institute,�Tehran,�P.O.�Box�13445�1136,�and�civic�number,�+98�21�44901415�2)�Azad�University,�Science�and�Research�Unit.�Tehran,�Hesarak�Campus��
�
Abstract� Landslides� are� natural� disasters� that� annually�inflict�great�damages�to�public�and�private�properties�and�may�be� associated�with� loss� of� life� and� injury.� In� recent�decades,� research� on� developing� methods� of� predicting�the� time� of� landslide� occurrence� has� been� one� of� the�important�attempts�made�by�scientists.��Since�in�some�type�of�material,�landslides�are�preceded�by�the� occurrence� of� undetectable�movements� that� cannot�be� recorded� and� revealed� by� conventional� detection�instruments,� recording� of� the� chemical� changes� of� the�water� flowing�out� from�the� toe�of� the�slopes� susceptible�to�sliding�can�provide�important�and�reliable�indicators�of�landslide� activities� and� early� warning.� In� the� present�study,� the� changes� in� the� chemical� composition� of� the�water� seeping� out� from� the� toe� of� the� landslide,� which�can� be� affected� by� the� landslide� activities,� were�investigated.� This� process� was� studied� in� a� laboratory�model,� in�which�a�sliding�surface�was�simulated�and�the�changes� in� the� ion� concentration� of� potassium,� sodium,�magnesium,� calcium,� sulfate,� chlorine,� and� bicarbonate�as� well� as� EC� and� pH� in� the� stable� state� and� in� the�conditions�of�slight�rupture�along�the�sliding�surface�were�investigated.� The� results� indicated� that� the� chemical�changes�in�the�out�flowing�water,�particularly�changes�in�the�concentration�of�some�ions,�could�be�used�as�suitable�indicators�for�early�warning�of�the�landslide�occurrence.���Keywords� Landslide,� Monitoring,� Leakage� Chemical�Composition,�Early�warning.��Introduction�
Study� of� natural� disasters,� has� been� in� the� focus� of�research� by� scientists� and� scientific� societies� in� recent�decades.�The�main�objective�of�most�of�these�studies�has�been� to� understand� the� phenomena� and� the� factors�affecting� their� occurrence� in� order� to� develop� some�methods�for�their�prediction�and�control.�Considering�the�available� technologies�and� the�high�costs�of�monitoring,�the�majority�of�these�studies�and�the�prediction�methods�for� events� such� as� earthquake,� flood,� and� landslides� are�based� on� statistical� analyses,� with� reasonable� success.�Along� with� the� progress� in� developing� suitable�
technologies� for� monitoring� instrumentation� and�information� transfer� in� recent�years,� research�has�begun�on� prediction� of� the� time� of� occurrence� and� post�event�behavior� of� natural� phenomena.� Landslides� are� also�among�such�events�that�have�been�recognized�by�human�since� old� times� and�many� studied�have�been� conducted�for� their� understanding� and� control.� However,� the�complexity� of� the� sub�surface� structures� from� the�standpoint� of� geology� and� geological� engineering,�together� with� the� uncertainties� associated� with�precipitations� forecasts,� the� diversity� in� groundwater�behavior� in� slopes,� the� unpredictability� of� the� time� of�earthquakes� and� its� severity,� and�many� other� unknown�factors� add� to� the� difficulty� of� understanding� the�processes�leading�to�landslides.�Therefore,�it�may�be�said�that� one� of� the� most� effective� and� reliable� methods� in�prediction�of�time�and�behavior�of�landslides�occurrence�is� the� monitoring� of� the� movement� behavior� of� some�slope�areas�in�a�region�together�with�the�changes�in�other�effective�factors�in�order�to�provide�a�remedial�work�plan�and�issue�early�warning.�
In� order� to� monitor� the� behavior� of� slope� activities,� in�addition� to� measurement� of� surface� motion� that� is� a�direct�measurement�of�the�slope�displacement�with�time,�other� environmental� factors� affecting� the� slide� should�also� be� monitored� (Shoaei� et� al.� 1996).� Some� of� these�instruments� directly� measure� the� observable�displacement� along� the� sliding� surface� in� one� direction,�while� others,� such� as� dual� frequency� global� positioning�system� (DGPS),�measure� the� changes� in� the� geographic�position� of� a� point� on� the� sliding� surface� in� three�directions�(Shoaei�and�Imamjomeh,�2002).�Besides� these�surface� instruments,� other� equipments� have� been�designed� for� determination� of� in�depth� displacement�distance�of�the�actual�slide�surface.�However,�in�addition�to� high� procurement� and� maintenance� costs,� each� of�these� instruments� has� technological� limitations� that�eventually�lead�to�a�series�of�uncertainties�in�the�obtained�information.�
Usually,� most� landslides� have� early� signs� that� could� be�used� in� predicting� the� occurrence� of� the� main� failure�
43

Zieaoddin�Shoaei,�Iman�Kermani�–�A�New�Approach�to�the�Landslide�Early�Warning�Using���
(Shoaei�et�al.,�2001).�Therefore,�the�most�important�issue�in� prediction� of� the�main� failure� in� potentially� unstable�slopes� is� the� presence� or� absence� of� observable� early�warning� signs� before� the� main� slide� occurs.� In� some�research,�it�has�been�shown�that,�usually,�in�fine�grained�soils,� the� sliding� behavior� is� creeping� type,� in� which�prediction� will� be� possible,� if� the� phases� of� the� creep�consisting�of� the�primary,� secondary,� and� tertiary� creep,�are� carefully� monitored� and� recognized� (Shoaei� and�Karamsoltani,� 2011).� � Also,� Shoaei� (2010)� showed� that� in�coarse� textured� soils� such� as� loess� and� sand,� landslide�occurrence� is� sudden� and� there� is� almost� no� sign� of�movement� before� the�main� failure� that� can�be� recorded�by�the�conventional�instruments.�
Considering� the� mechanism� of� formation� of� a� sliding�surface�in�a�soil�mass,�it�is�acceptable�that,�in�most�cases,�before�any�movement�can�be�observed�on�the�surface�or�in� the� observation� wells,� a� very� slow� movement� starts�along�the�sliding�surface�that�gradually�continues�to�form�the� sliding� surface.� After� this� surface� is� formed,�observable� movements� can� be� recorded� by� the�conventional� instruments.� In�many� landslides,� the� short�time�interval�between�the�formation�of�the�sliding�surface�and�occurrence�of�the�landslide�does�not�allow�provision�of� the� necessary� mitigation� and� risk� management�services.� Therefore,� if� the� small� and� slow� movements�within� the�sliding�surface�can�be�sensed�and�revealed,� it�will� be� possible� to� issue� early� warning� notices� in� a�suitable�time�interval.�In�the�present�study,�the�possibility�of�monitoring� the� initial� and� undetected�movements� of�the�sliding�surface�is�investigated�through�the�impacts�of�those� movements� on� the� changes� in� the� chemical�composition�of�water�seeping�out�at� the�surface�of�slope�and�using�it�as�an�early�warning�sign.�
Review� of� the� research� on� landslide� shows� that� the�presence�of�water�is�one�of�the�main�factors�in�provoking�slopes� and�usually�90%�of� landslides�occur�on� saturated�or� semi�saturated� surfaces� (Yan,� 1994).� Even� in� some�landslides,� in� spite� of� the� total� sliding� mass� being�unsaturated,�the�presence�of�a�saturated�clay�layer�in�the�body� of� the� masses� can� activate� the� landslide� (Mollard�and�Hughes,� 1973).�The�saturated� layer�may�be� thin�and�limited� to� the� shearing� surface� whose� fine� structural�changes�can�be�an�important�factor�in�changing�the�shear�strength� of� the�whole� slope� (Moon,� 1993).� In� some� clay�layers,� the� decrease� in� shearing� strength� is� proportional�to� the� amount� of� water� absorption,� such� that,� at�saturation�of�the�layer,�it�is�at�the�minimum,�that�in�soils�with� more� sensitive� clay,� this� process� proceeds� faster�(Soderblum,� 1974).� In� the� first� part� of� the� study,�determination� of� soil� characteristics� provides� a� good�criterion� for� estimating� and� evaluating� landslide�behavior.� The� more� the� similarity� of� a� soil� behavior� to�those� of� clay� soils,� the�more� there�will� be� early� signs� of�sliding� (Zung� et� al.,� 2008;� Shoaei,� 1996).� The� sliding�process� in� these� soils� is� in� the� form� of� successive� and�
gradual�movements� that,� unusually,� take� place� on�more�gentle� slopes� (Chatwin�et�al.,� 1994).� In� fine�grained�soils�with�high�plasticity,�90%�of�soil�shearing�strength�may�be�lost�upon�absorption�of�water.�This� loss� is�probably�due�to� soil� expansion� and� disruption� of� the� bonds� between�soil� particles� (Leroueil� and� Vaughan,� 1990).� Following�this� phenomenon,� the� soil� mass� may� experience� small�shears�and�disruption�in�its�natural�drainage,�which�could�in�turn�result� in�changes�in�the�chemical�composition�of�the� water� percolating� through� the� soil� profile.� The�relationship� between� changes� in� the� opening� of� the�surface� cracks� in� a� landslide� and� changes� in� the� ionic�composition�of�water�seeping�out�of�the�sliding�mass�has�been� reported� in� some� research� (Sakai,� 2001,� 2009).� In�those�researches,� it�was�shown�that�the�increase� in� ionic�concentration�had�a�direct�relationship�with�the�opening�of� cracks� and� the� fissures� newly� formed� as� a� result� of�movement�on�the�slope.��
It�has�been�well�established�that�cation�exchange�is�one�of�the� important� properties� of� clay� soils.� Due� to� its�structural� network� resulting� from� octahedral� and�tetrahedral� arrangement,� a� clay� unit� has� a� negative�charge�on�its�surface�which�attracts�and�adsorbs�the�free�cations� in� its� surrounding� environment.� These� cations�surround� the� clay� particles� with� different� absorption�forces.�The�surface�and�outer�part�of�this� layer�of� ions� is�under�weaker� force�and�can�be� leached�and�drained�out�by�the�flowing�water.�In�addition�to�the�important�role�of�clay� particles� in� ions� exchange� capacity� of� the� soil,� the�type� of� clay� is� also� very� effective� in� this� respect.� For�example,� in� clays� such� as� chlorite� and�montmorillonite,�the� ions� are� not� only� adsorbed� to� the� surface,� but� they�also� occupy� the� interlayer� spaces� of� clay� that� can� be�exchanged� with� surrounding� particles.� However,� the�latter�ions�have�no�high�exchange�capacity.�Ion�exchange�capacity�in�sandy�soils�is�low�or�non�existent.�
The� summary� of� the� concept� used� in� this� work� can� be�summarized�as�follows;�
1. Water� that� has� infiltrated� a� sliding� mass� of� soil�moves� through� the�pores� in�certain�pathways� toward�lower�positions�down�the�slope.�
2. The� draining� water� will� dissolve� different�compounds� along� its� way� depending� on� their�composition�and�pH�and�will�transfer�them�out�of�the�soil�mass.�
3. If� the� soil� structure� remains� intact,� the� chemical�composition�of�the�water�will�also�remain�constant.�
4. In�case�the�structural�is�disrupted�by�events�such�as�displacement� of� the� sliding� surface,� the� drainage�condition� and� path� of� the�water�movement�will� also�change,�resulting�in�changes�in�dissolution�of�the�ions�and�ion�exchanges�of�the�water�with�the�surrounding�environment,� thereby� affecting� the� concentration� of�the�ions�in�the�water�seeping�out�of�the�soil�mass.�
44

Proceedings�of�the�IPL�Symposium,�UNESCO,�Paris,�2012
5. In� case� such� changes� are� recorded� continuously,�their�monitoring�could�be�used�as�a�sign�of�the�onset�of� a� landslide� that� can� be� used� for� monitoring�landslide�behavior�and�possibly�prediction�of� its�time�of�main�failure.�
Considering�the�diversity�of�the�chemical�composition�of�the�natural�soils,�chemical�analysis�of�soils�for�recognition�of� the� compounds� and� elements� susceptible� to� leaching�in� each� region� should� precede� the� establishment� of� the�chemical�monitoring�plan.��In�the�present�research,�this�process�was�investigated�in�a�laboratory� model,� in� which� a� sliding� surface� was�simulated� and� the� changes� in� the� ion� concentration� of�potassium,� sodium,� magnesium,� calcium,� sulfate,�chlorine,� and� bicarbonate� as� well� as� EC� and� pH� in� the�stable�state�and�in�the�conditions�of�slight�rupture�along�the�sliding�surface�were�investigated.�
��
Materials�and�methods�
Saturated�sliding�surface�model�
The�sliding�model�made�had�basal�dimensions�of�130x170�cm�and�a�height�of�70�cm�that�was�placed�in�a�container�box� of� transparent� Plexiglas� with� the� same� dimensions.�Figure�1�shows�a�longitudinal�cross�section�of�the�model.�As�shown�in�the�figure,�in�order�to�control�and�direct�the�seepage�water� along� a� sliding� surface,� the� lower� part� of�the� model� is� made� of� a� unified� impermeable� block� in�which� all� the� joints� are� waterproofed� with� silicon� glue,�preventing� any� leakage� downstream� of� the� block.� The�external� surface�of� this�block�with�a� slope�of� 30�degrees�constitutes�the� lower�part�of� the�sliding�surface.�On�this�surface,� the� soil� layer� is� laid� as� the� model� of� sliding�surface.� To� prevent� soil� sliding� during� shearing�displacement,� a� number� of� nails� have� been� driven� into�the�surface�with�an�effective�height�of�about�2�cm�in�the�soil.�
On� the� upper� part� of� the� soil� layer,� a�moveable� plate� is�placed�which� has� a� number� of� nails,� similar� to� those� in�the�lower�surface,�to�ensure�its�complete�contact�with�the�upper�part�of�the�soil�and�prevent�its�sliding�over�the�soil�surface.� In� order� to� control� soil� compaction� and� the�original�soil�structure�of�the�sliding�surface�at�the�time�of�leaching�and�shearing�displacement,�two�guiding�beams,�were�installed�on�the�wall�of�container�along�the�slope,�on�which� the� moveable� plate� rests� and� cannot� move�vertically.�A�complete�view�of�the�physical�model�made�in�the�laboratory�is�shown�in�Fig.�2.�
Considering�the�necessity�of�using�the�constant�chemical�composition�of�the�inflowing�water�throughout�the�study,�the�total�water�needed�for�this�work�was�stored�in�a�180�liter� tank� at� a� proper� hydraulic� head� (Fig.� 2).� Also,� to�control�the�hydraulic�head�of�the�water�flowing�over�the�sliding� surface,� a� secondary� tank� was� attached� to� the�
model�to�provide�the�inflow�water�needed�for�the�model�(“w”� in� Fig.1).� The� height� of� water� in� this� tank� is�controlled�by�an�automatic�water�tap.�Since�the�sudden�change�in�the�hydraulic�gradient�at�the�inflow� and� outflow� sections� of� the� model� could� cause�turbulent�flow�and�disturbance�of�soil�structure,�two�felt�filters� with� a� thickness� of� 2� cm� were� placed� at� the�upstream�and�downstream�sections�of�the�sliding�surface.�At� the� downstream� part� of� the� slope,� a� narrow� groove�was� made� across� the� model� width� to� collect� the�outflowing� water� (Fig.� 1).� The� water� in� the� groove� was�guided�out�of�the�model�and�was�collected�in�a�graduated�cylinder� to� be� taken� to� the� laboratory� for� chemical�analysis.��
��
Fig. 1. Longitudinal cross section of a physical model made for a saturated sliding surface.
�
��
Fig.2. A complete view of the physical model made in the laboratory.
Preparation�of�the�sampleConsidering� the� objectives� of� the� study,� the� soil� should�have� the� proper� compaction� for� simulating� the� sliding�surface,� and� adequate� permeability� to� allow� water�movement� through� it.� Besides,� the� soil� should� contain�suitable�clay�minerals� to�participate� in� the� ion�exchange�processes.�To�this�end,�a�silty�clayey�soil� from�a�mine� in�southwest�Tehran,�was� selected� and� sampled.� Study� the�bulk� composition� through� X�ray� diffraction� analysis�
45

Zieaoddin�Shoaei,�Iman�Kermani�–�A�New�Approach�to�the�Landslide�Early�Warning�Using���
showed� the� presence� of� chlorite,� illite,� and�montmorillonite� in�the�sample�with�the�latter�being� less�than� the�others.�Also,� to�determine� the�general�physical�and�mechanical�characteristics�of�the�soil,�grain�analysis,�Atterberg� limits,� direct� shear� test� under� saturated�condition,�and�permeability�with�a�bulk�density�similar�to�that� in� the�model�were� performed.� The� results� of� these�tests� are� shown� in� Table� 1.� Considering� the� presence� of�27%�clay,�43%�silt,�and�30�%�sand,�this�soil�is�in�class�CH�according�to�the�Unified�Classification.��Table 1 Physical and mechanical properties of the soil used in the physical model.
�Since�steady�flow�of�water�in�the�soil�is�necessary;�the�soil�sample�should�be�relatively�homogeneous�with� isotropic�compaction.� Therefore,� extra� care� must� be� taken� while�pouring�the�soil�in�the�model�and�its�compaction.�For�this�purpose,� after� selecting� adequate� soil� sample,� it� was�wetted�and�uniformly�compacted.�It�was�poured�into�the�model� in� several� layers� and� that� was� compacted�separately.� The� pouring� and� compaction� of� the� soil� sample� was�continued� until� the� thickness� of� the� soil� in� the� model�reached� the� value� of� 10cm.� Then,� the� upper�layer� plate,�which�had�been�equipped�with�2�cm�nails� similar� to�the�lower�plate,�was�placed�on�the�soil�surface.�It�tapped�and�pushed�gently�so�that�the�nails�penetrated�the�soil.�At�the�end�of�this�step,�the�bulk�density�of�the�soil�was�measured�as� �w=1.7� g/cm
3,� which� was� relatively� similar� to� that� of�soils�in�natural�earth�slopes.��Operation�of�the�model�After� soil� was� placed� in� the� model,� the� water� tank� was�connected� to� the�model� and� its� operation� started.�Once�the� secondary� tank� ("w"� in� Fig.� 1)� was� filled,� water� was�flowing� slowly� through� the� upstream� felt� filter� (F)� into�the�sliding�surface�and,�under�the� influence�of�hydraulic�gradient,�passed�along� the�slope�downward� to� the� lower�parts� of� the� sliding� surface.� At� this� point,� water�permeated� through� the� lower� felt� filter� (F)� and� was�collected� in� the�water� collector� groove�at� the�bottom�of�the�model.�The�collected�water�was�later�sent�to�the�lab�in�special� containers� for� chemical� analysis.� Generally,� the�model� operation� was� conducted� in� two� phases� as�explained�below.��First�phase�The� soil� sample�was� taken� from�the�mine�as�a�disturbed�sample�and�was�poured�in�the�model�unsaturated.��It�was�expected� that� in� the� first� run� of� the� study,� the�
concentration� of� different� elements� in� the� outflowing�water�would�be�high.�Therefore,�the�first�run�of�the�model�operation� was� continued� until� the� inflowing� water�saturated� the� sliding� surface� and� leached� elements� and�free� or� exchangeable� ions,� while� their� concentration�remained�constant.�Therefore,� to� control� the� changes� in�the� concentration� of� the� elements� under� consideration�and�changes�in�the�chemical�parameters,�water�sampling�started�at�the�toe�of�the�sliding�surface�immediately�after�water� left� the� model� outlet.� This� was� followed� by�chemical� analysis� of� the� water� samples.� As� stated�previously,�changes�in�the�ion�concentration�of�potassium,�sodium,� magnesium,� calcium,� sulfate,� chlorine,� and�bicarbonate�as�well�as�EC�and�pH�were�investigated.�The�first� run� was� continued� until� the� changes� in� ionic�concentrations�reached�a�minimum�value.�Water�samples�were� collected� in� a� 1000� ml� container� and� sent� to� the�laboratory.� In� the� first� run,� a� total� of� 24� such� samples�were�collected�from�the�start�of�the�run�to�the�time�when�the� ionic� concentrations� remained� constant.� This� phase�of�the�study�lasted�for�637�hours,�during�which�almost�all�of�the�ionic�concentrations�reached�a�reasonably�constant�level.� Once� this� constant� level� was� reached,� the� second�phase�of�the�study�started.�
�Second�phase�This�phase�started�immediately�after�ionic�concentration�in�the�outflowing�water�was�constant.� � �A�5�cm�shearing�was�made�along� the�sliding�surface.�This�was�done�after�the�inflow�was�stopped�temporarily�to�avoid�disruption�in�the� saturated� soil� of� sliding� surface.� During� shearing� in�the� sliding� surface� of� the� model� enough� weight� was�placed�on�the�upper�surface�to�prevent�separation�of�the�upper�plate�from�the�soil�and�uncontrolled�disturbance�of�soil.� Afterwards,� the� water� was� turned� on� again� and�sampling�of�water�from�the�toe�of�the�sliding�surface�was�continued.� In� this� phase,� all� lab� analyses� and� sampling�procedures� were� similar� to� the� first� phase.� Water�sampling� continued� till� the� concentrations� of� the� ions�under� consideration� remained� constant.� A� total� of� 27�samples�of�1000ml�were�taken�during�355�hours. �Results�from�the�model�tests �The total time for the first phase was 637 hours and, for the second phase, 355 hr, thus, the total time spent for both phases was 992 hr. A complete chemical analysis was carried out to determine the concentration of cations and anions as well as the EC and pH of the inflowing water (Table 2). The amounts of chemical elements in the inflow water were subtracted from the corresponding values in the outflowing water, since they were considered as external elements added to the system. Thus, the changes in ionic concentrations of the outflowing water showed the net changes resulting from the passing of water through the soil profile. It is noteworthy that in all laboratory measurements, the procedures and conditions were kept the same.
Soil�Strength�Parameter�(Saturated)�
K�cm/sec
�PL % � LL % � � d�
g/cm3
Soil�Class���
Deg.�C�
Kg/cm2�16� 0.8� 3.8�X10�7� 16.69 59.2� 1.70� CH
46

Proceedings�of�the�IPL�Symposium,�UNESCO,�Paris,�2012
A. Changes in Na+ concentration
B. Changes in K+ concentration
C. Changes in Ca++ concentration
D. Changes in Mg++ concentration
Fig. 3 Diagrams of changes in cations of the water flowing out at the foot of the slope in the first phase (till constant concentration) and after the soil cut.
Results of changes in the cation and anion concentration of the outflow water in the two phases of the study are shown in the diagrams of Figs.3-6. The first cation studied was the monovalent sodium cation (Na+) of which the results are shown in Fig. 3-A. Generally, this cation is more abundant in soils of Iran compared to other cations (IAPE, 2004). In the beginning of the first phase of the study, Na+ concentration was measured at 7.15 meq/lit, while the Na+ concentration in the inflow water was 2.28 meq/lit (Table 2). Subtracting the latter value from the former gives the total sodium cation leached from the soil body as 4.87 meq/lit, which is the result of water passing through the soil pores of the sliding surface in the model. With continued drainage in some 490 hours, the change in concentration of sodium cation was almost negligible and, after 637 hours, reached a relatively constant value of 1.75 meq/lit. In the second phase, when a shearing of about 5% of the slope
length was made in the sliding surface, the concentration of Na+ showed a clear increase to 3.2 meq/lit in 20 hours after displacement, which reflected the excellent sensitivity of this cation to displacement in this soil.
Table 2. Chemical properties of the water used in the study.
Forty hours after the Na+ concentration was fixed at a maximum level, it started to decline and, in 85 hours, it reached 1.74 meq/lit, which was close to the value before the soil was sheared. Afterwards, it remained almost constant till the end of the test (992 hour). The second monovalent cation investigated was K+, whose results are shown in Fig. 3-B. In spite of its relatively lower concentration in soils of Iran, K+ showed a behavior similar to Na+. In the beginning of the test, K+ concentration was 0.26 meq/lit. Thus, considering potassium concentration of 0.05 meq/lit in the inflow water (Table 2), the increase in K+ due to the dissolution of this cation from the surrounding soil was 0.21 meq/lit. The K+ concentration in the first phase of the study reduced to 0.14 meq/lit after 566 hours and remained at this level till the soil was sheared (637 hr). After the second phase and the displacement of the sliding surface, the concentration of this ion in the outflow water at the toe of the sliding surface showed a relatively significant increase i.e. 118 hours after the soil was sheared, the concentration reached 0.26 meq/lit. With continued leaching of this ion till 147 hours after sliding, its concentration declined to approximately 0.13 meq/lit and remained close to this level till the end of the test (992 hr).
The next cation investigated was the divalent ion of calcium (Ca++) and the results are shown in Fig 3-C. In the soils of Iran that are mostly calcareous, this ion is most prevalent. As shown in Fig 3-C, the concentration of this ion in the beginning of the first phase reached 31.2 meq/lit. Subtracting from this value the concentration of Ca++ in the inflowing water, which was 4.2 meq/lit (Table 2), its concentration in the outflow water due to the dissolution of this cation from the surrounding soil was calculated at 27 meq/lit. In spite of the high concentration of this ion in the beginning of the test, it showed high sensitivity to leaching and, in a time period of 320 hours, it decreased to 4.1 meq/lit and remained at that level till the end of the first phase (637 hr). The interesting behavior shown by this cation after the second phase and displacement of the sliding surface was that, in spite of calcium ion high concentration and quick leaching in the first phase, it did not display appreciable sensitivity and detectable changes in its concentration in the second phase. The other divalent cation studied was magnesium (Mg++), the results of which are depicted in Fig. 3-D. The concentration of this cation in the outflowing water at the toe of the slope was 8.0 meq/lit. Subtracting from this value the concentration of Mg++ in the inflowing water, which was 0.5 meq/lit (Table 2), the increase in its concentration in the outflow water due to the dissolution of this cation from the surrounding soil was calculated at 7.5 meq/lit. With continued leaching of this ion till 520 hours after sliding, its concentration declined to approximately 0.8 meq/lit and remained close to this level till
Ec ms/cm
pH HCO3-
meq/litCl-
meq/litSO4--
meq/litCa++
meq/litMg++
meq/litNa+
meq/litK+
meq/lit
0.61 8.03 1.7 4 1.33 4.2 0.5 2.28 0.05
47

Zieaoddin�Shoaei,�Iman�Kermani�–�A�New�Approach�to�the�Landslide�Early�Warning�Using���
the end of the first phase (637 hr). In the second phase, when a shearing was made in the sliding surface, this cation showed a reasonable sensitivity to the displacement and its concentration increased from 0.8 to 2.75 meq/lit in 20 hours after displacement. With continuation of water seepage and outflow and 207 hours after the start of the second phase, Mg++ concentration decreased again and was almost fixed at the original level of 0.8 meq/lit.
A. Changes in Cl- concentration
B. Changes in SO4—concentration
C. Changes in HCO3- concentration
Fig. 4 Diagrams of changes in anions of the water flowing out at the foot of the slope in the first phase (till constant concentration) and after the shearing at sliding surface.
The first monovalent anion studied in this model was chlorine (Cl-), of which the results are shown in Fig 4-A. The concentration of this anion in the outflow water at the foot of the slope was 11 meq/lit. Considering Cl- concentration in the inflowing water, which was 4 meq/lit, the increase in its concentration in the outflow water due to dissolution from the soil of the sliding surface was 7.01 meq/lit. With further leaching, the concentration of this anion decreased relatively quickly and, after 205 hours, was fixed at 4.1 meq/lit and did not show detectable change to the end of the first phase (637 hr). As depicted in Fig 4-A, there was no appreciable change in the concentration of this anion after the displacement of the sliding surface. Indeed, the observed gradual, but insignificant, rise in the concentration was slight and reflected the insensitivity of this ion to displacement.
The second anion investigated was divalent SO4--, which behaved similar to calcium and chlorine ions (Fig. 4-B). In the beginning of the test, its concentration was 31.36 meq/lit, which, after subtraction of its concentration of 1.33 meq/lit in the inflow water, showed that some 30.03 meq/lit had been drained from the bulk soil of the sliding surface. This anion showed a relatively high susceptibility to leaching in the first phase, but, in about 200 hours, its concentration decreased to 1.6 meq/lit and was fixed at this level. As Fig 4-B shows, in spite of SO4-- high sensitivity to leaching, it did not show appreciable sensitivity to the displacement in the second phase and there is no significant change in its concentration in the outflow water after shearing took place i.e. the concentration remained at the level fixed in the first phase. The third anion studied was monovalent bicarbonate (HCO3-), the results of which are shown in Fig 4-C. The concentration of this anion in the outflow water in the beginning of the test reached a level of 4.3 meq/lit, which, after subtraction of its concentration of 1.7 meq/lit in the inflow water, showed that some 2.6 meq/lit had been drained from the bulk soil of the sliding surface. This concentration decreased at a slight rate and was almost fixed at 2.2 meq/lit. In the second phase and 140 hrs after the shearing, the concentration in the outflowing water reached 2.80 meq/lit. With continued leaching after the shearing, the concentration decreased, it was 1.8 meq/lit and remained almost fixed at this level. Throughout the study, two important factors, namely, EC and pH, which are generally affected by the total ions and dissolved salts, were studied. The results obtained for these factors are depicted in Fig 5 and 6. As shown in these figures, in the beginning of the tests, due to a relatively high dissolution potential as a result of presence of free ions in the original soil, the EC of the outflow water was 2800 μs/cm (Fig 5). However, during the first phase of the study, this value quickly decreased to 700 μs/cm, which was almost the same as that of the inflow water. Upon displacement in the second phase, no appreciable changes were observed for EC; in other words, EC did not show detectable sensitivity to displacement. In the case of pH, the pattern of change was sporadic (Fig. 6), scattered and irregular in both phases of the study. The changes of pH followed a zigzag pattern due to rapid variations and did not show an acceptable stable value, although the general trend of pH values were descending in the first phase and ascending in the second phase (after soil cut).
Discussion�and�conclusion��Considering�the�burgeoning�population�in�recent�decades,�residential� and� economical� zones� are� expanding� toward�higher�and�more�elevated�lands�that�are�more�susceptible�to� landslide.� Therefore,� monitoring� of� slopes� and� the�factors� affecting� their� stability� is� very� important� and�necessary.� The� main� objective� of� such� monitoring� is�prediction�of�the�time�of�rapid�and�main�failure�in�order�to�save�people’s�life,�since,�in�the�process�of�risk�reduction�and�management,� the� time� span� between� early�warning�and�the� time�of� the�main�sliding�event�has�a�key�role� in�the�success�of�the�program.�In�some�landslide�events,�use�of� ordinary� devices� and� instruments� for� monitoring�movements�and�predicting� the� time�of� sliding�event�has�
48

Proceedings�of�the�IPL�Symposium,�UNESCO,�Paris,�2012
not� been� quite� successful� due� to� the� undetectable�movements�of�the�sliding�surface.�Notably,�the�fact�is�that�in�most�such�events,�prior�to�the�main�failure�occurrence,�some�slight�movements� take�place�at� the� sliding� surface�which� are� not� picked� up� and� revealed� by� most� of� the�monitoring�instruments.�Therefore,�in�the�present�study,�the� possibility� of� monitoring� changes� in� the� ion�concentration� of� the� outflow� water� as� a� result� of� those�movements,� and� using� those� changes� as� early� warning�signs�of�the�sliding�event,�has�been�investigated.
Fig 5 Changes in EC of water flowing out of the model
Fig 6 Changes in pH of water flowing out of the model
The� present� research� was� based� on� the� aforementioned�hypothesis.�The�results�of�the�study�showed�that�some�of�the� ions� in� the�water� flowing�out�at� the� toe�of� the�slope�(including�cations�and�anions�in�the�soils�through�which�the�outflow�water�has�passed)�can�act�as�good�indicators�for�this�purpose.�As�stated�in�the�discussion�of�the�results,�the� ions� sensitive� to� slight� movement� of� the� sliding�surface� could� be� different� depending� on� soil� properties;�therefore,�to�identify�the�ions�sensitive�to�sliding�event,�it�is�necessary�to�carry�out�several�studies�with�soils�having�different�properties.�In�our�case,�use�of�the�model�for�the��selected�soil�sample�showed�that,�among�the�ions�studied�i.e.� Na+,� K+,� Ca� ++,� Mg++,� Cl�,� SO4��,� and� HCO3�,� ions� of�sodium�(Na+),�potassium�(K+),�magnesium�(Mg++)�and,�to�some� degree,� bicarbonate� (HCO3�)� have� acceptable�relative� sensitivity� to� the� occurrence� of� landslide� in� the�tested� soil.� In� contrast,� ions� of� calcium,� chlorine,� and�sulfate� do� not� have� adequate� sensitivity� to� be� used� as�early� warning� sign� in� slight�movements� of� a� potentially�unstable�slope.�Generally,� in� selecting� an� ion� to� be� used� in�monitoring�programs� for� early� warnings,� the� most� important�characteristics� include� the� increase� in� concentration�
upon� soil� displacement,� the� time� taken� to� reach�equilibrium,� the� maximum� concentration� after�displacement,� and� the� time� taken� to� return� to�equilibrium.�In�the�present�research,�the�index�RI,�which�is� the� ratio�of� concentration� in� the�outflow�water�at� the�toe�of�the�slope�before�the�soil�shearing�to�that�after�the�shearing� was� introduced� as� a� suitable� parameter� for�monitoring� and� early�warning� in� slope� areas� susceptible�to� sliding.�Fig�7�shows� this� index� for� the� ions�studied� in�the� present� study.� It� is� expected� that,� under� normal�conditions,� RI� will� be� equal� or� greater� than� unity.� The�closer�is�this�ratio�to�unity;�the�less�is�the�sensitivity�of�the�ion� to� soil�displacement.� In� this� research,� the�maximum�RI� belonged� to� magnesium,� followed� by,� respectively,�potassium�and�sodium�cations.�The�RI� index�of� calcium,�sulfate,�and�chlorine�was�close�to�unity�that�reflects�their�insensitivity�to�the�shearing�in�the�sliding�surface.�Among�the� anions� studied,� bicarbonate’s� RI� was� greater� than�unity� and� could� be� selected� as� a� cation� sensitive� to�displacement.���
��Fig 7 Graph of RI index for ions studied in the model. �Since� Ec� (electrical� conductivity)� of� water� is� directly�affected�by�the�concentration�of�dissolved�ions,�although�EC�increased�after�the�shearing�was�made,�but�its�rate�was�not� appreciably� high.� Therefore,� changes� in� EC� cannot�reflect� changes� in� the� activities� of� the� sliding� surface.�Although�the�general�trend�of�pH�values�were�descending�in� the� first� phase� and� ascending� in� the� second� phase�(after�soil�cut),�but�the�changes�were�gradual�with�much�ups�and�downs.�This�shows�the�susceptibility�of�pH�to�the�effects�of�many�factors,�therefore,�it�cannot�be�considered�a� reliable� indicator� for� detection� of� the� activities� of� the�sliding�surface.��The�summary�of�the�results�of�this�study�are�as�follows:�1. The� change� in� the� concentration� of� some� cations�and� anions� in� the� water� flowing� out� of� the� sliding�surface�after�each�activity�can�easily�be�proved.�
2. Considering�the�limited�sensitivity�of�the�monitoring�instruments�and�the�relatively�long�time�span�between�the� slight� activities� of� the� sliding� surface� and� the�appearance�of�observable�signs�on�the�ground�surface,�the� changes� in� concentration� of� ions� can� be� used� as�
49

Zieaoddin�Shoaei,�Iman�Kermani�–�A�New�Approach�to�the�Landslide�Early�Warning�Using���
effective�early�signs�of�the�activity�of�a�sliding�event�to�control�and�reduce�the�risks.�
3. Changes� in� the� ions� concentration� is�dependent�on�the� soil� properties� and� clay� types�present� in� the� soil.�Therefore,� it� is� necessary� to� run� the� model� test� for�each� region� to� identify� the� ions� and� factors� sensitive�to�soil�movements�in�that�area.�
4. Generally� speaking,� the� most� important�characteristics�to�be�considered�in�selecting�an�ion�for�monitoring�programs� and�early�warnings� include� the�increase�in�concentration�upon�soil�displacement,�the�time� taken� to� reach� equilibrium,� the� maximum�concentration�after�displacement,�and�the�time�taken�to� return� to� equilibrium.� In� the� present� study,� RI,�which� is� the� ratio� of� concentration� in� the� outflow�water�at�the�toe�of�the�slope�before�the�soil�sharing�to�that� after� the� shearing,� was� introduced� as� a� suitable�parameter� for�monitoring�and�early�warning� in� slope�areas�susceptible�to�sliding�
�Acknowledgments�
The�authors extend�their�gratitude�to�the�management�of�the� Soil� Conservation� and� Watershed� Management�Research� College� for� their� financial� support� and�provision� of� the� facilities� for� conducting� this� research.�Also,� thanks� are� due� to� Mr� R.� Khalili,� Mr� Mohammad�Ahrar,�Mr�Mohammad�Dadgar,�technicians�and�technical�staff� of� the� Modeling� Department,� who� greatly� helped�with�the�construction�of�the�model�and�conducting�of�the�tests.�
�References��
Chatwin� SC,� Howes� DE,� Schwab� JW,� Swanston� DN,� (1994)� A�Guide� for� Management� of� Landslide� Prone� Terrain� in� the�Pacific�Northwest�Ministry�of��Forests,�Victoria,�B.C.,�N0.�18,�Second Edition.��
Leroueil� S,�Vaughan�PR,� (1990)�Congruent�and�General�Effects�of� Structure� of� Natural� Soils� and� Weak� Rocks.�Geotechnique,�40:�467�488.�
Mollard� JD,� Hughes� GT,� (1973)� Earth�flows� in� the� Grondines�and� Trois� Rivières� areas,� Québec.� � Discussion,� Canadian�Geotechnical�Journal,�10:�324�328.�
Moon�VG,�(1993)�Microstructure�Control�on�the�Geomechanical�Behavior�of�Ignimbrite.�Engineering�Geology,�36:�19�31. �
Sakai� H,� (2001)� Observation� of� Ground� Displacement� in�Landslide�by�Monitoring�Groundwater�Composition.�QR�of�RTRI,�Vol.�42,�No.3,�pp�161�167��
Sakai� H,� (2009)� Prediction� of� Landslide� a� Few� Months� in�Advance� of� its� Occurrence� with� Chemical� Sensors� for�Groundwater� Composition� Observation.� Proc.� of� the� IS�Kyoto,� Prediction� and� Simulation� Methods� for� Geohazard�Mitigation,� Oka,� Murakami,� and� Kimoto(ed.),� Taylor� and�Francis�Group,�London,�603p.�
�
Shoaei� Z,� Imamjomeh� SR,� Shariat� Jafari� M.,� Jalali� N,�Ghayoumian�J,�(1996)�Analysis�of�Landslide�Movement�and�a�Suggestion� on� the� Most� Economical� Methods� of� Their�Control.� Proceeding� of� Fourth� Conference� on� Engineering�Geology�and�the�Environment.�Tarbiat�Modarres�University.�Tehran.pp�1202�1218.�(in�Persian).�
Shoaei�Z,�Imamjomeh�SR,�(2002)�Application�of�GIS�in�Mapping�Landslide� Behavior� for� Analysis� of� Mechanism� and� Early�Warning.� Proceeding� of� Third� Conference� on� Engineering�Geology� and� the� Environment.� Hamedan,� p� 32�41.� (in�Persian).�
Shoaei Z, Karamsoltani K, (2011) Application of Monitoring Data for the Prediction of the Time to Failure and Risk Management. Second World Landslide Forum, 3-7 October, Rome, pp. 262
Shoaei� Z,� Shariat� Jafari� M,� Ghayoumian� J,� (2001)� Continuous�Site�Monitoring�to�Predict�the�Time�of�Rapid�Failure�in�High�Risk�Reactivated�Landslide",� IAEG�Congress,�30� Jul.��2�Aug.�2001,�Yekaterinburg,�pp102�109�
Soderblum� R,� (1974)� A� New� Approach� to� the� Classification� of�Quick�Clays.�Proceedings�of�the�Royal�Swedish�Geotechnical�Institute,�4:�1�17.�
Yan�T,�(1994)�Hydrological�and�Engineering�and�Environmental�Protection.�Press�of�China,�University�of�Geosciences.��
Zung�AB,�Sorenson�CJ,�Winthers�E,� (2008)�Landslide�Soils�and�Geomorphology� in� Bridger�Teton� National� Forest�Northwest"�Phys�Geography�30(6):�501–5�
�
�
50

��
�������Proceedings�of�the�IPL�Symposium,�UNESCO,�Paris,�2012�
�
Increasing� awareness:� the� role� of� non�structural� measures� in�landslides�disaster�reduction�
Irasema�Alcántara�Ayala(1),�Matilde�Cruz�Jerónimo(2)�1)� Universidad� Nacional� Autónoma� de�México� (UNAM),� Instituto� de� Geografía,�Mexico� City,� Ciudad� Universitaria,� D.F.,�04510,�Coyoacán,�+5255�5622�43�35�2)�Universidad�Nacional� Autónoma�de�México� (UNAM),� Posgrado� en�Geografía,�Mexico� City,� Ciudad�Universitaria,� D.F.,�04510,�Coyoacán,�+5255�5622�43�35�
�
Abstract� The� impact� of� disasters� world�wide� has� been�unexpectedly� high� during� the� last� decade� in� both�developing� and� developed� countries.� Consequently,� one�of� the� main� aspects� visualized� by� the� United� Nations�International� Strategy� for� Disaster� Reduction� (UNISDR)�to� build� up� resilient� societies� is� devoted� to� increasing�public� awareness.� Under� such� framework,� activities�associated� to� promote� a� culture� of� disaster� prevention�require� dissemination� of� information� to� the� exposed�communities.� In�Mexico,� landslide�disasters� triggered�by�precipitation� have� caused� numerous� human� losses� and�major� economic� impact� in� recent� years.� However,�landslide�investigations�have�been�neither�stimulated�nor�extended� as� needed.� In� a� mountainous� terrain,� such� as�the�Mexican� territory,� addressing� this� issue� from�a� pure�scientific� or� engineering� perspective� is� rather� difficult.�Taking� into�account� these�circumstances,�non�structural�measures�need�to�be�valued�and�used�as�a�real,�quick�and�cheap� opportunity� to� reduce� vulnerability� in� terms� of�increasing�people’s�knowledge�and�awareness.��Therefore,�a� webpage� –in� Spanish�� was� created� in� order� to� gather�basic� information�on� line� to� be� shared� through� internet�with�people� living�on� landslide�risk�areas.� In�addition�to�the� general� hazard� aspects,� a� data� base� format�was� also�introduced�to�facilitate�the�use�of�both�general�public�and�people�with�some�technical�knowledge,�to�report�existing�mass�movements.� Besides� providing� easy� to� understand�landslide�information�to�the�communities,�the�webpage�is�aiming�at�contributing� to� the�development�of�a�national�landslide� inventory.� In� this� paper,� the� role� of� non�structural� measures� expressed� throughout� the�construction� of� a� webpage� and� a� landslide� database� for�the�Spanish�speaking�world�is�presented.����
�Keywords� landslides,� vulnerability,� non�structural�measures,�landslide�webpage,�Spanish.��Disasters�and�public�awareness�
The� impact� of� disasters� world�wide� has� been�unexpectedly� high� during� the� last� decade� in� both�developing� and� developed� countries.� Catastrophic�consequences� derived� from� events� such� as� the� 2004�Indian�Ocean� tsunami� and� the� 2011�Tohoku� earthquake,�
have�produced�skyrocketing�tolls�producing�concern�and�calling� the� attention� and� efforts� of� the� international�community.��Therefore,�the�United�Nations�International�Strategy�for�Disaster�Reduction�(UNISDR)�has�envisaged�a�strategy�comprising�four�major�objectives:�1)�Increasing�public�awareness;�2)�Obtaining�commitment�from�public�authorities;� 3)� Stimulating� interdisciplinary� and� inter�sectoral� partnership� and� expanding� risk� reduction�networking� at� all� levels;� and� 4)� Improving� further� the�scientific� knowledge� of� the� causes� of� disasters� and� the�effects� of� natural� hazards� and� related� technological� and�environmental�disasters�on�society.�Within�the�particular�rationale� of� public� awareness,� public� information,�education� and� training� are� considered� the� most�significant�issues�to�be�addressed.��Structural�vs.�Non�Structural�measures�According� to� the� UNISDR� (2009),� any� physical�construction� to� decrease� or� prevent� likely� impacts� of�hazards,�or�application�of�engineering�techniques�to�carry�out� hazard�resistance� and� resilience� in� structures� or�systems� can� be� considered� as� a� structural� measure.�Contrastingly,� non�structural� measures� are� those� which�do� not� involve� physical� construction� but� are� based� on�knowledge,� practice� or� agreement� to� reduce� risks� and�impacts,�especially�by�means�of�policies�and�laws,�public�awareness�raising,�training�and�education.�
�
�Figure�1�Structural�Landslide�measures�in�the�locality�of�Necaxa,�Puebla.�
51

I.�Alcántara�Ayala,�M.�Cruz�Jerónimo�–�Increasing�awareness:�the�role�of�non�structural�measures…�
Structural�measures�are�specific�actions�that�aim�at�understanding� the� hazards,� in� this� case� landslides,� in�addition� to� reducing� their� physical� impact� by�means� of�identifying� landslide� mechanisms� and� thresholds;�undertaking� remedial� works� (diversions,� terraces,� water�disposal� systems,� drainage,� sediment� controls,� land�levelling,�biotechnical�protections,�etc.),� instrumentation�and�monitoring;� and�modelling�and� the� implementation�of�sophisticated�hazard�warning�systems�(Fig.� 1).�On�the�other�hand,�and�as�complement,�non�structural�measures�include� complex� social� processes� that� need� to� consider�the� resilience� or� vulnerability� conditions� of� societies.�Those� processes� are� strongly� linked� to� disaster� risk�reduction� management� necessities� including� land� use�planning,� community� based� early� warning� systems,�knowledge� transfer,� education,� preparedness,�participatory� mapping,� risk� perception� understanding,�environmental�consciousness,�and�disaster�prevention�co�responsibility.�
Reliability� of� slope� structural� measures� against�landsliding� is� based� on� variability� of� controlling� factors,�climatic� scenarios,� financial� capability� and� engineering�skills� and� commitment.� Quite� commonly,� the� time�requirement� for� implementation� is� not� that� long� in�comparison� with� non�structural� measures.� Nonetheless,�the� life� expectancy� of� such� structural� measures� is�assumed� with� uncertainties� associated� to� hazard�recurrence� periods,�magnitude� and� frequency� of� events,�and� the� need� of� protecting� its� integrity,� correcting�damages,� correcting� the� deterioration� of� structural�components�and�upgrading�of�the�structures�to�meet�the�dynamic�conditions�of� the�environmental� context�where�they�have�been�put�into�operation�(Fig.�2).�
�
�Figure� 2� Effectiveness� of� Structural� and� Non�Structural�Landslide�measures�in�terms�of�financial�cost�and�time.���Public�understanding�of�science�
�Science� dissemination� refers� to� the� transmission� of�information� in� only� one� direction;� from� somebody� who�knows� something� to� someone�who� is� not� acquainted� in�the� subject.� However,� in� a� wider� spectrum,� science�
communication� involves� a� dialogue� among� actors,�including� an� exchange� of� knowledge� and� experiences.�According� to� Lewenstein� (2003),� there� are� four� main�models� for� science�communication:� 1)� the�deficit�model;�2)� the�contextual�model;�3)� the� lay�expertise�model;�and�4)�the�public�participation�model.��
The�deficit�model�describes�a�shortfall�of�knowledge�that�must�be�fulfilled,�assuming�that�after�correcting�the�shortage,�the�situation�will�be�improved.�This�model�has�proven�to�be�far�from�reality.�Consequently,�attention�has�been� paid� to� new� science� communication� models.� The�contextual�model�is�based�on�the�fact�that�individuals�do�not�merely�react�as�empty�recipients�to� information,�but�process�information�according�to�social�and�psychological�backgrounds� resulted� from� their� previous� experiences,�cultural� context,� and�personal� circumstances.�Despite�of�recognizing� the� presence� of� social� drivers,� this�model� is�still�focused�on�the�response�of�individuals�to�information.�Local� knowledge� is� the� main� component� of� the� lay�expertise�model.�It�is�centered�in�the�lives�and�histories�of�real�communities,�at� local� level.�Therefore,� it� is�assumed�that� local� knowledge� may� be� as� relevant� to� solving� a�problem�as�technical�knowledge.�The�public�participatory�model�also�known�as�dialogue�model�aims�at�stressing�the�significance� of� seeking� public� input� into� science� issues�(Lewenstein,�2003).�
Not� only� science� but� also� risk� communication�requires� using� a� combination� of� elements� derived� from�the�different�models.�First�of�all,� it�has�to�be�agreed�that�risk�communication�is�a�multidisciplinary�task�aiming�to�communicate�knowledge�by�different�means�to�the�public�taking� into� account� besides� the� knowledge� per� se,� the�context� of� the� communities’� livelihoods� and� their�environment.� Second� and� equally� important,� risk�communication�must�be�pieced�together�on�a�horizontal�approach,� on� which� integrated� understanding� and�management�of�hazards�and�vulnerability�turn�out�to�be�the� essential� sound� practice� needed� to� reduce� disaster�risk.� Therefore,� under� such� scheme,� it� is� clear� that� it� is�communication� of� science� and� not� only� dissemination,�what� is� needed� as� a� key� instrument� to� contributing� to�disaster�risk�reduction.��
Notwithstanding�the�very�recent�interest�associated�to�the�disasters�occurring�in�the�last�decades�in�the�globe,�risk� communication� is� one� of� the� oldest� manners� to�communicate� risk.� In� ancient� Babylonia,� dating� back�circa� to� the� third�millennium�BC,� different�mechanisms�to� anticipate,� respond� and� communicate� food� shortage�and� other� natural� hazards� were� utilized� (Krimsky� and�Plough,� 1988;� Kasperson� and� Stallen,� 1991).� Considering�technological� and� scientific� advances� and� progress,� risk�communication� clearly� ought� to� provide� all� possible�alternatives�to�enhance�risk�disaster�reduction.�
A� risk� communication� programme� points� towards�achieving� several� missions,� including� enlightenment,�right�to�know,�attitude�modification,�legitimate�function,�risk�reduction,�behavioural�change,�emergency�readiness,�and�public�enrolment�and�participation�(Renn�and�Levine�
52

Proceedings�of�the�IPL�Symposium,�UNESCO,�Paris,�2012
1991).�Risk�communication�can�be�on�the�whole�viewed�as�a�cyclic�process�on�which�feedback�plays�a�very�significant�role.� As� information� is� attractively� transmitted� to� the�public,� hazard� understanding� and� acceptance� can� be�achieved.�Environmental�consciousness�at� local,� regional�and�global�scale� then�turns� into�an�essential�component�of� this�dynamic�and�cyclic�process�and�risk�awareness� is�progressively�built�(Fig.�3).���
�Figure�3�The�cyclic�process�of�risk�communication.��
Channels�of�communication�It� is� important� to� bear� in� mind� that� communication�media� depends� on� the� public� target,� and� literacy� and�communication� skills� must� be� also� considered.� Posters,�brochure,� leaflets,� newspapers,� television,� radio,� songs,�radio�stories� and� novels� are� among� the� most� common.�Moreover,� messages� to� be� sent� across� willing� to� assist�disaster�prevention�and�risk�reduction,�must�generally�fall�in� the� dimensions� of� trust,� understanding,� credibility,�satisfaction,�cooperation�and�agreement,�but�particularly�during�a�crisis�period�(Marra,�1998).�
In� a� similar� fashion� than� public� relations,�communication� processes� need� to� rely� on� different�elements,� considering� aspects� including� credibility,�context,� content,� clarity,� continuity� and� consistency,�channels,�and�capability�of�audience�(Cutlip�et�al.,�1985).��
Ensuring� relevance� and� effectiveness� is� a� major�challenge�of�risk�communication�and�awareness.�Internet�can�be�regarded�as�a�valuable�way�to�reach�a�large�young�sector�of�the�population�of�mountainous�areas�who�have�computer�and�internet�access�in�their�homes,�towns�and�schools� given� that� direct� engagement� with� remote�centres� of� population� is� in� that� case� very� difficult.�Creating� and� putting� on� line� a� landslide� webpage� in�Spanish�targets�at�guarantying�an�accessible�source�with�a�clear,� understandable�message� that� can�help� to� improve�people� knowledge� and� awareness� on� landslides� and�disasters�risk�reduction.�
The�globalization�of�risk�messaging�has�taken�place�so�rapidly�that�mass�media�such�as�TV,�the�medium�that�brought� risk�messages� to� the� largest�possible� audiences,�has� been� overwhelmed� by� the� use� of� internet.� As� the�Internet� expanded,� access� to� information�by�population,�public� interest� groups� and� individuals� has� been�unparalleled�in�human�history�up�to�now�(Krimsky,�2007).�
According� to� the� Internet� World� Statistics,� there�were� 2,279,709,629� internet� users�worldwide� in� the� first�quarter�of�2012,� the�equivalent� to�about�one�third�of� the�total� world� population.� Asia� is� by� far� the� region� with�more� internet� users� in� the� globe� (45%),� followed� by�Europe�(22%),�America�(12%)�and�Latin�America�and�the�Caribbean� (10%)� respectively.� � In� the� international�internet�users�ranking,�Mexico�is�placed�in�the�top�20,�as�number�twelve,�after�countries�such�as�China,�USA,�India,�Japan,� Brazil,� Germany,� Russia,� Indonesia,� UK,� France�and�Nigeria.�In�2012,�42,000,000�people�were�declared�as�internet�users,�meaning�that�37%�of�the�total�population�was� connected� through� the� cyberspace.� The� largest�percentage�of�users�was�under�35�years�of�age;�17.7%�were�studying� basic� education,� 24%� secondary� school,� 29.2%�high� school,� 25.5%�university� level� and�2%�postgraduate�studies.� Accordingly,� youngsters� and� children� are� the�main� cyber�users� and� hence� the� group� that� can� be�targeted� in� terms� of� using� internet� as� an� alternative� to�enhance�risk�knowledge�and�raising�awareness�in�order�to�reduce�vulnerability�and�increase�resilience.���Aiming�at�landslides�risk�disaster�reduction�
Landslides�in�Mexico�The� significance� impact� of� landslide�disasters� in�Mexico�has� been� recently� pointed� out� in� terms� of� historical�accounts� (Alcántara�Ayala,� 2008)� and� also� derived� from�specific� cases.� According� to� information� collected� from�the� data� bases� EM�DAT� and�Desinventar� in� addition� to�historical� archives,� during� the� period� 1920�2010,� 1080�disasters�took�place�nationwide.�
A� total� death� toll� of� 6133� victims� and�719�wounded�people� resulted� from� those� disasters.� Not� surprisingly,�997� events,� in� other� words� 92%� of� the� total� number� of�disasters,� were� linked� to� hydrometeorological� events,�particularly� to� precipitation� derived� from� cyclones� and�hurricanes.� � The� other� episodes� were� associated� to�anthropic� activities� (16),� seismicity� (10),� faulting� (7),�volcanic�activity�(2)�and�others�not�specified.�
The� largest� number� of� events� took� place� in� the�province�of�Chiapas;� 170�disasters,� the�equivalent� to� 16%�of� the�total�caused�considerable�damage�and�232�human�losses.� In� Veracruz,� Guerrero� and� Mexico� City,� 129,� 122�and�120�events�were�respectively�registered,�they�account�individually� for� 11�12%�of� total�events.�Estado�de�Mexico,�Puebla� and�Hidalgo� accounted� for� 94,� 88� and�84� events�(Fig.�4).��
��
53

I.�Alcántara�Ayala,�M.�Cruz�Jerónimo�–�Increasing�awareness:�the�role�of�non�structural�measures…�
�
��
Figure�4�Affected�provinces�of�Mexico�due�to�landslide�disasters�(number�of�events�registered�1920�2010).�
Considering� the� number� of� casualties,� the� worst�episode� took�place� in� Baja�California� Sur� province;� 1000�casualties�occurred� in�La�Paz�during�a�period�of� intense�precipitation�of�Hurricane�Liza�associated�to�flash�floods�and� mudflows� produced� by� the� collapse� of� a� dike� (see�Alcántara�Ayala,� 2008).� The� second� worst� disaster�occurred� in�Minatitlan,�Colima;�due� to� rainfall� triggered�landsliding�a�natural�dam�was� formed� in� the�area�of� the�Copales� and� Juanillos� hills,� where� soon� after,� a�catastrophic� overtopping� of� the� dam� caused� three�mudflows� that� swept� the� town� of� Minatitlan� (Padilla,�2006;� Alcántara�Ayala,� 2008).� The� third� worst� episode�took�place�in�October�1999,�resulting�from�the�interaction�of� a� tropical� storm�and� a� cold� front� intense� rainfall�was�produced�in�the�Sierra�Norte�de�Puebla�region;�hundreds�of�landslides�occurred�and�247�people�died�(Bitrán,�2000;�Alcántara�Ayala,�2008).�
Among� landslide� disasters,� particular� attention�ought� to� be� paid� to� the� Grijalva� landslide� due� to� the�considerable� mass� extent� involved.� After� an� intense�period� of� precipitation,� on� November� 4th,� 2007,� a�catastrophic�landslide�took�place�in�San�Juan�de�Grijalva,�Chiapas� (Fig.� 5).� � It� involved� a� volume�of� circa� 50�Mm3,�blocking�the�Grijalva�river�with�a�run�out�distance�of�800�m.� The� initial�movement�was� followed� by� a� 50�m�wave�that� damaged� several� houses� and� a� church;� the� official�death� toll� included� 19� casualties� and� 6� people� missing.�
More�than�3500�were�evacuated�as�a�substantial�quantity�of� hillslopes� was� evaluated� as� unstable� and� rainfall�persisted� within� the� region� causing� major� floods� and�numerous� smaller� landslides� (Alcántara�Ayala� and�Domínguez�Morales,�2008).�
�
�Figure�5�The�Grijalva�landslide,�Chiapas,�November�4,�2007.��Increasing�awareness:�creating�a�landslide�webpage�Public�awareness�is�understood�as�“the�extent�of�common�knowledge� about� disaster� risks,� the� factors� that� lead� to�disasters� and� the� actions� that� can� be� taken� individually�
54

Proceedings�of�the�IPL�Symposium,�UNESCO,�Paris,�2012
and� collectively� to� reduce� exposure� and� vulnerability� to�hazards”�(UNISDR,�2009).��
One�of� the� simplest� and� cheapest�means� to�promote�and�enhance�disaster� risk� reduction� is�nowadays�offered�by� internet.� Websites� allow� sharing� resources,� and�updates� can� be� easily� carried� out� and� followed� by� end�users.��
�Table� 1� Advantages� and� disadvantages� of�web� activities� (IFRC,�2011).�
Advantages� Disadvantages�Can� be� comprehensive� of�resources�
Requires� professional� user�friendly�design�
Can�enhance�accountability�and�transparency�
Requires� good� search� and�browse�design�and�tools�
Can� accommodate� many�versions�for�different�target�audiences,�languages�and�preferences�
Requires� regular� addition� of�new�content�
Can� be� supported� with�visuals�
Can� be� difficult� to� access� with�low�bandwidth�
Can�describe�resources�and�invite�more�inquiry�
Can�be�difficult�or�expensive�to�access�
Can�be�tracked�by�users�for�new�content�
Must� be� designed� with� low�bandwidth�in�mind�
Can� become� a� trusted�source�of�information�
Must� be� designed� for� delivery�on�different�browsers�
Can� raise� profile� and�enhance�credibility�
Must� be� adapted� to� handheld�and� mobile� devices� as� well� as�computers�
�The�expectations�of� the�successful�use�of� internet� for�
risk� awareness� should�not�be� exceeded.�This�high�speed�growing� communication� tool� has� a� wide� variety� of�advantages�and�disadvantages�that�have�to�be�assumed�in�order� to� be� realistic� and� efficient� (Tab.� 1).� Nonetheless,�clearly� the� selection� of� creating� a� landslide� webpage� in�Spanish� sets� sights� on� enhancing� risk� knowledge� and�raising�awareness�as�a�non�structural�measure� to� reduce�vulnerability�and�increase�resilience.�
The�preliminary�version�of� the�webpage�presented� in�this� paper� comprises� five� major� sections:� disasters,�landslides,� prevention,� a� landslide� database,� and� other�information� and� links� (Figs.� 6� and� 7).� In� the� first� part,�answers� were� given� to� questions� including� “What� are�disasters�and�why�do�they�occur?”,�“What�is�the�impact�of�disasters�worldwide?”��
Landslide� classification,� causes,� controlling� factors�and� triggering� mechanisms� were� carefully� explained� in�the� second� section.� In� the� third� component,� hillslope�instability� symptoms,� and� specific� actions� to� be�undertaken� before,� during� and� after� a� landslide� were�integrated.�A�specific�area�in�the�webpage�was�destined�to�include� an� online� register� to� feed� a� national� landslide�database.� � Two� types� of� users� were� considered:� general�public�and�people�with�technical�expertise�or�knowledge�capable�of� inputting�scientific� information.�Validation�of�all� entries� is� contemplated� to� be� carried� out� as�information� fields� requires� data� concerning� type� of�
movement,� material� involved,� triggering� mechanisms,�affected� area,� presence� of� vegetation,� slope,� slope�orientation,� affected� population,� casualties,� damages� in�housing,�infrastructure�and�crops,�among�others.��
�Figure� 6� General� view� of� the� created� landslide� webpage� (in�Spanish).��
The� last� section,�general� information�and�materials�were� incorporated� in� addition� to� listing� other� useful�internet� resources.� A� photo� gallery� associated� to� the�pictures�presented�at�the�Second�Landslide�World�Forum�was�set�up.�Popular�science�literature,�songs,�and�several�kind� of� national� and� international� links� were� also�integrated.�
After� finishing� the� first� complete� version� of� the�webpage,�an�evaluation�and�feedback�from�young�people�living� at� a� landslide� risk� area� was� sought� out.� The�assessment� took� place� in� the�municipality� of� Teziutlan,�Puebla,�near�an�area�devastated�by� landslides� in� 1999.�A�visit�to�the�Technological�Institute�of�Teziutlan�was�paid�with�the�intention�of�getting�different�points�of�view�from�the�local�population.�Fifty�people�participated�in�the�test.�The� later� was� divided� into� three� parts.� The� first� one�consisted�of�an�oral�appraisal�on�which� individuals�were�asked� if� they� considered� themselves� at� risk,� their�acquaintance� with� the� landslide� 1999� disaster� and� the�actions� to� be� undertaken� in� case� a� disaster� takes� place.�During� the� second� part,� 45� minutes� were� given� to� the�participants�to�use�the�landslide�webpage;�there�were�no�instructions� for� navigating.� Finally,� a� questionnaire� was�applied� to�get� feedback� from�the� layout�and�contents�of�the�website�(Cruz�Jerónimo,�2012).�
Design,�images�and�functioning�of�the�webpage�was�improved� thanks� to� the� performed� assessment.�Participants�were�between�17�and�50�years�old;�60%�were�at�university�level,�22%�postgraduate�studies�and�the�rest�did� not� specify� educational� level.� Interestingly� enough,�75%�percent�of�contestants�indicated�that�landslides�were�the� major� risk� in� their� community,� followed� by�delinquency�(13%)�and�floods�(12%).���
55

��
�������Proceedings�of�the�IPL�Symposium,�UNESCO,�Paris,�2012�
Moreover,� also� 75%� of� the� interviewed� people�mentioned� that� they�had� lived�a�disaster�event,�whereas�the�corresponding�25%�had�not�had�such�an�experience.�Out� of� the� total� people� involved� in� the� survey,� 94%�understood�what� landslides� are� and� the� reason� for� their�occurrence;�72%�of�them�explained�that�according�to�the�information�given�in�the�webpage�they�are�placed�at�risk,�while� the� corresponding� 28%� did� not� identify� such�condition.� Disappointingly,� only� 3%� of� the� participants�acknowledged� the� fact� that� human� activities� can�influence�landsliding.��
�Figure� 7� Some� of� the� elements� included� in� the� landslide�webpage.�
�All� respondents�affirm�that� they�would�recommend�
the� webpage� to� family� and� friends� to� broaden� the�transmission� of� information� on� landslide� risk� disaster�reduction�considering�that�there�is�lack�of�precise�disaster�knowledge� and� understanding� within� their� community�context.�Regarding�the�design,�structure�and�functioning�of�the�webpage,�66%�of�the�contestants�indicated�that�the�website� was� good� and� easy� to� understand,� 19%�considered� it� interesting� but� boring,� 6%� thought� it� was�interesting� and� fun,� other� 6%� judged� the� page� as�confusing� and� difficult� to� understand,� and� only� 3%�regarded�it�unexciting.��Concluding�remarks�Social� media� will� continue� to� expand� through� social�networks� (Facebook,� MySpace),� blogs,� mobile� text�messaging,� twitter,� video� sharing� (YouTube),� podcasts,�wikis,�image�sharing,�and�internet�forums,�among�others.�They� are� prevailing� and� influential� as� they� fulfil� the�human� necessity� of� innovation� and� connection.�Engagement� in� knowledge� cyber� dialogue,� encouraging�risk� awareness� and� communication,� and� enhancing�disaster� risk� reduction� within� a� computer�generated�framework� is�with�no�doubt�one�of� the�challenges� to�be�faced� by� the� scientific� community� and� the� society� as� a�whole.� Consequently,� promoting� and� implementing�landslide� sound� practices� in� disaster� risk� management,�engaging� local� communities� and� empowering� the� social�
order�will�play�a�significant�role�in�both�the�national�and�international�agendas�in�the�forthcoming�years.���Acknowledgments�
We� acknowledge� the� Consejo� Nacional� de� Ciencia� y�Tecnología� (CONACyT)� for� the� granting� of� research�project� 156242�MISTLI,� which� aims� to� prevent� disasters�linked�to�unstable�slopes.�We�are�also�grateful�to�Ricardo�J.�Garnica�Peña�for�constant�help�in�field�work.��References�
Alcántara�Ayala� I� (2008)� On� the� historical� account� of� disastrous�landslides� in� Mexico:� the� challenge� of� risk� management� and�disaster� prevention,� Advances� in� Geociences�ADGEO,� 14,� 159�164.�
Alcántara�Ayala� I,� Domínguez�Morales� L� (2008)� The� San� Juan� de�Grijalva� catastrophic� landslide,�Chiapas,�Mexico:� lessons� learnt,�In:� Proceedings� of� The� First� Landslide� World� Forum,� United�Nations�University,� International�Programme�on�Landslides,�18�21�November,�Tokyo,�Japan,�pp.�53�60�
Bitrán� D� (2000)� Características� e� impacto� socioeconómico� de� los�principales�desastres�ocurridos�en�México�en�el� período�1980–1999,�publicación�de� la�Dirección�de� Investigaciones�del�Centro�Nacional�de�Prevención�de�Desastres� (CENAPRED)�de�México� y�de�la�CEPAL,�107�pp.�
Cruz�Jerónimo� M� (2012)� Estrategia� para� reducir� la� vulnerabilidad�ante� procesos� de� remoción� en�masa� con� base� en�el� diseño� de�una� página� web� (Strategy� for� landslide� vulnerability� reduction�based� on� the� design� of� a� webpage),� Facultad� de� Filosofía� y�Letras,�UNAM,�Mexico�City,�85�pp.�
Cutlip�S�M,�Center�A�H,�Broom�G�M�(1985)�Effective�Public�Relations,�Prentice�Hall,�Englewood�Cliffs,�New�Jersey.�
IFRC��(2011)�Public�awareness�and�public�education�for�disaster�risk�reduction:�a�guide,�Geneva,�75�pp.�
Kasperson� R� E,� Stallen� P� J� M� (1991)� Communicating� Risks� to� the�Public,�International�Perspectives,�Kluwer,�Dordrecht.�
Krimsky�S�(2007)�Risk�Communication� in�the�Internet�Age:�The�Rise�of�Disorganized�Skepticism,�Environmental�Hazards�7,�157�164.�
Krimsky�S,�Plough�A�L�(1988)�Environmental�hazards:�communicating�risks�as�a�social�process.��Dover,�Mass,�Auburn�House,�333�pp.�
Lewenstein�B� (2003)�Public�Understanding�of� Science,� In:�Methods�of�public�communication�of�science�and�technology,�Department�of� Communication� of� Science� and� Technology� Studies,� Cornell�University,�Ithaca,�USA.�
Marra� F� J� (1998)� The� importance� of� communication� in� excellent�crisis� management,� Australian� Journal� of� Emergency�Management�13(3),�7.�
Padilla� R� (2006)� El� huracán� del� 59,� historia� del� desastre� y�reconstrucción� de� Minatitlán,� Colima,� Colima,� Universidad� de�Colima.�
Renn�O,�Levine�D�(1991)�Credibility�and�trust�in�risk�communication.�In�Communicating�Risks�to�the�Public�(eds�R�E�Kasperson�and�P�J�M�Stallen)�pp.�175–214,�Kluwer,�Dordrecht.�
UNISDR�(2009)�Terminology�on�disaster�risk�reduction.�www.unisdr.org/eng/terminology/UNISDR�terminology�2009�eng.pdf.�
�
56

��
�������Proceedings�of�the�IPL�Symposium,�UNESCO,�Paris,�2012�
�
Post�failure�Mobility�and�the�Importance�of�Stress�Ratio�in�Strength�Evaluation�
Ogbonnaya�Igwe(1),�Hiroshi�Fukuoka(2)�1)�University�of�Nigeria,�Nsukka,�Department�of�Geology,�+234�70�6118�2286�2)�Kyoto�University,�Japan,�Centre�on�Landslides,�Disaster�Prevention�Research�Institute��
�
Abstract� The� undrained� post�failure� behaviour� of� three�soil� types� �� volcanic� soil,� pumice� and� silica� sand� �� was�assessed� in� a� ring� shear� apparatus� to� understand� the�factors� affecting� the� residual� strength� (and� hence� the�potential� travel� distance)� of� slope� materials.� The� stress�paths� of�medium� to�dense� soils�were�dilatant� in�nature.�The� soils� exhibited� a� typical� three�phased� behaviour�starting� with� initial� gradual� generation� of� excess� pore�pressure� followed� by� a� period� of� temporary� strain�hardening� during� which� peak� strength� is� attained� and�failure�occurs;� and� a�post�failure�phase� characterized�by�rapid�generation�of�excess�pore�pressure�and�progressive�decline�in�effective�normal�stress�until�a�residual�state� is�reached.� � The� residual� strength� of� the� volcanic� soil� is�nearly�same�as�that�of�poorly�graded,�fine�silica�sand�but�higher� than� that� of� pumice.� While� the� volcanic� soil�required�higher�strain�to�mobilize�both�peak�and�residual�strength,� the� pumice� soil� readily� liquefied� and� rapidly�reached� low� residual� state.� Taking� account� of� all� the�undrained�mechanical�properties�of�the�soils�we�arrive�at�a�new�premise�that�soils�with�constant�stress�ratio�at�peak,�phase� transformation� and� residual� states� may� be� less�resistant� to� liquefaction,� and� may� travel� long� distances�after� a� slip.� The� constant� stress� ratio� phenomenon� is�more�likely�to�be�associated�with�cohessionless�soils�than�cohesive�soils.��
�Keywords�Excess�pore�pressure,�residual�strength,�stress�ratio��Introduction�
Landslides� occur� in� nearly� every� terrain� in� the� world.�Hundreds�of�millions�of�dollars�are�lost�annually�to�mass�movements� on� steep� as�well� as� gentle� slopes.�Nature� of�slope�material,� slope� angle,� fluid�dynamics,� geology� and�climate� are� important� factors� in� prevention� and�mitigation� measures.� To� understand� the� mechanism� of�slope� failures,� two� landslides� –� Las�Colinas� landslide,� El�Salvador� (Fig.� 2)� and� Stromboli� landslide,� Italy� (Fig.� 3)�were� investigated.�The�El�Salvador� landslide�occurred� in�2001� killing� over� 3,000� people� while� the� Stromboli�landslide� occurred� in� 2003.� Results� of� the� investigation�are� compared� to� those�of� silica� sands� to� gain� insight�on�the�pre��and�post�failure�behaviour�of�the�soils�associated�
with�the�landslides.�The�objectives�of�the�research�are�to�understand� the� mechanism� of� excess� pore� pressure�development� in� soils� during� undrained� loading� and� to�model� the� post�failure� behaviour� of� different� types� of�soils�and�the�factors�that�affect�their�residual�strength.��
��
Investigation�procedure�and�sample�characteristics�
Field�techniques�and�sampling�Field� measurements� and� sampling� were� undertaken� at�two� landslide� sites� in� El� Salvador� and� Italy.� Important�features�measured�include�position,�elevation�of�landslide�source� and� toe,� slope� height,� slope� inclination,� aerial�extent� of� moving� block,� direction� of� movement,� depth�and� inclination� of� slip� surface,� rock� type,� degree� of�weathering� and� composition� of� slip� surface.� Soils� were�collected� at� the� source� of� the� landslides� for� laboratory�analysis.�Topographic�map� interpretation� was� carried� before� and�during� the� field�work.� During� the� fieldwork� strikes,� dip�direction� and� magnitude,� and� foliation� trends� were�determined.�Slope�angles�were�measured,�using�an�Abney�level.� Geological� map� interpretation� was� carried� out� to�obtain�additional�information�on�the�geology�of�the�area.�Soil� and� sediment� textural� and� physical� properties� have�an�influence�on�the�susceptibility�of�materials�to�failures.�Sampling�of� soils�was�undertaken� in�order� to�determine�physical� characteristics� that� have� a� bearing� on� soil�structural� strength.� Soil� samples� were� analysed� for� the�following:� particle� size,� natural� moisture� content,�compaction,� liquid� limit,� plastic� limit,� plasticity� index�and�shear�strength.��
�Laboratory�modelling�Oven�dried�specimens�were�placed� in� the�shear�box�and�saturated�with�water.�To�achieve�a�B�value�of�at�least�0.95�carbon�dioxide�was�first�introduced�into�the�samples�after�which,�de�aired�water�was� introduced.�All� samples�were�normally� consolidated� and� thereafter,� shearing� was�performed� by� the� incremental� loading� of� shear� stress.Shear� stress� (resistance)� is� calculated� as� follows:� �
�
57

O.�Igwe,�H.�Fukuoka�–�Post�failure�mobility�and�the�factors�influencing�the�residual�strength�of�soils�
Where� �:� shear� stress,� r:� radius,� �:� angle,� T:� measured�shear� force,� R:� length� of� the� arm� from� center� to� torque�sensor,�r1:�inner�ring�radius,�r2:�outer�ring�radius.��Applied�normal� stress�was�determined� from��o�=��cos
2�,�while� the� initial� shear� stress� was� obtained� from� �o� =��Hsin�cos�� where� H� is� the� thickness� of� the� material�overlying�the�sliding�surface,��� is�the�average�unit�of�the�soil�within�the�sliding�mass,�and���is�the�slope�inclination.��
�Sample�characteristics�Samples� from� Las� Colinas,� El� Salvador� and� Stromboli,�Italy� were� taken� from� the� head� scarp� of� the� landslides�(Fig.�4)�while� the�silica� sands�used�as�control� specimens�are�industrial�sand�materials�composed�of�sub�angular�to�angular� quartz� and� small� amount� of� feldspar.� The� grain�size� distribution� and� the� nature� of� the� pumice� samples�are�shown�in�Figures�5�and�6�respectively.�The�Stromboli�soils�were�taken�from�the�Stromboli�volcanic�monument�that�is�standing�900�m�above�sea�level�(Fig.3).�The� characteristics� of� the� soils� are� shown� in� Table� 1.� In�the� Unified� Soil� Classification� System� (USCS)� a� soil� is�considered�well�graded�if�Cu�>�6�and�Cc�lies�between�1�and�3;�otherwise�it�is�poorly�graded.�Gravel�is�well�graded�if�Cu�>�4�and�Cc�lies�between�1�and�3.��Particle�size�distribution�is�often�considered�when�choice�of�fill�materials�and�design�of�drainage�facilities�are�made�because� particle� gradation� exerts� some� influence� on� the�shear�strength�and�hydraulic�properties�of�soils.�Research�has� also� shown� that� coefficient� of� uniformity� alone�cannot�be�a�reliable�indicator�of�soil�gradation�(Igwe�et�al,�2012).�A� soil�with�high�value�of� coefficient�of�uniformity�(as� high� as� 17.5)� may� still� be� a� poorly� graded� soil� and�needs�another�component�–�coefficient�of�curvature�(Cc)�to�detect�that�the�soil�may�be�a�gap�graded�soil.��Scanning� Electron� Microscopy� (SEM)� analysis� of� a�pumice�material� shows� the�presence�of� inter�� and� intra��particle�void�spaces�(Fig.�7).��
�
�Figure�1�Satellite�map�of�El�Salvador�showing�Las�Colinas�landslide�
�
SEM� is� important� in� the� analysis� of�microstructures� which�could� be� intergrowths,� particle� micro�features� such� as�micro�textures,�dissolution�characteristics�and/or���
Figure�2�Las�Colinas�Landslide,�El�Salvador�
�
�Figure�3�Stromboli�Landslide,�Italy�(picture�taken�by�Daniella)�
��
precipitates�coatings.� Its� high� resolution� stereo� imagery�provides� a� reliable� compositional� analysis� that� are� better�than�the�results�of�traditional�light�microscope.���
�
58

Proceedings�of�the�IPL�Symposium,�UNESCO,�Paris,�2012
�Figure�4�Sampling�locations�on�the�Las�Colinas�Landslide��
�Figure�5�Grain�size�distribution�curves�of�the�soils���
�Figure�6�Nature�of�the�soils�collected�at�Las�Colinas�Landslide���
Physical�model�to�predict�mechanical�properties�
The� slopes� were� modelled� to� predict� the� mechanical�properties�of�the�soils�in�a�ring�shear�apparatus�using�the�equations� in� Fig.� 8. Our� model� aims� to� verify� two�apparently� conflicting� concepts� that� liquefaction�resistance�increases�as�the�grain�size�becomes�coarser�due�to�improved�drainage,�and�also�increases�as�the�grain�size�becomes� finer� due� to� increased� cohesion.� It� is� widely�acknowledged� that� there� is� a� gap� between� current�
practice� of� liquefaction� potential� evaluation� and�laboratory� experiments� on� the� modification� of� the�liquefaction�strength�of�sands�containing�fines;�which�is�a�major�draw�back�in�engineering�design.��
�Figure�7�Inter��and�intra�voids�in�a�pumice�soil�revealed�by�SEM��
Table�1�The�physical�properties�of�the�slope�and�silica�soils�Sample� D50�(mm)� D10�(mm)� Cu�
Volcanic�soil�
0.95� 0.12 12.5�
Red�silty�pumice�
0.56� 0.05 14.0�
Gray�pumice�
1.11� 0.21 7.1�
WG�silica� 0.23� 0.04 9.0�ING�silica� 0.11� 0.03 4.5�GAP�silica� 0.42� 0.03 17.5�NAG�silica� 0.09� 0.03 3.3�
�
�Figure�8�Mathematical�illustration�of�the�physical�model���Results�and�interpretations�
The� pumice� soil� generated� high� excess� pore� pressure� at�small� strains,� and� by� 10� cm� shear� displacement,� pore�pressure� had� almost� become� equal� to� the� normal� stress�(Fig� 9).� The� excess� pore� pressure� ratio� (u/�)� at� residual�
59
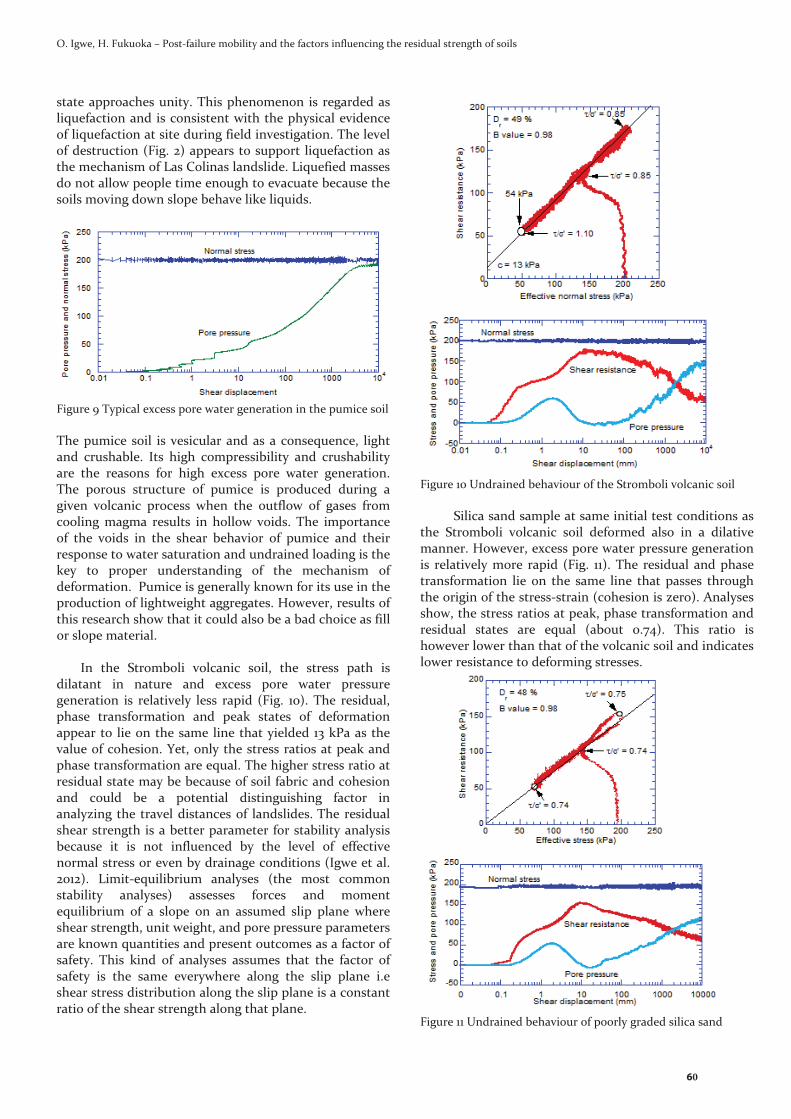
O.�Igwe,�H.�Fukuoka�–�Post�failure�mobility�and�the�factors�influencing�the�residual�strength�of�soils�
state�approaches�unity.�This�phenomenon�is�regarded�as�liquefaction�and�is�consistent�with�the�physical�evidence�of�liquefaction�at�site�during�field�investigation.�The�level�of�destruction�(Fig.�2)�appears�to�support� liquefaction�as�the�mechanism�of�Las�Colinas�landslide.�Liquefied�masses�do�not�allow�people�time�enough�to�evacuate�because�the�soils�moving�down�slope�behave�like�liquids.���
�Figure�9�Typical�excess�pore�water�generation�in�the�pumice�soil��The�pumice� soil� is�vesicular�and�as�a� consequence,� light�and� crushable.� Its� high� compressibility� and� crushability�are� the� reasons� for� high� excess� pore� water� generation.The� porous� structure� of� pumice� is� produced� during� a�given� volcanic� process� when� the� outflow� of� gases� from�cooling�magma� results� in� hollow� voids.� The� importance�of� the� voids� in� the� shear� behavior� of� pumice� and� their�response�to�water�saturation�and�undrained�loading�is�the�key� to� proper� understanding� of� the� mechanism� of�deformation.��Pumice�is�generally�known�for�its�use�in�the�production�of�lightweight�aggregates.�However,�results�of�this�research�show�that�it�could�also�be�a�bad�choice�as�fill�or�slope�material.����
In� the� Stromboli� volcanic� soil,� the� stress� path� is�dilatant� in� nature� and� excess� pore� water� pressure�generation� is� relatively� less� rapid� (Fig.� 10).� The� residual,�phase� transformation� and� peak� states� of� deformation�appear�to� lie�on�the�same�line�that�yielded�13�kPa�as�the�value�of�cohesion.�Yet,�only�the�stress�ratios�at�peak�and�phase�transformation�are�equal.�The�higher�stress�ratio�at�residual�state�may�be�because�of�soil�fabric�and�cohesion�and� could� be� a� potential� distinguishing� factor� in�analyzing� the� travel�distances�of� landslides. The� residual�shear�strength�is�a�better�parameter�for�stability�analysis�because� it� is� not� influenced� by� the� level� of� effective�normal�stress�or�even�by�drainage�conditions�(Igwe�et�al.�2012).� Limit�equilibrium� analyses� (the� most� common�stability� analyses)� assesses� forces� and� moment�equilibrium� of� a� slope� on� an� assumed� slip� plane� where�shear�strength,�unit�weight,�and�pore�pressure�parameters�are�known�quantities�and�present�outcomes�as�a�factor�of�safety.� This� kind� of� analyses� assumes� that� the� factor� of�safety� is� the� same� everywhere� along� the� slip� plane� i.e�shear�stress�distribution�along�the�slip�plane�is�a�constant�ratio�of�the�shear�strength�along�that�plane.��
�Figure�10�Undrained�behaviour�of�the�Stromboli�volcanic�soil������������Silica�sand�sample�at�same�initial�test�conditions�as�the� Stromboli� volcanic� soil� deformed� also� in� a� dilative�manner.�However,�excess�pore�water�pressure�generation�is� relatively�more� rapid� (Fig.� 11).�The� residual� and�phase�transformation� lie� on� the� same� line� that� passes� through�the�origin�of�the�stress�strain�(cohesion�is�zero).�Analyses�show,�the�stress�ratios�at�peak,�phase�transformation�and�residual� states� are� equal� (about� 0.74).� This� ratio� is�however�lower�than�that�of�the�volcanic�soil�and�indicates�lower�resistance�to�deforming�stresses.��
�Figure�11�Undrained�behaviour�of�poorly�graded�silica�sand��
60

Proceedings�of�the�IPL�Symposium,�UNESCO,�Paris,�2012
It� appears� the� coarser� the� particles� the� more� the�capacity�to�generate�excess�pore�pressure�during�shearing�due� to� potential� grain� crushing.� � Experiments� verifying�this�assertion�have�been�conducted�and�results�presented�in� Figures� 12� and� 13.� It� may� be� seen� that� at� effective�normal�stress�values�of�196�kPa�and�290�kPa�well�graded�soils� containing� coarser� particles� generate� much� higher�pore� pressure� after� failure� than� the� soils� with� finer�particles.� The� high� post�failure� pore� pressure� is�responsible� for� the� low� residual� strength� of�well� graded�materials.� Figure� 14� shows� the� undrained� behaviour� of�pumice�differs�widely� from�that�of� the�volcanic�soil.�The�residual� shear� resistance� of� the� volcanic� soil� is� higher�than� those� of� silica� specimens� containing� coarser�particles.��
Figure�12�Influence�of�particle�size�on�pore�pressure�generation��
In� the� volcanic� soil� the� friction� angle� at� peak,� phase�transformation� and� residual� states� is� equal� (40o).� The�friction� angle� at� residual� state� is� the� most� important�parameter�in�predicting�the�potential�travel�distance�of�a�landslide.� The� knowledge� that� the� friction� angle� at� the�three� defined� states� is� equal� is� therefore� a� boost� in�landslide� investigation� and� mitigation� because� the�friction� angle� at� phase� transformation� or� peak� stress�could�be�rapidly�and�conveniently�obtained�with�a�simple�direct� shear� box.� It� therefore� means� that� the� line�connecting� the� three� stress� states� defines� a� critical� or�threshold� state� (Igwe� et� al,� a,b� 2012). The� critical� state�parameter,�as�used�in�the�present�research,�is�the�critical�or�limit�value�of�pore�pressure�at�the�failure�line�(or�at�the�beginning� of� phase� transformation�where� the� resistance�of� soils� drops� temporarily� at� small� strains,� and� regain�strength� with� further� shearing� at� higher� strains),� above�which� a� soil� collapses� and� liquefies,� and� below�which� a�soil� dilates� and� regains� stability,� at� least� temporarily,� if�the�soil� is�monotonically� loaded� in�undrained�condition.�When�curves�of�shear�resistance�and�pore�pressure�versus�shear�displacement�are�made,�the�critical�state�parameter�could�be�defined�as�the�least�possible�dilation�a�sample�of�known�void� ratio�can�sustain�under� the�same� laboratory�conditions.��The� research� further� found� that� for� the� silica� sands� the�friction�angle� at�peak�and� residual� states� is� 38�o� and�36�o�respectively.�These�values�of�friction�angle�are�lower�than�that�of�the�volcanic�soil.�This�may�be�because�of�the�high�crushability�of� the�silica�particles�and� the� resultant�high�excess� pore� pressure� �� a� major� factor� in� fast� moving�landslides.� Literature� is� full� with� accounts� of� calamities�associated�with�rapid�landslides,�which�offer�people�who�live�at�or�close�to�mountainous�areas�little�or�no�time�to�evacuate�each�time�disaster�looms.��
�
Figure�13�Effect�of�particle�size�on�pore�water�pressure�generation������ �
�Figure�14�Residual�undrained�shear�strength�of�the�slope�soils�compared�to�those�of�silica�sands.�
61

��
�������Proceedings�of�the�IPL�Symposium,�UNESCO,�Paris,�2012�
�
Conclusions�
�����Taking� account� of� all� the� undrained� mechanical�properties� of� the� soils� we� arrive� at� a� new� premise� that�soils� with� constant� stress� ratio� at� peak,� phase�transformation� and� residual� states�may� be� less� resistant�to�liquefaction,�and�may�travel�long�distances�after�a�slip.�The� constant� stress� ratio� phenomenon� is�more� likely� to�be�associated�with�cohessionless�soils�than�cohesive�soils.������The� pumice� soil� generated� high� excess� pore� pressure�at� small� strains,� and� by� 10� cm� shear� displacement,� pore�pressure�had�almost�become�equal� to� the�normal� stress.��The� excess� pore� pressure� ratio� (u/�)� at� residual� state�approaches� unity.� This� phenomenon� is� regarded� as�liquefaction�and�is�consistent�with�the�physical�evidence�of�liquefaction�at�site�during�field�investigation.�The�level�of� destruction� appears� to� support� liquefaction� as� the�mechanism�of�Las�Colinas�landslide.�Liquefied�masses�do�not� allow� people� time� enough� to� evacuate� because� the�soils�moving�down�slope�behave�like�liquids.��������The� residual� strength� of� the� volcanic� soil� is� nearly�same�as�that�of�poorly�graded,�fine�silica�sand�but�higher�than� that� of� pumice.� While� the� volcanic� soil� required�higher�strain�to�mobilize�both�peak�and�residual�strength,�the�pumice�soil�readily�liquefied�and�rapidly�reached�low�residual� state.� The� residual,� phase� transformation� and�peak�states�of�deformation�appear�to�lie�on�the�same�line�that�yielded� 13�kPa�as� the�value�of�cohesion.� the� friction�angle�at�peak,�phase�transformation�and�residual�states�is�equal�(40o).��������The� friction� angle� at� residual� state� is� the� most�important� parameter� in� predicting� the� potential� travel�distance� of� a� landslide.� The� knowledge� that� the� friction�angle� at� the� three� defined� states� is� equal� is� therefore� a�boost� in� landslide� investigation� and� mitigation� because�the� friction�angle�at�phase� transformation�or�peak�stress�could�be�rapidly�and�conveniently�obtained�with�a�simple�direct� shear� box.� It� therefore� means� that� the� line�connecting� the� three� stress� states� defines� a� critical� or�threshold�state.������Previous�publications�by�the�first�author�have�defined�the� threshold� state.� The� tendency� of� loose� sands� to�contract� at� low� stress� ratios� leads� to� increase� in� pore�pressure.� The� medium� dense� and� the� dense� sands� also�tended� to� contract� first� before� dilating.� Those�publications� emphasized� that� for� those� sands� that�showed� purely� contractive� behavior� the� pore� pressure�ratio� at� that� collapse� point� (where� liquefaction� may� be�initiated)� was� greater� that� than� unity.� For� those�specimens� that� showed� partial� contractive� behavior� the�pore�pressure�ratio�was�less�than�unity.�In�between�these�two�behaviors�were�those�whose�pore�pressure�ratio�was�unity.�At�the�point�of�failure,�if�the�pore�pressure�ratio�is�less� than� 1,� the� soil� will� dilate� leading� to� a� decrease� in�pore� pressure� which� is� equivalent� to� the� apparent�increase� in� volume� usually� observed� in� drained.� � For�specimens� with� pore� pressure� ratio� greater� than� unity,�
the� soils� fail� without� any� tendency� to� dilate� which�corresponds�to�volume�decrease�in�drained�conditions.�In�contrast,� however� those� specimens� with� pore� pressure�equal� to� unity� show� no� tendency� to� either� dilate� or�contract,� implying� no� volume� change.� Because� the�volume� is� constant,� shearing� and� shear� displacement�progressed� without� any� change� in� shear� resistance,�effective�stress�and�pore�pressure.�������Future� work� includes� defining� the� exact� stage� in� a�stress�strain�void�ratio�space�slides�readily�transform�into�flow�and�to�carry�out�laboratory�shear�tests�on�completely�undisturbed� soils� at� field� densities� to� increase� the�applicability� of� test� results� to� real� problems.� It� is� hoped�that� the� laboratory� tests� will� be� used� with� in� situ�measurements� to� produce� a� reliable� liquefaction�evaluation� procedure� for� sandy� soils.� The� behavior� of� a�completely� liquefied� material� should� replicate� the� high�mobility� of� flow� phenomenon� similar� to� real� liquids� in�the� field.� Successful� simulation� of� complete� liquefaction�in� the� laboratory� or� in� the� field� will� improve� the�understanding�of�the�mechanism�of�dangerous�landslides.���
Acknowledgments�
Our� colleagues� at� Research� Centre� on� Landslides,�Disaster�Prevention�Research�Institute,�Kyoto�University,�Japan� are� gladly� acknowledged.� The� technical� staff� who�handled�equipment�maintenance�are�acknowledged�with�respect.�We�also�wish�to�thank�Mr�Nebedum�Okechukwu�and�Mr�Okonkwo�Ikenna�of�the�Department�of�Geology,�University�of�Nigeria,�Nsukka�for�their�kind�support.��References�(in�the�alphabetical�order)�
Igwe� O,� Fukuoka� H,� Sassa� K� (2012)� Effect� of� relative� density� and�confining� stress� on� shear� properties� of� sands� with� varying�grading.�Geotechnical�and�Geological�Engineering�(in�press)�
�_Igwe�O�(2012)�ICL/IPL�regional�activities�in�West�Africa.�Landslides.�
DOI�10.1007/s10346�012�0324�x��
62

��
�������Proceedings�of�the�IPL�Symposium,�UNESCO,�Paris,�2012�
�
Mechanical�Mathematical�Modelling�and�Monitoring�for�Landslides�
Valentina�Svalova�Institute�of�Environmental�Geoscience�RAS,�Moscow,��Ulansky�per.,�13,�101000�Russia,�[email protected],�7�495�607�47�26�
�
�
Abstract� Mechanical�mathematical� model� of� high�viscous� fluid� was� used� for� modelling� of� the� matter�behavior�on�landslide�slopes.�Equation�of�continuity�and��approximated�Navier�Stockes�equation�for��slow�motions�in� a� thin� layer� of� the� matter� were� used.� The� results� of�modelling� give� possibility� to� define� the� place� of� highest�velocity�on�landslide�surface,�that�could�be�the�best�place�for� monitoring� post� position.� Model� can� be� used� for�comparison�of�calculated�and�measured�velocities�of� the�matter� and� gives� possibility� to� investigate� some�fundamental� aspects� of� the� matter� movement� on�landslide�slope.��
�Keywords�landslides,�modelling,�monitoring���Introduction�
�Landslides� process� is� one� of� the� most� widespread� and�dangerous� processes� in� the� urbanized� territories.� In�Moscow� the� landslips� occupy� about� 3� %� of� the� most�valuable� territory� of� the� city.� In� Russia�many� towns� are�located�near�rivers�on�high�coastal�sides.�There�are�many�churches�and�historical�buildings�on�high�costs�of�Volga�River�and�Moscow�River.��The�organization�of�monitoring�is� necessary� for� maintenance� of� normal� functioning� of�city� infrastructure� in�a�coastal�zone�and�duly� realization�of� effective� protective� actions.� Last� years� the� landslide�process�activization�took�place�in�Moscow.�
Landslide�motions� is� extremely� actual� and� difficult�problem�which� decision� is� necessary� for� preservation� of�valuable� historical� monuments� and� modern� city�constructions.�There�are�near�15�places�of�deep�landslides�and�many�shallow�landslides�in�Moscow�(Fig.1).���
One�of� landslide� sites� is�on�Vorob'yovy�mountains,�on�a�high� slope�of� the� right� coast�of� the� river�Moscow� .�Within�the�limits�of�a�considered�site�there�is�a�historical�monument� of� federal� value� �� «Andreevsky� monastery»,�based�in�1648.�(Fig.2,3,4).�
Also�there�the�complex�of�buildings�of�Presidium�of�the� Russian� Academy� of� Sciences,� constructed� in� 70� –�80th�years�of�20�th�century�(Fig.�4),�bridge�with�station�of�underground� "Vorob'yovy� mountains"� and� a� sports�complex� � are� located.� Landslide� slope� (Fig.� 5)� is� in� an�active�condition.�In�June�2007�a�rather�big�landslide�took�place�there�near�ski�jump�(Fig�6).��
�
����
Figure�1.�Landslides�danger�places�in�Moscow�(in�red).�
��
���������������
Figure�2.�Vorob'yovy�mountains.�Landslide�slope.��
�
63

V.�Svalova��Mechanical�Mathematical�Modelling�and�Monitoring�for�Landslides�
�
���
Figure.� 3.� � Andreevsky� monastery� and� new� buildings� on�landslide�slope.��
�����
Figure� 4.� Presidium� of� RAS,� Andreevsky� monastery� and� new�buildings�on�landslide�slope.�
������
��
Figure.� 5.� Schematic� cross�section� � of� landslide� slope� at�Vorob'yovy�mountains.��
��
�
���
Figure�6.�Place�of�landslide�activization�near�ski�jump.�
Another� landslide� site� is� in� a� southeast� part� of�Moscow� near� museum� �� reserve� "Kolomenskoye"(Fig.�7,8,9).� Last� serious� activization� of� a� landslide� has� taken�place�there�in�2002.�
��������������������Figure� 7.� � Museum� �� reserve� "Kolomenskoye".�
Common�view�.�Landslide�slope.����������
�
�.����� � dp4
140
160
80
100
120
��. �� .,
1000
200300
K1g
J3v2
J3ox
J3v3
K1a
gI I f I I
dpIV
C
J3k
64
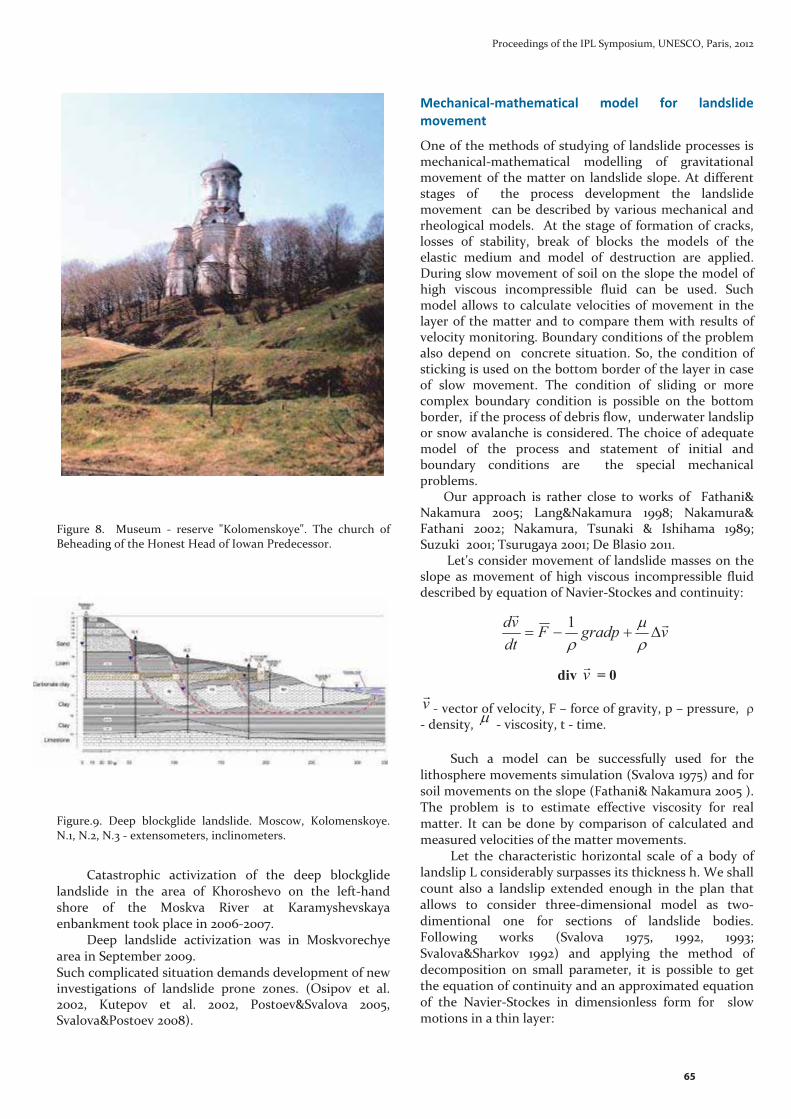
Proceedings�of�the�IPL�Symposium,�UNESCO,�Paris,�2012
�����������
Figure� 8.� � Museum� �� reserve� "Kolomenskoye".� The� church� of�Beheading�of�the�Honest�Head�of�Iowan�Predecessor.�
��
����������
Figure.9.� Deep� blockglide� landslide.� Moscow,� Kolomenskoye.�N.1,�N.2,�N.3���extensometers,�inclinometers.�
�Catastrophic� activization� of� the� deep� blockglide�
landslide� in� the� area� of� Khoroshevo� on� the� left�hand�shore� of� the� Moskva� River� at� Karamyshevskaya�enbankment�took�place�in�2006�2007.�
Deep� landslide� activization� was� in� Moskvorechye�area�in�September�2009.�Such�complicated�situation�demands�development�of�new�investigations� of� landslide� prone� zones.� (Osipov� et� al.�2002,� Kutepov� et� al.� 2002,� Postoev&Svalova� 2005,�Svalova&Postoev�2008).��
Mechanical�mathematical� model� for� landslide�movement�
One�of�the�methods�of�studying�of�landslide�processes�is�mechanical�mathematical� modelling� of� gravitational�movement�of� the�matter�on� landslide�slope.�At�different�stages� of� � the� process� development� the� landslide�movement� �can�be�described�by�various�mechanical�and�rheological�models.� �At�the�stage�of� formation�of�cracks,�losses� of� stability,� break� of� blocks� the� models� of� the�elastic� medium� and� model� of� destruction� are� applied.�During�slow�movement�of�soil�on�the�slope�the�model�of�high� viscous� incompressible� fluid� can� be� used.� Such�model� allows� to� calculate� velocities� of�movement� in� the�layer�of� the�matter�and�to�compare� them�with�results�of�velocity�monitoring.�Boundary�conditions�of�the�problem��also�depend�on� � concrete� situation.� So,� the� condition�of�sticking�is�used�on�the�bottom�border�of�the�layer�in�case�of� slow� movement.� The� condition� of� sliding� or� more�complex� boundary� condition� is� possible� on� the� bottom�border,��if�the�process�of�debris�flow,��underwater�landslip�or�snow�avalanche�is�considered.�The�choice�of�adequate�model� of� the� process� and� statement� of� initial� and�boundary� conditions� are� � the� special� mechanical�problems.��������Our� approach� is� rather� close� to�works� of� � Fathani&�Nakamura� 2005;� Lang&Nakamura� 1998;� Nakamura&�Fathani� 2002;� Nakamura,� Tsunaki� &� Ishihama� 1989;�Suzuki��2001;�Tsurugaya�2001;�De�Blasio�2011.�����������Let's�consider�movement�of� landslide�masses�on�the�slope� as�movement� of� high� viscous� incompressible� fluid�described�by�equation�of�Navier�Stockes�and�continuity:��
����
div v� = 0 �
v� ��vector�of�velocity,�F�–�force�of�gravity,�p�–�pressure,������density,�� ���viscosity,�t���time.�
Such� a� model� can� be� successfully� used� for� the�lithosphere�movements�simulation�(Svalova�1975)�and�for�soil�movements�on�the�slope�(Fathani&�Nakamura�2005�).�The� problem� is� to� estimate� effective� viscosity� for� real�matter.� It� can�be�done�by� comparison�of� calculated�and�measured�velocities�of�the�matter�movements.�
Let� the� characteristic� horizontal� scale� of� a� body� of�landslip�L�considerably�surpasses�its�thickness�h.�We�shall�count� also� a� landslip� extended� enough� in� the� plan� that�allows� to� consider� three�dimensional� model� as� two�dimentional� one� for� sections� of� landslide� bodies.�Following� works� (Svalova� 1975,� 1992,� 1993;�Svalova&Sharkov� 1992)� and� applying� the� method� of�decomposition� on� small� parameter,� it� is� possible� to� get�the�equation�of�continuity�and�an�approximated�equation�of� the� Navier�Stockes� in� dimensionless� form� for� � slow�motions�in�a�thin�layer:��
vgradpFdtvd ��
������
�1
65

V.�Svalova��Mechanical�Mathematical�Modelling�and�Monitoring�for�Landslides�
��������������
P� is� dimensionless� pressure,� U,W� –� dimensionless�velocities,� F� �� Frude� number,� R� –�Reynolds� number,��� ��
density,� � ��� viscosity,� 000 u,, �� ��� scales� of� density,�viscosity�and�velocity.�
Then�it�is�possible�to�get�the�velocities�and�pressure�in�the�layer:�
��
��
0WW � + )( 00 ZXU
���
� +
�
��� ����
���
3
2
2
61 Z
X�� �� 3
031 �� �
�
� !��� 202
1 ��� Z �
������
0� ��the�bottom�border�of�the�layer,��
� � ���the�top�border.�
�Let�on� the�bottom�border� the�condition�of� sticking�
is�satisfied:�
U0=W0=0���
The�discharge��of�matter�along�the�layer�is:��
������
Since�Q=const�lengthways�X,�then:���
�����
The�condition�of�convexity�of�upper�boundary�is:�
This� condition� enables� to� analyze� the� form� of� the�surface�of�moving�matter�(Fig.�10).�
�
���
Figure�10.�Sketches�of�dimensionless�landslide�surface.��Various�possible� forms� of� landslide� ground� surfaces:� )� �� convex,� b)� ��concave.�
Structure�of�clinoforms�(convex)��can�arise,�if:�1.�Q�is�large,�that�is�flux�is�high�2.�� �is� large.� It�means� that�matter� spreads� bad� and� can�support�big�angle�3.�� �is� small.� It� means� that� matter� has� large� specific�volume�and�is�friable�
4.� grad 0� �is� small,� that� is� angle� of� lower� boundary� is�small�
5. 0���
�is� small,� that� is� thickness� of� sedimentary�layer�is�small.�Under�fixed�Q�it�means�that�velocity�of�flux�is� high� and� formation� of� clinoformes� and� even�overturning�of�rockes�are�possible.�����
""#
""$
%
����
��
���
�
��
ZP
ZU
XP
2
2
0���
���
ZW
XU
3
���
���
�
LhR
F�0
00
��LuR �
gLuF
20�
ZP �� ��
& !20
20 )(
2����
���
�����
��
ZX
UU
)()(2 00
020
2
����������
���
���
��
�����
����
���
XXZ
X
30 )(
30
�������
�
���
���
' XUdZQ
0)(39)(
0
030
702
2
�()
*��
���
������
���
XQQ
X
XQ
������
������
XQ
X
��
���
+,��
03
0
2
2
)(3
0
������
�
66

Proceedings�of�the�IPL�Symposium,�UNESCO,�Paris,�2012
All� these�conditions�seem�to�be�natural�enough� for�explanation� of� formation� of� structures� such� as� inflows�and� clinoforms� of� sedimentary� cover� that� confirms��correctness�of�the�model.�
���������It�is�important�to�define�the�place�of��maximal��velocity� on� the� slope.�An�optimum�place� for� location�of�monitoring� post� is� the� point� of� maximal� speeds� of�movement�of�landslide�masses.�
���������Let's�consider�the�massif��of�sedimentary�rocks�
with�the�top�border� � representing�landslide�slope.�The�
bottom� border� 0� �is� compatible� with� an� axis� X.� The�maximum� of� horizontal� speed� U� is� reached� on� the� top�
border� � �of��the�massif�according�to��condition:�
��
�Point� of� the� maximal� horizontal� speed� on� the�
surface� � �can� be� found� from� � condition� of� equality� to�
zero�of�the�first�derivative:�������
From�here�it�is�easy�to�receive�the�condition:���� (1) �
It� is� necessary� to� stress,� that� � (X)� is� known��
function���the�surface�of�landslide�slope.�And�the�received�condition�allows�to�find�a�point�on�a�slope�where�speed�of�movement�is�maximal.�
��������Let's� consider� for� � illustration� of� the� received�decision�the�surface�of��landslide�as�(Fig.�11):�
��It�reflexes��roughly�the�form�of�landslide�surface�(Fig.�
5,�9).�Then�the�condition�(1)�gives:���
Whence�we�receive��������������������������������������and
������������������������� 62,1- �����
���Fig.� 11.� � Sketch� of� dimensionless� slope� surface.� Point� A� is� the�point� of�maximal�horizontal� speed�of�movement� of�masses� on�the�ground�surface�of�the�slope.�
Such�position�of�the�point�of�the�maximal�horizontal�speed� seems� to� be� real,� and� more� exact� data� on� the�structure�of�landslide�and�its�surface�will�enable�to�define�such�point�on�a�concrete�slope.�The�point�of��maximum�of�speed�on�a�slope�defines�the�place�of�possible�failure�of�a�landslip� in� case� of� achievement� of� limiting� pressure� in�massif�of�rocks.��
�There�could�be�several�points�of��local�maximum�of�speed� on� a� slope� ,� that� characterizes� an� opportunity� of�failure�of�a�landslip�on�each�terrace�of�a�slope.�
The� places� of� minimum� speed� can� be� used� for�building� constructions� and� oil�gas� pipelines.� � Model�velocities�of�matter�can�be�compared�with�real�velocities,�that� gives� possibility� to� define� the� real� mechanical�parameters�of�media.�
�Conclusions�
Landslides� process� is� one� of� the� most� widespread� and�dangerous� processes� in� the� urbanized� territories.� The�landslide�process� activization� took�place� in�Moscow� last�years.�Such�complicated�situation�demands�development�of�new�investigations�of�landslide�prone�zones.�
Mechanical�mathematical� model� of� high� viscous�fluid�is�elaborated�for�simulation�of�matter�movement�on�landslide�slopes.�The�results�of�modelling�give�possibility�to�define�the�place�of�highest�velocity�on�landslide�surface,�which� could� be� the� best� place� for� monitoring� post�position.�Model�can�be�used�for�comparison�of�calculated�and� measured� velocities� and� estimation� of� effective�viscosity�of�real�matter,�that�is�subject�of�future�research.�The� results� of� modelling� give� possibility� to� investigate�some�fundamental�aspects�of�landslide�matter�movement�.�
�References��
�De� Blasio� FV� (2011).� Introduction� to� the� physics� of� landslides.�
Springer,�408�p.�Fathani� � TF,� Nakamura� H.� (2005).� Numerical� analysis� of� the�
movement�distance�and�velocity�of�landslides.�Proceedings�of�the�International�Conference�on�Landslides,�Vancouver,�Canada,�10p.�
Kutepov�VM,�Sheko��AI,�Anisimova�NG,�Burova�VN,�Victorov�AS�et�al.�(2002).�Natural�hazards�in�Russia.�Exogenous�geological�hazards.�Moscow,�“KRUK”,�345�p.�
�+����
���� ���
��� ZZ
XZU 0)(
2)(2
,0
��
����� ��
���
XwhereU
XU
1)( ��� thXX�
012 ��� thXXth
251�
�thX
251�
� �
0)(2 22
2
���
���
XX���
67

V.�Svalova��Mechanical�Mathematical�Modelling�and�Monitoring�for�Landslides�
Lang� YH,� Nakamura� H.� (1998).� Characteristics� of� slip� � surface� � of�loess� landslides� and� their� hazard� area� prediction.� Journal� of�Japan�Landslide�Society,�35(1),�pp�9�18.�
Nakamura� H.,� Fathani� TF.� (2002).� � Hazard� area� � prediction� � for�landslide� debris.� Proceedings� of� the� Tenth� � International�Conference�and�Fieldtrip�on�Landslide,�Krakow,�pp�129�142.�
Nakamura�H.,�Tsunaki�R.,�Ishihama�S.�(1989).��Simulation�model��for�debris�movement�of� landslides.�Proceedings� �of�the�Japan�China�Symposium� on� Landslides� and� Debris� Flows,� Niigata,� Tokyo,� pp�81�86.�
Osipov�VI,�Shojgu�SK,�Vladimirov�VA,�Vorobjev�YuL,�Avdod’in��VP�et�al.� (2002).� � Natural� hazards� � � � in� Russia.� Natural� hazards� and�society.�Moscow,�“KRUK”,�245�p.�
Postoev� GP� ,Svalova� VB.� (2005).� Landslides� risk� reduction� and�monitoring� for� urban� territories� in� Russia.� Proceedings� of� the�First� General� Assembly� of� � ICL� (International� Consortium� on�Landslides),� “Landslides:� risk� analysis� and� sustainable� disaster�management”,�Washington,�USA,�Springer,�pp�297�303.�
Suzuki� K.� (2001).� Estimation� of� the� travel� distance� � of� landslide��debris� in� granite� area.� � Master� Thesis� at� Tokyo� � Univ.� � of�Agriculture��and�Technology.�Tokyo,�pp�32�47.�
Svalova�V.,�Postoev�G.�(2008).�Landslide�Process�Activization�on�Sites�of�Cultural�Heritage� in�Moscow,�Russia.�Proceedings�of� the�First�World�Landslide�Forum�2008,�Tokyo,�Japan,�4p.�
Svalova� V.B.� (1993).� Mechanical�mathematical� simulation� of�geological� � � structures� � �evolution.�Geoinformatics,� �v.�4,�N3,�pp�153�160.�
Svalova� V.B.� (1992).� � Mechanical�mathematical� models� of� the�formation� and� evolution� of� sedimentary� basins.� Sci.de� la� Terre,�Ser.Inf.,�Nancy,31,�pp�201�208.�
Svalova� V.B.,� Sharkov� E.V.� (1992).� Mantle� diapirs� and� surface�depression� in� back�arc� areas:� � a� rheological� model.� � Ofiolity,��17/1/,�pp�165�170.�
Svalova�V.B.�(1975).The�models�of�the�lithosphere�movements.�Ph.D.�Thesis�at�Moscow�State�University,�130�p.�
Tsurugaya�K.��(2001).�Study�of�the�occurrence�and��flow�mechanism�of� the� large�scale� landslides� caused�by� �an�earthquake� .�Master�Thesis�at�Tokyo��Univ.��of�Agriculture��and�Technology.�Tokyo,�pp�80�108.�
�����������������������
����������
68

��
�������Proceedings�of�the�IPL�Symposium,�UNESCO,�Paris,�2012�
�
A� Comparative� Analysis� of� Landslide� Susceptibility� by�WAA�and�SINMAP�Model�A�A�Virajh�Dias(1)�and�A�A�J�K�Gunathilake(2)�1) Centre�for�Research�&�Development,�Central�Engineering�Consultancy�Bureau,�Colombo�7.�2) Post�Graduate�Institute�of�Science�/�Department�of�Geology,�University�of�Peradeniya,�Sri�Lanka,��
�
Abstract:� In�order�to�analyze�susceptibilities�to�shallow�landslide�occurance,�a�modeling�of�overburden�soil�depth�and� rainstorm� occurrence� is� necessary,� since� both� of�them�are�controlling�factors�in�the�recurrence�interval�of�shallow�landsliding.�Landslide�hazard�zoning�mapping�is�a� tool� and� one� way� solution� to� mitigate� the� landslide�disaster.�Shallow�landslides�are�one�of�the�most�common�types� of� failures� occurring� frequently� in� steep� slopes,�overburden� soil,� landscapes� in� different� climatic� zones.�As� for� the� effect� of� topography� that� slope� angle,� slope�drainage,�vicinity�of�road�and� infrastructure,�overburden�soil� depth� and� geology� are� important� factors� for�recurrence� of� shallow� landsliding.� Data,� although�insufficient� in� number,� stimulated� the�debate� about� the�effect�of�geology�and�topography�on�the�susceptibility�to�shallow�landsliding.�An�Analytical�Hierarchical�Process�is�applied� in� order� to� derive� the� weights� associated� with�attribute� map� layers.� And� based� on� these� weights,� GIS�datasets� are� combined� by� weighted� Average� Analysis�(WAA)�and�the�landslide�susceptibility�map�of�the�study�area� created.� The� resulting� information� was� compared�with�the�landslide�susceptibility�map�derived�through�the�SINMAP� model.� Both� outputs� are� useful� for� a� better�understanding� of� landslide� susceptibility� comparatively�to� a� sensitive� landslide� disaster� event� and� their� origins�and� prioritization� of� efforts� for� the� reduction� and�mitigation�of� future� landslide�hazards.� Sensitivity� of� the�both�approaches�was�fine�tuned�with�the�overburden�soil�strength� parameters,� geomorphological� evidences� and�field�verification�techniques. ��Keywords:��Landsides,�AHP,�Susceptibility,�SINMAP��Introduction�
Landslides� are� one� of� the� major� natural� hazards� that�account� each� year� for� enormous� property� damage� in�terms� of� both� direct� and� indirect� cost.� Landslides� are�defined� as�movement� of� a�mass� of� rock,� debris� or� earth�down�slope,�due�to�gravitational�pull,�can�be�triggered�by�a� variety� of� extrinsic� factors� such� as� intense� rainfall,�earthquake,� seismicity,� change� of� ground� water,� storm�waves�which�causes�rapid�stream�erosion�and�decrease�in�shear�strength�of�slope�forming�materials.� In�addition�to�
that�extrinsic�variables�such�as�human�interference�in�the�hill� slope� areas� for� construction� of� roads,� urban�expansion� along� the� hill� slopes,� non� engineered�constructions,� deforestation� contributes� landslide�causative� factors.� A� post�storm� hazard� assessment� was�conducted� by� Sri� Lanka� in� 2003,� due� to� torrential� rains�accompanied� by� heavy� winds� had� left� an� estimated� 247�dead� and� over� 200,000� families� displaced� during� the�month� of� May� 2003.� GIS� mapping� technique� is� ideally�suitable� for� overall� evaluation� of� regional� effects� and�interpretation� of� landslide� susceptibility� analysis� which�can� be� interpreted� even� inaccessible� mountainous�regions�where�majority�of�old�landslides�were�identified.��
Figure� 1:� Rainfall� patterns� from� TRIMM� satellite�observations�during�15�19�May�2003.���
�
Sri�Lankan�Content�
Landslide� take� place� on� slopes� and� generally� but� not�always,� on� steep� slopes,� where� there� is� already� some�degree�of�instability�(Cooray,�1994).�Hence�landslides�are�commonest�in�the�central�hill�country�of�Sri�Lanka,�which�is�generally�considered�to�be�land�over�300m�above�MSL�(Cooray,�1994).�The�hill�country�extends�from�the�parallel�hill� ranges� of� the� Ratnapura� and� Rakwana� areas� in� the�south�west�to�the�Knuckles�Massif�in�the�north�east,�and�includes�all�the�land�in�between.�The�areas�worst�affected�by�the�landslides,�and�areas�where�they�were�commonest�
69

A�A�Virajh�Dias�and�A�A�J�K�Gunathilake�–�A�Comparative�Analysis�of�Landslide�Susceptibility�by�WAA�and�SINMAP�Model�
until� recent� years,� were� N’Eliya,� Kegoll,� Badulla,�Ratnapura,� Matale� and� Kandy� (Tissera,� NBRO,� 1994).��Many� studies� have� been� conducted� to� pinpoint� the�correlation�between�rainfall�and� landslide�occurrence,� in�different�geological�and�climatic�environments.��
In� Sri� Lanka,� Landslides,� which� are� often�triggered�by�intense�rains,�are�responsible�for�about�3000�casualties� and� considerable� losses� to� road� and�infrastructure�approximately�covering�about�10,000�sq�km�of� the�hill� country(Tissera,�NBRO,� 1994).� � Between� 1964�and�1991,�floods�and�landslides�are�reported�to�have�killed�about� 750� people� and� to� have� left� about� 1.3� million�homeless.�Sri�Lanka�is�a�small�tropical�island�country�off�India's�southern�coast�with�only�18.6�million�inhabitants.��
In� late� 80’s� when� information� was� scanty,� the�landslide� triggering� threshold� was� placed� at� 200mm� of�rainfall� in� a� 72� hour� period,� provided� rain� in� the� area�continued�(Bhandari,�et�al.,�1992)�.��
0
10
20
30
Average Rainfall Intensity(mm/day)(1981-1990)
Rai
nfal
l Int
ensi
ty o
f the
Dai
ly
Land
slid
e ev
ent/A
vera
ge D
aily
R
ainf
all I
nten
sity
6.8
6.8
6.8
13.7
13.7 6
10.5 7.7
8.3
8.4
8.4
10.6 8.8
�Figure� 2:� Ratio� of� the� rainfall� intensity� of� the� daily�landslide�event� to�average�daily� rainfall�of� intensity�over�average�daily�rainfall�intensity�(Bhandari�&�Dias,�1996).�
This� is�mainly� because� of� the�preliminary� loss� of�metric�suction,� intensive� rate� of� water� penetration� as� well� as�percolation� of� rainwater� and� lack� of� slope� protection�ingredients� in� the�event�of�heavy� rains� (Dias,et.al.,1997).��Some� of� the� dynamic� appears� to� be� related� to� the�difficulties� in� modeling� of� unsaturated� boundary�condition�and�the�flow�through�the�unsaturated�soil�(Dias,�et.al.,�2001).�
2
2.5
3
3.5
4
Average Rainfall Intensity(mm/month)(1981-1990)
Rai
nfal
l Int
ensi
ty o
f the
mon
th
Land
slid
e ev
ent/A
vera
ge m
onth
lyR
ainf
all I
nten
sity
222.
9
222.
9
222.
9
416.
6
416.
6
186
325.
9
324.
3
237.
5
256.
9
276.
2
276.
2
327.
6
210
�Figure� 3:� Ratio� of� the� rainfall� intensity� of� the�month� of�the� landslide� event� and� average�monthly� rainfall� of� the�place�over�average�monthly�rainfall�intensity�(Bhandari�&�Dias,�1996).�
The� criterion� did�work� only� partially,� in� case� of�reactivation� of� recent,� seasonally� active� landslides.� � A�relationship�of�rainfall�records�of�a�very� large�number�of�landslides�conveys� that�24hour�rainfall�associated�with�a�landslide� event� was� generally� 2� to� 23� times� higher� than�average�daily�rainfall�of�that�particular�location�(Bhandari�&�Dias,�1996).�The�month�in�which�a�particular�landslide�event� fell� attracted� 2.5� to� 3� times� the� average� monthly�rainfall�and�annual�rainfall�in�the�year�of�a�landslide�event�was� found� to� be� 22%� to� 50%� higher� than� the� annual�rainfall�average�(Bhandari�&�Dias,�1996).��
Geologically,�Sri�Lanka�is�considered�to�be�of�low�seismicity� (Vitanage,� 1994).� As� in� the� case� of� Indian�Deccan� Plateau� around� Koyan� and� Latur,� Maharastra�State�in�India,�the�most�scientists�including�geologist�and�engineers�in�Sri�Lanka�believed�Sri�Lanka�as�an�area�least�likely�to�be�subject�to�earthquake�than�predicted�to�date.���
Shallow�Landslides�and�Model�Approach�
Landslides�result�from�independent�or�combined�effect�of�spatio�temporal� intrinsic� and� extrinsic� variables,�including� hydrology� (rainfall,� evapotranspiration� and�ground�water),� topography� (slopes� and� ground� setting),�geology� (soil� and� rock),� land� use� (vegetation� surcharge,�root�strength)�and�human�activities�including�excavation,�trenching�and�backfilling.�Relatively�static�environmental�factors� (i.e.� elevation,� slope,� aspect� and� topographic�curvatures)� exhibits� negligible� changes� in� their� state�through� � time,� and� differ� from� dynamic� factors� such� as�climatic� or� human� activities� which� tends� to� alter�landslide� � susceptibility� through� time.� The� spatio�temporal� differences� do� exist� in� both� environments.� To�predict� the� spatial� and� temporal� pattern� of� the� areas�susceptible� to� landslide,� a� distribution� approach� is�needed� that� incorporates�varying�precipitation� intensity,�soil� depth,� vegetation� (species,� age,� density)� and� root�strength.����
Over� the� past� several� years,� a� variety� of� entities�have� developed� GIS�based�models� for� the� evaluation� of�shallow� and� rapid� slope� stability� using� static� base� slope�stability� models� which� includes� deterministic�assessments�and�probabilistic�approach�or�both�compiled�together� for� the� output� results.� These�models,� however,�have�not�been�rigorously�compared�or�adapted�for�state�wide� application� to� management� and� regulation� of� up�country�development�programme�in�Sri�Lanka.�For�image�interpretation�and�field�mapping�of�landslides,�the�use�of�checklists� for� standardized� data� collection� is� an�important,� but� also� time�consuming� component� (Van�Westen,�1993).��
Landslide� hazard� assessment,� as� defined� by�Varnes� (1984),� aims� at� improving� the� knowledge� of�processes�that�lead�to�slope�instability�and,�in�addition,�at�identifying� the� locations� where� and� when� landslides� or�potentially� instable� slopes� may� occur.� According� to�Carrara� et� al.� (1998)� approaches� for� landslide� hazard�assessment� can� generally� be� grouped� into� two� main�
70

Proceedings�of�the�IPL�Symposium,�UNESCO,�Paris,�2012
categories:� the� direct,� qualitative� method� that� relies� on�the� ability� of� the� investigator� to� estimate� actual� and�potential� slope� failures� and� indirect,� quantitative�methods�that�produce�numerical�estimates�(probabilities)�of� the� occurrence� of� landslide� in� any� hazard� zone.� The�choice�of�the�method�mainly�depends�on�the�spatial�scale�(Van�Westen,� 2000)� and,� thus,� the� data� availability.� To�assess� landslide� susceptibility� on� a� regional� scale,�multivariate� statistical� approaches�were� commonly� used�in�the�last�decades.���
SINMAP�Model�Approach�
�The� shallow� landslide� usually� obeys� the� infinite� slope�failure� condition� which� explains� the� validity.� Several�shallow� landslide� models� have� been� developed� on� the�basis� of� the� infinite� slope� equation.� The� mathematical�models� developed� by� Montgomery� and� Dietrich� (1994),�Pack�et�al.�(1998)�available�for�studying�shallow�landslides,�take�into�account�the�infinite�plane�slope�stability�model�coupled� with� a� steady� state� topographic� hydrologic�model.��
The� stability� index� (SI)� is� defined� as� the�probability� that� a� location� is� stable,� calculated� by�considering�the�most�and�least�favourable�situations�(i.e.�either�lower�or�upper�bounds)�and�the�probability�that�a�certain� factor� of� safety� may� be� attained.� The� factor� of�safety�calculation�(FS)�in�SINMAP�is�based�on�the�infinite�slope�form�of�the�Mohr�Coulomb�failure�law�as�expressed�by� the� ratio� of� stabilizing� forces� (shear� strength)� to�destabilizing� forces� (shear� stress)� on� a� failure� plane�parallel�to�the�ground�surface�(Hammond�et�al.,�1992).�
FS �Cr � Cs � cos2� [� s (D � Dw ) � (� s �� w )Dw ]tan�
sin� cos� [� sD]�
The� specific� catchment� area� is� defined� by� the�ratio� of� the� area� that� drains� into� the� grid� cell� to� the�contour�length�across�the�grid�cell.� �For�steady�saturated�flow,� lateral� subsurface� flow� may� be� expressed� by� the�transmissivity�(T)�along�slope�(Pack�et�al.,�1999):�
T sin� b � Ks Dw cos � sin� b ������������������
where,�T� is� assumed� to�be�constant�with�depth,�b� is� the�flow� length,� and�Ks� is� saturated� hydraulic� conductivity.��The�capacity�for�subsurface�lateral�flow�is�defined�by�the�product�of�recharge�and�contributing�area:�
R a � Ks D cos� sin� b �������������������
where,�D� is� the� vertical� thickness� of� soil.� Combining� 2a�and�2b�yields�an�expression�for�the�thickness�of�the�water�table:�
Dw � D RT
absin� ����������������������������������������
where��
� C�=�(Cr�+�Cs)�/�(h�r�s�g)�is�the�combined�(root�and�soil)�cohesion�made�dimensionless�relative�to�the�perpendicular�soil�thickness.��
� h�=�D�cos����soil�thickness,�perpendicular�to�the�slope.��
� Cr���root�cohesion�[N/m2]��� Cs���soil�cohesion�[N/m2]��� D���the�vertical�soil�depth�[m]��� ����slope�angle� � r�s���wet�soil�density�[Kg/m3]��� g���the�gravitational�acceleration�(9.81�m/s2)��� R���recharge�rate�(m/hour)��� T���transmissivity�(m2/hour)��� a���specific�catchment�area�(m2)��� r�w���the�density�of�the�water�[Kg/m
3]��� ����the�internal�friction�angle�of�the�soil�[deg]��
In� the� FS� formula,� terrain� stability� model� SINMAP� can�compute� all� variables� from� the� topography,� except� for�combined� cohesion;�C,� tan� of� effective� angle� of� internal�friction�of�soil;�tan(�)�and�wetness�index,�T/R.�The�digital�elevation�model� (DEM)� and� appropriate� soil� parameters�were� the� fundamental� input� parameters� for� the� model.�For� the� purpose� of� detailed� calibration� of� the� model,�initially�the�Kalawana�division�divided�in�to�10�number�of�sub�watersheds�using�hydrology�extension�of�the�ArcView�3.2.�The�analysis�was�further�extended�by�sub�dividing�to�more� sub�watersheds� in�old� landslide�proven� areas.�The�evaluation� of� the� T/R� ratio� and� the� combined� cohesion�(�i.e.�soil�cohesion�and�the�root�cohesion)�was�determined�considering� supportive� landuse� pattern� of� a� watershed.�The� uncertainty� of� these� parameters� is� incorporated�through�the�use�of�uniform�probability�distributions�with�lower�and�upper�bounds.���
Model�uses�the�following�assumptions:��
1. Shallow� lateral� subsurface� flow� follows�topographic�gradients.��
This� implies� that� the� contributing� area� to�groundwater� flow� at� any� point� is� given� by� the� specific�catchment�area�(a)�defined�from�the�surface�topography.�To� calculate� this,� the� upslope� area� of� each� grid� cell� is�taken� as� its� own� area� and� then� the� area� from� upslope�neighbours� that� have� some� fraction� draining� to� it� is�added.� Specific� catchment� area� is� then�upslope� area�per�unit�contour�length.��
71

A�A�Virajh�Dias�and�A�A�J�K�Gunathilake�–�A�Comparative�Analysis�of�Landslide�Susceptibility�by�WAA�and�SINMAP�Model�
Slope�steepness� is�a�major�contributing�factor�to�the�occurrence� of� landslides� closely� related� to� many� other�factors� including� the� soil� thickness,� climate,� hydrology,�lithology,�structure�and�geomorphic�history.�
�2. Lateral�discharge�at�each�point� is� in�equilibrium�
with�steady�state�recharge�R�[m/hour].��
The� sensitivity� of� clays,� the� ratio� of� peak� to�remoulded� strength,� is� an� important� factor� influencing�the�behaviour�residual�soils.�The�Kalawana�area�silty�sand�to� clayey� sand� had� only� slight� to�medium� sensitivity� of�soil,� and� exhibited� limited�mobility� near� the� toe� of� the�landslide�where�they�flowed.�In�contrast�some�cases�with�high� sensitivity� (are� subject� to� sudden� collapse� and�mobilization�into�very�rapidly�moving�landslides.�
3. The�capacity�for�lateral�flux�at�each�point�is�T*h,�where�T� is� the� soil� transmissivity� [m2/hour],� i.e.�hydraulic� conductivity� [m/hour]� times� soil�thickness,�h�[m].��
High�pore�water�pressure�reduces�shear�strength�and�is� a� major� mechanism� responsible� for� triggering�landslides.� Landslides� in� fine�grained� soils� triggered� by�elevated�pore�water�pressures�during�heavy�precipitation�and� landslide�movement,�water� rapidly� flowed� from� the�main�scarp�forming�ponds�on�the�body�of�the�landslide.�
Evaluation�of�Results�
Results� from� the� factor� of� safety� calculations� are�expressed� by� a� stability� index� based� on� values� of� FS�ranging�from�0�to�>�1.5.��The�stability�index�(SI)�is�defined�as� the� probability� that� a� location� is� stable� assuming�uniform� distribution� of� the� soil� parameters� over� their�range�of�values.�The�classification�is�divided�into�6�classes.��Classes� 1�3� are� for� regions� that� according� to� the� model�should�not�fail�with�the�most�conservative�parameters�in�the�specified�range.��These�areas�have�SI�>�1.5�and�FS�>�1.0.���For� classes� 4�5,� the� calculated� FS� is� <� 1.0,� yet� the�probability� of� failure� is� less� than� and� greater� than� 50%,�respectively.���These�two�classes�define�a�lower�and�upper�limit� for�ground� failure�and�have�SI�values� 1.0�1.5�and�0�1.0,� respectively.� � Class� 6� is� unconditionally� unstable�meaning� that� the� probability� of� failure� within� the�specified�range�of�parameters�is�greatest�(assumed�>�90%�probability).���In�this�case,�FS�is�<�1.0�and�SI�=0.��
Slope�Dynamics�
Understanding� of� factors�which� influence� slope� stability�should�be�firmly�based�on�the�principles�of�effective�stress�and� the� influence� of� strains� and� deformations� on� shear�strength.�Moreover,�the�importance�of�geology,�geological�history�and�geological�modeling�can�hardly�be�overstated�(Fookes� 1997;� Fookes� et� al.� 2000;� Hutchinson� 2001).�Conventional� stability� analyses�play� a�useful�but� limited�role�in�assessing�and�managing�slopes.�For�a�discussion�of�
the�merits� and� limitations�of� conventional�deterministic�and� probabilistic� analyses,� the� more� explanations� are�given� in� Chowdhury� (2000),� Duncan� (2000)� and�Chowdhury�&�Flentje�(1999).��
Landslide� dynamics� gets� remarkably� modulated�by� interplay� of� several� factors� and� all� related� scientific�studies�must� therefore� necessarily� attempt� to� co�related�cause�effect� relationship.� (Bhandari� &�Dias,� 1996).� Since�the� advantage� of� slope� movement� and� piezometric�measurements�may�not�always�be�available,� it�may�often�be�helpful� to� co�related� rainfall� intensities�with�possible�initiation� of� Riedel� shears� and� other� slope� surface�features�particularly�in�the�areas�known�to�be�a�landslide�(Dias�&�Bhandari,�1996).��
Many�of�the�relatively�large�landslides�have�their�main� or� lowest� slip� surface� located� at� or� near� the�interface� between� soil� intact� or� colluvium� and� bedrock.�This� is� particularly� the� case� for� relatively� deep�seated�landslides� that�move� very� slowly� and� intermittently� and�require� subsurface� monitoring� with� inclinometers�(Chowdhury�&� Flentje� 1998)� for� the� accurate� evaluation�of� stability.� Typical� average� rates� of� movement� range�from�0.1�mm�per�day�up�to�15.6�mm�per�day.�According�to�the� WP/WLI� (Working� Party� on� World� Landslide�Inventory),� 1995,� these� correspond� to� velocity� ranges�from� extremely� slow� to� slow.� These� flows� usually� begin�when� the�pore�pressures� in�a� fine�grained�mass� increase�until�enough�of�the�weight�of�the�material�is�supported�by�pore�water�to�significantly�decrease�the�internal�shearing�strength� of� the�material.� This� thereby� creates� a� bulging�lobe�which�advances�with�a�slow,�rolling�motion.��
This� is�mainly�because�of�the�preliminary� loss�of�metric�suction,�intensive�rate�of�water�penetration�as�well�as� percolation� of� rainwater� and� lack� of� slope� protection�ingredients�in�the�event�of�heavy�rains�(Dias,�1997).��Some�of�the�dynamic�appears�to�be�related�to�the�difficulties�in�modeling� of� unsaturated� boundary� condition� and� the�flow�through�the�unsaturated�soil�(Dias,�et.al.,�2001).�
Deterministic,�or�physically�based,�models�are�based�on� physical� laws� of� conservation� of� mass,� energy� or�momentum.�The�parameters�used�in�these�models�can�be�determined� in� the� field� or� in� the� laboratory.� Most�deterministic� models� are� site�specific� and� do� not� take�into� account� the� spatial� distribution� of� the� input�parameters.�Models�which� take� into� account� the� spatial�distribution� of� input� parameters� are� called� ‘distributed�models’� (Van� Westen,� 1994).� Deterministic� distributed�models� require�maps�which� give� the� spatial� distribution�of�the�input�data.�The�application�of�deterministic�models�for� the� zonation� of� landslide� hazard� in� larger� areas,�however,�has�never� seen�a�more� extensive�development,�due� to� the� regional� variability� of� geotechnical� variables�such� as� cohesion,� angle�of� internal� friction,� thickness�of�layers,� or� depth� to� groundwater.� Furthermore,� the�calculation�of�safety�factors�over� larger�areas� involves�an�extremely� large�number�of�calculations,�which�could�not�be�executed�without�the�use�of�GIS.��
72

Proceedings�of�the�IPL�Symposium,�UNESCO,�Paris,�2012
Weighted� Average� Analysis� (Factor� Overlay� Model)�Approach�
Landslide� susceptible� analysis� requires� validity� and�prominence�of�individual�factors�responsible�for�the�slope�instability� and� that� could� be� used� in� place� of� weighted�average�analysis.��
Therefore,� in� the� second�method�of� approach,� a�number� of� factor� maps� were� used� for� the� study.� These�were�slope�map�derived�from�the�DEM,�bedrock�geology�map,� landuse� map� derived� from� the� aerial� photos,� soil�map� derived� from� the� average� combined� cohesion�concept� (i.e.� root� cohesion� and� soil� cohesion),� derived�map�of�road�buffer�from�slopes,�rainfall�map�and�stream�density�map.�Rainfall�is�the�most�triggering�factor�in�most�slope� instability� problems� in� hill� slopes.� Therefore,�hydrological� parameters� (rainfall� and� stream� density)�were�considered�to�obtain�reasonably�accurate�weight�for�the� analysis.� Three� day� cumulative� rainfall� distribution�pattern�in�a�particular�watershed�and�total�number�of�1st�order� streams� in� the� watershed� were� considered.� The�evaluation� of� weighted� average� was� made� through� the�Analytical�Hierarchy�Process�(AHP)(�Lane,�E.F.�&�Verdini,�W.A.,�1989).���Factor�Prioritizing�and�Weighted�Average�Analysis���
The� Analytic� Hierarchy� Process� �� AHP� �� is� a�mathematically� based� process� that� can� be� used� to�prioritize� requirements.� Its� applicability� is� in� the� latter�portions� of� the� requirements� phase,� after� the�requirements� are� elicited.� The� requirements� will� likely�have�to�be�organized�using�a�hierarchy�such�that�not�just�the� requirements�can�be�categorized�but� such� that� their�respective�categories�can�be�prioritized�as�well.�
Factor� prioritize� requirements� was� made� using�Analytical� Hierarchy� Process� (AHP)� for� the� Kalawana�watershed.� In� this� method,� at� first� for� the� reason� of�determining� different� factors� preference� and� conversion�they� into� quantitative� values,� is� used� from� valued�judgements.� In� this� case,� the� preference� of� a� factor� as�compared�with�the�other�factor�is�taken�into�as�a�table�1,�and�then�these�judgements�are�changed�into�quantitative�values�from�1�to�9.��
The� areas� with� highest� landslide� susceptibility� were�chosen� to� be� studied� in� detail� from� the� point� view� of�slopes� and� directions� of� slopes.� Next� prominence� was�considered� as� soil� properties.� The� combined� cohesion�(root�cohesion�and�soil�cohesion)�and�the�effective�angle�of� internal� friction�has� considered� for� the� interpretation�of� weighted� average� analysis.� All� other� factor� such� as�bedrock� geology,� landuse,� hydrology� 1(rainfall),�hydrology�2(1st�order�streams)�and�road�buffer�considered�as� decreasing� tendency� for� the� landslide� susceptibility�quantification� assessment.� � The� creation� of� a� digital�terrain�model�showed�to�be�very�important�for�a�relevant�landslide�susceptibility�analysis�made�in�larger�scale�than�1�:�50�000.��
Table� 1:� The� preference� of� factors� and� conversion� they�into�quantitative�values�
Preference� of� a� factor� as� compared�with�the�other�
Numerical�value�
Extremely�preferred� 9�
Very�strongly�preferred� 7�
Strongly�preferred� 5�
Moderately�preferred� 3�
Equally�preferred� 1�
Intervals�between�preferences� 2,4,6,8�
�After�the�valuing�of�area�with�regard�to�seven�factors,�
at� present,� the� values� of� seven� factors� classes� X� are�multiplied� by� derived� individual�weights� for� each� factor�(w1…..w7)�and�then�are�summed�together.�Then�the�total�value�M1� for� each� pixel� and� the� regional� model� will� be�derived:��M1�=�w1X1�+�w2X2�+�w3X3�+�w4X4�+�w5X5�+�w6X6�+�w7X7��And�with�replacing�the�combined�weights�(w1…..w7)�that�had�been�earned�previously,�the�final�model�was�derived:��M�=�w1X1�+�w2X2�+�w3X3�+�w4X4�+�w5X5�+�w6X6�+�w7X7��� �Where:�M�=�Susceptibility�coefficient��X1…X7� =� orderly� are� related� to� slope,� soil,� geology,�landuse,� hydrology� 1(rainfall),� hydrology� 2(1st� order�streams)�and�road�buffer�and,�w1….�w7�=�are�the�weights�related�to�each�X1….�X7�factors.�M�variations�from�0�to�1,�thereafter� 5� number� of� susceptibility� classes� were�assigned� as� high� values� attain� high� susceptibility�landslides.�
�
Study�Area�
The�selected�study�area�mainly�belongs� to� the�Kalawana�administrative� division� which� belongs� to� the�Sabaragamuwa� Province� in� Sri� Lanka.� It� runs� from�6°35'30"�To�6°22'20"�northern�latitude�and�from�80°38'25"�To�80°17'23"�eastern�longitude.��
Klawana� is� located� in� the� south�western� part� of�Sri�Lanka�in�the�province�of�Sabaragamuwa,�the�so�called�wet�zone.�A�Kalawana�main�watershed�is�the�area�drained�by� three� major� tributaries� namely� Delgoda� Ganga,�Koswatta� Ganga� and� the�Wewa� Ganga� as� shown� in� the�Fig.�4.�
73

A�A�Virajh�Dias�and�A�A�J�K�Gunathilake�–�A�Comparative�Analysis�of�Landslide�Susceptibility�by�WAA�and�SINMAP�Model�
� �
�
�
�
�
Figure�4:�Overall�sanction�of�the�study�which�includes�major�sub�watersheds�of�the�Kukule�Ganga�main�watershed.�Three�major�tributaries�are�situated�within�the�Kalawana�Administrative�Division�of�the�Ratnapura�District.
�Table� 2:� Landuse� Characteristics� of� the� Kalawana�Division�of�Sri�Lanka�
Landuse� ���Area�km2� �%�Area�Rivers� 6.20� 2.03�Tank� 0.04� 0.01�Built�up�Land� 0.02� 0.01�Homesteads� 17.54� 5.75�Tea� 21.88� 7.17�Rubber� 6.13� 2.01�Coconut� 0.04� 0.01�Paddy� 10.08� 3.30�Spars�used� 86.64� 28.39�Other�Crop�Land� 0.95� 0.31�Dense�Forest� 105.93� 34.72�Open�Forest� 20.78� 6.81�Forest�Plantatio� 9.47� 3.10�Scrub�Land� 13.13� 4.30�Grass�Land� 6.11� 2.00�Barren�Land� 0.18� 0.06�Rock�Outcrop� 0.01� 0.00�
�
Table� 3:� Resorce� Profile� of� the� Kalawan�Divison� (� DSO,�Ratnapura,�2002)�
Description Record with units
Area of Kalawana Administrative Division
385 (Sq km)
Major City Areas Kalawana,Weddagala & Pothupitiya
Total Population 48201 Building Units Housing Units 9673 Total Number of Building Units 10450 Agricultural holdings TotHld - Total number of agricultural holdings
9889
Major Hydropower Development Projects KUKULE GANGA (High) HP 122 MW PENTAX (Mini) HP 3.2 MW ZYREX (Mini) HP 10.0 MW WESWIN (Mini) HP 2.8 MW
N
#
Kukule Ganga
#
#
Koswatta Ganga
#
Delgoda Ganga
#
Wewa Ganga#
Rambuke Ganga
#
Rambuke Ganga
#
Maha Ganga
Watershed / Arae Description Area Km2
Delgoda Ganga 110.577 Koswatta Ganga 127.648 Wewa Ganga 67.079 Kukule Ganga 305.304 Kalawana Division 384.527
74

Proceedings�of�the�IPL�Symposium,�UNESCO,�Paris,�2012
Study�Objectives�and�Method�of�Approach�
The� main� objective� of� the� study� is� to� identify� the� area�susceptible� to� landslides�with� the�use�of�a�GIS�database.�The�specific�objectives�are�fall�in�to�two�major�categories.�One,� is� to� use� deterministic� slope� stability� model� –�SINMAP�(Stability�Index�MAP)�with�due�consideration�of�intrinsic� triggering� factors� of� slopes� in� the� region.�Secondly,� number� of� extrinsic� triggering� factors� also�creates�instability�of�slopes�which�is�difficult�to�address�in�analytical� modelling.� Therefore,� Weight� Average�Analysis(Factor� overlay� approach)� Method� was� used� to�incorporate�a�number�of�intrinsic�and�extrinsic�factors�for�the� evaluation� of� areas� susceptible� to� landslides.� The�schematic� diagrams� of� the� approach� methodologies� are�given�below�in�Fig�5�and�Fig�6�below.��
�
��
Figure� 5:� Method� 1� :� SINMAP� model� approach� for� the�Landslide�Susceptibility�Assessment�
�
��
Figure�6:�Method�2�:�Weighted�Average�Analysis�(Factor�Overlay�Approach)� model� approach� for� the� Landslide� Susceptibility�Assessment�
�
Evaluation�of�Sensitivity�
Steps�1�
Kalawana�main�watershed�disintegrated�in�to�ten�number�of�sub�watersheds�as�in�the�Fig.�7�according�to�the�pattern�of� stream�hydrology� and� the�morphology.� It� is� assumed�that� each� subdivision� is� showing� uniformity� of�parameters� within� its� own� extent.� � Therefore,� stability�attributes� also� showing� uniformity� within� the� sub�watershed.��
Steps�2�
In�order�to�evaluate�the�sensitivity�of�the�both�approaches�major�watershed�further�expended�and�evaluated�by�two�separate�sub�watersheds�within�the�main�watershed�as�in�the�Fig.�8�and�Fig�9.�
Deterministic�Approach�
SINMAP�
Use�Multi�Calibration�Themes��
Kalawana�Main�Watershed�
Out�put�Results�
Sub�Watershed�NO�05�
Re��Calibration�
Area�calibrated�to�07�sub�watersheds��
Area�calibrated�to�07�sub�watersheds��
Sub�Watershed��NO 8
�Stability�Index�Map�
Input�soil�parameters�re�calibration�with�the�use�of�landuse,�soil�cohesion,�root�cohesion,�angle�of�internal�friction�and�density�of�soil�
If�Satisfactory�Output�
No�
yes�
Landuse�
Weighted�Average�Analysis�
Development�of�Factor�Maps�
Road�Buffer�
Geology�
Overburdened�Geology�(�soil�cohesion�and�root�cohesion)�
Slopes�
Hydrology�1:�Rainfall�
Hydrology�2:�density�of�1�st�order�streams�
Modified�AHP�for�Rating��
Integrating�of�Factor�Maps�
�Landslide�Susceptibility�Map�
Evaluation�&�Calibration�of�Susceptibility�Index�
Statistical�Approach�
75
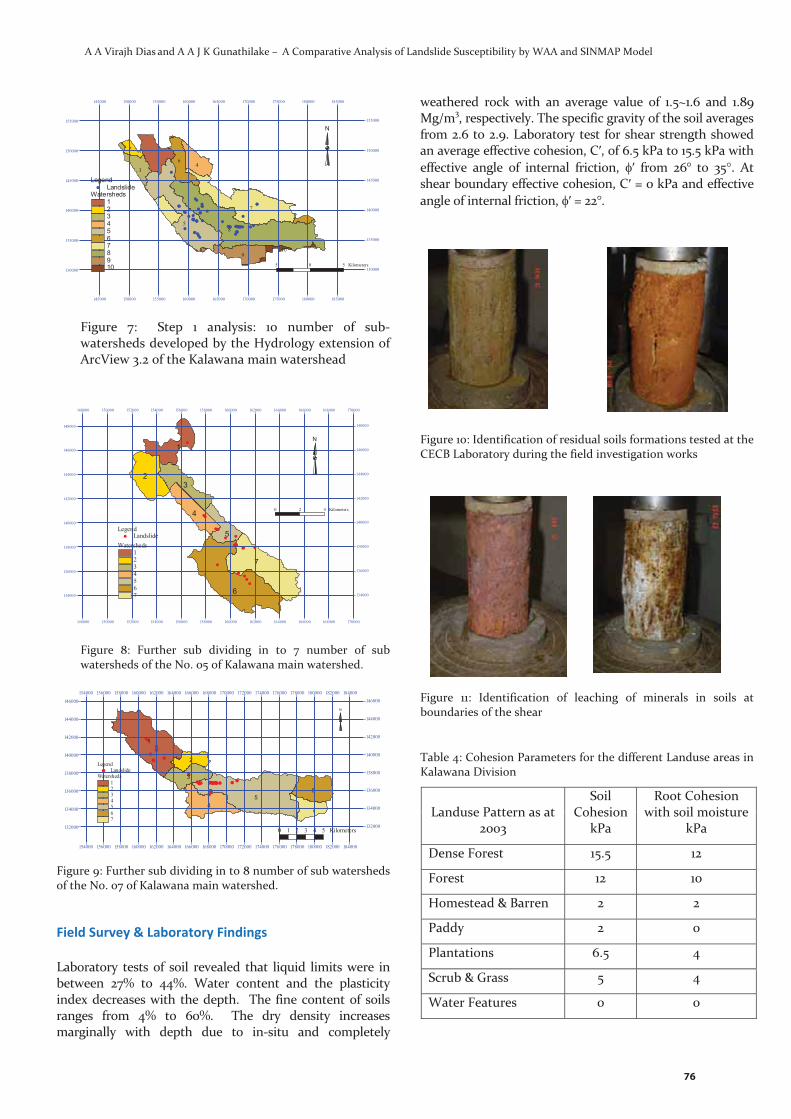
A�A�Virajh�Dias�and�A�A�J�K�Gunathilake�–�A�Comparative�Analysis�of�Landslide�Susceptibility�by�WAA�and�SINMAP�Model�
#####
#
##
#
##########
####
##
###
#
#####
##
#
#
#
## #
#
#######
##
##
# ####85
7
1
9
64
3
2
10
145000
145000
150000
150000
155000
155000
160000
160000
165000
165000
170000
170000
175000
175000
180000
180000
185000
185000
130000 130000
135000 135000
140000 140000
145000 145000
150000 150000
155000 155000
N
5 0 5 Kilometers
Watersheds12345678910
Legend# Landslide
�Figure� 7:� � Step� 1� analysis:� 10� number� of� sub�watersheds�developed�by�the�Hydrology�extension�of��ArcView�3.2�of�the�Kalawana�main�watershead�
�
#
#
##
##
#
## #
#
##### #
#
##
##
6
7
2
1
3
4
5
148000
148000
150000
150000
152000
152000
154000
154000
156000
156000
158000
158000
160000
160000
162000
162000
164000
164000
166000
166000
168000
168000
170000
170000
134000 134000
136000 136000
138000 138000
140000 140000
142000 142000
144000 144000
146000 146000
148000 148000
Watersheds1234567
Legend# Landslide
N
0 2 4 Kilometers
�Figure� 8:� Further� sub� dividing� in� to� 7� number� of� sub�watersheds�of�the�No.�05�of�Kalawana�main�watershed.���
#####
##########
#
#
###
##
###
##
#
# # ####
5
1
4
6
3
7
2
154000
154000
156000
156000
158000
158000
160000
160000
162000
162000
164000
164000
166000
166000
168000
168000
170000
170000
172000
172000
174000
174000
176000
176000
178000
178000
180000
180000
182000
182000
184000
184000
132000 132000
134000 134000
136000 136000
138000 138000
140000 140000
142000 142000
144000 144000
146000 146000
Watersheds1234567
Legend# Landslide
N
0 1 2 3 4 5 Kilometers
�Figure�9:�Further�sub�dividing�in�to�8�number�of�sub�watersheds�of�the�No.�07�of�Kalawana�main�watershed.���
�
Field�Survey�&�Laboratory�Findings��Laboratory� tests�of� soil� revealed� that� liquid� limits�were� in�between� 27%� to� 44%.� Water� content� and� the� plasticity�index�decreases�with� the�depth.� �The� fine�content�of� soils�ranges� from� 4%� to� 60%.� � The� dry� density� increases�marginally� with� depth� due� to� in�situ� and� completely�
weathered� rock� with� an� average� value� of� 1.5~1.6� and� 1.89�Mg/m3,�respectively.�The�specific�gravity�of�the�soil�averages�from�2.6�to�2.9.�Laboratory�test� for�shear�strength�showed�an�average�effective�cohesion,�C�,�of�6.5�kPa�to�15.5�kPa�with�effective� angle� of� internal� friction,� ��� from� 26°� to� 35..� At�shear�boundary�effective�cohesion,�C��=�0�kPa�and�effective�angle�of�internal�friction,����=�22°.��
�
�
Figure�10:�Identification�of�residual�soils�formations�tested�at�the�CECB�Laboratory�during�the�field�investigation�works��
�
Figure� 11:� Identification� of� leaching� of� minerals� in� soils� at�boundaries�of�the�shear��
�
Table�4:�Cohesion�Parameters�for�the�different�Landuse�areas�in�Kalawana�Division�
Landuse�Pattern�as�at�2003�
Soil�Cohesion�
kPa�
Root�Cohesion�with�soil�moisture�
kPa�
Dense�Forest� 15.5� 12�
Forest� 12� 10�
Homestead�&�Barren� 2� 2�
Paddy� 2� 0�
Plantations� 6.5� 4�
Scrub�&�Grass� 5� 4�
Water�Features� 0� 0�
76

Proceedings�of�the�IPL�Symposium,�UNESCO,�Paris,�2012
Table� 5:� Laboratory� measured� value� of� K� (or� k)� saturated�hydraulic� conductivity� (Using� Hezen� formula)� for� various�residual�residual�soils�
�Type�of�Residual�
formations�
�Category��
Saturated�Hydraulic��Conductivity,�K�(103�m/yr)�
Clay� Type�5� <0.0001�
Silt,�clayey� Type�3� 0.1���0.4�Silt,�slightly�sandy�clay�
Type�2� 0.5�
Silt,�moderately�sandy�
Type�2� 0.8���0.9�
Silt,�very�sandy� Type�4� 1.0��1.3�Sandy�silt� Type�1� 1.3�Silty�sand� Type�1� 1.4�
�
Table�6�:�Recommended�Effective�Shear�strength�Parameters�for�the�evaluation�of�landslide�Susceptibility�using�SINMAP�
�
Soil�Type�
�
Moist�Unit�
Weight�
�
kN/m3�
�
Saturated�
Unit�
Weight�
kN/m3�
�
Cohesion�
Intercept�
�
kPa�
�
Angle�of�
Internal�
Friction�
Deg.�
Type�1��SM� 16.5� 18.5� 5.0� 34.0�
Type�2�SM� 18.5� 20.0� 6.5� 26.0�
Type�3�SM� 18.5� 20.0� 0.0� 21.0�
Type�4�SM� 16.5� 18.5� 15.5� 29.2�
Type�5�SM�/�CL�
18.5� 20.0� 6.5� 26.0�
�
Results�&�Discussion�
�WAA�(Weighted�Average�Analysis)��The� state–of–nature� attribute� maps� are� well� defined�under� the� weighted� average� technique� which� explores�sensitivity� of� the� geomorphological� input� parameters�such� as� road� buffer,� rainfall� zones,� stream� order� and�overburden�geology�for�the�overall�assessment.�From�the�resulting� weights� in� the� Table� 7,� the� most� important�influential� types� of� factor� maps� related� with� landslide�were� recognized.� Based� on� the� weights� assignment�landslide� susceptibility� were� categories� as� no�susceptibility� to� very�high� susceptibility.� The� final�weights�of�the�resulting�map�ranged�from�0.036�to�0.585�or� 1.� The� hazard� map� was� grouped� into� five� simplified�categories� based� on� the� histogram� of� the� final� weight�map�and�sensitivity�is�shown�in�the�Table�8.��
Table�7:�Landslide�Susceptibility�Reclassified�Result���Std�deviation�1/2�,�reduced�to�5���classes�
Class� Class�Lable� �Classification� Count�
1� 0.036�0.146� No�Susceptibility� 1461669.0000�
2� 1.146�0.256� Low�Susceptibility� 719978.0000�
3� 0.256�0.365�Moderately�Susceptibility� 861153.0000�
4� 0.365�0.475� High�Susceptibility� 615242.0000�
5�0.475�0.585�and�over�
Very�High�Susceptibility� 122367.0000�
�� �� total� 3780409�
��
Table�8:��No�of�old�landslides�recorded�in�the�overall�analysis�
SESCEPTIBILITY� NO�OF�LANDSLIDES�
No�Susceptibility� 4�
Low�Susceptibility� 2�
Moderately�Susceptibility� 12�
High�Susceptibility� 6�
Very�High�Susceptibility� 15�
Total� 39�
�
With�regard�to�this�analysis�the�Kalawana�watershed�has�been�divided�to�five�susceptibility�classes:���1��0��M��0.146�� � No�Susceptibility��
2�0.146�<�M�0.256�� Low�Susceptibility�
3��0.256�<�M�0.365�� Moderately�Susceptibility�4��0.365�<�M�0.475�� High�Susceptibility��
5��o.475�<�M�1� � Very� High� Susceptibility��
SINMAP�
The� analysis� fairly�well� defines� the� areas� that� intuitively�appear� to�be�susceptible� to� landslides.� It�was�noted� that�few�landslides�occurred�on�slope�that�would�not�normally�be� recognized� as� susceptible� to� landslides.� This� means�that�methodology�misled�classifying�several�of�these�sites�as� being� landslide�prone� due� to� the� site�specific�conditions�and�inaccurate�input�parameters.�The�wetness�index� is� indicated� more� inaccuracy� during� preliminary�modelling� of� the� area� and� therefore,� re�calibration� was�made� by� further� subdividing� of� landslide� proven�watershed� areas� of� the� main� Kalawana� watershed.� The�output� results�were� shown� in� the�Table� 9� and� 10� before�and� after� recalibration.�The� overall� results� are� shown� in�the�Table�11.�
77

A�A�Virajh�Dias�and�A�A�J�K�Gunathilake�–�A�Comparative�Analysis�of�Landslide�Susceptibility�by�WAA�and�SINMAP�Model�
�
Table�9:�Comparisons�of�SINMAP�results�of�the�model�after�re��calibration�of�the�watershed�number�5�of�the�main�watershed�(Kalawana�Division)�
Stability�Index�(SI)�and��
Class�of�stability�against�landslides�
occurrence�
Results�of�SI�of�the�sub�watershed�number�05�of� Kalawana� main� watershed� before� re�calibration�of�results�
Results� of� the� SI� after� re�calibration� of�watershed� number� 05� in� to� further� 07� sub�watersheds�
%�Area�fall�in�the�stability�
class�
No.�of�Landslides�fall�in�the�category�
�
Density�of�Landslides�
�LS/km2�
%�Area�fall�in�the�stability�
class�
No.�of�Landslides�fall�in�the�category�
�
Density�of�Landslides�
�LS/km2�
Stable� 50.1%� 4� 0.2%� 45.6%� 4� 0.1%�Moderately�Stable� 7.9%� 1� 0.5%� 6.4%� 0� 0.0%�
Quasi�stable� 12.6%� 7� 0.2%� 10.4%� 2� 0.3%�Lower�Threshold� 28.1%� 3� 0.2%� 35.0%� 8� 0.4%�Upper�Threshold� 1.3%� 1� 1.4%� 2.8%� 2� 1.3%�
Total�� � 16� 0.2%� � 16� 0.2%�
Table�10:�Comparisons�of�SINMAP�results�of�the�model�after�re��calibration�of�the�watershed�number�08�of�the�main�watershed�(Kalawana�Division)�
Stability�Index�(SI)�and��
Class�of�stability�against�landslides�
occurrence�
Results�of�the�SI�of�sub�watershed�number�08�of� Kalawana� main� watershed� before� re�calibration�of�results�
Results� of� the� SI� after� re�calibration� of�watershed� number� 08� in� to� further� 07� sub�watersheds�
%�Area�fall�in�the�stability�
class�
No.�of�Landslides�fall�in�the�category�
�
Density�of�Landslides�
�LS/km2�
%�Area�fall�in�the�stability�
class�
No.�of�Landslides�fall�in�the�category�
�
Density�of�Landslides�
�LS/km2�
Stable� 45.6%� 3� 0.1%� 40.1%� 2� 0.04%�Moderately�Stable� 9.1%� 2� 0.2%� 7.4%� 0� 0.0%�
Quasi�stable� 12.9%� 1� 0.1%� 11.2%� 5� 0.4%�Lower�Threshold� 29.1%� 16� 0.5%� 35.4%� 12� 0.3%�Upper�Threshold� 3.1%� 0� 0.0%� 5.0%� 3� 0.5%�
Total�� � 22� 0.2%� � 22� 0.2%��
�
Table�11:�Overall�Results�of�the�Landslide�Susceptibility�Analysis�of�the�Kalawana�Division�
RESULTS��WAA� –� Use� of� Weighted� Average�Analysis� method� of� assessment�model�SINMAP�� Use� of� terrain� stability�model� of� Stability� Index� Mapping�(SINMAP)�
%�Area�fall�in�the�equivalent�stability�class�according�to�the�susceptibility�criteria�
Sub�watershed�number�05�of�main�
watershed�
Sub�Watershed�number�08�of�main�
watershed�
�Overall�results�of�the�
Kalawana�Main�Watershed��
WAA� SINMAP� WAA� SINMAP� WAA� SINMAP�
No�Susceptibility� 46.45� 45.6� 22.07� 40.1� 38.67� 52.49�
Low�Susceptibility� 8.09� 6.4� 25.53� 7.4� 18.99� 8.90�
Moderately�Susceptibility� 26.29� 10.4� 25.44� 11.2� 22.80� 12.11�High�Susceptibility� 15.78� 35.0� 21.04� 35.4� 16.30� 24.11�Very�High�Susceptibility��
3.39��
2.8��
5.91��
5.0��
3.24��
2.19��
78

Proceedings�of�the�IPL�Symposium,�UNESCO,�Paris,�2012
��
Figure�12:��Overall�Evaluation�of�Results�of�the�Landslide�Susceptability�Analysis�of�the�Kalawana�Division,�Ratnapura�District,�Sri�Lanka�
��
Conclusion�and�Recommendations�
The�above�finding� indicates�the�variability�of�conceptual�models� and� their� relative� importance� with� the� input�databases.�The�detailed�and�comprehensive�geographical�information� databases� are� required� to� obtain� the�statistical� interpretation� and� calibration� of� the� model.�Similarly,� soil� saturation� conditions� and� the� validity� of�wetness� indices� within� a� watershed� also� create� another�avenue� to�calibrate� the�analytical�model�with� the� inputs�of�other�soil�parameters.���
Space� technology� using� satellite� and� aerial�remote� sensing� plays� a� very� important� role� in� terrain�mapping� and� scientific� assessment� of� the� ground�conditions.� This� technology� is� ideally� suitable� for�inaccessible�mountainous� regions�where�majority� of� old�landslides� were� identified.� By� using� multi�temporal�satellite� data� the� areas� of� landslide� every� year� can� be�compared�with�other�prediction�variables�such�as�altitude,�slope,�nearness�to�settlements,�road�access�and�grave�sites,�and�the�areas�most�susceptible�to�landslide�in�a�particular�year� can� be� flagged� for� extra� precautionary�measures� to�be�taken.�One�of�the�critical�observations�of�the�study�is�a�lack� of� complete� data� base� of� recent� occurrences� of� old�landslides� on� May,� 2003.� Only� 39� landslides� were� used�out� of� 78� case� records� at� Kalawana� to� calibrate�models�due� to� inaccessibility� at� field.�Therefore,�multi�temporal�satellite� data� may� be� only� solution� to� overcome� such�
problems�and�acquire�more�geographical�information.�In�landslide� study� high� spatial� resolution� satellite� photo�images� are� recommended.� The� satellite� imagery� data�allowed� generation� of� high�resolution� Digital� Elevation�Models� (DEM).� The� derived� relief� parameters� can� be�analyzed� in� a� GIS� together� with� other� information�obtained� from� remote� sensing� data,� thematic�maps� and�field� observation� for� a� spatially� differentiated� terrain�properties� as� a� basis� for� further� assessment� of� landslide�hazard.��
The� further� study� should� not� be� restricted� to�ALOS,�LANDSAT�TM�and�IKONOS�data,�but�there�would�appear� to� be� great� potential� in� using� this� and� other�remotely� sensed� data,� such� as� airborne� radiometrics�(Cranfield,� 2003,� pers.� comm.)� to� map� specific� ground�conditions� including� the� identification� of� areas� of�alteration� and� deep� weathering� that� may� be� additional�predisposing� factors� for� landslides.� In� the� longer�term,�such� work� will� serve� to� inform� relevant� sectors� of� local�government�of� the� potential� risks� associated�with�major�land�development�projects.�
�Acknowledgments�
This� paper� forms� an� integral� part� of� the� research� on�“Evaluation� of� Sensitivity� of� the�Combined�Hydrological�Model� for� Landslide� Susceptibility� Risk� Mapping� in� Sri�Lanka”�being�implemented�by�the�Centre�for�Research�&�Development,� Central� Engineering� Consultancy� Bureau�
79

A�A�Virajh�Dias�and�A�A�J�K�Gunathilake�–�A�Comparative�Analysis�of�Landslide�Susceptibility�by�WAA�and�SINMAP�Model�
(CECB)�of�the�Ministry�of�Irrigation�and�Water�Resources�Management.� Author� would� like� to� acknowledge� the�financial� and� technical� support� provided� by� the� Japan�Aerospace� Exploration� Agency� (JAXA)� and� the� Dr.� L�Samarakoon,� Director,� Geo� Informatics� Center� (GIC)� of�the�Asian�Institute�of�Technology�(AIT)�in�executing�this�study� and� extensive� support� provided� in� collecting�necessary� data� by� the� Survey� Department� of� Sri� Lanka.�Also� it� is� a�part�of� the� research� leading� to�MPhill�which�has� been� registered� at� the� Post� Graduate� Institute� of�Science,� University� of� Peradeniya,� Sri� Lanka.� It� is� being�published�with�their�permissions.�The�views�expressed�in�the� paper� are� however� those� of� the� authors� only.� � Our�grateful�thanks�are�due�to�Eng.�N�Rupasinghe��Chairman�Central� Engineering� Consultancy� Bureau� for� the�permission�and�encouragements.����References��Bhandari,� R� K� &� Dias,� A� A� V.,� 1996.� Rain� Triggered� Slope�
Movement� as� Indicators� of� Landslide� Dynamics� ,� Proc.� 7th�International� Symposium� on� Landslides;.� 17�21� June� 1996,�Trondheim,�Norway�:�Balkema.�
Bhandari,� � R.K.,� Jeyatharan,� K.,� Raviskanthan,A�;� Dynamics� of�Rockfalls� in�Sri�Lanka�and�Landslide�Hazards�;�Proceeding�of� the� International� Conference� on� Case� Histories� in�Geotechnical�Engineering,�St�Louis�,��1992�;�
Cooray,� 1994�:� Geological� Factors� affecting� landslides� in� sri�Lanka�;� Proc.� National� Symposium� of� Landslides� in� Sri�Lanka,�Colombo�17�19th�March,�1994�
Chowdhury,�R� and�Flentje,�P� (1998);�A�Landslide�Database� for�Landslide� Hazard� Assessment,� Proceedings� Second�International� Conference� on� Environmental� Management�(ICEM2),� February� 10�13th� 1998,� Wollongong,� Australia,�Elsevier(Oxford)�Vol.�2,�1229�1237�
Chowdhury,� R.N.,� 1988.� Special� lecture:� Analysis� methods� of�assessing� landslide� risk� �� recent� developments.� In:� C.�Bonnard� (Editor),� Proceedings� of� the� 5th� International�Symposium�on�Landslides,�Rotterdam,�Pages�515�524.�
Dietrich,� W.E.,� Bellugi,� D.,� and� Real� de� Asua,� R.,� 2001.�Validation� of� the� shallow� landslide� model,� SHALSTAB,� for�forest� management.� In:� Wigmosta,� M.S.,� and� Burges,� S.J.,�(eds),� American� Geophysical� Union,� Water� Science� and�Applications,�v.�2,�Pages�195–227.�
Dias,� A� A� V�;� Stability� Attribute� on� Discrete� Boundary� Shear�Strength� of� an� Earthslide�Lessons� from� the� Watawala�Earthslide,� Sri� Lanka;� 3rd� Young� Geotechnical� Engineer�Conference� on� Geotechnical� Engineers� in� Asia;� 2000� and�Beyond,�Singapore,�14�16�May�1997,�Vol�1,pp�627�638.�
Dias,� ,A� A� V,� Goonasekara,� U� &� Rupasinghe,� N.,2001.� Natural�Slope� Instability� Measures� of� Roads� in� Hill� Country,� Sri�Lanka� ,� Proc.� 8th� World� Emergency� Management�Conference,�Oslo,�Norway�from�19�21�June,�2001.TIEMS.�
Dias,�A.A.V,�Jayasumana,�D.T.N�&�Fonseka,�H.J.S��“Application�of�Remotesensing�&�GIS�Technology�for�Landslide�Susceptibility�Analysis;�JAXA�Mini�Project,�2005/2006�
Dietrich,� W.E.,� Wilson,� C.J.,� Montgomery,� D.R.,� McKean,� J.,�Bauer,� R.,� 1992.� Erosion� thresholds� and� land� surface�morphology.�Geology�20,�675–679.�
Dietrich,�W.E.,�Wilson,�C.J.,�Montgomery,�D.R.,�McKean,�J.,�1993.�Analysis� of� erosion� thresholds,� channel� networks� and�landscape�morphology�using�a�digital�terrain�model.�Journal�of�Geology�101,�161–180.�
Dietrich,� W.E.,� Reiss,� R.,� Hsu,M.,� Montgomery,� D.R.,� 1995.� A�process� based� model� for� colluvial� soil� depth� and� shallow�landsliding� using� digital� elevation� data.� Hydrological�Processes�9,�383–400.�
Flentje,� P.� and� Chowdhury,� R.� 1999.;Quantitative� Landslide�Hazard� Assessment� in� an� Urban� Area.� Proceedings� of� the�Eighth�Australia�New�Zealand�Conference�on�Geomechanics.�February�15���17,�Hobart,�Tasmania.�Institution�of�Engineers,�Australia.�
Fookes� PG� (1997)� The� first� Glossop� lecture,� geology� for�engineers:�the�geological�model,�prediction�and�performance.�Q�J�Eng�Geol�30:293–424�.�
Fookes� PG,� Baynes� FJ,� Hutchinson� JN� (2000)� Total� geological�history:� a�model� approach� to� the� anticipation,� observation�and�understanding�of�site�conditions,�invited�Paper,�Geoeng�2000� Conference.� Technomic� Publishing,� Melbourne,� pp�370–460.�
Hutchinson,� J.N,� 1988.� Morphological� and� geotechnical�parameters� of� landslides� in� relation� to� geology� and�hydrology.�Proc.�5th�Int.�Symp.�on�Landslides,�Lausanne,�pp.�3–36.�
Hammond,�C.,�Hall,�D.,�Miller,� S.� and�Swetik,�P.,� 1992,�Level� I�stability� analysis� (LISA)� Documentation� for� Version� 2,�General� Technical� Report� INT�285,� USDA� Forest� Service�Intermountain�Research�Station,�121p.�
Lane,�E.F.�&�Verdini,�W.A.��"A�Consistency�Test�for�AHP�Decision�Makers,"�Decision�Sciences�20�(3)�[1989]�575�590.�
Montgomery,�D.R.�and�Dietrich,�W.E.,�1994,�A�physically�based�model�for�topographic�control�on�shallow�landsliding,�Water�Resources�Research,�v.�30,�n.�4,�p.�1153�1171.�
Murphy,�C.K.� � Limits�on� the�analytic�hierarchy�process� from� its�consistency�index,�European�Journal�of�Operational�Research,�65:1�[1993]�138�139.�
Pack,� R.T.,� Tarboton,� D.G.,� Goodwin,� C.N.,� 1999,� GIS�based�landslide�susceptibility��mapping�with�SINMAP,�Proceedings�of� the� 34th� Symposium� on� Engineering� Geology� and�Geotechnical�Engineering,�Bay,�J.A.�(editor),�34,�p.219�231.��
Pack,� R.T.,� Tarboton,� D.G.,� 2004.� Stability� index� mapping�(SINMAP)�applied�to�the�prediction�of�shallow�translational�landsliding.�Geophysical�Research�Abstracts�6,�05122.�
Pack,�R.T.,�Tarboton,�D.G.,�Goodwin,�C.N.,� 1998.�The�SINMAP�approach� to� terrain� stability� mapping.� In:� Moore,� D.P.,�Hungr,�O.�(Eds.),�8th�Congress�of�IAEG,�vol.�2.�Balkema,�The�Netherlands,�pp.�1157–1165.�
Pack,� R.T.,� Tarboton,� D.G.,� Goodwin,� G.N.,� 2001.� Assessing�terrain� stability� in� a� GIS� using� SINMAP.� 15th� GIS� Conf.,�Vancouver.�
Tissera,�C�H�D,�1994.History�of�Landslides�in�Sri�Lanka�and�the�National� Initiatives� Towards� their� Effective� Management,�Proc.� National� Symposium� of� Landslides� in� Sri� lanka,�Colombo�17�19th�March,�1994�
Van�Westen,�C.J.� ,1993.�Application�of�Geographic� Information�Systems� to� Landslide� Hazard� Zonation.� Ph�D� Dissertation�Technical�University�Delft.� ITCPublication�Number� 15,� ITC,�Enschede,�The�Netherlands,�245�Pages�
Van�Westen�C.J.�2000.�The�modeling�of�landslide�hazards�using�GIS,�Surveys� in�Geophysics,�Volume�21,� Issue�2�3,�Pages�241�255.�
Vitanage� ,� 1994�;� Seismicity�� Neglected� Spects� of� Sri� lankan�landslide� studies�;�Proc.�National�Symposium�of�Landslides�in�Sri�Lanka,�Colombo�17�19th�March,�1994�
Varnes,� D.J.� 1984.� Landslide� Hazard� Zonation:� A� Review� of�Principles�and�Practice.�Paris:�United�Nations�International.�
�
80

��
�������Proceedings�of�the�IPL�Symposium,�UNESCO,�Paris,�2012�
�
Experimental�researches�on�technical�state,�design�and�operation�of�reinforced� concrete� anti�landslide� structures� for� seismic� dangerous�of�UKRAINE�
Olexander�Trofimchuk(1),�Iurii�Kaliukh(1),�Taras�Kaliukh(2)�1)Research�Institute�of�Telecommunication�and�Global�Information�Space�NAS,�Ukraine�2)Scientific�Research�Institute�of�Oil�and�Gas�Industry�of�National�Joint�Stock�Company�“Naftogaz�of�Ukraine”,�Kyiv,�Ukraine��
�
Abstract� Intensification� of� seismic� activity� in� Vranch�zone�and�Black�Sea�region�and�on�our�planet�also� led�to�increasing� of� seismic� danger� level� and,� as� result,� to�increasing� of� relevant� landslide� provoking� factor.�Considerable� landslide� and� landslide� danger�intensification�has�been�a�result�of�these�events�in�seismic�dangerous� regions� of� Ukraine� (Chernivtsi,� Odessa� and�Crimea�Autonomy�Republic).�������Experimental� and� analytic� researches� on� technical�state�of�reinforced�concrete�(RC)�anti�landslide�structures�were�carried�out�by�non�destructive�methods.�Analysis�of�that� state� change� under� influence� of� constant� seismic�loads� in� seismic�dangerous� regions�of�Ukraine� is� carried�out� too.� The� results� of� visual� and� instrumental� surveys�are�presented�in�paper.��
�Keywords:�Anti�landslide�structure,�reinforced�concrete,�seismic�action,�water�draining�gallery���Introduction�
More�than�23�thousands�of�landslides�have�place�today�in�Ukraine.� They� are� distributed� irregular� on� it� territory.�More� then� 9%� of� Chernivtsi� region� is� affected� by�landslides.� That� region� is� situated� on� joint� of� East�European� platform� edge� and� Carpathians� geosynclinal�area.�Bukovina� territory� is� affected� to� tectonic�processes�and� it� seismicity� is� testifying� that� fact.� Local� seismic�station� records� 110…130� seismic� events� early�approximately;�70�80%�from�them�are�in�radius�less�then�100� km� with� intensity� 2…4� points.� The� vertical�displacements�of�Earth's�crust�in�Chernivtsi�area�reach�up�to�4�mm/year�according�to�data�of�Ukrainian�Geophysical�Institute.��
Chernivtsi�region�belongs�also�to�area�with�intensive�pouring�rain�action.�Note:�more�then�100�mm�of�water�per�some�hours�(sometime�222�mm�per�some�hours)�can�fall�during� some� rains� in� Chernivtsi.� Therefore� the� drain�galleries� are� the� effective� anti�landslide� structures� on�Chernivtsi�territory.����������Many� scientists� from� all� over� the� world� were�engaged�in�the�researches�and�designing�of�anti�landslide�
structures,�monitoring� and� analysis� of�RC� and�buildings�stress�strain� state� under� influence� of� extreme� loads�(seismic� factors,� pouring� rains,� vibration� etc.)� [1�6].� For�example,�the�issues�of�environmental�influence�to�viaduct�state� are� considered� in� paper� [2]� and� the� issues� of�designing� of� the� protection� systems� against� extreme�events� are� analyses� in� report� [3].� In� the� scientific�works�[4�6]� the� authors� pay� attention� to� the� peculiarities� of�stress�strain�state�of�the�RC�structures�under�influence�of�sign�changing�seismic�and�dynamic�loads.��
��
2� Visual�and�instrumental�surveys�of�water�drain�gallery�in�Chernivtsi�
Two�level�water�conducting�gallery�(see�fig.�1)�for�drain�of�landslide�slope�in�Chernivtsi�(fig.�2)�is�constructed�as�2,5�m�concrete�tunnel�with�length�1363.68�m.�������Gallery� was� constructed� beginning� from� 1975� and� it�was� erected� in� 1978.� It� depth� is� 25� …� 35� m.� Sixty�dewatering�wells�and�alone�ventilation�shaft�are�provided�into�water�conducting�gallery.�These�wells�have�diameter�120�…�260�mm�and�they�are�salted�up�practically�all.���������Research� task� –� selective� determination� of� the�concrete� compressive� strength� and� parameters� of� work�reinforcing�for�RC�framework�ring�and�water�conducting�gallery�portals�between�streets�in�Chernivtsi.���������Methods� and� test� means� –� Concrete� strength�determination� was� carried� out� by� ultrasonic� methods�according� to� Ukrainian� normative� document� DSTU� B�.2.7�226:2009� «Concretes.� Ultrasonic� method� for�strength� determination».� The� parameters� of� work�reinforcing�for�RC�were�determined�by�magnetic�method�according�to�Ukrainian�normative�document�DSTU�B�V.2.�6�4�95�«Magnetic�method� for�determination�of� concrete�protective�layer�thickness�and�reinforcement��
81

Olexander�Trofimchuk��et�al.��
arrangement».�Ultrasonic� tests� for�concrete�were�carried�out� by� certified� device� U��14PM� together� with� device�UPP� for� surface� sounding� with� measurement� base� 120�mm.��������Essence� of� ultrasonic� method� is� in� correlation�dependence�between�concrete�compression�strength�and�velocity� (time)� for� propagation� of� ultrasonic� wave� into�concrete.�Concrete� strength� is� determining� according� to�forehand� prescribed� calibration� dependence� between�these�parameters.��Measurements�of�ultrasonic�wave�into�tunnel�structural�RC�elements�was�carried�out�by�method�of� surface� sounding.� Transition� from� velocity� of� surface�sounding� to� velocity� of� through� sounding� was�implemented� taking� into� account� the� transition�coefficient����(���=�1,74�for�applied�device).��������Gallery�consists� from�two�parts�disposed� in�different�levels:�upper�gallery�with�length�~1060�m�and�exit�to�the�first�street�lower�gallery�with�length�~�260�m�and�exit�to�the�other�street.�Both�galleries�are�connected�by�vertical�well� with� height� ~� 12� m.� Gallery� framework� has� annual�contour�and�made�from�precast�reinforced�concrete�rings.�Every� ring� is�produced� from� four� tubings� elements�with�ribbed� internal� surface.� Gallery� exits� are� formed� as�monolithic�RC�portals�(they�are�filled�with�pebble)�acting�as�retaining�walls.��
�����The� gallery� framework� concrete� strength� tests� were�carried� out� on� the� sections� of� side� and� upper� tubings�without�visible�defects�(lower�tubing�is�covered�by�water�and� slime).� Every� tenth� framework� ring� was� inspected�(beginning� from� the� first� entry� up� to� 330�th� ring)� and�then�was�inspected�every�30�th�ring�(due�to�similarity�of�device� reading,� i.e.� concrete�homogeneity).� �The� tests�of�portal�concrete�were�carried�out�on�defect�free�sections�of�structure� external� surface� on�height� from�0,5�m� to� 2�m.�Six�measurements�were�carried�out�on�every�section.�The�tests� of� the� second� portal� were� impossible� because� of�destruction�of�surface�concrete�layer.��������Calibration� dependency� “time� –� strength”� prescribed�for� applied� device� according� to� statistic� data� on� the�results�of�comparative�ultrasonic�and�mechanical�tests�for�concrete� B� 15…B35� grade� specimen� was� used� for�determination� of� concrete� strength� in� the� test� places.�Continuous� numbering� for� rings� is� done� from� the� first�entrance�into�gallery�for�upper�and�lower�levels�separately.���������Statistic�processing�of�the�test�results�was�carried�out�for� determination� of� the� relevant� concrete� grade� on�strength.� For� that� purpose� the� average� values� of�compression�strength�f�m(n)v�were�calculated�separately�on� the� values� of� concrete� strength� in� the� tested� rings�
Fig. 1
82

Proceedings�of�the�IPL�Symposium,�UNESCO,�Paris,�2012
from� upper� and� lower� gallery� parts� and� monolithic� RC�
portal.������Results� of� the�measurement� and� concrete� strength� in�the�test�places�are�presented�in�tables�1�and�2.������Transverse�cracks�in�the�central�part�of�tubings�of�rings� �110,� 720,� 1110� (it� is� 5%� from�all� inspected� tubings� in�upper�gallery�level,�see�fig.�3,�fig�4)�were�detected�during�ultrasonic� sounding� of� RC� framework� of� the� upper� and�lower�gallery�levels.�Concrete�strength�in�these�tubings�is�not� worse� then� in� other� inspected� tubings.� So� we� can�suppose,�a�same�percent�of�the�upper�tubings�with�cracks�would� be� presented� into� non�inspected� gallery� rings.�Crack� into� portal� concrete� above� the� first� entrance� into�gallery�was�detected�too.��Table�1�Average�results�of�concrete�strength�assessment����
�
��������������������
Fig. 2
83

Olexander�Trofimchuk��et�al.��
�
��
�
��
Table 1Average results of concrete strength assessment
Disposition of structures Average strength, f m(n)v , MPa
Relevant concrete grade corresponding
to compression strength
Upper gallery part (the first exit) 40,8(415) �30 Lower gallery part (the second exit) 42,3 (431) �30 Portal (retaining wall) of the first exit 33,0 (337) �25
Table 2 Results of concrete strength assessment along water-conducting gallery
Tunnel beginning Ring � 1 10 20 30 40 50 60
Concrete strength in side rings, MPa 36,7 35,9 36,9 38,2 39,7 38,0 38,7 Concrete grade of side rings �25�25 �25 �25 �25 �25 �25
Concrete average strength (MPa) and concrete grade of side rings 37,7 (�25)
Ring � 1 10 20 30 40 50 60 Concrete strength in upper rings, MPa 35,4 36,7 35,8 35,7 35,6 37,6 36,9
Concrete grade of upper rings �25 �25 �25 �25 �25 �25 �25 Concrete average strength (MPa) and concrete
grade of upper rings 36,2 (�25)
Tunnel middleRing � 90 330 510 720 930 1140 1350
Concrete strength in side rings, MPa 41,7 41,4 41,5 41,3 42,1 40,5 41,1 Concrete grade of side rings �30 �30 �30 �30 �30 �30 �30
Concrete average strength (MPa) and concrete grade of side rings 41,4 (�30)
� ���� 80 290 510 720 930 1140 1350 Concrete strength in upper rings, MPa 40,5 42,1 39,5 41,4 40,8 39,2 40,2
Concrete grade of upper rings �30 �30 �30 �30 �30 �30 �30 Concrete average strength (MPa) and concrete
grade of upper rings 40,5 (�30)
Tunnel end (lower level) Ring � 1 15 45 75 105 135 165
Concrete strength in side rings, MPa 42,0 41,3 43,8 42,2 44,5 43,1 41,0Concrete grade of side rings �30 �30 �30 �30 �30 �30 �30
Concrete average strength (MPa) and concrete grade of side rings 42,6 (�30)
Ring � 1 15 45 75 105 135 165
Concrete strength in upper rings, MPa 42,2 44,2 41,7 42,2 42,1 43,8 43,9Concrete grade of upper rings �30 �30 �30 �30 �30 �30 �30
Concrete average strength (MPa) and concrete grade of upper rings 42,9 (�30)
84

Proceedings�of�the�IPL�Symposium,�UNESCO,�Paris,�2012
�
�
�
�
Fig. 3
Fig. 4 Iurii Kaliukh &C0
85

��
�������Proceedings�of�the�IPL�Symposium,�UNESCO,�Paris,�2012�
Technical� Cooperation� Project� to� Develop� Landslide� Risk� Assessment�Technology�along�Transport�Arteries�in�Vietnam�
Dinh�Van�Tien(1)�1)�Institute�of�Transport�Science�and�Technology,�Hanoi,�Vietnam��
�
Abstract:� Like� other� South�East� Asia� countries,�Vietnam� is� the� country� with� mountainous� terrain,�complicated�geological�structure�and�high�rainfall,�and�as�the� result� landslides� occur� regularly� and� seriously� on�mountainous� road� network� in� rainy� season.� Due� to�difficulties� of� economic,� lack� of� the� deep� knowledge�about� the� phenomena,� the� activities� to� prevent� and�mitigate�landslides�are�not�effective.�The�ODA�Project�of�research� cooperation� between� Japanese� and� Vietnamese�researchers�in�the�years�of�2011�to�2012�will�not�only�help�Vietnam� in� education� of� human� resources,� research�equipment� and� development� a� standard� system� on�landslide� investigation,� monitoring,� forecast� and� early�warning� but� also� contribute� to� disaster� prevention� and�reduction� in� the� future� of�Vietnam.� It� can� consider� this�project�as�a� success�of� a�new� landslide� �� training� tool� in�the� cooperation� with� Asia� members� of� International�Consortium� on� Landslides� (ICL),� especially� South�East�Asia�countries.���
�Keywords� Technical� Cooperation,� Landslide,� Risk�Assessment,�Transport,�Vietnam��Landslides� Situation� along� Transport� Arteries� in�Vietnam�
Vietnam� is� located� on� the� Indo�Chinese� Peninsula�belonging�to�the�South�East�Asia,�with�the�population� is�90�million� people.� The� topography� of�Vietnam� is� varied�depending� on� the� natural� areas.� Overall,� Vietnam� is�composed� of� three� geographic� domain� extends� from�North� to� South.� In� which,� the� North� has� mountainous�terrain�concentrated�in�the�Northwest�and�the�Northeast,�plus�the�Red�River�Delta;�the�Central�has�a�strip�of�coastal�plain� and� high�mountains� called� Truong� Son�mountain�range� adjoins� Laos;� and� the� South’s�major� terrain� is� the�Mekong� Delta.� The� average� annual� rainfall� throughout�the�country� is� from�1,200� to�3,000�mm�and�can�reach� to�4.000�4500� mm/year� in� some� particular� areas� in� the�Central.�The�average�sunshine�duration�is�1,500�and�3,000�hours/year� and� the� average� temperature� fluctuate� from�5°C� to� 37°C.� Particularly,� sometimes� the� temperature�drops� to� 0°� C� (at� Sa�Pa)� or� increases� to� 40�45� °� C� (for�instant,�in�Hanoi,�Ha�Tinh,�Quang�Binh).�Vietnam�usually�has�to�deal�with�typhoons�and�floods�every�year,�with�an�average�of�7�to�10�typhoons/�year.�
In� such� natural� conditions,� landslide� is� one� of� the�most� popular� natural� phenomena� occurring� on� road�
network�in�rainy�season�in�Vietnam,�while�it�is�located�in�extreme�climate�areas�where�are�impacted�by�heavy�rain,�high� terrain,� strong� cleavage� and� complex� geological�structure.��
Landslide� is�always�one�of� the�most�dangerous�and�damaged� natural� disaster� for� transport� in� Vietnam.� It�becomes� one� of� natural� disasters� disturb� the� most� for�people� life,� socio�economic� development� in� Vietnam� in�rainy� season.� How� to� do� landslide� mitigation� and�restoration�to�exiting�road�and�also�to�the�new�designed�road�is�the�Question.�In�accordance�with�the�statistics�up�to� 2010� of� Vietnam�Ministry� of� Transport� (MOT),� total�length� of� highways� in� Vietnam� is� about� 17,500� km,� it�takes�about�8%�total�length�of�the�country’s�road�network.�In�which,�3/4�total�length�of�highways�is�in�mountainous�terrain.� The� landslide� regular� areas� concentrate� on� the�routes�of�north�western�mountains�and�of�the�Central�in�Vietnam,� with� a� total� length� of� landslide� regular�highways� over� 3,000� km.�The� annual� average� volume� of�landslides� caused� by� typhoons� on� road� network� is� from�300,000� m3� to� 600,000� m3� depends� on� the� number� of�typhoons�hit�the�land�and�typhoon�intensity.�Particularly,�the� volume� of� landslides� was� over� 1� million� m3/� year�during�the�rainy�season�of�1999�–�2000.�
�As� statistics� of� Institute� of� Transport� Science� and�Technology� of� Vietnam� (ITST)� had� indicated� that� there�were� 400� new� landslides� appeared� in� 2005�2008� along�new�Ho�Chi�Minh�route.�To�prevent�the� landslides,�over�150�km�of�retaining�wall�on�this�road�had�been�built�,�but�till� now,� it� is� seen� that� landslides� have� not� been�controlled� on� this� route.� The� occurrence� of� landslides�affect� to� the� economic� development,� interrupt�continuous� traffic,� threaten� to� property� and� lives� of�people�and�over�head,�We�are�being�passive�to�face�with�this�phenomenon.�
For�more�insight�into�the�phenomenon�of�landslides�in� general� as�well� as� to� control� and�mitigate� the� loss� of�this� natural� phenomenon� to� the� under�operated� traffic�system�as�well�as�the�new�projects�in�a�mountainous�area,�ITST�has�coordinated�with�the�ICL�to�make�a�propose�of�a�technical�cooperation�project�and�has�been�the� Japanese�government� approved� and� supported.� This� project� also�gets� concern� of� scientists� and� professionals� in� Vietnam.�The�name�of�project� is� “Development�of�Landslides�Risk�Assessment� Technology� along� Transport� Arteries� in�Vietnam.� Overall� objective� of� project� is� to� socially�implement� the� developed� landslide� risk� assessment�technology� and� early� warning� system�will� contribute� to�
86

F.�Author,�S.�Author,�T.�Author�–�Running�title�of�contribution�(maximum�70�characters�long)�
the� safety� ensuring� of� transportation� arteries� and�residents�in�mountainous�communities�in�Vietnam.�
�Overview�of�the�Technical�Cooperation�Project�
There�are�two�objectives�of�Project� that�are�desired�including� short�term� and� long�term� objectives.� The�short�term/directly� objective� is� to� develop� the� landslide�risk�assessment�technology�to�reduce�disasters�caused�by�landslides� on� transport� arteries� throughout� the� joint�research� based� on� experimental� technology� from� Japan�and� human� resources� development� to� effectively�technology� implementation� in� Vietnam.� � The� long�term/indirect� objective� of� the� project� is� to� socialize�developed�landslide�risk�assessment�technology�and�early�warning� system� to� not� only� ensures� transport� arteries�operation� but� also� mountainous� resident� areas� in�Vietnam.�
The�technical�cooperation�project�is�planned�for�five�years� from� 2012� to� 2016� with� four� components�corresponding� to� four� working� groups� (WG).� They� are�the�WG1�for�integrated�research,�education,�development�of� human� resources,� announcement� and� information�spread;� WG2� for� wide�area� landslide� mapping� and�identification� of� landslide� risk� area;� WG3� for�development� of� landslide� risk� assessment� technology�based�on�soil�testing�and�computer�simulation;�and�WG4�as�Risk�for�evaluation�and�development�of�early�warning�system�based�on�landslide�monitoring.�
�Development� of� Landslide� Risk� Assessment�Technology�and�Education�
Major�outputs�of� the�project�are� (1)� the�application�guidelines� of� landslide�risk�assessment� technology�developed�by� activities� of�WG2,�WG3� and�WG4;� (2)� the�staffs’� education� and� capacity� enhancement� by� the�project;� (3)� publishing� reports� and� papers� on� landslide�risk�assessment� technology;� and� (4)� spreading�information�and�outputs�of�the�project.�
�The�main�activities�of�WG1�include:�(1)� Preparation� of� integrated� guidelines� for� the�
application� of� developed� landslide�risk�assessment�technology� based� on� the� activities� of� WG2,� WG3� and�WG4;�
(2)� Education� and� human� resources� development�throughout��the�training�courses�of�Master�(for�2�years)�or�Doctor�(for�3�years)�at�Kyoto�University,�Tohoku�Gakuin�University,� University� of� Shimane� Prefecture,� Shizuoka�University� and� Gunma� University� with� an� accumulate�duration�of�12�years;���
(3)�Organization�study�tours�in�Japan�for�2�–�3�weeks�to�researchers�and�engineers�work�in�the�project;�
(4)�Lecturing�and�awareness�spread�on�landslide�risk�assessment� technology� for� those� who� concern� in�Hanoi�and�study�sites�of�the�project;�
(5)� Holding� workshops� and� seminars� in� Vietnam�and� Japan� to� spread� project� results,� as� well� as�publications.�
�Wide�area� Landslide� Mapping� and� Landslide� Risk�Identification�
�The� major� outputs� of� WG2� activities� are� (1)�identification�of�terrain�changes�in�survey�area�by�terrain�characters� identification,� terrain� specific� knowledge� of�slope�and�geological�structure�forecast�for�respective�area;�and� (2)� identification� of� landslide� scale� and� moving�direction� as� well� as� geological� structure� evaluation,�forecast�of�landslide’s�origin�and�process�in�the�future�and�landslide�mapping.�
There� are� four� proposed� activities� of� WG2,�including:��
(1)�Identification�of�previous�landslide�sites�from�air�and�satellite�photos;��
(2)�Identification�of�the�precursor�stage�of�landslides�by�the�pattern�analysis�of�digital�surface�model�(DSM)�of�forest�cover�and�others;��
(3)� Formation� of� landslide� risk� map� based� on�detailed� field� investigation�and�analytical�model� such�as�Analytical�Hierarchy�Process�method�(AHP);�and��
(4)�Development�of� the� technology� to�visualize� the�feature�of�landslide.��Soil� Testing� –� Computer� Simulation� of� Landslide�Initiation�and�Motion�� �
Simulation� of� landslide� development� process� is�implemented� in� the� lab� and� that� can� be� active� through�WG3�activities.�They�are:�
(1)�Development�of�untrained�dynamic�loading�ring�shear�apparatus;�and�
(2)�Elucidation�of�the�initiation�mechanism�and�the�dynamics� of� post�failure� motion� of� the� targeted�landslides� and� development� of� hazard� assessment�technology�of�the�precursor�stage�of�landslides.��Landslide� Monitoring� and� Development� of� Early�Warning�System�
Major� outputs� of� WG4� are� desired� � including� � 2�items:� (1)� Landslide� condition� to� which� conclusion� on�signals� and� warning� about� beginning� and� ending� of�landslide� based� on� monitoring� of� moving� speed,� water�column�pressure�and�rainfall�and�(2)�Condition�of�surface�deformation� to�which� Condition� of� surface� deformation�based� on� the�measurement� of�moving� speed� over� time,�the�depth�of�the�sliding�surface,�the�relationship�between�shear� strain� and� the� factors� made� sliding� surface�(including� pore� water� pressure� with� the� location� of�surface� and� pore� water� ultimate� pressure� related� to�instance�and�rainfall).�
The�main�activities�of�WG4�include:��(1)� Selection�of� pilot� area� for� landslide�monitoring�
based�on�the�field�investigation;��(2)� Drilling� at� site� for� Samples� to� make� test� of�
mechanical� and� physical� indicators� of� soil;� Slide� surface�assessment,� measurement� of� groundwater� table,� and�
87

Proceedings�of�the�IPL�Symposium,�UNESCO,�Paris,�2012
installation�of�groundwater�monitoring�equipments;��(3)� Development� of� the� integrated� automatic�
monitoring� system� for� rainfall�groundwater�slope�movement;�and��
(4)� Establishment� of� early�warning� system� suitable�for� the� region� based� on� the� landslide� experiment� on�natural�slopes�with�artificial�rains.�
�The�Importance�of�the�Project�to�Vietnam�
The�landslide�risk�assessment�technology�developed�throughout� the� project� is� purposed� to� reduce� disasters�caused�by�landslides�on�transport�arteries�is�developed�by�joint� research� based� on� experimental� technology� from�Japan� and� human� resources� development� to� effectively�use� the� technology� in� implementation� in� Vietnam.� The�landslide�risk�assessment�technology,�including�zoning�of�areas� at� landslide� risk,� monitoring� of� sliding� block�movement�and�simulation�of�the�landslide�formation�and�development,� is� a� key� platform� in� the� landslide� risk�assessment� and�management� system.�This� technology� is�the�basis� for� the� system� to�predict� the� risk� level,� decide�whether� or� not� and� make� the� reasonable� control�measures�to�minimize�for�the�unacceptable�risk�level.�The�evaluation� which� supplied� by� the� system� will� help� the�management�to�have�full�awareness�on�landslide�risks�of�and� make� appropriate� decisions,� including� budget�distribution� planning� for� landslide� treatment� before� the�disaster�actually�occurred,�thus� it�contribute�to�reducing�the�loss�of�human,�economic�and�other�negative�impacts�on�society�caused�by�landslides.�
The� technical� cooperation� project� is� a� good�opportunity� for� Vietnamese� scientists� to� access� to�advanced�technologies�from�Japan�and�enhance�technical�human� resources� to�protect� infrastructure� systems.�That�is� the� basic� step� to� contribute� in� socialization� of�development�of�landslide�risk�assessment�technology�and�early� warning� system� to� ensure� transport� arteries� and�mountainous�resident�areas�in�Vietnam�in�the�future.�
�Conclusion�
Vietnam�is�the�country�on�the�coastal�area�of�Pacific�Ocean.�Due�mountainous�terrain,�complicated�geological�structure�and�high�rainfall,�landslides�occur�regularly�and�seriously�on�mountainous�road�network� in� rainy�season.�Though� Vietnamese� economic� condition� recent� years� is�difficult,�the�Vietnamese�government�have�paid�attention�and� investment� to� landslide� researches,� contributing� to�landslide�restoration,�mitigation�and�prevention�on�road�network� but� it� seam� insufficient.� In� such� situation,� the�ODA�Project�by�Japanese�government�in�the�years�of�2011�2016�will�help�Vietnam�in�human�recourses�education,�in�equipments� and� standard� system� on� landslide�investigation,� monitoring,� forecast� and� early� warning,�contributing� to� disaster� prevention� and� reduction� of�Vietnam�in�the�future.�Beside�this,�the�contend�as�well�as�aplying�method�of�the�project�is��considered�as�a�success�of��a�new�landslide�teaching�tool�in�cooperation�with�Asia�
members� of� ICL,� especially� South�East� Asia� countries�including.�
�Acknowledgments�
This� paper� bases� on� contend� of� Project� document� with�the� name� “Development� of� Landslide� Risk� Assessment�Technology� along�Transport�Arteries� in�Vietnam”�which�was� built� up� leaning� on� the� ideas� and� knowledge� of�doctors� and� Professors� Kyoji� Sassa,� Hirotaka� Ochiai,�Toyohiko��Myiagy,��Doan�Minh�Tam�and�others�
I� pay� my� sincere� gratitude� to� the� honorable� every�renowned� Professor� from� different� Universities� and�Institutes,� in� Japan� and�Vietnam,�who�have� contributed�their�outstanding�efforts�and�knowledge� for�making�this�project�meaningful.��References�(in�the�alphabetical�order)�
Dispatch�No.2747/BKH�T�KT�N�dated�on�May�5th�2011�by�Ministry�of� Planning� and� Investment� to� Ministry� of� Transport� on�announce�of�official�Japanese�Government�ODA�Funding�List�for�the�FY�2011;�
Dispatch�No.4456/BGTVT�KH�T�dated� July�26th�2011�by�Ministry�of�Transport� to� Institute� of� Transport� Science� and� Technology� on�assignment�of�Project�Owner�of� the�technical�assistance�Project�with�ODA�from�JICA�for�the�FY�2011;�
Dinh� Van� Tien� (2011).� Application� of� an� analytical� hierarchical�process�approach�for�large�scale�landslide�susceptibility�mapping�in�zone�which�locates�along�Ho�Chi�Minh�route�from�Thanh�My�to�Kham� Duc,� Quang� Nam� Province.� Main� joint� research� project�between� Ministry� of� Transport� (MOT)� and� Ministry� of� Science�and�Technology�(MST)�
Dinh� Van� Tien,� Doan� Minh� Tam� (2010)� Mapping� method� for�landslide�susceptibility�along�the�Ho�Chi�Minh�Road.�A�Paper�on�Road� and� Bridge� Magazine� which� belongs� to� Vietnam� Science�and�Technology�Association,�No1+2/2012.�
Note� Verbales� No.� J.D.33/2011� on� 26/4/2011� from� Japanese�Embassy� in�Vietnam� to�Ministry�of�Planning�and� Investment�on�announce�of�Official�ODA�Funding�List�for�the�fiscal�year�of�2011;�
Project� document� of� project� named� Develop� Landslide� Risk�Assessment� Technology� along� Transport� Arteries� in�Vietnam.2012�
Presentation�on�the�JICA�JST�Joint�Project�in�Vietnam�by�Kyoji�Sassa,�(November� 2011)� “Development� of� Landslide� Risk� Assessment�Technology�and�Objective�of� this�mission”.�Workshop� in� Son� La�prov.,�23�24�November�2011.���
88

��
�������Proceedings�of�the�IPL�Symposium,�UNESCO,�Paris,�2012�
�
Identification� of� rainfall�induced� shallow� landslides� on� mountain�terrain�
Sangjun�IM(1),�Dongyeob�KIM(1),�Changwoo�LEE(2)�1)�Department�of�Forest�Sciences,�Seoul�National�University,�599�Gwanak�ro,�Gwanak�gu,�Seoul,�151�921,�Korea�2)�Divison.�of�Forest�Disaster�Management,�Korea�Forest�Research�Institute,�57�hoegi�ro,�Dongdaemun�gu,�Seoul,�130�721,�Korea�
�
Abstract� Rainfall�induced� Landslide� is� a� major� hazard�that�often�occurs�in�mountain�terrain�of�the�world�during�or� after� heavy� storm.� Identification� of� landslide�susceptible� area� on� steep,� mountain� terrain� is� essential�for� forest� management.� TRIGRS� model� was� used� to�simulate�the� landslides�that�occurred� in�Mt.�Umyeon�on�July� 27,� 2011.�Model� parameters� were� derived� from� field�investigation� and� the� previous� research.� Model�performance� was� also� evaluated� by� comparing� the�simulation�results.�
�Keywords� Landslides,� TRIGRS,�Mt.� Umyeon,�Mountain�Terrain��Introduction�
Rainfall�induced� Landslide� is� a�major� hazard� that� often�occurs� in�mountain� terrain� of� the�world� during� or� after�heavy� storm.� It� poses� significant� threats� to� human� and�property� by� slope� failure� and� associated� debris� flow.�Landslides� are� responsible� for� about� 17� per� cent� of� all�fatalities� from� natural� hazard� around� the� world� (Cred,�2006).� Landslide� is� characterized� by� the� shear� failure� of�slope� plane� that� occurs� along� the� shear� plane� in� steep�terrain.� The� failure� can� be� developed� when� the� shear�stress�exceeds�the�resistance�of�soils�by�either�natural�or�anthropogenic� causes.� Intense� rainfall� is� a�major� trigger���factor�of��shallow�slope�failure�in�mountain�areas�of�Korea.�A� recent� example� of� landslide� is� the� Mt.� Umyeon�landslides� in�Seoul,�which�were� triggered�by� the� July�27,�2011�storm�event.��
Predicting�landslide�prone�area�is�essential�for�forest�management.�Recently,�a�variety�of�approaches�have�been�developed� to� assess� slope� instability� and� to� identify�landslide� susceptible� areas.� Empirical� or� statistical�techniques� generally� are� applicable� to� predict� landslide�susceptibility� at� regional� scale,� while� process�based�approaches�are�used�at�local�scale.�A�process�based�model�can� calculate� the� index� of� stability,� a�well�known� safety�factor,� based� on� geotechnical� mechanism� that� control�slope�failure.�Statistical�approach�can�assess�qualitatively�to� landslide� propensity� by�measuring� the� correlation� of�dependent�variables�that�have�led�to�landslide�occurrence�in�the�past.�This�qualitative�analysis�is�empirical�in�nature�and�hence� there� are� limitations� to� extrapolation�beyond�
the�applied�site�that�employed�to�collect�data�(Dietrich�et�al.�2001).�However,�deterministic�approaches�provide�the�quantitative�and�direct� judgment� for�detection� landslide�prone�areas,�resulting�in�the�calculation�of�factor�of�safety�
A� number� of� process�based� models� have� been�developed� during� last� few� decades.� Some� are� SHAllow�Landsliding� STABility� (SHALSTAB,� Montgomery� and�Dietrich,� 1994),�Stability� Index�MAPping�(SINMAP,�Pack�et�al.�1998),�Transient�Rainfall�Infiltration�and�Grid�based�Regional� Slope�stability� analysis� (TRIGRS,� Baum� et� al.,�2005).� There� are� meaningful� differences� in� model�structure� and� methodology� between� models.� But,� each�model� has� advantages� and� limitations� in� simulating�landslide�initiation�and�development.�
Most�of�process�based�approaches�do�not�capable�of�simulating� the� magnitude� and� location� of� failure� that�might�occur�on�a�watershed�scale.�And,�these�approaches�cannot�be�used�to�directly�for�assess�the�consequences�of�slope� failure�such�as� the� timing�and�volume�of� landslide�generated�sediment�unless�the�models�incorporated�with�run� out� model.� It� provides� the� best� quantitative�information�on�landslide�hazard�that�can�be�used�directly�in� the� design� of� engineering� works,� or� in� the�quantification�of�risk.�Detection�of�unstable�slope�can�be�achieved� by� computing� a� safety� factor� for� a� given� area.�The�models�require�a�large�amount�of�detailed�data,�such�as� soil� thickness,� soil� strength,� slope� geometry,� and�hydraulic�properties� of� soils,�which� are� typically�derived�from�laboratory�tests�and�field�measurement.�
In� this� study� we� employed� TRIGRS� model� as� the�model� environment� to� predict� temporal� and� spatial�development� of� landslide.� TRIGRS� was� widely� applied�around� world,� for� example,� United� States� (Baum� et� al.�2005),� �(Cannata�et�al.,�2010),�Italy�(Salciarini�et� al.� 2006),� as� well� as� Korea� (Kim� et� al.� 2010).�Comparative� analysis� was� conducted� to� evaluate� model�performance�in�terms�of�landslide�prediction.�
�The�2011�Mt.�Umyeon�landslides�
Site�description�Umyeon� mountain� is� located� in� downtown� of� Seoul,�Korea.�The�height�of�mountain�is�about�312.6�m�above�the�sea� level,� and� has� steeper� slope.� It� has� a� main� ridge�formed�from�the�northeast�to�the�southwest,�including�six�
89

S.�IM
valconseeat�t
brooak(Q(Bepin196mo
spoRopendev
LanA�fassJuloccfre�
M,�D.�KIM,�C.�L
lleys�perpendnsists� of� lacems�to�be�higthe�altitude�o
More� thanoadleaved�fork�(Quercus�muercus� acutetula� davuricne,� needlw� fi60~1970s� andountain.�
Tree� root�ots� were� thooot� system� anetrate� into�velopment�of
�
Photo�1.�The
�ndslides�invenfield�survey�ssociated� 33� dly� 27,� 2011,�curred� mainequently�in�29
Figure�1.�
LEE�–�Identificati
dicular�to�theustrine� biotigh�because�sof�220�to�250n� 80� percentrest,�which�amongolica�Fisissima� Carruca� Pall.).�Confir,� and� Rigidd� partially� pr
characteristiought� to� havappears� to� d� deep� soil�f�landslide�on
e�2011�Mt.�Umy
ntories�showed�that�adebris� flows�as� shown� in
nly� between�9o.�
Mt.�Umyeon�L
ion�of�rainfall�in
e�main�ridgeite� gneiss.� Tsix�mineral�sp�meters�on�tht� of� the� areaare�dominatesch.�Ex�Ledebuth.),� and� Aniferous� treeda� pine� haveresent� aroun
ics�around� lave� a� heart�shdistribute� in�layer.� It� affen�forests.�
yeon�Landslide
a�total�of�140�developed� inn� Figure� 1.�15o� and� 40o
Landslides�on�J
nduced�shallow�
.�Most�of�theThe� water� grprings�are�lohe�slope�a� is� coveredd�with�Mongb.),�SawthootAsian� black�s,� such� as�Kee� planted� arnd� the� foot� o
andslide� initihaped� or� tapall� direction
fects� positive
es,�Seoul,�Kore
slope�failuren�Mt.�UmyeoThese� land
o� slope� and�
July�27,�2011.�
landslides�on�m
e�area�round�ocated�
d� by� a�golian�th�oak�birch�
Korean�round�of� the�
iation�p�root.�n� and�ely� in�
�ea.�
es�and�on�on�dslides�most�
�
TyUretom
m44esm�M
TRFoshhyfu20mapsh
inslch(BthIvrehaanprwadexca
thgr
astacoan
RaRlaexramtoev�
mountain�terrain
Heavy� rayphoon�Kom
Umyeon,� butelated�to�the�o� Korea� durimore�rainfall�a
A� field� smovement�ran48.8� m.� � Tstimated�to�bm3�(KSCE,�201
Modelling�Lan
RIGRS�modelorest� hillslophallow� forestydrologic� aunction�of�sp002)� was� immodelling�frampplied� for� shallow�landsl
TRIGRS�nfiltration,� sulope�stabilityharacteristicsBaum�et�al.,�2he� hydrologverson� (2000esponding� toave�extendedn� impermearedict�shallow
when�the�soil�dding�a�simpxcess� water�apacity�of�the
In�TRIGRhe� ratio� ofravitationally
The�mods�rainfall�inteable,� hydrauohesion� and�nd�unit�weigh
�ainfall�input
Rainfall�was�coandslide� occxtreme�stormainfall� of� 364mm/hr,� measotal�of�140�lanvent,�as�show
ainfall� associmpasu�in�2010t� these� slop2011� landsliding� June� 22~around�Seoulsurvey� showenged�from�98The� averagebe�about�116.72,�unpublish
ndslide�Initia
pes� are� charat� soil,� and� vend� geo�mecpace�and�timmplemented�mework,�becaimulating� thlides�in�mounis� a� com
ubsurface� floy� in�order� to�s� on� the� stab2002).�It�wasgical,� geotec0)� to� simulo� vertical� ind�Iverson’s�mble� boundarw�landslide�iis�wet�enoug
ple�runoff�rouwhere� rain
e�soil.�RS,�failure�of�f� resisting�y�induced�dowdel� requires� tensity,�slope,ulic� conducinternal� fricht�of�soil�
onsidered�as�urrence.� Th
m�occurring�o4.5�mm� and�sured� at� the�ndslides�werwn�in�Figure�1
iated� with� t0�caused�a�fewpe� failures� wdes.�In�2011,�~27,� 2011,� anl.�ed� that� the�8�to�1,365�m,�ed� volume�7�m3,�rangin
hed).�
ation�
acterized� by�egetation,�whchanical� co
me.�TRIGRS�min� this� stu
ause�the�modhe� timing� antain�areas�(K
mputer� progow� of� storm�calculate� thbility� of� slops�originally�dchnical� methulate� transienfiltration.� Bmethod�by�adry� at� a� certin�time�and�lgh.�They�exteuting�techniqnfall� exceed
f an�infinite�slbasal� Cou
wnslope�basathe�cell�base,�soil�depth,�ictivity,� hydction� angle� f
s�the�most�infhe� site� was�over�July�26�2maximum� 1
e� Seocho� stare�triggered�b1.�
the� passage�w�landslides�were� not� stTyphoon�Mend� produced�
distance� of�with�an�averof� landslideg�from�1.1�to�
steep� topoghich�have�dinditions� bomodel�(Baumudy� as� a� cdel�has�been�nd� distributKim�et�al.,�20gram� to� simwater,� runo
he�effects�of� rpes�over� largedeveloped�bahod� proposnt� pore� pr
Baum� et� al.�dding�a�soluttain� soil� depocation�that�ended�the�moque�to�transpds� the� infilt
lope�is�modeulomb� frictioal�driving�stred� input�datainitial�grounddraulic� diffufor� effective�
fluencing�facsubjected� t
27,�2011,�with�1�hr� rainfall� oation� (Figureby�the�severe
of� the�on�Mt.��trongly�eari�hit�much�
debris�rage�of�es� was�1,914.8�
graphy,�ifferent�oth� in�m�et�al.,�ore� of�widely�tion� of�010).�mulate�ff,� and�rainfall�e� areas�ased�on�sed� by�essure,�(2002)�ion�for�pth� to�occurs�odel�by�ort�the�tration�
elled�by�on� to�ess.�a,� such�dwater�usivity,�stress,�
ctor�for�to� the�a�total�of� 68.5�e� 2).� A�e�storm�
90

�
infmemo�MoTRperinfThvarthe
griof�Thsite
�Co
Rageomogeo
Figure�
In� additiformation� theasurements,odel�applicati
odel�performaRIGRS� modrformance� byfiltration�on�the�model�wasriation�and�ae�extreme�sto
Simulatedid�are�depicteFS� values� si
he� FS� values�es�that�were�
(a)�The�RaFigure�3.�La
onclusion�
infall�induceographical� rodelling� efforo�engineerin
2.�Hourly�rain
ion,� high�hat� derived,�and�soil�depion.�
ance�del� was� apy� assessing� tthe�landslides�employed�tassociated�staorm�conditiod� values� of� Fed�in�Figure�3imulated� by�were� also� cotriggered�by�
aemian�area����andslides�simu
ed� landslideregions� of�rt� has� done�ng� processes�
nfall�data�over�
resolution�d� from� compth�data�wer
pplied� to�the� effect� ofe�triggering�oto�figure�out�ability�for�eacn�on�the�JulyFactor� of� Saf3.�Figure�3�prTRIGRS� mo
ompared� agathe�storm�on�
������(b)�The�Duulation�over�Ju
� is� a� majothe� world.to� quantitatof� landslide
the�storm.�
DEM� data,�mprehensive�re�used�as�inp
evaluate� mf� transient� raover�the�studythe�pore�prech�grid�cell�dy�26�27,�2011.�fety� (FS)� for�resents�the�chodel� after� raiainst� the� landn�the�July�27,�
ukwooam�valleuly�26�27,�2011.
or� hazard� i� In� this� sively� examine� developme
�
� soil�field�
put�of�
model�ainfall�y�site.�essure�during�
r� each�hange�infall.�dslide��2011.�
�
ey�.�
in� all�study,�ne� the�ent� in�
mGemTde
tiin20stshst
Tlaratoraco
A
TSosu�R
Ba
Ba
Ce
Di
Ki
M
Pa
Sa
Pr
mountain� terGrid�based�Remployed� in�RIGRS� was�ependent�rai
Landslidming� and� lon�Seoul,�Kore011,�was�selectorm�with� tohallow� and�torm.��
Results� oRIGRS� modeandslide� initiainfall.�Howeo� spatiotempainfall,� soil,�aonsider�the�e
�Acknowledgm
his� research�ociety� of� Civupported�by�S
eferences�
aum,� R.L.,� Savprogram�for�tslope�stability
aum,�R.L.,�Coe,�Schulz,�W.H.,�J.A.� (2005).�Washington,�
enter�for�ReseaRetrieved�http://www.c
ietrich�W.E.,� Beshallow� landWater�science
m,� D.,� Im,� S.,�Rainfall�TriggeUsing�TRIGRS�
Montgomery,�D.for� the� topoResources�Re
ack,� R.T.,� Tarbapproach� to� tof� the� InternaEnvironment,Columbia,� CaBalkema,�c.�2,
alciarini,� D.,� GoMichael,� J.A.induced� shalcentral�Italy.�L
roceedings�of�th
rrain.� Transegional�Slopethis� study�originally�
nfall�infiltrate� simulationocation�of� unea,�damaged�bcted�for�simuotal� rainfall� atranslated� la
of� modellingel� has� the� piation� and� dever,�model�pporal� variatand�geology.�effect�of�veget
ments�
work� sponsovil� EngineeriSeoul�Nation
vage,� W.Z.,� Gotransient�rainfay�analysis.�USGSJ.A.,�Godt,�J.WBrien,�D.L.,�ChRegional� landsUSA.�Landslidesarch�on�the�Epidfrom� Inte
cred.be/emdat.ellug�D.,� Real� dslide� model,�e�and�ApplicatioLee,� S.H.,� Hongered� LandslideModel.�JournaR.,�Dietrich,�Wographic� contsearch�30(4):11boton,� D.G.,� Gterrain� stabilityational�Associa8th,� Septembeanada,� Proceed,�pp.1157�1165odt,� J.W.,� Sava(2006).� Mod
low� landslidesLandslides�3(3):
he�IPL�Symposiu
sient� Rainfale�stability� (Tas� the� moddeveloped�
tion�and�slopn� has� conducnstable� slopeby�an�extremulation.�In�thamount� of� 3landslides� du
g� efforts� dempotential� to�development�performancetion� of� info�Future�worktation�on�lan
ored�partialling,� and� thenal�University
odt,� J.W.� (200all�infiltration�aS�Open�file�Rep
W.,�Harp,�E.L.,�Releborad,�A.F.,�Mslide�hazard� ass�2(4):266�279�demiology�of�Dernational� D.�de�Asua,� R.� (20SHALTAB,� for�on�2:195�227�g,� Y.� Cha,� K.S.�es� in� a� Forestal�of��Mountain�W.E.� (1994).�A�prol� on� shallo153�1171�Goodwin,� C.N.�y�mapping,� in�ation�of�Engineer� 21�25,� 199dings� :� Rotterd5�age,� W.Z.,� Conveling� regional�s� in� the� easte:181�194�
m,�UNESCO,�Pa
ll� InfiltratioTRIGRS)�moddelling� framto� assess�
pe�stability.�cted� to� explo.� The�Mt.�U
me�storm�on�Je�selected�ar07�mm� causuring� or� aft
monstrate� thsimulate� weinduced� by�� is�strongly�rormation,� suk� is�also�neendslide�occur
ly� from� the�Ke� presentatioy,�Korea.�
02).� TRIGRS�A�nd�grid�based�port�02�424.�eid,�M.E.,�SavagMcKenna,�J.P.�Mssessment� for�
isasters�(CRED)Disaster� Da
001).� Validationforest� manag
(2010).� Predictted� Mountain�Science�7:83�9physically�basedw� landsliding.
(1998).� The� SInternational�Cering�Geology�98,� Vancouver,dam,� Netherlan
versini,� P.,� Bauinitiation� of�
ern� Umbria� Re
aris,�2012
n� and�del�was�mework.�
time�
ore� the�myeon�July�27,�rea,�the�sed� 140�ter� the�
hat� the�ell� the�heavy�
related�uch� as�eded�to�rence.��
Korean�on� was�
fortran�regional�
ge,�W.Z.,�Michael,�Seattle,�
)�(2006).�atabase:�
n� of� the�gement.�
ting� the�Region�1�d�model�� Water�
SINMAP�Congress�and�the�,� British�nds,� A.A�
um,� R.L.��rainfall�egion� of�
91

IPL Symposium was organized together with the 11th Session of Board of Representatives of ICL and the 7th Session of IPL Global Promotion Committee on 20-23 November 2012.
The International Programme on Landslides (IPL) is a joint international programme established by ICL, UNESCO, WMO, FAO, UNISDR, UNU, ICSU, WFEO by 2006 Tokyo Action Plan.