proceedings edwards trinity final - eahcp€¦ · 2 interconnection of the trinity (glen rose) and...
TRANSCRIPT

Interconnection of the Trinity (Glen Rose) and Edwards Aquifers along the Balcones Fault Zone
and Related Topics
Karst Conservation Initiative
February 17, 2011 Meeting
Proceedings
Austin, Texas July 2011

1
Meeting Organizer/Convener Marcus O. Gary Zara Environmental LLC Meeting Date and Location Texas Advanced Computing Center, Visualization Laboratory The University of Texas at Austin Proceedings Editors Marcus O. Gary Zara Environmental LLC Robin H. Gary and Brian B. Hunt Barton Springs/Edwards Aquifer Conservation District Sponsors

2
Interconnection of the Trinity (Glen Rose) and Edwards Aquifers along the Balcones Fault Zone
and Related Topics
Table of Contents
Introduction and Acknowledgements ......................................................................................... 4
Interconnection of the Edwards and Trinity Aquifers, Central Texas, U.S.A. ....................... 5 Marcus O. Gary
Spatial and Temporal Recharge Variability Related to Groundwater Interconnection of the Edwards and Trinity Aquifers, Camp Bullis, Bexar and Comal Counties, Texas ................ 6
Marcus O.Gary, George Veni, Beverly Shade, and Robin Gary
Potential for Vertical Flow Between the Edwards and Trinity Aquifer, Barton Springs Segment of the Edwards Aquifer............................................................................................... 11
Brian A. Smith and Brian B. Hunt
Could Much of Edwards Aquifer “Matrix Storage” Actually be Trinity Aquifer Contributions from the Blanco River? ..................................................................................... 15
Nico M. Hauwert
Geophysical Correlation of Haby Crossing Fault (Medina County) and Mt. Bonnell Fault (Travis County) and Their Implications on T-E Interconnection .......................................... 25
Mustafa Saribudak
Edwards Aquifer – Upper Glen Rose Aquifer Hydraulic Interaction ................................... 30 R.T. Green, F.P. Bertetti, and M.O. Candelario
Interaction Between the Hill Country Portion of the Trinity and Edwards Aquifers: Model Results .......................................................................................................................................... 36
Ian C. Jones

3
Using Tracer Testing Data for Resource Management Planning .......................................... 38 Geary Schindel and Steve Johnson
Demonstrating Interconnection Between a Wastewater Application Facility and a First Magnitude Spring in a Karstic Watershed: Tracer Study of the Tallahassee, Florida Treated Effluent Spray Field 2006-2007 ................................................................................... 41
Todd R. Kincaid, Gareth J. Davies, Christopher L. Werner, and Rodney S. DeHan
Jacob’s Well Spring is a large artesian spring in the Trinity Aquifer (Photo by Brian Hunt).

4
Introduction and Acknowledgements
The Karst Conservation Initiative (KCI) is an informal work group organized by Alisa Shull of the U. S. Fish and Wildlife Service, Austin, Texas office. The group meets to discuss important issues related to karst hydrogeology, biology, and management in central Texas. A listserve is managed for interested individuals at:
https://www.fws.gov/lists/listinfo/kci
This meeting was hosted by the Visualization Laboratory (VisLab) of the Texas Advanced Computing Center (TACC) at The University of Texas at Austin. Brandt Westing, the VisLab manager, helped to facilitate scheduling and room set-up. The editors thank the staff of TACC, and all the contributing authors/presenters for making the February 17, 2011 KCI meeting a tremendous success.
Thank you,
Marcus Gary, Zara Environmental LLC
Image Credit: Benjamin Urick and Brandt Westing (TACC), February 17, 2011.

5
Interconnection of the Edwards and Trinity Aquifers, Central Texas, U.S.A.
Marcus O. Gary
Zara Environmental LLC
The Edwards and Trinity Aquifers are critical water resources, supplying high-quality potable water to over two million people in the greater Austin-San Antonio region of central Texas, USA. These Cretaceous carbonate aquifers are hydrogeologically juxtaposed by extensive Miocene tectonic deformation associated with the Balcones Fault Zone, where the younger Edwards Group limestone has been downthrown relative to the older Trinity Group. The karstic aquifers are managed separately by regional water regulatory entities, and they have been historically treated as independent systems, both scientifically and from a water policy standpoint. Recent awareness of a significant interconnection between the Edwards and Trinity Aquifers has resulted in a number of hydrogeologic investigations documenting how they may actually operate as a single system. Studies related to upland recharge variability (spatial and temporal), stream loss, phreatic dye tracing, multi-port well monitoring, geochemistry, biologic habitat analysis, geophysics, and groundwater modeling indicate that the two are much less separated than previously observed. Summaries of these investigations conclude that changes in management strategies may be required to properly protect the quantity and quality of water in the Edwards and Trinity Aquifers.

6
Spatial and Temporal Recharge Variability Related to Groundwater Interconnection of the Edwards and Trinity Aquifers,
Camp Bullis, Bexar and Comal Counties, Texas
Marcus Gary1, George Veni2, Beverly Shade1, and Robin Gary3
1Zara Environmental LLC; 2National Cave and Karst Research Institute; 3Barton Springs/Edwards Aquifer Conservation District
Camp Bullis military training site in northern Bexar and southern Comal Counties, Texas, includes over 113 km2 of limestone outcrop of the Trinity and Edwards Aquifers. These Cretaceous carbonate aquifers are within the Glen Rose Formation (Trinity), and Person and Kainer Formations (Edwards). Both groups are characterized by well developed secondary porosity, including significant karstification, which has altered recharge and transmissivity properties of the aquifers. Intensive karst surveys have identified and mapped over 1200 caves and potential recharge features in Camp Bullis. This karst dataset has been integrated with the mapped geologic members of the Glen Rose and Kainer Formations to produce karst feature density zones (KFDZs) that identify specific areas which have undergone more speleogenetic diagenesis than other areas (Figure 1). Independent spatial analysis of the karst feature density distribution compares closely to airborne electrical geophysical surveys conducted by the USGS, corresponding with areas of high resistivity which had been previously interpreted exclusively as lithologic and structural anomalies (Figure 2).
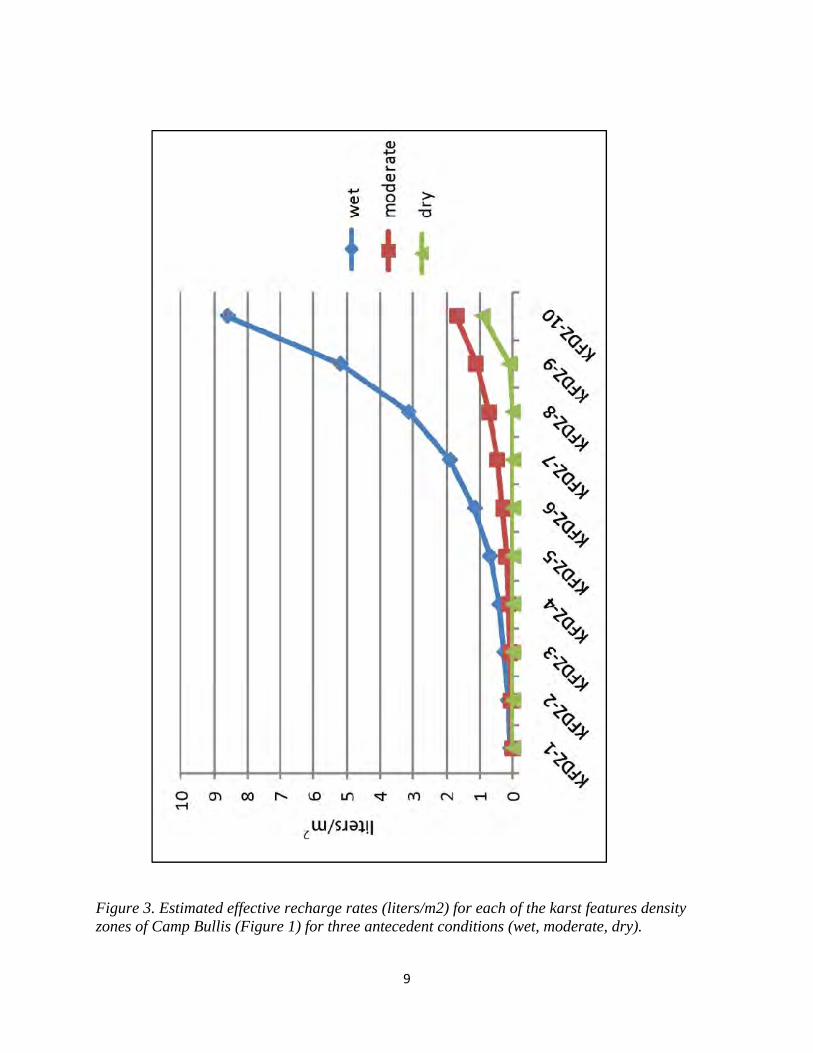
Studies focused on upland recharge by monitoring vadose drip waters in two caves, creating a detailed temporal dataset of recharge dynamics. These data reveal a strong control on effective recharge from antecedent conditions; more recharge during wet conditions (8.6 liters/m2) than in dry conditions (0.1 liters/m2) (Figure 3). Applying these values to the KFDZs identified across Camp Bullis yields variation in total effective recharge in upland areas that varies from 4.212% - 0.067% of rainfall which falls on the area, depending on the antecedent conditions and karst density (Figure 4). Nineteen phreatic dye trace experiments indicate that water entering karst features at Camp Bullis can move rapidly, primarily in a south-southeast vector, and crosses faults moving directly from the Trinity to the Edwards Aquifer.
Implications from the analysis and interpretation of these individual studies may have significant impact on groundwater resource management in the region, as it indicates that the Trinity Aquifer directly recharges the Edwards Aquifer with variable rates depending on antecedent conditions, and thus could affect groundwater flow models and environmental regulatory practices in the region.

7
Figure 1. Karst feature density zones (KFDZs) identifying areas which have undergone more speleogenetic diagenesis than other areas at Camp Bullis.

8
Figure 2. Spatial analysis of karst feature density within Camp Bullis is shown in the middle map. Surrounding maps are from an airborne geophysical study completed by the USGS in 2005.
9
Figure 3. Estimated effective recharge rates (liters/m2) for each of the karst features density zones of Camp Bullis (Figure 1) for three antecedent conditions (wet, moderate, dry).

10
Figure 4. Maps of estimated effective recharge rates based on karst feature density map (Figure 1) for Camp Bullis for three antecedent conditions.

11
Potential for Vertical Flow Between the Edwards and Trinity Aquifer, Barton Springs Segment of the Edwards Aquifer
Brian A. Smith and Brian B. Hunt Barton Springs/Edwards Aquifer Conservation District
Within the Barton Springs/Edwards Aquifer Conservation District, the Trinity Aquifer is increasingly used as a source of water as pumping limits have been placed on the Edwards Aquifer. Proper management of these aquifers requires an understanding of factors affecting the hydraulic relationship between the two aquifers.
To better understand the relationship between the various units of the Edwards and Trinity Aquifers, the District drilled two 5-inch diameter boreholes to 1,120 ft (Ruby Ranch) and 1,375 ft (Antioch) in Hays County in the recharge and confined zones, respectively (Figure 1).
A specialized multiport system was installed in each borehole which spans the Edwards and Trinity Aquifers with 14 monitor zones in the Ruby Ranch well, and 21 monitor zones in the Antioch well. Data collected from the Ruby Ranch well include water levels, geochemistry, isotopes, and permeability. Only water levels, and a few total dissolved solids (TDS) samples, have been collected to date from the Antioch well. A wireline tool is used to collect samples and measure potentiometric pressures in each sample zone (Figure 2). This tool and the equipment permanently installed in the well are manufactured by Westbay® Instruments (a Schlumberger company) of Vancouver, Canada.
Water-chemistry and isotope data were collected from the 13 sampling zones of the Ruby Ranch well and reveal, in general, two fresh groundwater systems separated by a brackish groundwater system. The zones can be further characterized into three distinct hydrochemical facies: calcium bicarbonate, calcium sulfate, and an intermediate facies (Figure 3). The calcium sulfate facies has the highest levels of sulfate, magnesium, calcium, and TDS and is associated with zones in the upper member of the Glen Rose Formation. The lowest TDS zones are in the Edwards Group units, the Cow Creek Limestone in the Ruby Ranch and Antioch wells, and a rudist-reef unit in the lower member of the Glen Rose Formation in the Ruby Ranch well. Zones with low TDS generally have relatively higher hydraulic conductivity, which would conceivably enhance the flushing of dissolved constituents from groundwater within those zones. Tritium and percent modern carbon (pmC) indicate that the Edwards Group zones contain relatively young groundwater. The Trinity contains relatively old groundwater with no tritium values detected and less than 40% pmC.
Significant head differences (up to 75 feet), distribution of hydrochemical facies, and isotopic signatures suggest that there is very little, if any, vertical flow between the Edwards and Trinity units (Figure 3). Faults in the area do not appear to create pathways for vertical flow, nor do they appear to necessarily create barriers to lateral flow. Lateral flow is the dominant process in the Edwards and Middle Trinity Aquifers. Relay-ramp structures, which are common in the Balcones Fault Zone (Figure 1), provide a mechanism for lateral continuity within most

12
lithologic units, and therefore allow for the lateral flow of groundwater from the recharge areas to these wells. The most likely recharge areas are where the Middle Trinity units outcrop in the Blanco River Valley, about 15 miles to the west of the Ruby Ranch well.
Similar head values and similar responses to precipitation (recharge) suggest that the uppermost zone of the Upper Glen Rose (Zone 11, Ruby Ranch well) is in hydraulic connection with the Edwards Aquifer. Groundwater geochemistry in this zone also appears to change depending upon head values in relation to the zone below. The connection may be lateral (due to fault juxtaposition) or possibly by virtue of some localized vertical flow, along faults or fractures. References
Collins, E.W., and Hovorka, S.D., 1997, Structure map of the San Antonio segment of the Edwards Aquifer and Balcones Fault Zone, south-central Texas: structural framework of a major limestone aquifer: Kinney, Uvalde, Medina, Bexar, Comal and Hays Counties: The University of Texas at Austin, Bureau of Economic Geology, Miscellaneous Map No. 38, scale 1:250,000, text, 14 p.
Smith, B., and Hunt, B., 2004, Evaluation of Sustainable Yield of the Barton Springs Segment of the Edwards Aquifer, Hays and Travis Counties, Central Texas: Report of the Barton Springs Edward Aquifer Conservation District, Austin, Texas, 74 p. +Appendices.
Acknowledgments
District contributors to this project include Brian A. Smith, Ph.D., P.G., Brian B. Hunt, P.G., W.F. (Kirk) Holland, P.G., Joseph Beery, and Guy Rials. C&C Drilling (Boerne, Tex.) drilled the boreholes and assisted with the installation of the Westbay® systems. We thank Dr. Brann Johnson (retired, TAMU) for providing logistical support and consultations for the Ruby Ranch well; the EAA and Geary Schindel, P.G. for geophysical logging of the Ruby Ranch well; the TWDB for support and funding of chemical and isotopic analyses; and the City of Austin (WQPL) for providing the Ruby Ranch well study site. We thank Alex S. Broun, P.G. for his geologic interpretation of the geophysical logs from both well sites.
Figure 1. (Left) Hydrologic zones of the Barton Springs segment of the Edwards Aquifer and the location of the two multiport wells. (Right) Cross section of the study area showing the relation of the Edwards and Trinity Aquifers and the approximate location of each well. Inset figure is a diagram showing the geometry of relay-ramp structures that are common in the study area. [Kgru = Upper Glen Rose formation; Kgrl = Lower Glen Rose formation; Kcc = Cow Creek formation]

13
Figure 2. Picture showing data collection at the Ruby Ranch Multiport well. The wireline tool is lowered to each zone where it can measure a pressure and take a sample. Inset picture shows the sampling tool in a cut away of the casing.

14
Figure 3. Diagram showing the hydrostratigraphy, multiport well construction and results of water chemistry and water level sampling for the Ruby Ranch and Antioch wells.

15
Could Much of Edwards Aquifer “Matrix Storage” Actually be Trinity Aquifer Contributions from the Blanco River?
Nico M. Hauwert City of Austin Watershed Protection Department
Most storage within the Barton Springs segment of the Edwards Aquifer is thought to lie within the areas between the major flow conduits (Senger, 1983; Worthington, 1999; Massei, et al., 2007). Worthington (1999) estimated that inside the Edwards Aquifer, 93% of groundwater flow occurred within the main conduits while 99.8% of the storage occurred within the matrix and in fractures between the major conduits. The hydraulic conductivity shows a decline with distance from mapped primary and secondary groundwater flow paths, ranging from more than 100 m/day to 0.1 m/day (Hauwert, 2009). The question remaining is whether the matrix storage areas between the major conduits composed of tiny interconnected pores (less than 1 cm in size) are capable of producing diffuse flow or well-integrated, larger, solution-enhanced voids and fissures.
Karst aquifers such as the Barton Springs Segment of the Edwards Aquifer have frequently been characterized as having diffuse flow matrix as determined by indirect methods, such as interpretations of water-level changes, spring-flow recession, water-quality composition and variation, isotopic age-dating, and core interpretation. Senger (1983) inferred that the Barton Springs Segment had a strong diffuse matrix component based on spring flow and water-level recessions. Hauwert and Vickers (1994) inferred local diffuse flow on the eastern edge of the artesian zone based on slow responses of well 58-50-301 to rainfall events, but Hauwert (2009) subsequently attributed the response to limited-capacity conduit hydrodynamics. It is alternatively possible the slow water level response of this well may be due to partial blockage of the well from collapse of uncased Del Rio Clay into the well (Joe Beery, BSEACD 2009 personal communication). Massei et al. (2007) used specific conductance frequency distributions over a period of four years to estimate that 54% to 69% of Barton Springs-specific conductance frequency distributions originated from the matrix or from poorly connected voids and only about 8% to 15% of Barton Springs discharge was recently recharged. Point dilution tests were used to indicate that Edwards Aquifer groundwater flowed at rates of 2 to 51 ft/day through interstitial pores (Maclay and Rettman, 1972; Ellis, 1985). However, more recent interpretation of core data (Hovorka et al., 1998) suggests that flow is localized in fissures and conduits.
Direct observations generally show the dominance of advective transport through conduits. Groundwater traces show rapid initial arrival flow rates from 5 to 7 miles/day during moderate and high flow conditions with an insignificant diffuse component (Hauwert, 2009). With the exception of common shallow cave ceiling drips that likely reflect diffuse soil moisture drainage or overlying vadose pool drainage, flow can be observed to discharge from springs, into wells, and into caves from solution-enlarged conduits and not seepage faces (Hauwert, 2009). Cave morphology reflecting diffuse-flow sources such as ramiform are completely lacking in the Barton Springs Segment (Palmer, 1991; Hauwert, 2009). Instead, branchwork cave morphology is encountered that reflects discrete recharge sources (Hauwert, 2009).
16
Groundwater traces conducted during low-flow conditions indicate that the advective to diffusive flow relation diminishes to some, yet unquantified, extent. During low-flow conditions, groundwater velocities decrease considerably to 0.3 to 1 mile per day (Hauwert, 2009). The diminished flow rates during low-flow conditions are much less than could be accounted for by simple lowering of potentiometric gradient. Dye recoveries are lower during low-flow conditions. The uncertainty of arrival times and the need to protect wells and aquatic habitat from excessive dye concentrations increases the complexity of recovering dye pulses in water samples during low-flow conditions in order to quantify the ratio of advective to diffusion and dispersion. Near some of the tracer injection sites, pulses of dye have been measured as much as 10 years after injection, although such pulse behavior may be due to the dye trapped within the unsaturated zone that becomes periodically flushed by larger rain events. Even considering the relatively slower groundwater velocities and lower tracer recoveries during droughts, there is little if any direct evidence that indicates small pores are hydraulically significant within the phreatic zone for either flow or storage in the Edwards Aquifer.
Quinlan et al., (1995) and Davies and Quinlan (1993) argued that in mature karst aquifers, conduits become sufficiently integrated to the point that diffuse flow components are not significant except on small local scales. Also, with further examination there are frequently other explanations to account for the indirect evidence presented for diffuse flow. It was later discovered that many springs on which the Shuster and White (1971) characterized aquifers using variation in specific conductance were influenced by an aliasing bias, where too few samples were collected to adequately describe the variation (White, 2007). Massei et al (2007) noted that karst springs such as Barton Springs have different water-quality sources that complicate characterization using specific conductance alone. One problem in using indirect methods alone to characterize aquifer systems is that the interpretation may not be unique. In addition to recharge from the major creeks and intervening outcrop area, Barton Springs has other recharge sources that may include:
1. Epikarst flows hypothesized by Atkinson (1977) and Klimchouk (2004) to mimic slower-flowing drainage to springs,
2. Urban leakage from irrigation and utility line leaks (Garcia-Fresca and Sharp, 2005), 3. Groundwater flow across the southern divide (Hill, 1892; Guyton, 1964; Johnson and
Schindel, 2008; Land, 2010), 4. Leakage from the Saline-Water Zone (Senger, 1983; Hauwert et al., 2004), 5. Trinity Aquifer sources including:
a. Cross-formational leakage from the Trinity Aquifer (Senger, 1983; Slade et al., 1986), and
b. Recharge of Trinity Aquifer spring-fed baseflow.
While all of the sources listed above should be further quantified and investigated to determine to what extent, if any, they provide recharge to Barton Springs, this paper suggests only that Trinity Aquifer baseflow from the Blanco River (5b) may account for some indirect observations attributed to “diffuse matrix flow” within the Edwards Aquifer.

17
From 2008 to 2009, a series of dye traces were conducted in the Blanco River and its major tributary, Halifax Creek, using eosine and sodium fluorescein (uranine) dye (Edwards Aquifer Authority, in preparation). This study was the result of a cooperative effort involving the Edwards Aquifer Authority, Barton Springs/Edwards Aquifer Conservation District, Zara Environmental, and the City of Austin. During the injections, Barton Springs flow varied from 19 to 31 ft3/s, which is lower than its 53 ft3/s average flow. Wells in the Ruby Ranch and Mountain City areas previously traced to Barton Springs recovered the eosine dye from multiple injections (Figure 1). The dyes initially arrived at Barton Springs within about three months (Figures 2 and 3), yielding a flow rate of about 0.3 miles/day. The eosine dye injected in the Blanco River at Halifax Creek also was detected in several wells south of the Blanco River near San Marcos Springs, indicating that a percentage of water moves south as well. The tracing study was definitive in establishing directly, for the first time, that the Blanco River contributes flow to Barton Springs during low-flow conditions and the length of time the process took. However, this tracing has not yet quantified the Blanco River contribution to Barton and San Marcos springs.
Analysis comparing Blanco River recharge to Barton Springs discharge indicates that the Blanco River has a major role in sustaining Barton Springs flow during droughts. The Blanco River has a much larger watershed than the creeks that provide most of the recharge to Barton Springs. The Blanco River is sustained both by stormwater runoff and major springs discharging from the Trinity Aquifer, including Jacob’s Well near Wimberley. To estimate the amount of Blanco River flow loss contributing to Barton Springs, Blanco River flow loss was compared to the total Barton Springs discharge for eight low-flow intervals (Hauwert et al., in preparation; Figures 4 and 5). For the eight low-flow intervals, Blanco River flow loss compared to 50% to 100% of Barton Springs discharge. Consequently, Blanco River recharge can potentially account for most of Barton Springs discharge during low-flow periods even with a portion of its recharge contributing to San Marcos Springs. While three months are required for recharge from the Blanco River to arrive at Barton Springs, much of the flow path is under artesian conditions such that a pressure pulse can potentially travel nearly instantaneously from recharge to discharge site. Further investigation is needed to determine if low-flow discharge peaks at Barton Springs are associated with corresponding Blanco River flow loss peaks, or if these peaks are not causal but created by other sources, such as stormwater runoff in watersheds closer to Barton Springs (Johns, 2006) or upland recharge.
Although the Blanco River is the predominant source of recharge to Barton Springs during low-flow conditions, overall its average contribution may be small. During high-flow conditions, it is known that Onion Creek becomes the southern groundwater divide as shown by a groundwater trace injection in 2005 that traveled from Onion Creek to both Barton Springs and San Marcos Springs (Hunt et al., 2006). Peaks in Barton Springs discharge do not generally correspond with Blanco River recharge peaks for Barton Springs flows above 40 ft3/s. Assuming the Blanco River stops contributing to Barton Springs above 40 ft3/s, a four-year water balance from 2004 to 2007 suggests that the Blanco River recharge constitutes up to 6% of mean total discharge of Barton Springs plus well pumpage, but it may be less depending on the contribution to San Marcos Springs.

18
Quantification of the Blanco River and other Trinity Aquifer sources to Barton Springs can be further examined chemically. For 102 measurements reported by the USGS from the Blanco River at Wimberley between 1962 and 2008, the specific conductance ranged from 366 to 532 uS/cm, with an arithmetic mean of 461 uS/cm. These conductivity readings are much lower than the predominant “P1” specific conductance frequency distribution peak of Main Barton Springs identified by Massei et al (2007), which shifted from ranges of about 600 uS/cm in wet years to more than 700 uS/cm during dryer years. However, a specific conductance measurement reflects combined sources present at the time and interpretation of specific conductance frequency distributions assume that there are times when one source is geochemically dominant and other sources are not. During droughts, when the Blanco River contribution is expected to be highest, a higher contribution of highly mineralized Saline-Water Zone leakage is simultaneously occurring; thus there is considerable overlap of the two specific conductance sources, and a small volume contribution of highly mineralized Saline-Water Zone groundwater can easily dominate the geochemistry to varying extents (Senger, 1983; Hauwert et al., 2004). Of the four Barton Springs outlets, the Saline-Water Zone leakage has strongest geochemical influence on Old Mill Springs of the Barton Springs and no geochemical influence on Upper Barton Springs because the Sunset Valley groundwater basin is hydraulically separated (Hauwert et al., 2004; Hauwert, 2009). For springs such as Main Barton Springs, Eliza and particularly Old Mill Springs, it may be impossible to clearly distinguish sources based on specific conductance alone. Senger (1983) observed that Saline-Water Zone, Trinity and Edwards Aquifer sources could be distinguished using chloride and sulfate relationships in water samples (Figure 6). Based on sulfate and chloride concentrations, the water quality of Onion Creek (which is the largest recharge source to Barton Springs overall) and the Blanco River are similar to other Trinity Springs sources, but appear to be indistinguishable from each other using sulfate and chloride concentrations alone. As Figure 6 shows, there is considerable overlap between Barton Springs water quality and Trinity Aquifer sources such as the Blanco River, which is consistent with the concept that Barton Springs has a strong geochemical influence from undistinguished Trinity Aquifer sources (including major spring-fed creeks draining the contributing area). Note that wells in the Manchaca groundwater basin, which are largely not expected to receive contributions from the Saline-Water Zone but are likely to be downgradient of Blanco River recharge sources and other Trinity Aquifer sources, have chloride and sulfate relation ranges identical to these Trinity Aquifer sources. While this water quality analysis is preliminary and further investigation should be conducted, the water quality results are consistent with a strong influence of the Blanco River and other Trinity Aquifer sources.
Results from recent studies on the Blanco River recharge contribution to Barton Springs, tested using direct groundwater tracing methods, suggest that this recharge source may account for sustained spring flow and, considering the simultaneous addition of Saline-Water Zone leakage, the water-quality characteristics that have been previously attributed to diffuse matrix flow within the Barton Springs segment of the Edwards Aquifer. When examined solely through indirect methods, the Trinity Aquifer recharge to the Barton Springs Segment resembles storage within the Edwards Aquifer.

19
References
Atkinson, T.C., 1977. Diffuse flow and conduit flow in limestone terrain in the Mendip Hills,Somerset (Great Britain): Journal of Hydrology,35,111-123. (Great Britain). J. Hydrol. 35, 93-100.
Davies, G.J., and Quinlan, J.F., 1993, There is no such thing as a diffuse-flow carbonate aquifer if that aquifer is unconfined and subaerially exposed: Geological Society of America, Abstracts with Programs, v. 25, no. 6, p. 211.
Ellis, P.M., 1985, Diagenesis of the lower Cretaceous Edwards Group in the Balcones Fault Zone Area, South-Central Texas [PhD thesis]: University of Texas at Austin, 326 p
Garcia-Fresca, B., and Sharp, J.M. Jr., 2005, Hydrogeologic consideration of urban development: urban induced recharge: in Ehlen, J., et al., Humans as Geologic Agents, GSA Review in Engineering, v. XVI, p. 123-136.
Guyton W.F. and Associates, 1964, Report on Barton Springs and associated ground-water conditions with particular reference to possible effects of a proposed sewer line in Barton Creek area, Austin, Texas.
Hauwert, N.M. and Vickers, S., 1994, Barton Springs/Edwards Aquifer hydrogeology and groundwater quality: Report by the Barton Springs/Edwards Aquifer Conservation District for the Texas Water Development Board, 36 p. and figures. Accompanying addendum released by Nico M. Hauwert, BS/EACD, January 1996. http://www.ci.austin.tx.us/watershed/publications/files/BSEA1994Hyd_GW_Quality.pdf
Hauwert, N.M., Johns, D., Hunt, B., Beery, J., Smith, B, and Sharp, J.M., 2004, Flow systems of the Edwards Aquifer Barton Springs Segment interpreted from tracing and associated field studies: from Edwards Water Resources In Central Texas, Retrospective And Prospective Symposium Proceedings, San Antonio, Hosted by the South Texas Geological Society and Austin Geological Society, 18 p. http://www.ci.austin.tx.us/watershed/publications/files/Flowinterp2004.pdf
Hauwert, Nico M., 2009, Groundwater Flow and Recharge within the Barton Springs Segment of the Edwards Aquifer, Southern Travis County and Northern Hays Counties, Texas: Ph.D. Diss., University of Texas at Austin, Texas. 328 p. http://www.ci.austin.tx.us/watershed/publications/files/FinalDissertationNH2009710.pdf
Hill, R.T., 1892. On the occurrence of artesian and other underground waters in Texas, New Mexico, and Indian territory: together with the geology and geography of those regions: U.S. Geological Survey Report. 166 p.
Hovorka, S.D., Mace, R.E., Collins, E.W., 1998, Permeability structure of the Edwards Aquifer, South Texas: Implications for aquifer management: Bureau of Economic Geology Report of Investigation No. 250, Austin, Texas, 55 p.
Hunt, B.B., Smith, B.A., Beery, J., 2006, Summary of 2005 groundwater dye tracing, Barton Springs Segment of the Edwards Aquifer, Hays and Travis Counties, Central Texas: BS/EACD Report of Investigations 05012006, 31 p.

20
Johns, D., 2006, Effects Of Low Spring Discharge On Water Quality At Barton, Eliza, And Old Mill Springs, Austin, Texas: City of Austin Watershed Protection Department short report, SR-06-05, 15 p.
Johnson, S.B. and Schindel G.M., 2008, Evaluation of the Option to Designate a Separate San Marcos Pool for Critical Period Management: Edwards Aquifer Authority report no. 08-01, 109 p.
Land, L., 2010, Evaluation of Hydrologic Connection between San Marcos Springs and Barton Springs through the Edwards Aquifer: Report by HDR Engineering, Inc. to the Guadalupe-Blanco River Authority, 35 p.
Klimchouk, A., 2004, Toward defining, delimiting and classifying epikarst: Its origin, process and variants of geomorphic evolution: in Jones, W.K., et al., ed., D.C., Karst Water Institute special publication, v. 9, p. 23-35.
Maclay R.W., and Rettman, P.L., 1972, Hydrologic investigation of the Edwards and Associated limestones in the San Antonio area: project report 1970-1971 EUWD, 24 p.
Massei, N., Mahler, B.J., Bakalowicz, M,, Fournier, M., and Dupont, J.P. , 2007, Quantitative interpretation of specific conductance frequency distributions in karst: Groundwater, v. 45, no. 3, 288–293.
Quinlan, J.F., Ray, J.A., and Schindel, G.M, 1995, Intrinsic limitations of standard criteria and methods for delineation of groundwater-source protection areas (springhead and wellhead protection areas)in carbonate terranes: in Beck, B. ed., Karst Geohazards: Engineering and Environment, P 525-540.
Palmer, A.N., 1991, Origin and morphology of limestone caves: Geological Society of America Bulletin, v. 103, p. 1-21.
Senger, R.K., 1983, Hydrogeology of Barton Springs, Austin, Texas [M.S. Thesis]: University of Texas, Austin, Texas, 120 p.
Shuster, E.T. and W.B. White, 1971, Seasonal fluctuations in the chemistry of limestone springs-A possible means of characterizing carbonate aquifers, Journal of Hydrology, v. 14, p. 93-128.
Slade, R., Dorsey, M., and Stewart, S., 1986, Hydrology and water quality of the Edwards Aquifer associated with Barton Springs in the Austin Area, Texas: USGS Water-Resources Investigations Report no. 86-4036, 117 p.
White, W.B., 2007, A brief history of karst hydrogeology: contributions of the NSS. Journal of Cave and Karst Studies, v. 69, no. 1, p. 13–26.
Worthington, S., 1999, A comprehensive strategy for understanding flow in carbonate aquifers: Karst Modeling, Karst Waters Institute Special Publication 5, p. 30-37.

21
Figure 1. Groundwater-flow paths interpretation of Blanco River injections of 2008-2009. Eosine dye was injected at the mouth of Halifax Creek on four separate pulses. Two groundwater flow paths to Barton Springs and one to San Marcos Springs were interpreted based on dye recoveries in wells and delayed arrival of the dyes to Old Mill Springs.

22
Figure 2. Breakthrough of one of four eosine injections at Barton Springs.
Figure 3. Arrival of fluorescein dye from a sinkhole in a Halifax Creek Tributary north of the Blanco River.

23
Figure 4. Barton Springs flow mirrors Blanco River flow loss during low-flow conditions in 1989 and early 1990. Eight intervals were selected to compare flow loss with springflow. The three-month travel time was not factored into the flow comparison.
Figure 5. Comparison of Blanco River flow loss to Barton Springs discharge in 2008 and 2009. Note that Onion Creek was dry during most of this period. Peaks in Barton Springs flow does not appear to correspond to Blanco River flow loss above 40 cfs.

24
Figu
re 6
. Su
lfate
and
chl
orid
e re
latio
nshi
ps in
type
wat
ers.
Dur
ing
low
-flow
con
ditio
ns M
ain,
Eliz
a, a
nd O
ld M
ill S
prin
gs tr
end
tow
ard
Salin
e-W
ater
Zon
e w
ater
type
. Wel
ls in
the
Suns
et V
alle
y G
roun
dwat
er B
asin
that
dis
char
ge fr
om U
pper
Bar
ton
Spri
ngs d
o no
t rec
eive
con
trib
utio
ns fr
om e
ither
the
Salin
e-W
ater
Zon
e or
Bla
nco
Rive
r, bu
t ove
rlap
con
side
rabl
y w
ith T
rini
ty A
quife
r wat
er
type
s (in
dica
ted
by y
ello
w o
val).
Mos
t wat
er w
ells
with
in th
e M
anch
aca
grou
ndw
ater
bas
in d
o no
t rec
eive
Sal
ine-
Wat
er Z
one
cont
ribu
tions
but
follo
w tr
ends
of u
ndis
tingu
ishe
d Tr
inity
Aqu
ifer s
ourc
es su
ch a
s sub
surf
ace
leak
age
from
the
Trin
ity A
quife
r or
Trin
ity A
quife
r spr
ing-
fed
flow
to th
e m
ajor
rech
arge
cre
eks a
nd th
e Bl
anco
Riv
er.

25
Geophysical Correlation of Haby Crossing Fault (Medina County) and Mt. Bonnell Fault (Travis County) and Their Implications on T-E Interconnection
Mustafa Saribudak
Environmental Geophysics Associates, Austin, Texas
Introduction
Resistivity imaging, natural potential (NP), ground conductivity and magnetic surveys were conducted across the Haby Crossing and Mt. Bonnell faults, which are located in eastern Medina County of San Antonio, and Travis County of Austin, respectively (Saribudak et. al, 2010; Saribudak, M., 2010). Both faults are located within the Balcones Fault Zone.
The purpose of the geophysical study is to characterize the subsurface geology, and to determine locations of karst anomalies (caves, subsidence, conduits, and faults/fractures) on either side (up and downthrown) of both faults, and correlate both faults in terms of their significance on the Glen Rose (Trinity) and Edwards Aquifer unit’s interconnectivity (T-E). In this paper, only the geophysical results of resistivity imaging and (NP) surveys are presented. This is due to the page and figure limitations of the proceedings.
Geophysical Methods
Resistivity Imaging (AGI’s Sting/Swift System)
Electrical resistivity imaging is a subsurface imaging technique, which aims to build up a picture of the electrical properties of the subsurface by passing an electrical current along electrodes and measuring the associated voltages. This technique has been used widely in determining karst features, such as voids, caves, and faults/fractures, etc.
In this study, we used an AGI’s Super Sting/Swift system and employed a dipole-dipole resistivity technique with 28 electrodes, which is more sensitive to horizontal changes in the subsurface, and provides a 2-D electrical image of the near-surface geology.
Natural Potential (NP)
Natural electrical currents occur everywhere in the subsurface. In karst investigations we are concerned with the unchanging or slowly varying direct currents (d.c.) that give rise to a surface distribution of natural potentials due to the flow of groundwater within permeable materials. Differences of potential are most commonly in the millivolts range and can be detected using a pair of non-polarizing electrodes and a sensitive measuring device (i.e. a voltmeter). It should be noted that water movement should be present within a cave in order to determine a void or cave location. A cave without the water seepage cannot be detected by the NP method. Positive and negative NP values are attributed to changes in geometry of voids as well as variations in flow conditions. The source of NP anomalies can be also due to changes in topography, changing soil and rock conditions.

26
Interpretation of Geophysical Results
Figure 1A shows the resistivity imaging data taken across the Haby Crossing Fault. Based on the geological information provided by Small and Clark, (2000), geological units present in the field were identified and labeled on the resistivity data figure. The resistivity values of geological units along the profile vary between 2 and 10,000 Ohm-m. The depth of exploration of resistivity data varies between 100 and 125 feet. The resistivity data indicates two faults locationed at 680 and 1080 feet, respectively. Location of the first fault along the resistivity profile corresponds to where the Eagle Ford Group rocks are present. The resistivity values of these rocks vary from 2 to 150 Ohm-m, which corresponds to clay and weathered limestone. The second fault, which is the Haby Crossing Fault, juxtaposes the Eagle Ford Group with the Dolomitic member of Kainer Formation. Underlying the Dolomitic member is the Basal Nodular member and the Upper member of Trinity Aquifer (Glen Rose). Note that there is no significant change between the Basal Nodular member and the Upper member of Trinity Formation.
Figure 1B shows the NP data across the Haby Crossing Fault. The NP data indicates a very significant NP anomaly in the down-thrown of the fault between stations 750 and 850 feet. There are also NP anomalies observed in the up-thrown part of the fault. Note that the NP data also locates the Haby Crossing Fault and correlates well with the resistivity data.
Figure 2 shows the resistivity and NP data taken across the Mt. Bonnell fault at Height Drive and Highway 360 in Austin, Texas. The resistivity data does not indicate a fault anomaly at about 400 feet where the fault is located. In fact there is no resistivity contrast between the Glen Rose and Edwards Aquifer units on either side of the fault. However, the resistivity data indicates a cave anomaly between stations 290 and 335 feet. Resistivity modeling of this karst feature suggests that it is clay or a water-filled cave.
The NP data shows a significant NP anomaly between stations 390 and 450 feet where the Mt. Bonnell fault crosses. This anomaly suggests that there is a groundwater movement across the fault plane. There is also another NP anomaly between stations 290 and 340 feet where the clay-filled cave is located on the resistivity data.
Discussion and Conclusion
Both resistivity and NP results provided invaluable results in assessing the resistivity values of both Glen Rose (Upper Trinity) and Edwards Aquifer units, and locating both faults. Resistivity values of the Glen Rose and Edwards Aquifer do not appear to have significant lateral and vertical in the vicinity of the faults. These results show that both the fault zones include voids, fractures, weathered limestone, and clay layers, which all, except clay, help increase vertical and horizontal permeability of the fault zones. With the presence of karstic features and insignificant resistivity contrasts on both side of the faults, the Haby Crossing and Mt. Bonnell faults can have recharge of rain water directly from the surface and can act as a source of groundwater flow laterally and vertically (Figure 3).

27
References
Small, T.A., and Clark, A.K., 2000, Geologic framework and Hydrogeologic characteristics of the Edwards Aquifer outcrop, Medina County, Texas: U.S. Geological Survey Water-Resources Investigation Report 00-4195, 10p., 1 sheet.
Saribudak, M., Hawkins, A., Saraiva, K., Terez, J., and Stoker, K., 2010, Geophysical Signature of Haby Crossing Fault and its implication on Edwards Recharge Zone, Medina County, Texas: South Texas Geological Society Bulletin, February issue.
Saribudak, M., 2010, Urban Geophysics: A mapping of Mount Bonnell Fault and its karstic features in Austin, Texas, 2010 SAGEEP Proceedings International Convention, Keystone, CO.
Basal Nodular Member.
Upper Member-Trinity
HCF1A
1B
Figure 1. Resistivity (1a) and NP data (1b) across Haby Crossing fault in Medina County, San Antonio.

28
250 271 292 313 334 355 376 397 418 439 Ft Ohm-m
NW SE
250 300 350 400 450
mV
Resistivity Data
Ft
NP Data
Glen Rose Edwards Aquifer
NP anomaly
MBF
Clay-filled cave
Figure 2. Resistivity and NP data across the Mt. Bonnell Fault at Height Drive and Hwy. 360 in Travis County, Austin.

29
Mt. Bonnell Fault
?
Karsticfeatures Ka
GRuGRl
Haby Crossing Fault
EfKaGRu
Karsticfeatures
Figure 3. Schematic geologic cross-sections showing the karstic features across the fault zones and potential lateral and vertical water movement (white arrows) between Glen Rose and Edwards Aquifer units. [Ef = Eagle Ford formation; Ka = Kainer formation; GRu = Upper Glen Rose formation; GRl = Lower Glen Rose formation]

30
Edwards Aquifer – Upper Glen Rose Aquifer Hydraulic Interaction
R.T. Green1, F.P. Bertetti1, and M.O. Candelario2 1Geosciences and Engineering Division, Southwest Research Institute, San Antonio, Texas;
2Stimson Middle School, San Antonio, Texas
Currently, Texas Commission on Environmental Quality (TCEQ) regulations on the Edwards Aquifer Contributing Zone are limited, especially when compared with those for the Edwards Aquifer Recharge Zone. The rules are predicated on the premise that no water from the Contributing Zone directly recharges the Edwards Aquifer and that the role of the Contributing Zone is solely to convey surface water to the Edwards Aquifer Recharge Zone where it can then enter the subsurface.
In reality, the Edwards Aquifer is significantly recharged by water infiltrating the Contributing Zone. This infiltrated water is then conveyed to the Edwards Aquifer from the Trinity Aquifer by interformational flow. Recent studies support the supposition that hydraulic communication between the upper Glen Rose Aquifer (i.e., the upper most unit of the Trinity Aquifer) and the Edwards Aquifer is greater than previously believed. Because of this high level of hydraulic communication, the distinction between the Contributing Zone and the Recharge Zone of the Edwards Aquifer is not great, and in many localities, the Edwards Aquifer Contributing Zone effectively acts to recharge the Edwards Aquifer in a fashion indistinguishable to the Edwards Aquifer Recharge Zone.
There is ample evidence to support this refined conceptualization and virtually no evidence that suggests otherwise. Tracer tests have demonstrated that groundwater from the upper Glen Rose Aquifer can flow rapidly to the Edwards Aquifer crossing large faults in the process (Veni, 2004; Schindel and Johnson, 2005). Rapid recharge into river and stream beds and into karst features in the Edwards Aquifer Contributing Zone near the Edwards Aquifer Recharge Zone indicates that the upper portion of the Glen Rose Aquifer exhibits hydraulic properties similar to the permeable portions of the Edwards Aquifer (Ferrill et al., 2008; Schindel and Johnson, 2005; Veni, 2004). As a result, surface water flow in streams is often recharged into the subsurface in the Contributing Zone well before the streams and rivers enter the Recharge Zone. This attribute is seen in many rivers and streams that cross the San Antonio segment of the Edwards Aquifer (Figure 1) (Slade et al., 2002). Refined assessment of faulting along the Balcones Fault Zone (Ferrill et al., 2004, 2005, 2008) suggests that these faults do not impede cross flow as originally postulated by Maclay and Small (1983) and Maclay and Land (1988).
A gain/loss study was conducted October 2, 2010 on the reach of Helotes Creek located immediately upstream from the Edwards Aquifer Recharge Zone. The study entailed flow measurements at six locations where Helotes Creek overlies the upper Glen Rose Aquifer (Figure 2). Flow measurements ranged from 0.94 cubic feet per second (cfs) at the most upgradient location (3.6 km upstream from the Recharge Zone), increased to a maximum of 4.24 cfs at approximately 2.4 km upstream from the Recharge Zone, then decreased to no flow at a distance of approximately 0.25 km upstream of the Recharge Zone (Figure 3). Flow in this reach

31
of Helotes Creek occurred at a time when no flow was recorded in Helotes Creek where it enters the Edwards Aquifer Recharge Zone (Figure 4).
Lastly, a refined water budget assessment of the Uvalde sub-basin of the Edwards Aquifer indicates that interformation flow from the Trinity Aquifer has to be greater than previous estimates for the water budget of the Uvalde sub-basin to be balanced (Green et al., 2009). Recharge calculations based on a river gauge located on the Nueces River at the boundary of the Edwards Aquifer Contributing and Recharge Zones do not account for recharge that occurs upstream of the gauging station (Hamilton et al., 2007).
As a consequence of these recent studies and related assessments, the abrupt distinction currently assigned to the hydraulic transition of the Edwards Aquifer Contributing Zone to the Edwards Aquifer Recharge Zone is not accurate. Evidence cited here strongly indicates that the upper Glen Rose Aquifer performs similarly to the permeable portions of the Edwards Aquifer and that significant recharge of the Edwards Aquifer occurs in the Contributing Zone, up gradient to the Recharge Zone.
This evidence supports the premise that the Edwards Aquifer Contributing Zone is more hydraulically connected with the Edwards Aquifer Recharge Zone than reflected by the TCEQ Edwards Aquifer rules. The rules need to be changed to better protect the Edwards Aquifer by protecting the Contributing Zone. This means extending Recharge Zone protections into the Contributing Zone, otherwise, lack of protection of the Contributing Zone renders protections of the Recharge Zone ineffective.

32
Figure 1. Compilation of gain/loss measurements in the greater Edwards Aquifer region. Red dots denote loss of flow from rivers to the subsurface. Green dots denote gain. Data are from Slade et al. (2002).
Figure 2. Location of a gain/loss study conducted on Helotes Creek in the Edwards Aquifer Contributing Zone on October 2, 2010 at a time when there was flow in Helotes Creek in the Contributing Zone, but that all flow had infiltrated the Glen Rose Formation prior to arriving at the Edwards Aquifer Recharge Zone.

33
Figure 3. River flow measurements made during the Helotes Creek gain/loss study conducted on October 2, 2010. Flow measurements were made at six locations denote by blue triangles.

34
Figure 4. River flow recorded by the U.S. Geological Survey at location 08181400 on Helotes Creek located approximately 100 m upstream from the Edwards Aquifer Recharge Zone.
References
Ferrill, D.A., Sims, D.W., Waiting, D.J., Morris, A.P., Franklin, N., and Schultz, A.L., 2004, Structural Framework of the Edwards Aquifer Recharge Zone in South-Central Texas, GSA Bulletin, Volume 116, No. 3/4, p. 407-418.
Ferrill, D.A., Sims, D.W., Franklin, N., Morris, A.P., and Waiting, D.J., 2005, Structural Controls on the Edwards Aquifer/Trinity Aquifer Interface in the Helotes Quadrangle, Texas, Consultants report for the Edwards Aquifer Authority.
Ferrill, D.A., Morris, A.P., Sims, D.W., Green, R.T., Franklin, N., and Waiting, D.J., 2008, Geologic Controls on the Interaction Between the Edwards and Trinity Aquifers, Balcones Fault System, Texas, STGS Bulletin, April 2008, p. 21-45.
Green, R.T., F. P. Bertetti, and R.N. McGinnis. 2009. Investigation of the Secondary Aquifers in Uvalde County. Southwest Research Institute. Contract project conducted for the Uvalde County Underground Water Conservation District. 74 p.
Hamilton, J.M., S. Johnson, J. Mireles, R. Esquilin, C. Burgoon, G. Luevano, D. Gregory, R. Gloyd, J. Sterzenback, and R. Mendoza. 2008. Edwards Aquifer Authority Hydrologic Data Report for 2007. Edwards Aquifer Authority: San Antonio, Texas. 229 p.

35
Maclay, R.W., and Small, T.A., 1983, Hydrostratigraphic Subdivisions and Fault Barriers of the Edwards Aquifer, South-Central Texas, U.S.A., Journal of Hydrology, Volume 61, p. 127-146.
Maclay, R.W., and Land, L.F., 1988, Simulation of Flow in the Edwards Aquifer, San Antonio Region, Texas, and Refinements of Storage and Flow Concepts, U.S. Geological Survey Water-Supply Paper 2336, 48 p.
Schindel, G., Johnson, S., and Veni, G., 2005, Tracer Tests in the Edwards Aquifer Recharge Zone, Geological Society of America Abstracts with Programs, Volume 37, No. 7, p. 216.
Slade, Jr., R.M., Bentley, J.T., and Michaud, D., 2002, Results of Streamflow Gain-Loss Studies in Texas, with Emphasis on Gains From and Losses to Major and Minor Aquifers, U.S. Geological Survey Open-File Report 02-068.
Veni, G., 2004, Multidisciplinary Karst Research on a Military Reservation: Camp Bullis, Texas, Geological Society of America Abstracts with Programs, Volume 36, No. 5, p. 191.

36
Interaction Between the Hill Country Portion of the Trinity and Edwards Aquifers: Model Results
Ian C. Jones Texas Water Development Board
Estimation of groundwater flow between the Hill Country portion of the Trinity Aquifer and the Barton Springs and San Antonio segments of the Edwards Aquifer is based on results from a calibrated groundwater flow model — the Groundwater Availability Model for the Hill Country portion of the Trinity Aquifer System (Jones and others, 2009). This model simulates groundwater flow through most of the Hill Country portion of the Trinity Aquifer and the adjoining eastern margin of the Edwards-Trinity (Plateau) Aquifer. Model results indicate that almost all inflow into the Hill Country portion of the Trinity Aquifer occurs as infiltration of precipitation. Most discharge from the aquifer occurs through river baseflow to the major rivers that cross the aquifer — including the Pedernales, Guadalupe, Blanco, and Medina rivers — and cross-boundary flow to the Edwards Aquifer.
Figure 1 shows calculated net cross-boundary flow from the Hill Country portion of the Trinity Aquifer to the Barton Springs and San Antonio segments of the Edwards Aquifer along three zone, (1) Bandera, Uvalde, and Medina counties, (2) Bexar and Comal counties, and (3) Hays and Travis counties. In these zones, net cross-boundary discharge ranges from 350 to 2,400 acre-feet per year per mile of aquifer boundary in the northern and central zones, respectively. These discharge values represent simulated 1997 discharge, but similar patterns occur in different simulated years.
The distribution of cross-boundary flow can be explained by a combination of groundwater flow direction and hydraulic conductivity. In the Hays-Travis counties zone, groundwater flow is mostly to the northeast — towards the Colorado River and subparallel to the Trinity-Edwards boundary. The relatively low cross-boundary flow in this zone can be explained by groundwater flow being diverted towards the Colorado River and away from the Edwards Aquifer. In the other two zones, groundwater flow is generally towards the Trinity-Edwards boundary. The difference between these zones is that the Bexar-Comal counties zone lies within the Balcones Fault Zone and is therefore simulated with a higher hydraulic conductivity than the Bandera-Medina-Uvalde counties zone. The higher hydraulic conductivity allows for more groundwater flow across the Trinity-Edwards boundary.
References
Jones, I, Anaya, R., and Wade, S., 2009, Groundwater Availability Model for the Hill Country Portion of the Trinity Aquifer System, Texas, unpublished Texas Water Development Board Report, 191 p.

37
Figure 1. Estimated net groundwater flow between the Trinity and Edwards aquifers. The numbers represent discharge expressed in acre-feet per year per mile of aquifer boundary.

38
Using Tracer Testing Data for Resource Management Planning
Geary Schindel and Steve Johnson Edwards Aquifer Authority
This report presents the findings of investigations by the Edwards Aquifer Authority (Authority) of groundwater flowpaths, velocities, and hydrostratigraphy in the Panther Springs Creek groundwater basin, northern Bexar County, Texas.
The Authority injected nontoxic organic dyes into six caves within the San Antonio segment of the Edwards Aquifer to trace groundwater flowpaths and measure groundwater-flow velocities (Figure 1). The monitoring array consisted of 32 public and private wells, including irrigation wells at the Club at Sonterra, Bexar Metropolitan Water District public water supply wells in the Hollywood Park area, and Authority monitor wells. The wells were completed in either the Edwards or the Trinity aquifers.
Results of tracer tests revealed discrete groundwater flowpaths near Panther Springs Creek. Dyes were detected primarily in well 68-28-608 and at lower concentrations in seven other wells. Groundwater velocities to well 68-28-608 ranged from 1,134 to 5,300 meters per day (m/d). Velocities to the seven other wells where dye was detected ranged from 13 to 2,330 m/d. Results demonstrate the rapid groundwater velocities that are characteristic of karst aquifers and also demonstrate that groundwater flows freely between injection points in the upper member of the Glen Rose Formation (the hydrostratigraphic unit that comprises the Upper Trinity Aquifer) and detection points in the Edwards Aquifer. Dye was injected into Boneyard Pit and Poor Boy Baculum Cave, which penetrate approximately 40 m of unsaturated Edwards Limestone, then into the upper member of the Glen Rose Formation. Blanco Road Cave probably extends through the Edwards Limestone to the Glen Rose Formation, although the full vertical extent of Blanco Road Cave could not be entered. Seven of the wells where dye was detected are completed in the Edwards Aquifer, and one is completed in the Trinity Aquifer. Dyes traveling along flowpaths between caves and wells crossed several northeast-southwest-trending faults in which members of the Edwards and Glen Rose formations are juxtaposed. Faults with up to 104 m of vertical displacement did not impede groundwater flow. Consequently, tracer tests demonstrate excellent communication between groundwater in the Upper Trinity Aquifer and the Edwards Aquifer in the study area. One trace was also initiated through a 1-m2 site thinly covered by soil in an interstream upland area with no observable karst features such as sinkholes, dissolutioned fractures, or caves. Dye was injected in this site followed by 180,000 L of water (at an average rate of 250 L per hour) over a one-month period. Dye was subsequently detected in two wells. This trace demonstrates that vulnerability to contamination is not limited to recognizable karst landforms such as caves and sinkholes.
The study revealed the three-dimensional groundwater flow system in the Edwards Aquifer in the Panther Springs Creek area. Groundwater flowpaths shift laterally and vertically in response to changing aquifer conditions (Figure 2). Rapid groundwater velocities (>100 m/d) is typical in karst aquifers. Finally, this study demonstrates that large and diverse data sets are required for an

39
adequate characterization of karst aquifers, including tracer tests, hydrophysical surveys, continuous water level measurements, cave mapping, and high-frequency water sampling.
Figure 1. Map showing regional geology, monitor wells, and dye trace results.

40
Figure 2. Cross section showing stratigraphy and estimated dye trace paths.

41
Demonstrating Interconnection Between a Wastewater Application Facility and a First Magnitude Spring in a Karstic Watershed:
Tracer Study of the Tallahassee, Florida Treated Effluent Spray Field 2006-2007
Todd R. Kincaid1, Gareth J. Davies2, Christopher L. Werner3, and Rodney S. DeHan4
1GeoHydros, LLC, Reno Nevada; 2Cambrian Ground Water Co., Oak Ridge, Tennessee; 3Woodville Karst Plain Project, Houston Texas; 4Florida Geological Survey,
Tallahassee, Florida
Adapted from: Same Title, Report of Investigation RI 111, Florida Geological Survey, in print
Overview
The City of Tallahassee’s SE Spray Field (SESF) receives secondarily treated wastewater and disperses it onto the land surface via center-pivot irrigators at an average rate of approximately 17 million gallons per day (City of Tallahassee, 2007). The system is intended to provide nutrient removal through plant uptake from the infiltrating water. It became operational in 1981, encompassing 1000 acres and was expanded in 1982 to 1500 acres, 1986 to 1896 acres, and 1999 to 2,159 acres (Chelette et al, 2002). Nitrate levels in groundwater monitoring wells installed in the upper Floridan Aquifer beneath the SESF increased precipitously after the SESF became operational rising from ~0.5 mg/L in 1980 to as much as 10 mg/L in the 1990’s and stabilizing at ~6 mg/L by 2000 (Chelette et al, 2002).
During the same period, nitrate levels measured at Wakulla Spring rose from ~0.2-0.3 mg/L between 1971 and 1976, to >1.0 mg/L in the late 1980’s, to ~0.7-0.8 mg/L between 1998 and 2000 (Chelette et al, 2002). The increased nitrate levels are thought to be the primary cause of algae growth and enhanced hydrilla growth that have resulted in significant harm to the ecosystems supported by Wakulla Spring and the Wakulla River (Hand, 2005).
Given the apparent correlation between nitrate increases in Wakulla Spring and in Floridan Aquifer groundwater beneath the SESF, considerable attention became focused on the SESF as the primary source of nitrate contamination to the spring by 2000. Further attention was directed toward the SESF when Chelette and others (2002) reported nutrient budget calculations for the St Marks and Wakulla River Watersheds that attributed 40% of the nitrate loading in the Wakulla Springs contributory area to the SESF.
In response to growing concerns about the fate of nitrates released to the Floridan aquifer from the SESF, the City of Tallahassee approved a three-year study with the US Geological Survey to, in part, develop of model of nitrate transport through the upper Floridan Aquifer. In concert with that effort, the Florida Department of Environmental Protection and the Florida Geological Survey commissioned Hazlett-Kincaid, Inc. to perform a groundwater tracing study to identify potential groundwater flow paths and velocities between the SESF and down-gradient springs.

42
Tracer injections were performed in three wells across the northern side of the SESF and one sinking stream located on the southeastern side of the property (Figure 1). Water samples were subsequently collected from ten wells and eleven natural discharge points for between two and fourteen months and analyzed in a laboratory for the presence and relative amount of the injected tracers. Sampling for the fluorescent dyes was also conducted at two of the wells, Wakulla B-Tunnel, and the St. Marks River upstream of its disappearance with insitu filter fluorometers (IFF).
One or more of the fluorescent dyes was detected at five of the wells and five of the springs (Figures 2 & 3). The springs at which the fluorescent dyes were detected include: Wakulla Spring, Sally Ward Spring, Indian Spring, and one or more of the small springs contributing to flow in McBride’s Slough. The fastest travel times to those springs established by fluorescent tracer breakthrough curves ranged from approximately 28-66 days after the injections with subsequent smaller pulses of tracer-laden water arriving at Wakulla and McBride’s Slough as late as approximately one year after the injections. Very minor quantities of fluorescent compounds that fluoresce in the same range as the injected tracers were detected at Monroe Spring and the St. Marks River Rise but not enough to be confident that our tracers were recovered at those locations. None of the fluorescent tracers were detected at in the St. Marks River at Natural Bridge, Rhodes Spring, or Newport Spring.
References
Chelette, A., Pratt, T. R., and Katz, B. G., 2002. Nitrate loading as an indicator of nonpoint source pollution in the lower S. Marks-Wakulla Rivers watershed: Water Resources Special Report 02-1, Northwest Florida Water Management District, Havana, Florida, 138 p.
City of Tallahassee, 2007. The Southeast Farm Wastewater Reuse Facility, accessed from http://www.talgov.com/you/water/sefarm.cfm
Hand, J. 2005. Nitrate & Hydrilla at Wakulla Spring, Untitled presentation, Solving Water Pollution Problems in the Wakulla Springshed of North Florida; Hydrogeology Consortium Workshop http://www.geohydros.com/FGS/ HC_Workshops/2005_WS_Workshop/

43
AR87 injection in Turf Pond Sink AY73 siphon injection at well SE06
Figure 1. Photos of the dye injections that occurred at a swallet and monitoring wells located within the City of Tallahassee’s waste water spray field.
Figure 2. Traced groundwater flow paths from the City of Tallahassee’s waste water spray field to Wakulla, Indian, Sally Ward, and McBrides springs, north Florida.

44
Figure 3. Uranine Dye (AY73) recovery curves for Indian Spring (IS), Sally Ward Spring (SWS), Wakulla B-Tunnel (WKB), Wakulla Vent (WKV), and McBride’s Slough (MBE) resulting from dye injections performed at the City of Tallahassee’s waste water spray field.

45

Fossils commonly found in the Glen Rose Limestone (Hill and Vaughan, 1901).