proceeding of adaptation and generation of agricultural
TRANSCRIPT
i
Proceeding of Adaptation and Generation of Agricultural Technologies IQQO AGP-II
ii
Proceeding of Adaptation and Generation of Agricultural Technologies IQQO AGP-II
Oromia Agricultural Research Institute, Workshop proceeding for completed
research activities of Adaptation and Generation of Agricultural Technologies
Correct citation: Dagnachew Lule, Chemeda Daba, Belete Shenkute, Kamil Ahimed,
Zerihun Abebe, Kefyalew Asefa, Tadele Tadesse and Tesfaye Letta (eds.), 2017. Oromia
Agricultural research institute workshop proceeding on Adaptation and Generation of
Agricultural Technologies, 27-30 April 2017, Adama, Ethiopia 173pp
Copyright © 2017 Oromia Agricultural Research Institute (IQQO). All Rights Reserved. Tel:
+251-114707102/+251-114707118. Fax: +251-114707127/4707126, P.O. Box: 81265, Email:
[email protected], website: http://www.iqqo.org, Addis Ababa, Ethiopia.
Donor partners
iii
Proceeding of Adaptation and Generation of Agricultural Technologies IQQO AGP-II
ACKNOWLEDGEMENTS
The authors would like to thank the World Bank and other donor partners for
funding the research work, the workshop and also publishing this proceedings.
Oromia Agricultural Research Institute, the respective research centers and staff
members are cordially acknowledged for supporting, hosting and executing the
research works. All authors of the references cited in each manuscript are duly
acknowledged.
iv
Proceeding of Adaptation and Generation of Agricultural Technologies IQQO AGP-II
Preface
Realizing the key role that it plays in the national economy, the Ethiopian government has
given due emphasis to the agricultural sector development. The Agricultural and Rural
Development Policy and Strategy of the country which was designed nearly a decade and half
ago,has highly emphasized the important role of agriculture as a means of ensuring rapid
economic growth, enhancing benefits to the people, eliminating food aid dependency, and
promoting the development of amarket-oriented economy. Guided by this national policy and
strategy, different consecutive national plans, programs and projects focusing on the
development of the agriculture sector has been implemented and is being implemented
throughout the country. Among such programs, the Agricultural Growth Program (AGP-II) is
one and perhaps the biggest World Bank and other donors supported project launched to
support agriculture research and development.
The AGP-II project which is currently under implementation is providing financial supports
to the agricultural research and extension both at national and regional levels. The project has
four components of which the research component is one. The aim of the research component
is to adapt or generate agricultural technologies, undertake pre-extension demonstration of
proven technologies, produce source technologies that would serve as a base for large scale
technology multiplication and enhance capacity of the research systems to improve
technology supply.
Being one of the implementing institutions, the Oromia Agricultural Research Institute
(IQQO) is conducting various technology adaptation and generation, pre-extension
demonstrations, source technology multiplication and capacity building activities. Of the total
technology adaptation/generation and pre-extension demonstrations conducted in 2016/17
cropping seasons 23 technology adaptation/generation and 14 pre-extension demonstration
activities have been completed and their results are by now ready for use.This workshop is
organized with the purpose of reviewing research findings related to pre-extension
demonstration of improved agricultural technologies. The workshop involves researchers
from different disciplines, research directors and other relevant stakeholders.
Asefa Ta’a (PhD)
Deputy Director General
Oromia Agricultural Research Institute

v
Proceeding of Adaptation and Generation of Agricultural Technologies IQQO AGP-II
TABLE OF CONTENTS
CROP TECHNOLOGIES .................................................................................. 1
Registration of “Bulala” a Newly Released Durum Wheat (Triticum durum L.) Variety for Mid and
Highland Areas of Bale Zone .............................................................................................................. 1
Registration of ‘Walin’ (BG-004-1) Sesame (Sesamum indicum L.) Variety ..................................... 7
The development and registration of “Alloshe”, faba bean variety for the highlands of Bale,
Ethiopia .............................................................................................................................................. 11
Participatory Variety Selection of Food Barley (Hordeum vulgare L.) Varieties at Dugda and Lume
Districts of East Shoa zone ............................................................................................................... 19
Grain yield stability and agronomic performance of tef genotypes in western Oromia .................... 24
Participatory Variety Selection of Bread Wheat (Triticum aestivum L.) Varieties at Dugda and
Lume districts of East Shoa zone ....................................................................................................... 31
Participatory variety selection of Chickpea (Cicer arietinum L.) varieties at Dugda Districts, mid rift
valley of East Shoa zone, Oromia. ..................................................................................................... 37
Effect of Different Weed Management Practices on Growth, Yield and Yield Components of Faba
Bean (Vicia faba L.) in Bale Highland Conditions, Southeastern Ethiopia ....................................... 44
The Effect of Pre-emergence Herbicide (dual gold) and Hand Weeding Frequencies on Growth,
Yield and Yield components of faba bean in Bale highlands ............................................................ 61
Adaptation Study of Released Potato (Solanum tuberosum L.) Varieties for Mid-altitudes of West
and Kelem Wollega Zones ................................................................................................................. 73
Milling and Bread-making Traits Associated with Grain Hardness in Ethiopian Bread Wheat
Varieties Grown under Bale Condition ............................................................................................. 83
LIVESTOCK ...................................................................................................... 96
The development of “Degagsa and Belebas” Pigeon pea (Cajanus cajan) varieties for western
Oromia ............................................................................................................................................... 96
Effect of planting season and stage of harvesting on forage yield and quality of oats varieties in the
highland of Bale ............................................................................................................................... 105
Effect of planting season and stage of harvesting on forage yield and quality of Vetch varieties in
the highland of Bale, Ethiopia ......................................................................................................... 117
Evaluation of effective microbe treated barely straw supplemented with bypass protein as
intervention diet for cross breed dairy animal under small scale farmer’s condition ...................... 127
AGRICULTURAL ENGINEERING ............................................................ 139
On farm evaluation and verification of tef grain and chaff separator machine ............................... 139
Adaptation and Verification of Improved Row Crop Cultivator for Equine Animals ..................... 146
Participatory on Farm Evaluation and Verification of Poultry Feed Mixer .................................... 152
Adaptation and verification of wheat row planter for Equine animals ............................................ 158

vi
Proceeding of Adaptation and Generation of Agricultural Technologies IQQO AGP-II
Adaptation and Verification of Spike Tooth Harrow for Pack Animals.......................................... 167
NATURAL RESOURCE MANAGEMENT ................................................. 172
Verification of Soil test based crop response phosphorous recommendation for Teff at Omo Nada
district, western Oromia ................................................................................................................... 172
Verification of soil test based crop response phosphorus calibration on maize (Zea mays) at Wayu-
Tuka district, Western Oromia......................................................................................................... 180
Evaluation of Different Drainage System on Grain Yield of Bread Wheat in the Waterlogged
Vertisol of Adaba & Agarfa District, southeast Ethiopia ............................................................... 189
Moisture Conservation and Management Practices on Yield and yield components of Maize in the
Dry land of Bale, Southeastern Ethiopia ......................................................................................... 197

1
Proceeding of Adaptation and Generation of Agricultural Technologies IQQO AGP-II
CROP TECHNOLOGIES
Registration of “Bulala” a Newly Released Durum Wheat (Triticum durum
L.) Variety for Mid and Highland Areas of Bale Zone
Mulatu Aberra *, Tilahun Bayisa, Tesfaye Letta, Mohammed Abinasa and Ayalneh Tilahun
Oromia Agricultural Research Institute, Sinana Agricultural Research center, Bale-Robe,
Ethiopia
*Corresponding author: [email protected]
Abstract
Bulala is a name given to a newly released durum wheat variety released by Sinana
Agricultural Research Center in 2016/17 from a selection made among durum wheat
germplasm introduced from ICARDA. Seventeen durum wheat genotypes were tested along
with three standard checks for two years (2012 and 2013) at four locations (Sinana, Agarfa,
Ginir and Gololcha) of high lands of Bale. The combined analysis of yield data across years
and locations showed that, Bulala gave highest mean yield (5641.5 kg/ha) as compared to the
remaining test entries. Moreover, Bulala showed more stable grain yield performance,
disease resistance, uniformity, high protein and gluten content, , high biomass and and also
early maturing than checks (Tate, Toltu and Ingilize). During variety verification trial, these
variety was the most preferred varieties by the farmers as compared to the checks in the
trial.It was evaluated both on farmer’s field and on research station during variety
verification trial along with checks (Dire and Ingilize) during 2016 cropping season and was
officially released in 2017 for durum wheat growing areas of Bale.
Keywords: Durum Wheat, Grain Quality, Protein Content, Disease Reaction
2
Proceeding of Adaptation and Generation of Agricultural Technologies IQQO AGP-II
Introduction
Durum wheat (Triticum durum L.) is the second most cultivated wheat in the world next to
bread wheat (Peña and Pfeiffer, 2005). It is indigenous to Ethiopia and it has been under
cultivation since ancient times. It is traditionally grown on heavy black clay soils (Vertisols)
of the central and northern highlands of Ethiopia between 1800-2800 meters above sea level.
Durum is the hardest of all wheat. Its density, combined with its high protein content and
gluten strength makes it the preferred choice for producing pasta products. Pasta made from
durum wheat is firm with consistent cooking quality. The dough is less elastic than bread
dough’s, but this makes it easier to roll into pasta shapes. Semolina of durum wheat is the
preferred raw material for the production of high quality pasta due to its unique color, flavor
and cooking quality. Pasta is a popular wheat-based food worldwide, due to its convenience,
palatability and nutritional value (Aravind et al., 2011).
In Ethiopia, durum wheat is consumed as leavened bread, common bread, macaroni,
spaghetti, biscuits, pastries, and in various indigenous food preparation. The straw is mainly
used for cattle feed and for fuel at times of scarcity (MANR, 2016). However, the
productivity of durum wheat in the country is very low compared to world average. This is
due to lack of improved variety, low cultural practices, moisture stresses, and other biotic and
abiotic factors. Rust is among the major problem limiting durum wheat productivity in
Ethiopia. Thus, it is crucial for breeders to develop and recommend the right variety for
commercial production in the target agro ecologies.
Variety origin and evaluation
Bulala was originally introduced from abroad through ICARDA. A number of durum wheat
genotypes along with checks were tested at different breeding stages starting from observation
nursery. Seventeen pipeline durum wheat varieties were evaluated against three standard
checks (Tate, Toltu and Ingilize) for two years (2012 and 2013) at Sinana, Agarfa, Ginir and
Gololcha of Bale high land.
3
Proceeding of Adaptation and Generation of Agricultural Technologies IQQO AGP-II
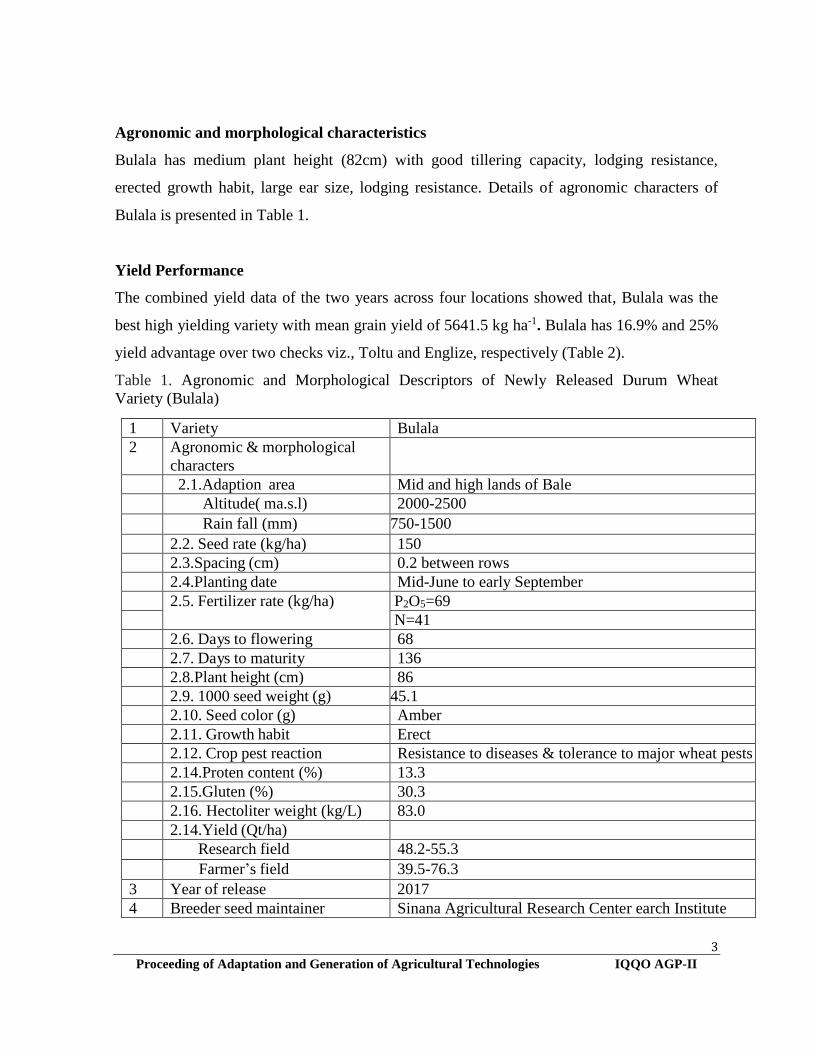
Agronomic and morphological characteristics
Bulala has medium plant height (82cm) with good tillering capacity, lodging resistance,
erected growth habit, large ear size, lodging resistance. Details of agronomic characters of
Bulala is presented in Table 1.
Yield Performance
The combined yield data of the two years across four locations showed that, Bulala was the
best high yielding variety with mean grain yield of 5641.5 kg ha-1. Bulala has 16.9% and 25%
yield advantage over two checks viz., Toltu and Englize, respectively (Table 2).
Table 1. Agronomic and Morphological Descriptors of Newly Released Durum Wheat
Variety (Bulala)
1 Variety Bulala
2 Agronomic & morphological
characters
2.1.Adaption area Mid and high lands of Bale
Altitude( ma.s.l) 2000-2500
Rain fall (mm) 750-1500
2.2. Seed rate (kg/ha) 150
2.3.Spacing (cm) 0.2 between rows
2.4.Planting date Mid-June to early September
2.5. Fertilizer rate (kg/ha) P2O5=69
N=41
2.6. Days to flowering 68
2.7. Days to maturity 136
2.8.Plant height (cm) 86
2.9. 1000 seed weight (g) 45.1
2.10. Seed color (g) Amber
2.11. Growth habit Erect
2.12. Crop pest reaction Resistance to diseases & tolerance to major wheat pests
2.14.Proten content (%) 13.3
2.15.Gluten (%) 30.3
2.16. Hectoliter weight (kg/L) 83.0
2.14.Yield (Qt/ha)
Research field 48.2-55.3
Farmer’s field 39.5-76.3
3 Year of release 2017
4 Breeder seed maintainer Sinana Agricultural Research Center earch Institute

4
Proceeding of Adaptation and Generation of Agricultural Technologies IQQO AGP-II
Table 2. Mean grain yield, agronomic performance and disease reactions of 20 durum wheat genotypes tested in durum wheat
regional variety trial combined over four locations for years 2012 and 2013
SN Code of genotypes Agronomic and disease data
1
DW ICARDA -01
DH‡ DM‡ PH‡ TKW‡ TW GY‡ SR YR LR
71 136 85.6 43.1 83.6 4704.9 15s 5ms 5ms
2 DW ICARDA -02 70 136 85.0 40.0 83.1 4631.8 10ms 0 15s
3 DW ICARDA -03 69 134 87.7 43.5 83.7 5269.2 15ms trmr 10ms
4 DW ICARDA -04 70 136 87.2 44.2 83.7 5131.6 15s 5mr 5ms
5 DW ICARDA -05 74 137 82.2 44.8 81.8 5330.8 5ms 0 5ms
6 DW ICARDA -06 73 136 81.7 43.8 82.5 4887.8 10ms 0 10ms
7 Durum ICARDA/EthiopiaPDYT-322 68 136 86.6 44.4 82.8 5641.5 10ms 5mr 5ms
8 DW ICARDA -08 67 134 86.6 43.6 83.5 4613.0 5ms 0 5ms
9 DW ICARDA -09 68 135 78.8 46.2 81.5 4575.2 10ms trmr 10ms
10 DW ICARDA -10 67 137 87.4 47.7 82.4 4624.1 5ms 5mr 5ms
11 Durum ICARDA/Ethiopia SR.R-6 68 133 81.4 40.8 83.1 5391.3 10mr 5mr 10ms
12 DW ICARDA -12 67 135 86.7 47.1 82.6 4651.3 5ms trmr 5ms
13 DW ICARDA -13 66 134 86.8 50.9 81.9 4721.5 5ms trmr 5ms
14 DW ICARDA -14 67 137 88.0 50.4 83.3 4660.5 10ms 0 10ms
15 DW ICARDA -15 68 135 82.8 47.9 83.0 4641.1 10ms 5mr 10ms
16 DW ICARDA -16 67 135 88.2 48.3 83.2 4384.5 5ms 5mr 10ms
17 DW ICARDA -17 67 134 86.6 44.1 82.9 4622.5 5ms 0 10ms
18 Tate 70 136 87.0 44.4 83.2 5278.7 15s trmr 10ms
19 Toltu (standard check) 69 133 79.5 40.5 83.2 4995.6 10ms 5mr 5ms
20 Englize (Local check) 67 135 110.7 44.3 82.7 4609.7 10ms trms 15s
Mean 69 135 86.3 45.0 82.9 4868.3
CV (%) 1.9 1.6 5.3 5.3 3.0 12.9
SE 0.26 0.43 0.94 0.48 0.51 127.72
LSD (5%) 0.73 1.21 2.62 1.34 ns 355.39
Note: DH= days to heading, DM= days to maturity, PH= plant height (cm), TKW= thousand kernel weight (gm), TW= test weight (kg/hl),
GY= grain yield (kg/ha), SR= stem rust (%), YR= yellow rust (%), LR= leaf rust (%), S= Susceptible, ms= moderately susceptible, mr=
Moderately resistant, TR: Trace, Trms: Trace with moderately susceptible, Trmr: Trace with moderately resistant, R: resistant, CV(%):
Coefficient of variations, SE: standard error of the mean, LSD: Least significant differences
5
Proceeding of Adaptation and Generation of Agricultural Technologies IQQO AGP-II
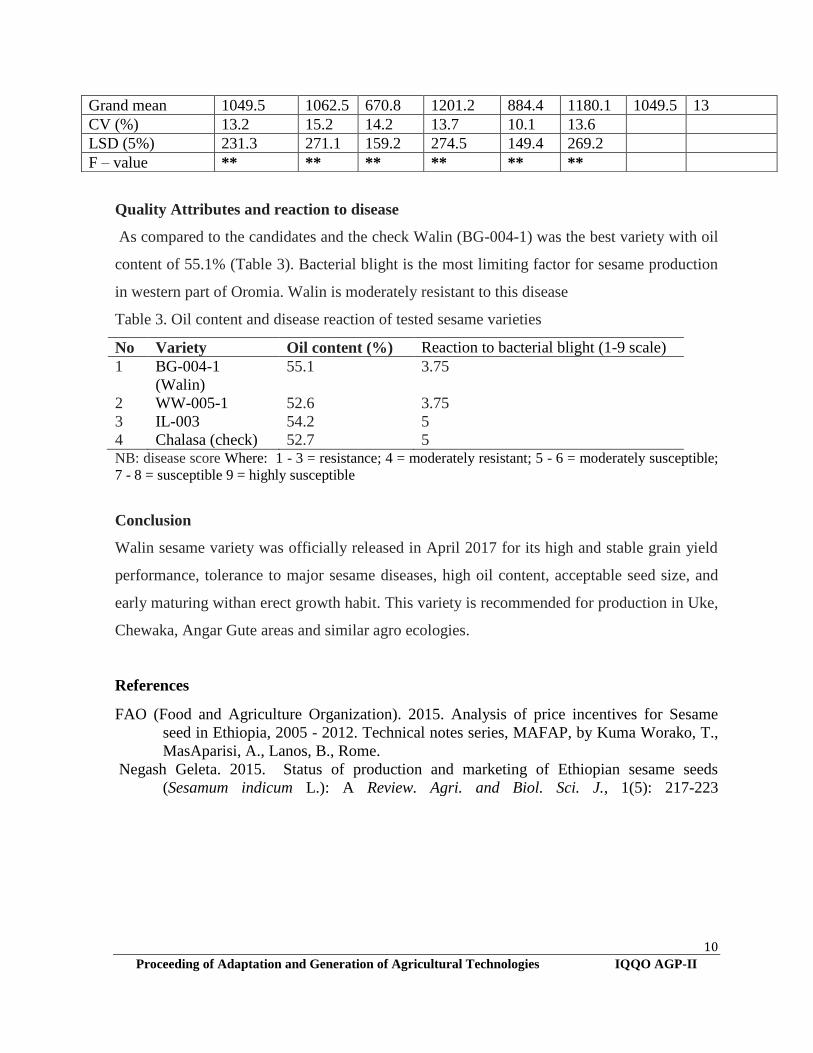
Quality Characteristics
Bulala has higher protein (13.3%) and gluten (30.3%) content than the standard check,
indicating that it has good pasta making quality. Its seed color is also good and preferred by
consumers. Detail data are given in Table 3.
Reaction to diseases
The major durum wheat disease according to their importance in the growing area is rusts
(yellow, stem and leaf rusts). Disease data across locations and years were scored.
Accordingly, Bulala showed 5mr % reaction to both stemand yellow rustst and tms % to leaf
rust during verification trial in the season 2016 (Table 3). Over all, this variety is resistance to
the major wheat rusts as compared to the checks and hence farmers in durum wheat growing
areas of the highlands of Bale can use this variety to reduce the effect of rust epidemics.
Adaptation and agronomic recommendations
Bulala released for the mid and highland areas of Bale. It is adapted to areas having an
altitude ranging from 1700 to 2500 m.a.s.l. with areas receiving annual rainfall amount
ranging from 750 to 1500 mm.Besides, this variety is recommended for production in the
areas with similar agro ecologies. Recommended seed is 150kg/ha while fertilizer rate is
41kg/ha and 110kg/ha P2O5 and N, respectively. UREA application should be applied in split
application- 1/3 at planting and 2/3 at tillering stage to get maximum yield and quality.
Planting date is in mid-June to early September.
Variety Maintenaner: Breeder and foundation seed of the variety will be maintained by
Sinana Agricultural Research Center of Oromia Agricultural Research Institute.
Conclusion
Bulala is officially released in year 2017 for durum wheat growing areas of Bale high lands
for its high grain yield, disease resistance, uniformity, good quality traits (protein and gluten),
good test weight, earliness, higher thousand kernel weight and higher biomass than the
checks. It is highly preferred by consumers.

6
Proceeding of Adaptation and Generation of Agricultural Technologies IQQO AGP-II
Table 3. Mean agronomic performance, disease reactions and quality parameters of the Bulala
along with checks evaluated in variety verification trial in year (2016)
Genotypes
Agronomic, disease and quality data
DH DM PH
GY TKW TW SR YR LR Gluten
(%)
M
%
Protei
n %
Bulala(DurumICAR
DA/Ethiopia PDYT-
322)
68.5 136 86 56 45.1 83.9 5mr 5mr trms 30.3 10
.4
13.3
Dire 66 134 76 49 33.3 83.8 10ms 10ms trms 24.9 9.
7
11.7
Durum
ICARDA/Ethiopia
SR.R-
68 133 82 52 47.8 83.7 10s 10s 10s 28.1 9.
9
12.8
Ingilize 67.5 136 111 46 43.3 82.9 10s 5ms 15s 31.16 9.
5
13.1
Note: DH= days for heading, DM= days to maturity, PH: plant height (cm), TKW: thousand
kernel weight (gm), TW: test weight (kg/hl), GY: grain yield (kg/ha), SR: stem rust (%), YR:
yellow rust (%), LR: leaf rust (%), S: Susceptible, MS: moderately susceptible, MR:
Moderately resistant, TR=, trace, Trms: Trace with moderately susceptible
References
Aravind, N., M. Sisson, and C. Fellows, 2011. Can variation in durum wheat pasta protein
and starch composition affect in vitro starch hydrolysis? Food Chem, No. 124, pp 816-
821. CSA, 2011.
MNR (Ministry of Agriculture and Natural Resources), 2016. Plant variety Release,
Protection and Seed Quality Control Directorate. Crop variety register ISSUE No. 18.
Addis Ababa, Ethiopia.
Peña, R., and W. Pfeiffer, 2005. Breeding methodologies and strategies for durum wheat
quality improvement. In: C., Royo, M. Nachit, N.D., Fonzo, J.Araus, W.H., Pfeiffer,
and G. A., Slafer (Eds.), Durum wheat breeding: Current Approaches and Future
Strategies. New York: Food Product Press. The Haworth Press Inc, pp. 663-772.

7
Proceeding of Adaptation and Generation of Agricultural Technologies IQQO AGP-II
Registration of ‘Walin’ (BG-004-1) Sesame (Sesamum indicum L.) Variety
Solomon Bekele*, Alemayew Dabesa, Zerihun Abebe, Tadese Birhanu, Meseret Tola and
Chala Debela
Oromia Agricultural Research Institute, Bako Agricultural Research Center, P O Box 03,
Bako, West Shewa, Ethiopia
*Corresponding author: email: [email protected]
Abstract
The name Walin was given to sesame variety developed and released by Bako agricultural
research center of Oromia agricultural research institute in the year 2017. It is selected from
landraces collection made in Benishangul gumuz area after pure and homogenouse line is
developed from population with accession number BG004-1.. This variety gave high grain
yield with 22.2% advantage over the standard check, Chalasa and has high oil content
(55.1%). Furthermore, Walin is tolerant to bacterial blight and has marketable high seed size
and erect plant height. It was released for Uke, Chewaka and Angare Gute areas and similar
agro ecologies.
Key Words: Sesamum indicum, Variety Verification, Variety Release
Introduction
Sesame (Sesamum indicum L., 2n = 26), which belongs to the Sesamum genus of the
Pedaliaceae family, is one of the oldest oilseed crops and is cultivated in tropical and
subtropical regions of Asia, Africa and South America (Zhang et al., 2013). Sesame is the
first ranking export oilseed crop in Ethiopia. It is cultivated by both small and large scale
farmers. There is huge gap between the average national grain yield which is less than 1 t ha-1
and the genetic potential of sesame in Ethiopia. This was mainly due to shortage of improved
sesame varieties (Negash, 2015). Western Ethiopia is characterized as high rainfall areas
where bacterial blight is the bottle neck for sesame production. Due to high disease pressure,
only three varieties were adapted to western part of Ethiopia among a number of sesame
varieties released at national level. The demand of improved sesame variety is currently high
in western part of Oromia. Given the fact that western Ethiopia is one of the potential areas
for sesame production (FAO, 2015), the demand for adaptable improved varieties of this crop

8
Proceeding of Adaptation and Generation of Agricultural Technologies IQQO AGP-II
is very high. Therefore, developing of a new variety with high yield and desirable agronomic
traits is the main objectives of sesame improvement program. Therefore, there is a need to
identify high yielding and stable sesame variety with disease resistance for the western part of
Oromia.
Varietal Origin and Evaluation
Walin (BG-004-1) was selected out of land races population collected from Benishangul
Gumuz of western Ethiopia. Including Walin and the standard check, fifteen sesame
genotypes were evaluated in sesame regional variety trial at Uke and Chewaka for two years
(2014 and 2015) and at Gutin and Mender-10 for one year (2015).
Agronomic and morphological characteristics
The released sesame variety ‘Walin’ has acceptable marketable seed size and thousand seed
weight (3g), erect growth habit which is very important trait, white seed color and it is
tolerant to major sesame diseases prevailing in the areas. The detail description of the
released variety is presented in Table 1.
Table 1. Agronomic and morphological characteristics of new sesame variety ‘Walin’
1 Variety Walin (BG-004-1)
2 Agronomic & morphological
characters
2.1.Adaption area: Chewaka, Uke, Gutin and similar agro ecologies
Altitude( ma.s.l) 1250-1450
Rain fall (mm) <750
2.2. Seed rate (kg/ha) 5-10
2.3.Spacing (cm) 40x5 (Inter and Intra rows)
2.4.Planting date Late May to early June
2.5. Fertilizer rate (kg/ha 100 kg/ha NPS and 50 kg/ha UREA
2.6. Days to flowering 54-68
2.7. Days to maturity 80-110
2.8.Plant height (cm) 120-160
2.9. 1000 seed weight (g) 3
2.10. Seed color Dull white
2.11. Growth habit Erect
2.12. Crop pest reaction Tolerant to major sesame diseases
2.14.Yield (Qt/ha)
Research field 10-13.8

9
Proceeding of Adaptation and Generation of Agricultural Technologies IQQO AGP-II
Farmers field 9.5-11
3 Year of release 2017
4 Breeder seed maintainer Bako agricultural research center
Yield Performance
Walin was evaluated in multi-location trial with thirteen pipe line varieties against one
standard check, Chalasa for two years (2014 and 2015). It gave grain yield varying 10-13.8
qt/ha on station (Table 2). The on farmers’ field grain yield performance of Walin was ranged
from 9.5-11qt/ha.
Adaptation and agronomic recommendations
Newly released sesame variety, Walin is recommended for Uke, Chewaka and Gutin and
areas with similar agro-ecologies of Ethiopia. It is well adapted in altitude ranging from 1250
to 1450 m.a.s.l. with annual rainfall of 750 mm. Recommended seed rate is 5kg/ha while
fertilizer rate is 100kg/ha NPS at planting and 50kg/ha Urea 30 days after planting. The
recommended planting time ranging from late May to early June depending on the onset of
the rain fall.
Table 2. Mean seed yield (kg/ha) across locations and years in Sesame Regional Variety Trial
(2014-2015).
Pipe line variety
Grain (kg/ha)
mean
Yield
advantage
(%) 2014 2015
Chewaka
Uke
Gutin Chewaka
Uke
Mender
10
BG-005 892.4 987.2 510.9 1016.1 893.7 1038 889.7 -0.19
EW-009 1093.2 1059.5 551 1229.7 1058.3 1150 1023.6 14.8
EW-022 512.2 1060.2 420.3 911.5 981.7 965.6 808.5 -9.3
EW-023 1054.5 1112.8 575.5 1040.6 867.7 1210.4 976.9 9.6
BG-004-1 1054.8 1294.3 843.2 1258.9 971.8 1114.6 1089.6 22.2
EW-007 1098.5 955.8 611.9 1286.5 954.7 1096.4 1000.6 12.2
EW-021 1244.6 1023.4 665.6 1396.4 918.2 1331.8 1096.6 23
EW-005-1 1138.2 918.7 667.7 1283.3 871.3 1297.4 1029.4 15.4
EW-009-1 1012.2 850 771.3 1055.7 713 1250 942.0 5.6
EW-008 1063.2 933.7 703.1 1133.9 784.9 1107.8 954.4 7
WW-005-1 1206.6 1235.6 842.2 1377.1 951.5 1364.1 1162.8 30.4
IL-003 1366.6 1198.7 904.2 1583.9 841.1 1450 1224.0 37.3
BG-004(1)01BK 1324.3 892.7 683.8 1386.5 714 1046.9 1008.0 13
EW-011(2)-01BK 858.8 1160.4 774.5 1082.3 866.7 1401.6 1024.0 14.8
Chalasa(EW-023) 823.7 1255.8 536.9 976.6 878.1 877.6 891.4 0
10
Proceeding of Adaptation and Generation of Agricultural Technologies IQQO AGP-II
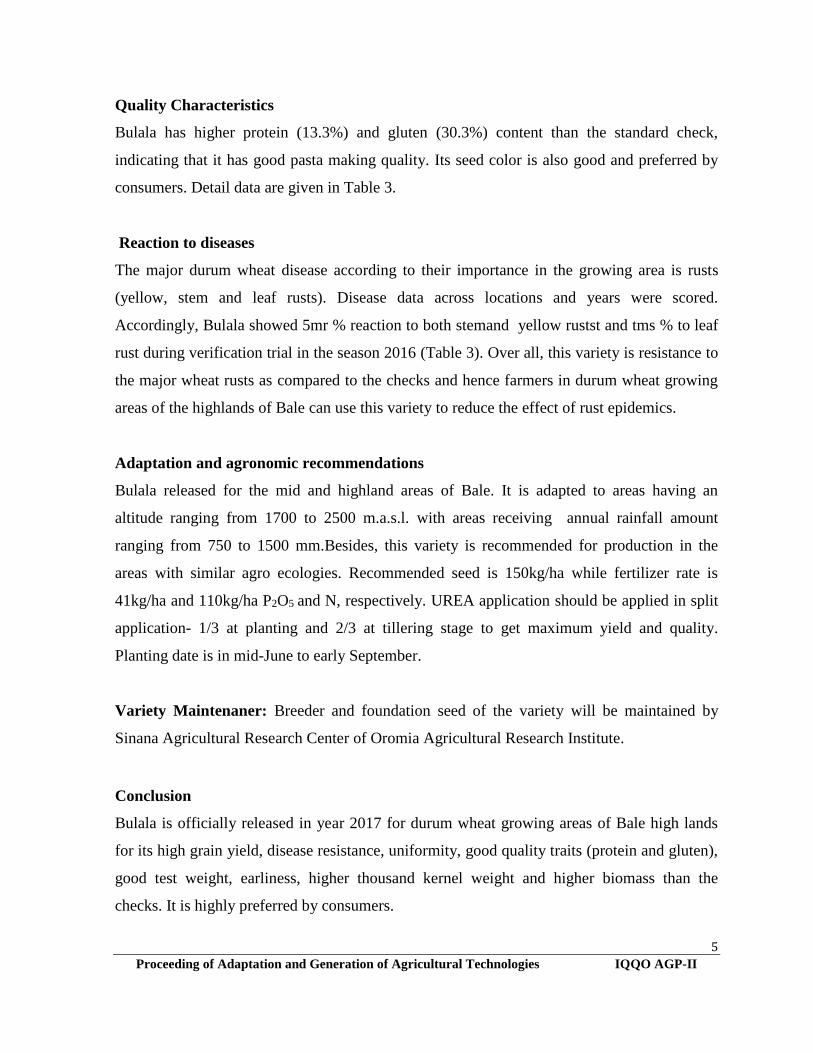
Quality Attributes and reaction to disease
As compared to the candidates and the check Walin (BG-004-1) was the best variety with oil
content of 55.1% (Table 3). Bacterial blight is the most limiting factor for sesame production
in western part of Oromia. Walin is moderately resistant to this disease
Table 3. Oil content and disease reaction of tested sesame varieties
No Variety Oil content (%) Reaction to bacterial blight (1-9 scale)
1 BG-004-1
(Walin)
55.1 3.75
2 WW-005-1 52.6 3.75
3 IL-003 54.2 5
4 Chalasa (check) 52.7 5 NB: disease score Where: 1 - 3 = resistance; 4 = moderately resistant; 5 - 6 = moderately susceptible;
7 - 8 = susceptible 9 = highly susceptible
Conclusion
Walin sesame variety was officially released in April 2017 for its high and stable grain yield
performance, tolerance to major sesame diseases, high oil content, acceptable seed size, and
early maturing withan erect growth habit. This variety is recommended for production in Uke,
Chewaka, Angar Gute areas and similar agro ecologies.
References
FAO (Food and Agriculture Organization). 2015. Analysis of price incentives for Sesame
seed in Ethiopia, 2005 - 2012. Technical notes series, MAFAP, by Kuma Worako, T.,
MasAparisi, A., Lanos, B., Rome.
Negash Geleta. 2015. Status of production and marketing of Ethiopian sesame seeds
(Sesamum indicum L.): A Review. Agri. and Biol. Sci. J., 1(5): 217-223
Grand mean 1049.5 1062.5 670.8 1201.2 884.4 1180.1 1049.5 13
CV (%) 13.2 15.2 14.2 13.7 10.1 13.6
LSD (5%) 231.3 271.1 159.2 274.5 149.4 269.2
F – value ** ** ** ** ** **

11
Proceeding of Adaptation and Generation of Agricultural Technologies IQQO AGP-II
The development and registration of “Alloshe”, faba bean variety for the
highlands of Bale, Ethiopia
Tadele Tadesse* and Amanuel Tekalign
Oromia Agricultural Research Institute, Sinana Agricultural Research Center, P.O. Box 208,
Bale-Robe, Ethiopia
*Corresponding author: [email protected], [email protected]
Abstract
Fifteen faba bean (Vicia faba L.) lines were selected and tested under regional variety trial
for two years (2013/14 to 2014/15) at four locations (Sinana, Sinja, Adaba and Agarfa)
districts in Bale highland. Among these,, EH 03043-1 (Alloshe) was found to be the highest
yielding variety with a yield advantage of 20.4% over the standard check Shallo; stable
performance, best adapted, having large number of pods per plant and tolerant to chocolate
spot (Botrytis fabae Sard.), Rust (Uromyces Vicia-fabae) and aschochyta blight (Aschocyta
fabae Speg.). Due to these and other merits “Alloshe” was released in 2017 cropping season
for the highlands of Bale and similar agro-ecologies.
Key words: Faba bean (Vicia faba L,) Variety Release, Stability
Introduction
Faba bean (Vicia faba L.) is a diploid species (2n=12). Botanically, it has been divided based
on seed size into types as minor, equine and major, even though there is no discontinuity in
seed size between them. This species originated in southwest Asia but its immediate ancestor
is not known. On the basis of morphological and geographical considerations, ancestors have
been proposed within the species complex V.narbonensis L. (2n=14). Faba bean is a partially
auto-gamous species and naturally out crossing under field condition is normally in the range
of 20-50% (Hawtin and Webb, 1982).

12
Proceeding of Adaptation and Generation of Agricultural Technologies IQQO AGP-II
In Ethiopia, pulse crops production accounts 13.4% of the total land produced with an average
yield of 10.6% over the whole crops produced (CSA, 2011). Faba bean is cultivated in the
“Wayina Dega” Zone (with altitudes 1800-2200m a.s.l., average annual rainfall of 740mm
and mean daily temperature of 18-22 0C) and “Dega” Zone (with altitudes >2200m.a.s.l,
average annual rainfall of 900mm and mean daily temperature of 10-18 0C). It is planted from
June to December in rotation with cereals. The national total area and production of faba bean
in the year 2011 accounted for about 3.8% of the total areas allocated for pulse with an
average yield of 3.3% of the total crops area cultivated (CSA, 2011).
Faba bean is an important source of protein supplement for the majority of the Ethiopian
population and is used in various popular dishes and used as a source of foreign earning
(Asfaw et al., 1994). The green immature beans are boiled and eaten as vegetable. The mature
seeds can be used for feeding livestock, swine, and equine and poultry animals. The stock or
haulms is used as animal feeding staffs. Faba bean also serves as a rotational crop which play
great role in controlling disease epidemics in areas were cereal mono-cropping is abundant
(Yohannes, 2000).
In the process of developing new cultivars, plant breeders select to improve plant adaptation
in a target population of environments. These environments comprise a complex mixture of
types which challenge the genotypes and expose differences in adaptation (Cooper et al.,
1996). Improvement of quantitative characters in plant breeding programs proceeds by
selecting among genotypes based on their phenotypic performance. The phenotype is a result
of genetic and no-genetic influences (Comstock and Moll, 1963) and selection exploits only
those components of phenotypic variability that have a genetic base.
It is known that variety is released whenever it has merits over the local cultivar and the
previously released varieties both in terms of seed yield, other agronomic traits and their
reaction to diseases. Variety releasing is an ongoing process since a given variety has
performed well for specific period of time and reduces its production potential after sometime
due to segregation, becoming susceptible to diseases, and to some degree due to out crossing.
Therefore, the present study was undertaken, to evaluate and release faba bean genotypes that

13
Proceeding of Adaptation and Generation of Agricultural Technologies IQQO AGP-II
are stable, wider adaptation and resistant/tolerant to major faba bean diseases in the highlands
of Bale, South eastern Ethiopia.
Materials and Methods
Faba bean variety verification trial was conducted at four locations; Sinana, Agarfa, Adaba
and Sinja on vertisol under rain fed conditions in the meher season (August-January) in 2016
cropping season both on station and on farmers’ field. None replicated 10mx 10m plot were
used. Seeding rate was applied at the rate of 200 kg/ha and fertilizers were applied at the rate
of 100kg DAP/ha. Weeds were controlled by hand. Data were collected on both plot and plant
basis.
Result and Discussion
The combined analysis over locations revealed significant variation among the genotypes for
mean seed yield and other agronomic traits. From the two year data, EH03043—1 showed a
consistence and stable performance over the six environments (year by location). Because of
the desirable agronomic performance over the checks, genotype EH03044-1 was selected and
verified in 2016 cropping season (Table 1). The verification trial after being evaluated by the
National Variety Release Committee (NVRC), the genotype was released for the highlands of
Bale, South eastern Ethiopia, and other similar agro-ecologies with an altitude of 1800-
2600m.a.sl. The variety was released under the name “Alloshe”.
Varietal Characters
Alloshe is an erect variety with light green seed coat, yellow cotyledon and white with black
spot flower. Alloshe has an average plant height of 141cm, and requires 61days for flowering,
and 141 days to reach physiological maturity. It has average thousand seeds weight of
434.3gm, and on average 15 medium length pods per plant (Table 2).

14
Proceeding of Adaptation and Generation of Agricultural Technologies IQQO AGP-II
Table 1 Mean seed yield and other Agronomic traits of 15 faba bean genotype tested in Regional Variety Trial at four sites (Adaba,
Agarfa, Sinja and Sinana) during 2013 and 2014 cropping season
Entry Genotype
code
Days to
flower
Days to
mature
Plant
ht
(cm)
Disease score (1-9 scale) No.
pod/plant
No.
seed/pod
Thousand
seed wt
(g)
Seed
yield
(kg/ha) Rust Chocolate
spot
Aschochyta
blight
EHO3073-1 1 60 142 139 6 5 6 17 3.0 694.0 3239
EK 01019-7-5 2 59 142 143 8 5 6 16 3.1 784.4 3379
EK CSR 01009 3 62 141 146 7 5 5 18 2.7 799.5 3312
EHO3021-4 4 62 142 143 6 5 6 17 2.8 705.8 3368
EHO3055-2 5 60 141 138 7 6 6 19 2.9 632.0 3166
EK02006-2-1 6 62 143 143 6 5 6 17 2.9 747.4 3284
EKLS 01022-1 7 62 141 143 7 5 6 18 2.8 781.3 3239
EKLS 01013-1 8 60 142 146 4 4 3 17 2.9 781.6 3931
EH00005-6-1 9 61 141 139 7 5 5 19 2.8 650.8 3465
EHO3043-1
(Alloshe)
10 61 141 141
3
4
3 18 2.7 698.3 4128
EHO3052-3 11 60 141 142 7 6 7 19 2.8 755.4 3430
EHO3029-2 12 60 140 139 6 5 5 20 2.6 649.8 3249
Shallo 13 59 141 139 7 5 5 19 2.8 575.4 3429
Degaga 14 60 141 143 7 5 5 21 2.8 571.2 3290
Local check 15 59 141 144 7 7 6 19 2.8 579.9 3056
MEANS 60 141 142 18 2.8 694 3398
5% LSD 1.25 1.75 4.93 2.59 0.29 35.56 298.74
C.V. 4.2 2.5 7.1 24.0 20.0 10.0 17.9

15
Proceeding of Adaptation and Generation of Agricultural Technologies IQQO AGP-II
Yield performance
The average seed yield of Alloshe combined over locations and over years is (4.1t/ha) which
is higher than Shallo (standard check) (3.4t/ha), and the local check (3.0t/ha). Under research
field, Alloshe’s seed yield ranges from 4.4 to 5.0t/ha while on farmers’ field, it ranges
from3.5-4.1t/ha..
Table 2: Agronomic and morphological characteristics of Alloshe (EH03043-1)
No Agronomical and Morphological Characteristics
1 Adaptation area Sinana, Goba, Agarfa, Gassera, Goro (Meliyu), Adaba, Dodola (W. Arsi)
and other similar agro-ecologies
2 Altitude (m.a.s.l.) 2300 – 2600
3 Rainfall (mm) 750 – 1000
4 Seed Rate (Kg/ha) 175-225
5 Planting date End of July to Early August
6 Fertilizer Rate (DAP kg/ha) 100
7 Days to Flower 61
8 Days to Maturity 141
9 Plant Height (cm) 141
10 Growth habit Indeterminate
11 1000 Seed Weight (gm) 698.3
12 Seed Color Light green
13 Cotyledon Color Yellow
14 Flower Color White with black spot
15
Yield
(Qt/ha)
Research Field 44-50
On-farm 35-41
16 Disease reaction Tolerant to chocolate spot, Rust and Aschochyta blight
17 Yield advantage over Shallo
(%)
20.39
18 Year of Release 2017
19 Breeder and Maintainer SARC (OARI)

16
Proceeding of Adaptation and Generation of Agricultural Technologies IQQO AGP-II
Stability Performance
Yield stability in 15 faba bean genotypes were studied for two years across four locations,
based on the model of Eberhert and Russel (1996). The result of the study showed that
Alloshe was the best productive variety in yield performance and showed maximum stability.
The biplot figure below also revealed that, genotype 10 (EH03043-1) or Alloshe which is
found close to the origin is as a stable variety across the testing locations.
Interaction biplot for the ammi2 model
Variety: Gykg/ha data file: fbrvt011 model fit: 92.1% of gxe
IPCA1 33 22 11 0 -11 -22
IPCA2
18
9.4
0.8
-7.8
-16.4
-25
1
2
3
4
5
6
7
8 9
Alloshe
10
11 12
13
14
15
Agarfa
SJ
AD
Sn

17
Proceeding of Adaptation and Generation of Agricultural Technologies IQQO AGP-II
Reaction to disease
The major faba bean diseases according to their importance in the growing areas are chocolate
spot (Botrytis fabae Sard.), Rust (Uromyces Vicia-fabae) and Aschochyta blight (Aschocyta
fabae Speg.) (Asfaw et al., 1993). In 1-9 rating scale, Alloshe, scored a mean of 3 for rust and
aschochyta blight , 4 for chocolate spot, and being characterized as moderately resistant
(Table 1).
Adaptation
Alloshe is released for the highlands of Bale, south eastern Ethiopia. It is well adapted in
areas having an altitude of 1800 to 2600m.a.s.l and annual rain fall of 750 to 1000mm.
Furthermore; production of Alloshe can be extended to areas having similar agro-ecologies.
Alloshe performs best if it produced with recommended fertilizer rate of 100kg DAP/ha and
seed rate of 200 kg/ha in clay-loam soil. Recommended planting date is from the end of July
to early August in Meher season and to the end of March in Belg season.
Variety Maintainer
Breeder seed of the variety is maintained by Oromia Agricultural Research Institute (OARI),
Sinana Agricultural Research Center.
Conclusion
Alloshe is a stable variety according to its grain yield performance. It has good agronomic
traits that make it suitable for production both in the main and short rain season for areas
having bimodal rainfall pattern like Bale zone, south-eastern Ethiopia. Alloshe is moderately
resistant to major diseases faba bean.

18
Proceeding of Adaptation and Generation of Agricultural Technologies IQQO AGP-II
References
Asfaw Telaye, Beyene Demtsu and Tesfaye Getachew (1993). Genetics and breeding of Faba
bean pea. In: Cool-season Food Legumes of Ethiopia. Proceeding of the first
National Cool-season Food Legumes Review conference, 16-20 December 1993.
Addis Ababa, Ethiopa.
Central Statistics Authority (2011). Agricultural Sample Survey. 2011/12. Report on area and
production for major crops. Statistical bulletin. Central Statistical Authority, Addis
Ababa, Ethiopia.
Comstock, R.E. and Moll, R.H. (1963). Genotypic- environment interactions. In: Hanson ,
W.D. and Robinson, H.F. (eds) Statistical Genetics and Plant breeding. Publication
982. National Academy of Sciences- National Research Council, Washingotn D.C.,
pp. 164-196
Cooper, M. and Byth, D.E. (1996). Understanding Plant Adaptation to Achieve Systematic
Applied Crop Improvement-A fundamental Challenge. In: Plant Adaptation and Crop
Improvement CAN INTERNATIONAL in association with the International Rice
Research Institute and the International Crops Research Institute for the Semi-Arid
Tropics
Eberhart S.A., and Russel, W.A. (1996). Stability parameters for comparing varieties, Crops
Science 6: 36-40
Hawtin G, Webb C (1982). Faba bean Improvement. In: Proceeding of faba the bean
Conference Cairo, Egypt, the International Center for Agricultural Research Center in
the Dry Areas (ICARDA) Aleppo, Syria. Martinus Nijhoff Publisher for
ICARDA/IFAD Nile Valley Project, the Netherlands. pp 19-23
Yohannes Degago (2000). Faba bean (Vicia faba L.) in Ethiopia Institute of Biodiversity
Conservation and Research (IBCR), Addis Ababa, Ethiopia. 23pp.

19
Proceeding of Adaptation and Generation of Agricultural Technologies IQQO AGP-II
Participatory Variety Selection of Food Barley (Hordeum vulgare L.)
Varieties at Dugda and Lume Districts of East Shoa zone
FisehaTadesse*, Urgaya Balcha, Temesgen Dinsa, Kedir Wako, Ayana Etana and Tesfaye Gemechu
Oromia Agricultural Research Institute, Adami Tulu Agricultural Research Center,
Corresponding author: [email protected], Batu, Ethiopia
Abstract
Participatory evaluation of released barley varieties was conducted in Dugda and Lume
districts of East Shewa with the objective of identifying adaptable food barley variety for the
areas and similar agro-ecologies. Three improved barely varieties viz., Bentu, Gobe and
Dirbie released for moisture stress areas and one for high land areas (HB-1307) were tested
on field of nine farmers at three Kebeles. There was significant difference between varieties
released for stress area and that recommended for high land areas in yield performance.
Higher grain yield was obtained from Gobe, Bentu and Dirbie than that of HB-1307. Based
on the grain yield performance of the varieties and farmers selection criteria, two varieties
namely, Bentu and Dirbie were recommended for Luma and Dugda districts of East Shewa
zone.
Keywords: Food Barley; Moisture Stress; Participatory Variety Selection
Introduction
Ethiopia ranked twenty-first in the world in barley production with a share of 1.2 percent of
the world’s total production of barely (Abu and Teddy, 2014).There are two types of barley in
Ethiopia: food barley for human consumption and malt barley which can be converted into
malt, a key ingredient in beer making. In Ethiopia, barely is the fifth most important crop after
teff, maize, sorghum and wheat. It is used in different forms such as bread, porridge, soup,
and roasted grain and for preparing alcoholic and non-alcoholic drinks. Its straw is used for
animal feed, thatching roofs and bedding.
In high land, large area of land was allotted for barley production but it has been replaced by
the ever expanding production of bread wheat (CSA, 2013). Similar trend is also happening in
the low moisture stress areas and there is serious shortage of improved barely varieties in the

20
Proceeding of Adaptation and Generation of Agricultural Technologies IQQO AGP-II
low moisture stress areas of Ethiopia including mid rift valley of East Shewa. Therefore, there
is a pressing need to introduce improved barley varieties that are drought tolerant to this part
of the country. Participatory variety selection has shown success in identifying more number
of preferred varieties by farmers in shorter time than the conventional system; in accelerating
their dissemination and increasing cultivar diversity (Witcome and Joshi, 1996). It is,
therefore, imperative to test the adaptability of moisture stress tolerant released barely varities
with the participation of farmers to creating an option and access to farmers is the priority of
this research.
Materials and Methods
Four improved food barley varieties namely Gobe, Bentu, Dirbie, and HB-1307 were
evaluated in this trial. The first three varieties were released for moisture stress areas while
the fourth variety (HB-1307) was originally recommended for high land areas. Date of
maturity, altitude range of recommendation, rainfall requirement and the yield potential of the
barley varieties used in this study were shown in Table 1.
Table 1. Maturity, adaptation area and yield potential of barley varieties used in this
experiment
Characteristics Varieties
Gobe Bentu Dirbie HB-1307
Days to maturity 80-110 71-99 na* na
Altitude 1700-2300 1700-2300 1700-2300 1700-2300
Rainfall >500 >500 >500 >500
Yield (qt ha-1) 42 12-24 19-31 na
*not available
The experiment was laid out in Randomized Complete Block Design (RCBD) and farmers
field were considered as replication. The plot size used was 10m x10 m. The experimental
fields were prepared using oxen plow. Seed was planted at a rate of 85 kgha-1 in rows of 20
cm spacing and a fertilizer rate of 100kg/ha Urea. Half of it was applied at planting and the
remaining half was top-dressed 15 days after planting. Plots were kept free of weeds by hand
weeding.Dugda and Lume districts of East Showa zone were selected as the study areas. Two

21
Proceeding of Adaptation and Generation of Agricultural Technologies IQQO AGP-II
FREG at Lume and one at Dugda districts were established. A group consisting of 15 to 20
farmers was organized to form one FREG. From each FREG three farmers were selected to
host the field experiment. Farmers in each FREG were independently invited to determine
their own selection criteria. Finally farmers selected yield, seed per spike, seed size and early
maturity as the best selection criteria. Overall Preferential Rank (OPR) was calculated as the
average of the trait scores. Agronomic traits like plant height, tillers per plant, grain yield,
seed per spike, thousand seed weight, spike length, and effective tillers were recorded and
analyzed.
Result and Discussion
Combined analysis of variances showed that there was highly significant difference among
the genotypes and the locations for grain yield. The main effect of location were significantly
affected number of tiller per plant, number of seed per spike, thousand seed weight and grain
yield (Table 2). The mean grain yield of Gobe, Bentu and Dirbie were comparable and they
were by far better than HB-1307 (Table 3).
Table 2. Mean square for agronomic characteristics of food barley varieties evalauted
Source of
variation DF PH (cm) TPP ET SL SPS TSW GY(Qt ha-1
)
Varieties 3 48.6ns 2.3ns 1.4ns 1.4ns 604.2** 10.7ns 64.5**
Location 2 135.6ns 28.1** 1.4ns 2.1ns 120.6** 78.2** 68.4*
Varieties by
Location 6 63.8ns 0.5ns 0.7ns 0.7ns 14.6ns 22.1ns 3.7ns
CV (%) 12.5 12 4.3 14.7 8.4 8.6 17.4

22
Proceeding of Adaptation and Generation of Agricultural Technologies IQQO AGP-II
Table 3. Mean performance of yield and some major agronomic traits of barley varieties
Varieties TPP SPP TSW (g) GY(Qt ha-1
)
Gobe 4.0 25.42c 36.37 22.5a
Dirbie 4.2 42.27ab 37.19 22.4a
Bentu 3.3 42.89a 35.03 21.8a
HB-1307 4.4 39.44b 36.20 16.9b
SE (±) 0.33 1.051 1.03 1.21
LSD0.05
NS 2.67 3.099 3.55
TPP= tiller per plant, SPP= spikes per plant, TSW= thousand seed weight, GY= grain yield
Participatory variety evaluation of food barley
At all locations yield was taken by the farmers as the best and first trait to rank barley
varieties. The next important traits were seed size, seed per spike and early maturity. Based on
these criteria, two varieties namely Bentu and Dirbie were ranked first followed by Gobe
while HB-1307 was the last. In general, the result of participatory variety selection (PVS)
showed that the most preferred varieties consisting the top two important selection criteria of
farmers were Bentu and Dirbie (Table 4).
Table 4. Farmers’ food barley variety ranking
Varieties Ranking index Overall rank
Bentu 24 1
Gobe 48 3
Dirbie 24 1
HB-1307 64 4

23
Proceeding of Adaptation and Generation of Agricultural Technologies IQQO AGP-II
Conclusion and recommendation
Participatory varietal selection has shown success in identifying more number of preferred
varieties by farmers in shorter time than the conventional system and as a better strategy in
accelerating their dissemination. Accordingly, the experiment was conducted with the
objective to test adaptability of improved food barley varieties. Highest biological yield was
obtained from Gobe, Bentu and Dirbie. Based on both mean grain yield across locations and
farmers section criteria, farmers preferred Bentu and Dirbie barley varieties among the
varieties evaluated in this study. Hence, these two selected varieties were recommended for
Lume and Dugda districts and areas with similar agro-ecologies.
References
Abu Tefera and Teddy Tefera (2014). Grain and feed Anual report. Global Agricultural
information network, Grain report No ET1401, March 31, 2014, A.A.
CSA (2013). Area and Production of crops (Private peasant holdings, Meher season).
Statistical Bulletin. Addis Ababa, Ethiopia.
Witcome JR, Joshi A, Joshi KD, Sthapit BR (1996).Farmer participatory crop improvement. I.
Varietal selection and breeding methods and their impact on biodiversity. Exp.Agric.
32:445-460.

24
Proceeding of Adaptation and Generation of Agricultural Technologies IQQO AGP-II
Grain yield stability and agronomic performance of tef genotypes in
western Oromia
*Girma Chemeda1, Chemeda Birhanu1, Girma Mengistu2, Dagnachew Lule2, Gudeta Bedada1,
Kebede Dessalegn1, Kassa Mamo1, Megersa Kebede1, Megersa Debela1 and Fufa Anbesa1
1Bako Agricultural Research Center, P.O. Box: 03, Bako, Ethiopia
2Oromia Agricultural Research Institute, Addis Ababa, Ethiopia
Corresponding author: Email: [email protected]
Abstract
Tef, Eragrostis tef (Zucc.) Trotter is the major Ethiopian cereal grown on about 3 million
hectares annually. Because of its gluten-free proteins and slow release carbohydrate
constituents, tef is recently being advocated and promoted as health crop at the global level.
Regardless of its importance, research on tef is still limited. This experiment was conducted
across three locations for two years (2015/16 and 2016/17) to identify stable high yielding
pipeline varieties for possible release. A total of nine genotypes were evaluated against the
standard check, Kena. The design used was randomized complete block design with three
replications. The combined analysis of variance across the three locations revealed highly
significant (p<0.01) difference among genotypes for plant height, panicle length, shoot
biomass, lodging % and grain yield. Genotype and genotype by environment interaction
(GGE) analysis showed that two genotypes, viz.236952and 55253 were stable and high
yielder. Besides, these two genotypes were lodging tolerant across locations with grain yield
advantage of 26% and 19.29% over the standard check, respectively. Therefore, based on
their high yield and stable performance, genotypes 236952 and 55253 were promoted to
Variety Verification Trial for possible release.
Keywords: Eragrostis tef, stability, Genotype and genotype by environment interaction
(GGE)
Introduction
Eragrostis tef (Zucc.) Trotter is a self-pollinated warm season annual grass with the advantage
of C4 photosynthetic pathway (Miller, 2010). Tef is among the major Ethiopian cereal crops

25
Proceeding of Adaptation and Generation of Agricultural Technologies IQQO AGP-II
grown on about 3 million hectares annually (CSA, 2015), and serving as staple food grain for
over 70 million people. Tef grain is primarily used for human consumption after baking the
grain flour into popular cottage bread called "injera". Tef has an attractive nutritional profile,
being high in dietary fiber, iron, calcium and carbohydrate and also has high level of
phosphorus copper, aluminum, barium, thiamine and excellent composition of amino acids
essential for humans (Abebe et al., 2007; Hager et al., 2012). The straw is an important source
of feed for animals. Generally, the area devoted to tef cultivation is increasing because of both
the grain and straw fetch high domestic market prices. Tef is also a resilient crop adapted to
diverse agro-ecologies with reasonable tolerance to both low (especially terminal drought)
and high (water logging) moisture stresses. Tef, therefore, is useful as a low-risk crop to
farmers due to its high potential of adaptation to climate change and fluctuating
environmental conditions (Balsamo et al., 2005).
The continued cultivation of tef in Ethiopia is accentuated by the following relative merits: 1)
as the predominant crop, tef is grown in a wide array of agro-ecologies, cropping systems, soil
types and moisture regimes; 2) with harvests of 4.75 million tons of grain per year from about
3 million hectare, Tef constitutes about 30% of the total acreage and 20% of the gross yearly
grain production of cereals in Ethiopia followed by maize which accounts for about 21% of
the acreage and 31% of the overall cereal grain production (CSA, 2015); 3) the values of the
grain and straw contribute about four billion Birr to the national GDP; 4) it has a good export
market, although domestic grain price hikes led to food grain export ban; 5) tef grain has got
relatively good nutritive value especially since it contains relatively high amounts of iron,
calcium and copper compared to other cereals. Because of its gluten-free proteins and slow
release carbohydrate constituents, tef is recently being advocated and promoted as health crop
at the global level (Spaenij-Dekking et al., 2005).
Agricultural Development Led Industrialization (ADLI) policy requires an increase in
productivity of tef such that, apart from satisfying the household consumption, it feeds into
the emerging grain processing industries that are cropping up due to the change in life-style as
well as the recently burgeoning global tef market. Besides, the export-led research policy

26
Proceeding of Adaptation and Generation of Agricultural Technologies IQQO AGP-II
requires increased tef productivity particularly in view of exploiting the recent globalization
and consequently burgeoning global tef market.
The most important bottlenecks constraining the productivity and production of tef in
Ethiopia are: i) low yield potential of farmers’ varieties under widespread cultivation; ii)
susceptibility to lodging particularly under growth and yield promoting conducive growing
conditions; iii) biotic stresses such as diseases, weeds and insect pests; iv) abiotic stresses
such as drought, soil acidity, and low and high temperatures; v) the culture and labor-
intensive nature of the tef husbandry; vi) inadequate research investment to the improvement
of the crop as it lacks global attention due to localized importance of the crop coupled with
limited national attention; and vii) weak seed and extension system (Kebebew et al., 2013).
Therefore the objective of this activity was to select and release high yielding, lodging and
diseases resistant/tolerant tef varieties for tef growing areas of western parts of the Oromia.
Material and Methods
Nine genotypes were evaluated in multi-location trial at tef growing areas such as Shambu,
Gedo and Arjo research sub site during 2015/16 and 2016/17 cropping season. The
experiment was conducted using Randomized Complete Block Design with three replications
on a plot size (experimental unit) of 2m x2m (4m2) each with 0.2m of row spacing. The
distance between block was 1.5m and between plots was 1.0m. Fertilizer rate of 100/50 kg
DAP/UREA and seed rate of 10 kg/ha was used. Other agronomic practices were applied
uniformly as required. Data on days to emergence, days to heading, days to maturity, panicle
length, plant height, shoot biomass, lodging %, effective tiller, Stand %, grain yield per plot
and disease score (1-9 scale) were collected and subjected to statistical analysis using SAS
(SAS, 2008) statistical software.
Results and Discussions
The combined analysis of variance across the three locations revealed highly significant
(p<0.01) difference among genotypes for plant height, panicle length, shoot biomass, lodging
% and grain yield Qt/ha (Table 1). Accession 236952 gave the highest grain yield
27
Proceeding of Adaptation and Generation of Agricultural Technologies IQQO AGP-II
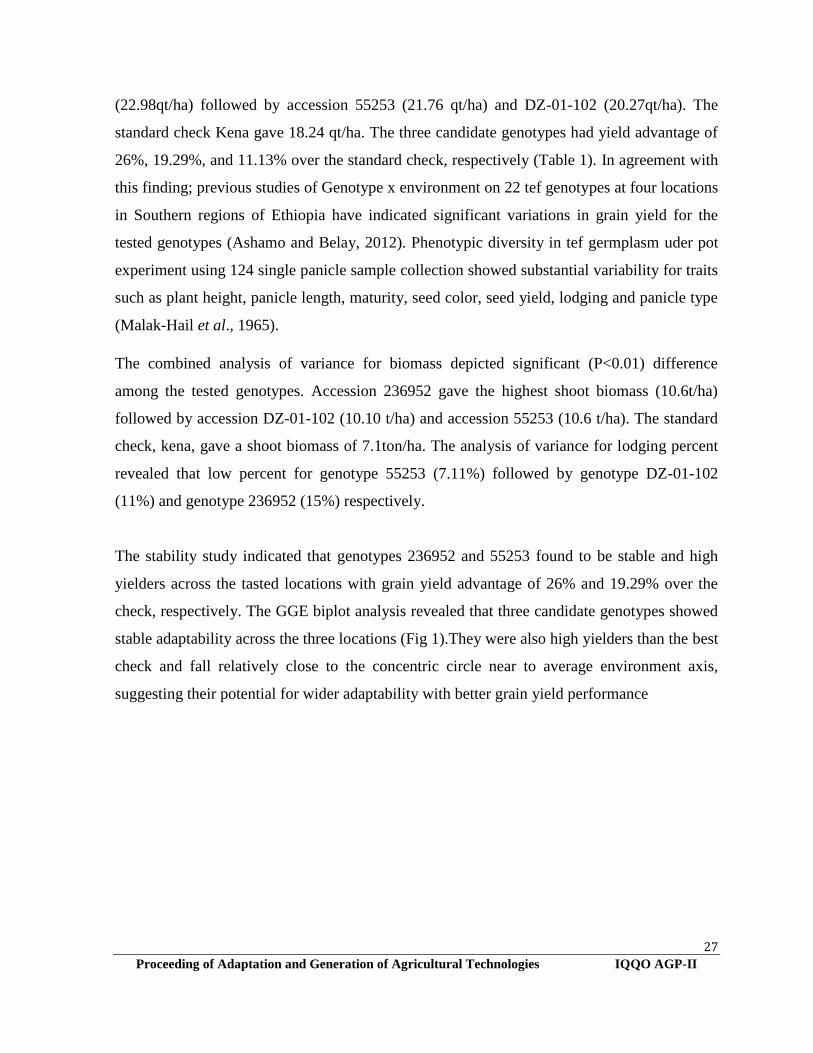
(22.98qt/ha) followed by accession 55253 (21.76 qt/ha) and DZ-01-102 (20.27qt/ha). The
standard check Kena gave 18.24 qt/ha. The three candidate genotypes had yield advantage of
26%, 19.29%, and 11.13% over the standard check, respectively (Table 1). In agreement with
this finding; previous studies of Genotype x environment on 22 tef genotypes at four locations
in Southern regions of Ethiopia have indicated significant variations in grain yield for the
tested genotypes (Ashamo and Belay, 2012). Phenotypic diversity in tef germplasm uder pot
experiment using 124 single panicle sample collection showed substantial variability for traits
such as plant height, panicle length, maturity, seed color, seed yield, lodging and panicle type
(Malak-Hail et al., 1965).
The combined analysis of variance for biomass depicted significant (P<0.01) difference
among the tested genotypes. Accession 236952 gave the highest shoot biomass (10.6t/ha)
followed by accession DZ-01-102 (10.10 t/ha) and accession 55253 (10.6 t/ha). The standard
check, kena, gave a shoot biomass of 7.1ton/ha. The analysis of variance for lodging percent
revealed that low percent for genotype 55253 (7.11%) followed by genotype DZ-01-102
(11%) and genotype 236952 (15%) respectively.
The stability study indicated that genotypes 236952 and 55253 found to be stable and high
yielders across the tasted locations with grain yield advantage of 26% and 19.29% over the
check, respectively. The GGE biplot analysis revealed that three candidate genotypes showed
stable adaptability across the three locations (Fig 1).They were also high yielders than the best
check and fall relatively close to the concentric circle near to average environment axis,
suggesting their potential for wider adaptability with better grain yield performance

28
Proceeding of Adaptation and Generation of Agricultural Technologies IQQO AGP-II
Table 1. Mean grain yield (qt/ha) of tef genotypes per locations across years
Accession Shambu Gedo Arjo Mean % yield Rank
2015/16 2016/17 2015/16 2016/17 2015/16 2016/17 advantage
Acc.236952 25.07 21.2 22.56 23.3 21.34 23.63 22.85 26.00 1
Acc.55253 21.87 23.02 21.95 21.81 20.12 21.81 21.76 19.29 2
DZ-01-1001 19.16 20.61 17.03 18.58 16.75 18.87 18.50 9
DZ-01-1004B 19.31 20.42 16.53 16.77 16.72 16.52 17.71 10
DZ-01-102 21.80 20.30 19.00 20.10 20.74 19.69 20.27 11.13 3
DZ-01-385 20.44 18.82 18.71 21.02 14.77 20.81 19.10 5
DZ-01-739 19.22 19.97 19.43 18.48 17.55 18.41 18.84 7
DZ-01-778 20.65 19.02 20.02 18.00 18.53 18.83 19.18 4
DZ-01-821 20.18 18.94 19.38 18.51 18.31 19.14 19.08 6
Kena 20.09 20.43 18.30 16.37 17.83 16.44 18.24 8
Local 16.91 17.98 17.48 18.06 17.06 17.77 17.54 11
Mean 20.25 20.43 19.18 19.27 18.16 19.27
CV 8.9 6.3 6.6 6.1 11.3 4.3
F-Value <0.005 <0.002 <0.001 <0.001 <0.028 <0.001
LSD 0.05 2.46 4.22 2.38 4.30 2.03 4.12

29
Proceeding of Adaptation and Generation of Agricultural Technologies IQQO AGP-II
Acc.236952DZ-01-1001
DZ-01-739
Acc.55253
Comparison biplot (Total - 87.91%)
Kena
DZ-01-385
Local
DZ-01-1004B
DZ-01-778
DZ-01-102
DZ-01-821
Aj 1
Aj 2
Gd 1
Gd 2
Sh1
Sh2
PC1 - 73.43%
PC2
- 14.
48%
AEC
Environment scores
Genotype scores
Fig-1. Genotype and Environment that fall in the central circle are considered ideal
environments and stable genotypes, respectively
Conclusion and Recommendation
Combined analysis of variance for the genotypes portrayed highly significant differences for
plant height, panicle length, shoot biomass, lodging % (data not presented) and grain yield
qt/ha. Genotype 236952and 55253 were found stable, high yielders and lodging tolerant
across the tasted locations with grain yield advantage of 26%, 19.29% and 11.13% over the
standard check respectively. As a result of these all merits, these three genotypes viz.
236952and 55253 were identified as candidate genotypes to be verified at three sites in the
coming cropping season for their possible release.
30
Proceeding of Adaptation and Generation of Agricultural Technologies IQQO AGP-II
References
Ashamo M, Belay G. (2012). Genotype x Environment Interaction Analysis of Tef Grown in
Southern Ethiopia Using Additive Main Effects and Multiplicative Interaction Model.
Journal of Biology Agriculture and Healthcare 2: 66-72.
Balsamo R A, Willigen C V,Boyko W, Farrent L. (2005). Retention of mobile water during
dehydration in the desiccation-tolerant grass Eragrostis nindeensis' . Physiol
Planetarium.134:336-342.
Central Statistical Agency (CSA) (2014/15). The federal Democratic Republic of Ethiopia.
Central Statistical Agency Agricultural Sample Survey 2014/15: Report on Area and
Production of Major Crops (Private peasant Holdings, Maher Season), Volume III.
Addis Ababa,Ethiopia.
Kebebew Assefa, Solomon Chanyalew and Gizaw Metaferia (2013). Conventional and
Molecular Tef Breeding, Proceedings of the Second International
Workshop,November 7-9, 2011, Debre Zeit, Ethiopia.
Melak-Hail Mengesha, Picket R. C., Davis R. L. (1965). Genetic variability and
interrelationship of characters in teff, Eragrsotis tef (Zucc.) Trotter, Crop Sci. 5: 155-
157.
Miller, D (2010) Teff guide 3rd edition, viewed on 24 September 2012,
http://www.calwestseeds.com.product/teff
Spaenij-Dekking L, Kooy-Winkelaar Y and Koning F. (2005). The Ethiopian cereal tef in
celiac disease. N. Engl. J. Med. 353: 16.

31
Proceeding of Adaptation and Generation of Agricultural Technologies IQQO AGP-II
Participatory Variety Selection of Bread Wheat (Triticum aestivum L.) Varieties at
Dugda and Lume districts of East Shoa zone
Fiseha Tadesse*, Urgaya Balcha, Temesgen Dinsa, Kedir Wako, Tesfaye Gemechu and
Ayana Etana
Oromia Agricultural Research Institute, Adami Tulu Agricultural Research Center, Batu,
Ethiopia
*Corresponding author: [email protected],
Abstract
Wheat is the major cereal crop grown in the highlands of Ethiopia. In east Shoa zone of
Dugda and Lume districts improved variety of wheat is not well popularized and most farmers
depend on local cultivars. The objective of this experiment was to identify adaptable and most
preferred bread wheat variety for the areas. Four varieties vz. Kingbird, Ogolcho, Kekeba
and Bika were tested against farmer’s variety, Hawi. These varieties were tested at two
kebele’s of Lume and one kebele of Dugda district. Three varieties namely Kingbird
(23.8qt/ha), Kekeba (23.8qt/ha) and Ogolcho (23.7 qt/ha)) gave comparable grain yield and
they are better in yield as compared to Bika (21.0 qt/ha) and the check, Hawi (21.2 qt/ha). At
Tephochorke kebele of Dugda district, yield, drought tolerance and early maturity were
selected by farmers as the top three selection criterion. At Ejersa Joro and Bika kebele of
Lume district farmer’s selection criteria were yield, spike length and early maturity. Across
the two districts, Ogolcho and king bird were selected as the best among these tested bread
wheat varieties. These varieties were recommended for moisture stress areas of Lume and
Dugda districts of east Showa zone and areas with similar agro ecologies.
Keywords: Bread Wheat; Grain Yield; Participatory Variety Selection; Ethiopia
Introduction
Wheat is the major cereal crop grown in the highlands of Ethiopia with in altitudes of 1500 to
3200m.a.s.l. In Ethiopia, the current national average wheat yield is 2.54 ton ha-1 (CSA,
32
Proceeding of Adaptation and Generation of Agricultural Technologies IQQO AGP-II
2015), which is far below the yield (5 ton ha-1) obtained from experimental plots even before
two decades ago (Hailu, 1991). Wheat production is constrained by many yield-limiting
factors under farmer’s field of which low moisture is the most important in Lume and Dugda
districts of east Shoa zone. In Ethiopia, conventional wheat breeding was started in 1960s and
as a result, a large number of bread wheat cultivars were released (MNR, 2016). The most
important advantage of participatory variety selection (PVS) is adoption of new cultivar is
much faster than under the formal crop improvement and also the dissemination of varieties
from farmer-to-farmer through the local seed system will be very fast and thus guaranteeing a
further good adoption (Bellon et al., 2002). According to Sperling et al. (2001), PVS may
have many advantages, such as increased and stable crop productivity, faster release and
adoption of varieties, better understanding of farmers’ criteria for variety selection, enhanced
biodiversity, increased cost effectiveness, and facilitated farmers learning and empowerment.
The participation of farmers in the testing and selection process of the varieties was very
limited. Besides, among the so far released bread wheat varieties, very limited were
recommended for moisture stress wheat growing part of the country. Therefore, it is not
possible to say that all these varieties had been properly utilized by the farmers. The
conventional wheat breeding approach in Ethiopia is based on the development of varieties
under high management level of experimental stations.
Dugda and Lume districts of east Shoa zone are drought prone area and the improved varieties
of wheat were not well popularized. A possible option for addressing this constraint is
increasing varietal adoption through participatory variety selection and mobilizing farmers to
produce good quality seed of the improved varieties suited for their environment and seed
marketing at local levels. This experiment was, therefore, designed to evaluate wheat varieties
with farmers group in order to know farmers variety selection criteria, identify adaptable and
most preferred variety for further production in the study area.

33
Proceeding of Adaptation and Generation of Agricultural Technologies IQQO AGP-II
Materials and Methods
Four improved varieties of bread wheat viz Bika, Ogolcha, Kekeba, and King Bird and
farmer’s variety (Hawi) were include in this study. The characteristic of each variety is
presented in Table 1. All varieties were released for the the moisture stress areas of the
country. The study was conducted at Dudga and Lume districts of east Shoa zone. The
altitude of the districts varies from 1600 m.a.s.l (Ziway Lake) to 2020 masl (Bora Mountain).
At Lume district two kebele namely Bika and Ejersa-Joro and at Dugda district one Kebele
(Tephochorke) were selected for this study. At each Kebele, one FREG was established and
three host farmers were selected from each Kebele. Date of maturity, altitude range of
recommendation, rainfall requirement and the yield potential under research managed
condition of the bread wheat varieties used in this study were presented in Table 1.
Table 1. Maturity, adaptation area and yield potential of bread wheat varieties included in this
study
Characteristics Varieties
Bika Ogolcho Hawi Kekeba Kingbird
Days to maturity 95 102 105-125 90-120 90-120
Yield (qt ha-1) 32-54 33-50 40 33-52 33-52
Altitude 1600-1950 1600-2000 1800-2200 1500-2200 1500-2200
Rainfall 450-800 400-500 >500 500-800 500-800
The experiment was laid out in randomized complete block design and each host farmer was
considered as replication. The experimental fields were prepared using oxen plow. Seed was
sown at the rate of 85 kgha-1 in rows (20cm between rows). As source of nitrogen UREA with
the rate of 100kg/ha was applied half at planting and the remaining half was top-dressed at 15
days after planting. Plots were kept free of weeds.
Two FREG at Lume and one at Dugda districts were established. A group consisting of 15 to
20 farmers was organized to form one FREG. From each FREG three farmers were selected
to host the field trials. Participatory evaluation of bread wheat varieties was done at early
harvest of the crop. Farmers in each FREG were invited to determine their own selection

34
Proceeding of Adaptation and Generation of Agricultural Technologies IQQO AGP-II
criteria. Firstly, discussion was made among farmers on plant characters to be used for bread
wheat variety selection. From the discussion made, traits such as seed color, early maturity,
drought tolerance, biomass yield, tillering ability and yield were raised as important criteria.
Finally, traits such as grain yield, drought tolerance and early maturity were identified as the
top three criteria for selection. Grain yield and other traits like plant height, tiller per plant,
seed per spike, thousand seed weight, spike length, and effective tiller were recorded and
analyzed.
Results and Discussion
Combined analysis of variance showed that there was significant variation among the studied
varieties for plant height, effective tiller and spike length (Table 2). However, the difference
among the varieties for gain yield were not statistically significant. This may be due the effect
of moisture stress on the productivity of the varieties. Grain yield, spike length and seed per
spike were significantly affected by location. Variety by location interaction for grain yield
was not significant.
Table 2. Mean square for agronomic characteristics of bread wheat
Source of variation Df PH(cm) TPP ET SL SPS GY(qtha-1)
Varieties 4 648.94* 4.15ns 5.14* 2.58** 240.36ns 31.43ns
Location 2 36.22ns 2.22ns 1.60ns 1.09** 38.14** 15.995**
varieties x location 6 30.78ns 0.86ns 0.49ns 0.24ns 19.08*** 4.499ns
CV (%) 12.5 12 28 6.9 7 7.9
In terms of grain yield performance, Kingbird, Kekeba and Ogolcho gave comparable yield
and showed better than Bika and Hawi. These varieties showed 12% yield advantage over the
local check (Hawi) and Bika (Table 3).

35
Proceeding of Adaptation and Generation of Agricultural Technologies IQQO AGP-II
Table 3. The main effect of varieties and environment on agronomic characters of bread
wheat
Varieties PH ET SL GY(qt ha-1)
Kingbird 64.8ab 2.9ab 7.4ab 23.8
Kekeba 63.4ab 2.5b 7.8a 23.8
Ogolcho 65.1a 3.6a 7.0b 23.7
Bika 60.1b 3.3a 7.9a 21.0
Hawi (local check) 63.1ab 3.1ab 7.5ab 21.2
SE (±) 1.673 0.29 0.135 0.61
LSD0.05 4.882 0.84 0.39 1.79
Grain yield, drought tolerance and early maturity were among the top three farmers selection
criteria for selecting bread wheat varieties. Other traits such as seed color, disease
resistance/tolerance, biomass and tillering ability of the varieties were considered for ranking
the varieties. At Tepho Choroke kebele of Dugda district King Bird and Ogolcho were
selected as a top two preferred bread wheat varieties (Table 4).
Table 4. Bread wheat variety ranking at Tepho Choroke kebele of Dugda district
Varietie
s
seed
color
early
maturity
drought
tolerance
disease
tolerance
Bioma
ss
tillering
ability yield
Rankin
g index
Overall
rank
Bika 3 5 5 1 2 5 4 125 5
Hawi 3 2 1 5 1 1 4 85 4
Kekeba 3 2 1 1 2 2 2 65 3
Kingbir
d 1 1 1 1 2 2 1 45 1
Ogolcho 2 1 1 1 2 2 3 60 2
At both Bika and Ejersa-Joro kebele of Lume district participatory evaluation of bread wheat
varieties conducted at early harvesting stage of the crop by 15 farmers (6 women and 9 men)
at each location. The farmers agreed that spike length, early maturity, seed size, seed color,

36
Proceeding of Adaptation and Generation of Agricultural Technologies IQQO AGP-II
and yield are important parameters for bread wheat variety selection at both Bika and Ejersa
Joro Kebele. Among all these traits, grain yield, spike length and early maturity were selected
as the top three important selection criterions. Accordingly, Ogolcho and King Bird were
selected as the best two preferred bread wheat variety by the farmers at both Bika and
EjersaJoro kebeles (Table 5)
Table 5. Bread wheat variety ranking at Bika and Ejersa Joro kebele of Lume district
Varieties
Spike
length
Early
Maturity
Seed size
and color Yield
Ranking
index Overall rank
Bika 3 5 3 4 75 4
Hawi 5 3 4 5 85 5
Kekeba 4 2 4 2 60 3
Kingbird 2 1 2 3 40 2
Ogolcho 1 3 1 1 30 1
Conclusion and recommendation
At Tephochorke PA of Dugda district the top three selection criterion were yield, drought
tolerance and early maturity. Based on these selection criteria, King bird and Ogolcho were
selected as the best two preferred bread wheat varieties. While at EjersaJoro and Bika PA
farmers selection criteria were yield, spike length and early maturity. Similar to that of
Tephochoroke PA, Ogolcho and King bird were selected as the top two preferred bread wheat
varieties by the farmers at Bika and EjersaJoro PAs. The result of this study showed that
Ogolcho and king bird were the best two varieties selected by farmers for both Dugda and
Lume districts.
References
Bellon, M. R. and Reeves,J 2002. Quantitative Analysis of Data from Participatory Methods
in Plant Breeding. AgEcon, 103: 233-244, 2002.
CSA (2015). Area and Production of crops (Private peasant holdings, Meher season).
Statistical Bulletin 578. Addis Ababa, Ethiopia.

37
Proceeding of Adaptation and Generation of Agricultural Technologies IQQO AGP-II
MNR (Ministry of Agriculture and Natural Resources), 2016. Plant variety Release,
Protection and Seed Quality Control Directorate. Crop variety register ISSUE No. 18.
Addis Ababa, Ethiopia.
Participatory variety selection of Chickpea (Cicer arietinum L.) Varieties at
Dugda Districts, mid rift valley of East Shoa zone, Oromia.
Fiseha Tadesse*, Urgaya Balcha, Temesgen Dinsa, Kedir Wako, Tesfaye Gemechu and
Ayana Etana
Oromia Agricultural Research Institute, Adami Tulu Agricultural Research Center.
*Corresponding author: Email: [email protected], Batu, Ethiopia
Abstract
Chickpea is one of the most important food legume commonly used for human nutrition, and it
is second most important among pulses in the world and in Ethiopia. Production of this crop
was mainly depends on traditional varieties where the yield is considerable low as compared
to improved varieties. Therefore, there is a pressing need to introduce improved varieties to
farmers of the study areas. Accordingly, six varieties of chickpea were evaluated at Dugda in
participatory variety selection approach to identify high yielding variety of chickpea at
Dugda districts. Among the varieties tested, Minjar from Dessi type (26 Qt ha-1) gave higher
mean grain yield followed by Habru from Kabuli type (23 Qt ha-1). Participant farmers also
selected Minjar variety from Dessi type for its high grain, biomass yield, earliness and
uniform in maturity. In addition, Habru from Kabuli type showed better grain yield and well
adapted to the area and thus highly preferred by the farmers.
Keywords: chickpea; participatory variety selection; Ethiopia
Background and Justification
Chickpea as a one of the most important food legume commonly used for human nutrition and
it is second most important among pulses in the world and being cultivated on more than 11
million hectares with annual production of 9 million tons (Anonymous, 2007). It is a high-
value pulse crop that is adapted to deep black soils in the cool semi-arid areas of the tropics,
sub-tropics as well as the temperate areas (Joshi et al., 2001; Shiferawet al., 2004). Ethiopia
has suitable agro-climatic conditions for production of both Desi and Kabuli type chickpeas.

38
Proceeding of Adaptation and Generation of Agricultural Technologies IQQO AGP-II
The crop is highly integrated into the farming system and ecologically friendly for growing in
many areas that suffer from soil nutrient depletion (Haile, 2010). The chickpea cultivated in
the country, which occupies about 239,755 hectares of land annually with estimated
production of 458682.2 tones (CSA, 2015).
Chickpea cultivation has many advantages such as improving crop production and
productivity, maintain soil fertility, and provide supplementary nutritional value for
consumer. Regardless of its importance, the production and productivity of the crop has been
limited to some Kebele in Dugda district. Therefore participatory variety selection of check
pea in districts is important to select based on farmers own criteria and suitable for farming
system and uses in the target area. Therefore, current research was initiated with the objective
to identify high yielding variety of chickpea in Dugda district and to demonstrate best adapted
chickpea technologies in the districts.
Materials and Methods
The study was conducted in Dudga districts of east Shoa zone. One potential kebele was
selected and three farmers were selected for the study based on the active involvement of the
farmers in the production of chickpea in the district. Six improved chickpea varieties were
selected for the trial. The varieties were Arerti, Habru, Tektay, Minjar, Natoli and Ejere.
The characteristics of each varieties is presented in Table 1 below.
Table 1. General Characteristics of chickpea varieties during their release
Characteristics Arerti Habru Tektay Minjar Ejere Natoli
Type Kabuli Kabuli Kabuli Desi Kabuli Desi
Days to 50% maturity 105-155 91-150 85-150 86-143 118-129 86-143
Areas of adaptation
Altitude (m) 1800-2600 1800-
2600
1800-
2600
1800-
2600
1800-
2600
1800-
2600
Rainfall 700-1200 700-1200 700-1200 120-140 700-1200 120-140
Yield (tha-1) 18-47 14-50 20-23 20-40 12-15 20-40

39
Proceeding of Adaptation and Generation of Agricultural Technologies IQQO AGP-II
Experimental Design
The experiment was laid down in randomized complete block design (RCBD) and number of
farmer’s field on which the trials were conducted were considered as replications. Packaged
production technologies (seed rate, seed treatment, spacing, fertilizer and weed management)
recommended for the chickpea crop production was used to establish the trial.
The experimental field was prepared following the conventional tillage practice using oxen
plow. A plot size of 5m by 5m plot size with a between distance of 1m was used in the
experiment. Field layout was prepared and each treatment was assigned to experimental plots
within farmer field. Seeds were sown at the recommended rate of 110kgha-1 in rows at 40cm
apart and 10cm between plants.
Participatory Variety Selection (PVS) was carried out by farmers’ research group members
representing the farming community of the area. Farmers ranked each cultivar for all traits
based on their own selection criteria. Scoring was based on the number of genotypes tested
and the relative performance of each genotype. Overall Preferential Rank (OPR) was
calculated as the average of the trait scores.
Data collected and analysis
Major agronomic characteristics were considered in the current experiment which includes
plant height, primary branch, secondary branch, thousand seed weight, number of pod per
plant, number of seed per plant, and grain yield. All the data was subjected to ANOVA by
using the GLM procedure of Genstat software ver.15. Mean separation was performed at
P<0.05 using least significant difference (LSD) (VSN Int. ltd., 2012).
Results and Discussion
The analysis of variance revealed that varieties showed non-significant variation for plant
height, number of primary branch, number of secondary branch and grain yield at (P<0.05).
While genotypes showed significant difference at (P<0.01) for number of seed per pod, pod
number per plant and grain yield (Table 2).

40
Proceeding of Adaptation and Generation of Agricultural Technologies IQQO AGP-II
Table 2. Mean square of major agronomic characteristics of chickpea varieties at
Tephochorke PA of Dugda district
Source of variation PH PB SB SPP PNPP GYHa
Variety 54.18NS 0.5889NS 4.456NS 2263.56** 2263.56** 41.63**
CV (%) 12.2 2.1 33.4 12.7 12.5 20.9
The highest number of pod per plant was obtained from Habru (101) followed by Tektay (66);
while the lowest number of pod per plant was from Ejere variety (31). In the same way the
highest number of seeds per plant was also obtained from Habru variety followed by Teketey.
Top yielder in the current research were Minjar (26 Qt ha-1) followed by Habru (23Qt ha-1)
while the lowest yielder were Ejere (Table 3).
Table 3. Effect of variety on selected characteristics of chickpea varieties
Varieties PNPP SPP GYQt/ha
Habru (Kabuli) 101a 124a 23.33ab
Teketey (Kabuli) 66b 66bc 19.56ab
Natoli (Desi) 50c 54cd 19.48ab
Arerti (Kabuli 41cd 74b 16.25b
Minjar (Desi) 38d 63bc 25.65a
Ejere (Kabuli) 31d 47d 16.55b
SE (±) 6.27 9.05 4.21
LSD0.05 11.4 16.5 7.7
CV (%) 11.5 12.7 20.9
Participatory variety selection Farmer’s evaluation based own their own selection
criteria
Participatory evaluation of the varieties was conducted at harvest by 15 farmers (6 women
and 9 men) at Tephochoroke PA. Initially, discussion was made with farmers on plant
characters used by farmers for chickpea variety selection, and agreed that yield, early
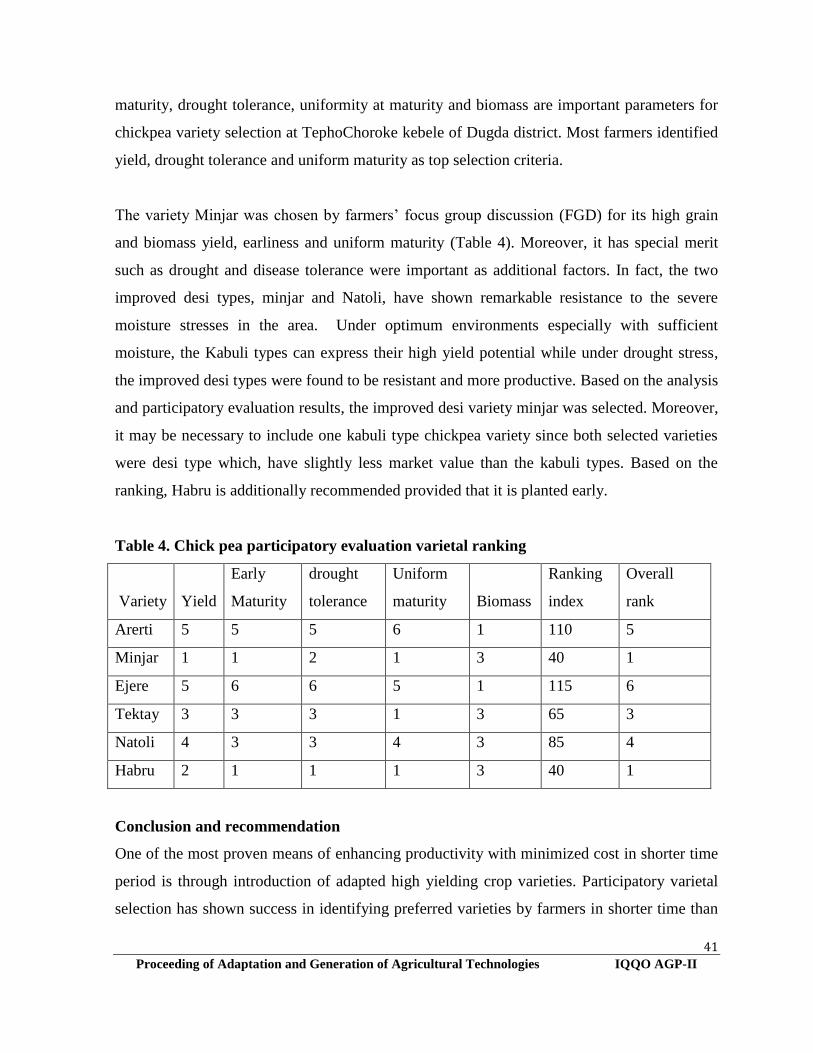
41
Proceeding of Adaptation and Generation of Agricultural Technologies IQQO AGP-II
maturity, drought tolerance, uniformity at maturity and biomass are important parameters for
chickpea variety selection at TephoChoroke kebele of Dugda district. Most farmers identified
yield, drought tolerance and uniform maturity as top selection criteria.
The variety Minjar was chosen by farmers’ focus group discussion (FGD) for its high grain
and biomass yield, earliness and uniform maturity (Table 4). Moreover, it has special merit
such as drought and disease tolerance were important as additional factors. In fact, the two
improved desi types, minjar and Natoli, have shown remarkable resistance to the severe
moisture stresses in the area. Under optimum environments especially with sufficient
moisture, the Kabuli types can express their high yield potential while under drought stress,
the improved desi types were found to be resistant and more productive. Based on the analysis
and participatory evaluation results, the improved desi variety minjar was selected. Moreover,
it may be necessary to include one kabuli type chickpea variety since both selected varieties
were desi type which, have slightly less market value than the kabuli types. Based on the
ranking, Habru is additionally recommended provided that it is planted early.
Table 4. Chick pea participatory evaluation varietal ranking
Variety Yield
Early
Maturity
drought
tolerance
Uniform
maturity Biomass
Ranking
index
Overall
rank
Arerti 5 5 5 6 1 110 5
Minjar 1 1 2 1 3 40 1
Ejere 5 6 6 5 1 115 6
Tektay 3 3 3 1 3 65 3
Natoli 4 3 3 4 3 85 4
Habru 2 1 1 1 3 40 1
Conclusion and recommendation
One of the most proven means of enhancing productivity with minimized cost in shorter time
period is through introduction of adapted high yielding crop varieties. Participatory varietal
selection has shown success in identifying preferred varieties by farmers in shorter time than

42
Proceeding of Adaptation and Generation of Agricultural Technologies IQQO AGP-II
the conventional system and thus accelerating their dissemination. Accordingly, this
experiment was conducted with the objective to test adaptability of improved chickpea
varieties. The highest grain yield was recorded for Desi type Minjar (26 Qt ha-1) followed by
Kabuli type Habru (23 Qt ha-1). Minjar was primarily chosen by farmers’ FGD for its high
grain and biomass yield, earliness and uniformity in maturing. Based on the analysis and
participatory evaluation results, the improved desi variety minjar was selected as a top yielder
variety followed by Habru for its grain yield and high marketability.

43
Proceeding of Adaptation and Generation of Agricultural Technologies IQQO AGP-II
References
Anonymous, 2007. FAO Statistical Databases.
Bejiga, G., Eshete, M. and Anbessa, Y. 1996. Improved cultivars and production technology
of chickpea in Ethiopia. DebreZeit Agricultural Research Center (DZARC),
DebreZeit, Ethiopia, 60pp.
Haile Abera, 2010. Chick pea production, Supply, demand and marketing issue in Ethiopia.
Addis Ababa, Ethioipia
CSA (Central Statistical Authority of Ethiopia). 2014. Agricultural sample survey 2014/15:
Statistical report on area and production of crops, farm management practices, farm
implements, machineries and storage mechanisms. Addis Ababa, Ethiopia.
Dadi, L., Regassa, S., Fikre, A. and Mitiku, D. 2005. Adoption of chickpea varieties in the
central highlands of Ethiopia. Research Report 62, Ethiopian Agricultural Research
Organization (EARO), Addis Ababa, Ethiopia
Duke, J.A. 1981. Handbook of legumes of world economic importance. Plenum Press, N. Y.
FAO “World Chick-Peas Production and Import/Export Data,”FAOSTAT Database,
Internet accessed, on 06/11/2015.
Joshi, P. K., Parthasarathy Rao, P, Gowda, C. L. L., Jones, R. B., Silim, S. N., Saxena, K.B
and Jagdish Kumar, 2001. The world chickpea and pigeonpea Economies: Facts,
Trends, and Outlook. Patancheru 502 324, Andhra Pardesh, India: International Crops
Research Institute for the Semi-Arid Tropics. 68 pp. ISBN 92- 9066-443-6. Order
code BOE 030
Menale Kassie, Bekele Shiferaw, Solomon Asfaw, TsedekeAbate, Geoffrey Muricho,
SetotawFerede, Million Eshete and Kebebew Assefa. 2009. Current Situation and
future outlook of the chickpea sub-sector in Ethiopia: International Crops Research
Institute for the Semi‐Arid Tropics.

44
Proceeding of Adaptation and Generation of Agricultural Technologies IQQO AGP-II
Effect of Different Weed Management Practices on Growth, Yield and Yield
Components of Faba Bean (Vicia faba L.) in Bale Highland Conditions, Southeastern
Ethiopia
Kissi Wakweya1 and Reta Dargie1
Oromia Agricultural Research Institute, Sinana Agricultural Research Center, P.O. Box 208,
Bale-Robe, Ethiopia. Corresponding author: [email protected]
Abstract
Weed is the major production constraints for faba bean production in Bale Highlands. Its
management is quite important to increase the production and productivity of the crop. To this
end, this experiment was conducted to address such pressing needs. The experiment was
conducted at Sinana on-station and on farmers’ field during 2015 and 2016 “Bona” main
cropping seasons to evaluate the effect of hoeing plus hand weeding frequencies on growth,
seed yield and yield components of faba bean. The treatments consisted of eleven weed
management options. It was laid out in a randomized complete block design (RCBD) with
three replications. Results indicate that faba bean plant flower and mature early when
infested with weeds as compared to well weed controlled treatments at both sites. The growth
and yield attributes of faba bean were significantly reduced when the crop left unweeded. The
result also showed there was 41% and 35% yield reduction due to total weed infestation of
faba bean as compared to the recommended two times hand weeding at on-station and on-
farm, respectively. Hoeing at 7 DAE plus twice hand weeding gave a yield advantage of 51%
and 17% as compared to weedy check and the recommended two times hand weeding at on-
station. There was 51% and 41% yield penalty while farmers remove weed at 50% pod setting
stage for the purpose of feeding their livestock as compared to hoeing at 7 DAE plus twice
hand weeding and the recommended two times hand weeding at on-station. Similarly, there
was a yield loss of 17% if weed removal at 50% pod setting stage as compared to the
recommended two times hand weeding and hoeing at 28 DAE plus once hand weeding at 40-
45 DAE at on-farm. The economic analysis indicated that the highest marginal rate of return
was obtained from hoeing at 7 DAE plus hand weeding at 25-30 DAE at both locations.
Therefore, it was economically profitable to manage weeds in faba bean field and increase
production and productivity of the crop in Bale highlands and similar agro-ecologies.
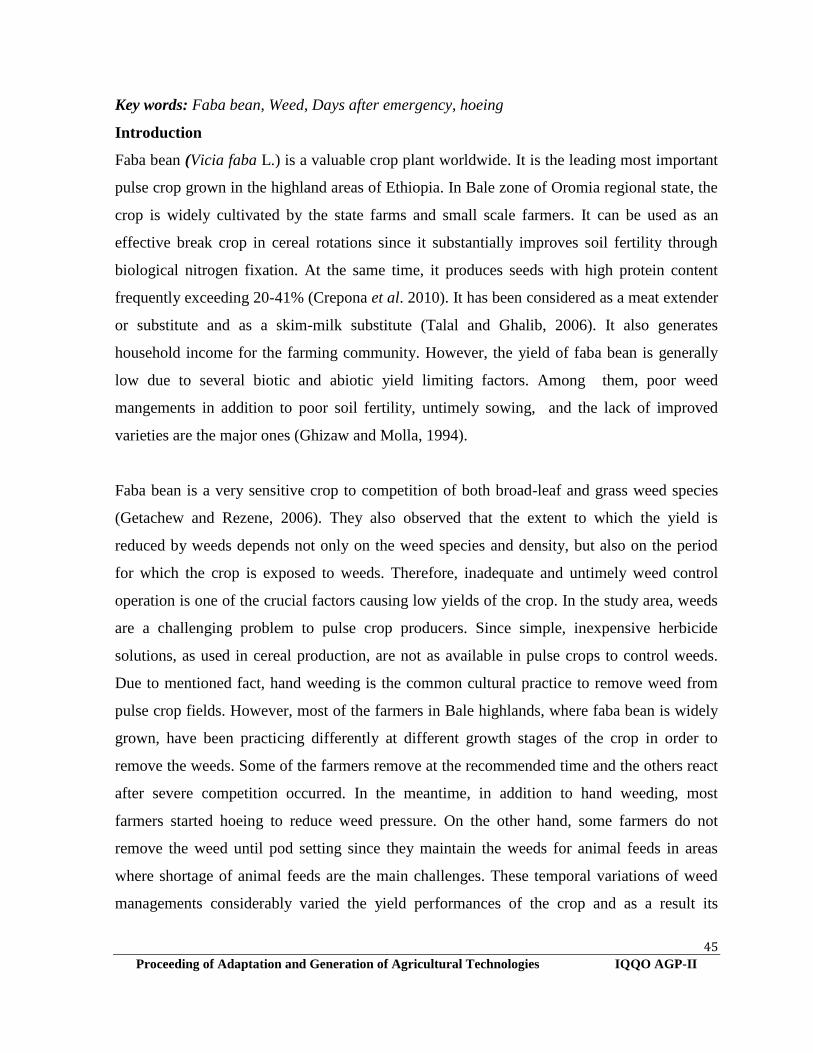
45
Proceeding of Adaptation and Generation of Agricultural Technologies IQQO AGP-II
Key words: Faba bean, Weed, Days after emergency, hoeing
Introduction
Faba bean (Vicia faba L.) is a valuable crop plant worldwide. It is the leading most important
pulse crop grown in the highland areas of Ethiopia. In Bale zone of Oromia regional state, the
crop is widely cultivated by the state farms and small scale farmers. It can be used as an
effective break crop in cereal rotations since it substantially improves soil fertility through
biological nitrogen fixation. At the same time, it produces seeds with high protein content
frequently exceeding 20-41% (Crepona et al. 2010). It has been considered as a meat extender
or substitute and as a skim-milk substitute (Talal and Ghalib, 2006). It also generates
household income for the farming community. However, the yield of faba bean is generally
low due to several biotic and abiotic yield limiting factors. Among them, poor weed
mangements in addition to poor soil fertility, untimely sowing, and the lack of improved
varieties are the major ones (Ghizaw and Molla, 1994).
Faba bean is a very sensitive crop to competition of both broad-leaf and grass weed species
(Getachew and Rezene, 2006). They also observed that the extent to which the yield is
reduced by weeds depends not only on the weed species and density, but also on the period
for which the crop is exposed to weeds. Therefore, inadequate and untimely weed control
operation is one of the crucial factors causing low yields of the crop. In the study area, weeds
are a challenging problem to pulse crop producers. Since simple, inexpensive herbicide
solutions, as used in cereal production, are not as available in pulse crops to control weeds.
Due to mentioned fact, hand weeding is the common cultural practice to remove weed from
pulse crop fields. However, most of the farmers in Bale highlands, where faba bean is widely
grown, have been practicing differently at different growth stages of the crop in order to
remove the weeds. Some of the farmers remove at the recommended time and the others react
after severe competition occurred. In the meantime, in addition to hand weeding, most
farmers started hoeing to reduce weed pressure. On the other hand, some farmers do not
remove the weed until pod setting since they maintain the weeds for animal feeds in areas
where shortage of animal feeds are the main challenges. These temporal variations of weed
managements considerably varied the yield performances of the crop and as a result its

46
Proceeding of Adaptation and Generation of Agricultural Technologies IQQO AGP-II
production and productivity across locations and seasons is low in which the average yield
under small holder farmers’ is not more 1.8t/ha as compared to its potential productivity
(3.8tha) the recently released variety (Variety registration year book, 2016). However, the
right time of hoeing and hoeing in combination with hand weeding frequencies and their
economic feasibility studies were lacking in the study area. Therefore, this study has been
designed to evaluate the effect of hoeing and hand weeding frequencies on growth, seed yield
and yield components of faba bean and to recommend economically profitable cultural weed
management options.
Materials and Methods
Experimental Sites
The experiment was conducted on research field of Sinana Agricultural research center and
Sinana on-farm in the highlands of Bale, South-eastern Ethiopia under rainfed conditions
during the main cropping season of 2015 and 2016. Sinana is located at a distance of about
463 km from Addis Ababa at about 7007’N longitude and 40010’E latitude, at an altitude of
about 2400 meters above sea level. The area is characterized by bimodal rainfall pattern
which is locally called “Bona” and “Ganna” based on the time of crop harvest. The seasonal
total rainfall of the area during the cropping seasons (2015 and 2016 main cropping season)
were 475 mm and 594mm, with the average minimum temperature of 15.81°C and 14.95°C
and maximum temperature of 21.37°C and 23.84°C respectively (Figure 1and 2). Soil of the
area was characterized by Cambisol. The preceding crops planted in experimental sites were
bread wheat which is the precursor of the current faba bean.
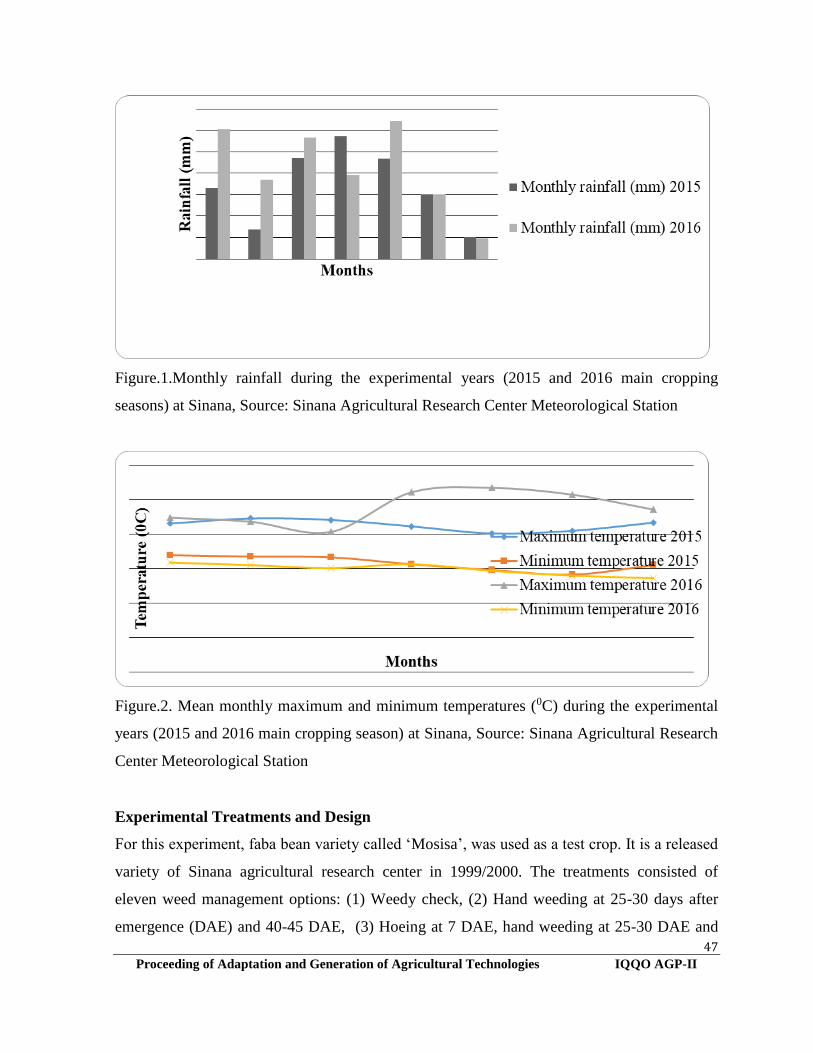
47
Proceeding of Adaptation and Generation of Agricultural Technologies IQQO AGP-II
Figure.1.Monthly rainfall during the experimental years (2015 and 2016 main cropping
seasons) at Sinana, Source: Sinana Agricultural Research Center Meteorological Station
Figure.2. Mean monthly maximum and minimum temperatures (0C) during the experimental
years (2015 and 2016 main cropping season) at Sinana, Source: Sinana Agricultural Research
Center Meteorological Station
Experimental Treatments and Design
For this experiment, faba bean variety called ‘Mosisa’, was used as a test crop. It is a released
variety of Sinana agricultural research center in 1999/2000. The treatments consisted of
eleven weed management options: (1) Weedy check, (2) Hand weeding at 25-30 days after
emergence (DAE) and 40-45 DAE, (3) Hoeing at 7 DAE, hand weeding at 25-30 DAE and
48
Proceeding of Adaptation and Generation of Agricultural Technologies IQQO AGP-II
40-45 DAE, (4) Hoeing at 7 DAE and hand weeding at 25-30 DAE, (5) Hoeing at 7 DAE
and hand weeding at 40-45 DAE, (6) Hoeing at 14 DAE, hand weeding at 25-30 DAE and 40-
45 DAE, (7) Hoeing at 14 DAE and hand weeding at 25-30 DAE, (8) Hoeing at 14 DAE and
hand weeding at 40-45 DAE, (9) Hoeing at 21 DAE and hand weeding at 40-45 DAE, (10)
Hoeing at 28 DAE and hand weeding at 40-45 DAE, (11) Hand weeding or weed harvesting
at 50% pod setting stage. The experiment was laid out in a randomized complete block design
(RCBD) replicated three times. Each plot consisted of 3 meter long 4 rows spaced 40 cm a
part. The size of each plot was 3m x 1.6m (4.8m2) and the adjacent blocks and plots were
separated by 1m and 0.6m distances, respectively. The net central unit area of each plot
consisted of 2 rows for sample measurements, leaving aside plants in the two outer rows and
those at both ends of each of the rows to avoid border effects. The distance between plants
was 10cm. The recommended seed rate of 125 kg ha-1 and 100 kg ha-1 NPS fertilizer was
uniformly supplied for each treatment at planting.
Partial Budget Analysis
The partial budget analysis was done using CIMMYT (1998) to identify the rewarding
treatments. Actual yields from experimental plots were adjusted down ward by 10% to reflect
the difference between the experimental yield and the yield that farmers could expect from the
same treatment. This is due to optimum plant population density, timely labor availability and
better management in weed control and better security under experimental conditions
(CIMMYT.1998). To find out the gross return the price of faba bean (sale price of 12.50 Birr
kg-1) prevailing in the local market at the time of harvest which is the average of one month
was taken into account. Similarly, the variable costs that vary included the cost of labor for
hoeing and hand weeding frequencies were; hoeing at 7, 14, 21 and 28 DAE was valued as
1800, 2100, 2400 and 2700 Birr ha-1 respectively. On the other hand, once hand weeding at
25-30 DAE and 40-45 DAE which followed hoeing was 1800 and 2100 Birr ha-1 respectively.
The two times hand weeding followed hoeing and once hand weeding was 1500 Birr ha-1and
weed removal at 50% pod setting stage was 2700 Birr ha-1. Two times hand weeding (at 25-30
and 40-45 DAE) without hoeing was 2400 and 2100 Birr ha-1 respectively.
49
Proceeding of Adaptation and Generation of Agricultural Technologies IQQO AGP-II
Data Collection
Data were collected on: Days to flower, days to maturity, plant height, number of pods per
plant, number of seeds per pod, aboveground biomass yield (kg ha-1), seed yield (kg ha-1) and
1000 seed weight in gram were recorded from each net plot. Thus, Days to flower was
determined by counting the number of days from the date of emergency to the period when
50% of the plants had flower based on visual observations. Days to maturity was determined
by counting the number of days from the date of emergency to the period when 90% of the
plants had reached the physiological maturity based on visual observations. Plant height (cm)
was measured in meter from five randomly selected plants in each net plot area from the base
to the tip (apical bud) of the main stem at physiological maturity. Number of pods per plant
was determined by counting the number of pods from each randomly selected non-border five
plants and the average count was taken as number of pods per plant. Number of seeds per pod
was determined by dividing the total number of seeds from five randomly selected non-border
plants by the total number of pods from each selected five plants. Aboveground dry biomass
yield (kg ha-1) were determined as; at physiological maturity, plants from the central four
rows of a net plot size 1.6m x3m (4.8m2) were manually harvested close to ground surface
using sickle. Then the harvested plants were sun dried in open air and then weighed to
determine the aboveground biomass yield per hectare. Seed yield (kg ha-1) was measured after
threshing the sun dried plants harvested from each net plot size 4.8m2 and the cleaned seed
yield was weighted using an electronic balance and adjusted at 10.5% seed moister content.
Finally, yield per plot was converted to per hectare basis. 1000 seed weight (g): was
determined by counting 1000 seeds randomly sampled from seed lots of each treatment and
weighted using an electronic balance.
Data Analysis
All the collected data were analyzed using SAS statistical software version 9.1.3 (2009). The
treatments were compared for their significance using calculated least significance difference
(LSD) values at 5% level of probability.
Result and Discussion

50
Proceeding of Adaptation and Generation of Agricultural Technologies IQQO AGP-II
In 2015/16 cropping season, the experiment was conducted at Sinana experimental station and
on-farm and all the required field data were collected. Even though the experiment was
repeated at the same locations in the second year (2016/17), the on-farm trial was totally
failed due to frost damage occurred before the time of maturity stage. Therefore, the current
report was summarized from the two years data of Sinana research station and one year data
from farmer’s field.
Table 1 and 2 showed that weed management practices had significant effect on all considered
parameters at both locations except number of seeds per pod at on-station and plant height,
number of pods per plant and 1000 seed weight at on farmer’s field. The result indicated that
hoeing either at 7 DAE and then hand weeding at 25-30 and 40-45 DAE or hoeing at 7 DAE
and then hand weeding at 25-30 DAE at on-station flowered late compared to other
treatments. On the other hand, hoeing at 7 DAE and followed by hand weeding at 40-45 DAE
and hoeing at 14 DAE and then hand weeding at 25-30 and then 40-45 DAE at on-farm
flowered lately compared to the other treatments. While weedy check plots were flowered
early at both locations. This may be due to resource competition caused narrow leaf which fix
low amount of nitrogen and less translocation of photosynthates from source to sink which
resulted in late flower formation. Regarding maturity period at both locations,, hoeing at 28
DAE with hand weeding at 40-45 DAE matured lately as compared to weedy check and weed
harvesting at 50% pod setting stage. This implies that the presences of weeds in the faba bean
field might cause severe resource competition with the crop that may leads to forced maturity.
The highest in plant height (114.3 cm) and number of pods per plant (13.9) at on-station were
recorded when hoeing at 7 DAE and hand weeding at 40-45 DAE and followed by hoeing at
7 DAE and hand weeding at 25-30 and then at 40-45 DAE, respectively. This may be early
weed removal facilitates plants to have more resources for growth. These results agreed with
Ahmed et al. (2011) and Bedry (2007), they found that twice hand weeding increased these
parameters while unweeded treatment had poor yield. Similarly, number of seeds per pod was
significantly influenced by weed management at on-farm while no significant variation was
observed at on-station. The highest number of seeds (2.9) was recorded by hoeing at 21 DAE

51
Proceeding of Adaptation and Generation of Agricultural Technologies IQQO AGP-II
and hand weeding at 40-45 DAE. This result was in line with Amaregouda et al. (2016)
reported the highest number of seeds per pod under weed free treatment while; the lowest was
obtained under weed infested treatment.
At Sinana on-station, different weed management practices significantly affected the biomass
yield, seed yield and 1000 seed weight. The highest biomass yield (9653 kg/ha) and grain
yield (4068.8 kg/ha) were obtained by hoeing at 7 DAE plus hand weeding at 25-30 and then
at 40-45 DAE. The next highest biomass (8125 kg/ha) and grain yield (3768.8 kg/ha) were
obtained when hoeing at 7 DAE plus hand weeding at 25-30 DAE were practiced. Hoeing at
early growth stage (7 DAE) in combination with hand weeding at 25-30 DAE and then at 40-
45 DAE had showed significant biomass and grain yield increase by 20% and 17%,
respectively, compared to hand weeding practices at 25-30 DAE and then 40-45 DAE (Table
1). This result implies that in addition to early established weed control, hoeing at early
growth stage may improve soil aeration that could help for effective microbial activities,
particularly for biological nitrogen fixation and hence N availability to the crop might be
improved. However, hoeing at or after 14 DAE and even with two times hand weeding at 25-
30 DAE and 40-45 DAE considerably reduced grain yield by not less than 31% as compared
to hoeing at 7 DAE plus two times hand weeding (25-30 and 40-45 DAE). The yield
reduction could be varied from 13-31% when hoeing at or after 14 DAE in combination with
different hand weeding frequencies at different crop growth stage. This result clearly revealed
that hoeing at early stage is a determinant effect on the yield performance of the crop in
Sinana and similar agro-ecological areas. However, the lowest biomass (3993 kg/ha) and seed
yield (1990 kg/ha) were obtained under weedy check and followed by weed harvesting at pod
setting stage.
Weed harvesting at pod setting stage significantly affected yield and about 47% and 51%
grain yield reduction were observed compared to hoeing at 7 DAE plus hand weeding at 25-
30 DAE and hoeing at 7 DAE plus hand weeding at 25-30 DAE and then 40-45 DAE,
respectively. This indicate that faba bean production without weeding until pod setting stage
significantly affected yield performance although farmers use the weed as animal feeds when

52
Proceeding of Adaptation and Generation of Agricultural Technologies IQQO AGP-II
the feed shortage is critical. Similar to this finding, Saad.(2003) and Sharara et al. (2005);
reported that faba bean hand hoeing resulted in a good control of weed.
At Sinana on-farm, various cultural weed management practices had significantly (P≤0.05)
influenced biomass yield. The maximum biomass yield (11667 kg ha-1) was obtained under
hoeing at 14 DAE plus one hand weeding at 25-30 and then at 40-45 DAE but, statistically in
par with most treatments. Whereas, the lowest value was recorded under weedy check (7431
kg ha-1) followed by weed removal at pod setting stage (8472 kg ha-1). The higher biomass
yield under intensive weed management practices might be due to the effect of weed control
from the early establishment of the crop by hoeing and then hand weeding that significantly
reduced the completion effect.
Moreover, plants under weed free environment might be obtained efficient resource
utilization, better translocation of water and nutrients, and more number of nodules per plant
which fix more amount of atmospheric nitrogen and supplied to the vegetative parts or sink
resulting in higher production of above ground biomass yield. In agreement with this result,
Getachew et al.(2017), reported the highest biomass yield were obtained at one hand weeding
plus hoeing at 4 weeks after crop emergency which was non-significantly different from one
hand weeding plus hoeing at 3 weeks after emergency, and complete weed free treatments.
They further reason out that it might be due to better condition in soil rhizosphere which
improved the competitive ability of the crop and favored more vegetative growth. Moreover,
Mizan et al. (2009); reported the increased biomass yield of the crop was highly governed by
the length of weed free period.
Concerning the seed yield (kg ha-1), all treatment means, except weedy check, were
statistically similar yield responses under various cultural weed management practices.
Hoeing plus different weeding frequencies statistically showed similar yield responses
compared to only two times hand weeding (25-30 DAE and 40-45 DAE) and even weed
harvesting at pod setting stage. Even though yield performance was not significantly different,
a 17% numerical yield reduction could be occurred when weed harvesting at pod setting stage

53
Proceeding of Adaptation and Generation of Agricultural Technologies IQQO AGP-II
was practiced as compared with hoeing at 28 DAE and then one hand weeding at 40-45 DAE
and two times hand weeding (25-30 DAE and 40-45 DAE). This result, indicated that weed
pressure at early crop establishment were low as compared to Sinana on-station. Since, at
Sinana on-station early weed management practices resulted in positive yield response as
compared to on-farm which respond to late weed management like hoeing at 28 DAE and
then at 40-45 DAE and two times hand weeding at 25-30 DAE and then 40-45 DAE. From
these two contrasting result it was observed that the variation was might be variation in
moisture availability or rainfall distribution happened during the experimental season. Thus,
during the experimental season at planting time, high amount of rainfall distribution was
observed at Sinana on-station not for less than two weeks as compared to on-farm. However,
enough moisture was observed at on-farm at crop maturity stage than on-station though,
separate meteorological data was not available. Therefore, from Sinana on-farm data, it was
observed that the highest seed yield was recorded when hoeing at 14 DAE plus one hand
weeding at 40-45 DAE and two times hand weeding at 25-30 DAE and then 40-45 DAE
followed by hoeing at 7 DAE plus one hand weeding 40-45 DAE. The result also showed
yield reduction of about 35% was observed when faba bean was unweeded completely as
compared to hoeing at 28 DAE and then one hand weeding at 40-45 DAE and two times hand
weeding at 25-30 DAE and then at 40-45 DAE.
Table.1. Effect of weed management practices on faba bean growth, yield and yield
components at Sinana research station during 2015 and 2016 main cropping season
Treatments DF DM PH
(cm)
PPP SPP BY
(kg/ha)
SY
(kg/ha)
TSW
(g)
1 55c 127ab 98.7c 7.4c 2.4 3993d 1990.2d 483bcd
2 55c 128a 98.7c 12.7ab 2.3 7708abc 3387.8abc 488bcd
3 57a 128a 103.1abc 13.9a 2.1 9653a 4068.8a 476bcd
4 57a 128a 104.2abc 11.7abc 2.2 8125ab 3768.8ab 463d
5 56abc 113b 114.3a 12.1ab 2.6 7465abc 3557.9abc 505ab
6 56abc 129a 98.9c 11.6abc 2.4 6528c 2803.7bcd 485bcd
7 56abc 128a 105.2abc 12.9ab 2.5 8021abc 3517.1abc 467cd
8 56abc 128a 111.7ab 12ab 2.3 5868cd 2635.8cd 500abc
9 55c 128a 100.9bc 12.3ab 2.5 6493bc 2988.5a-d 493a-d
10 55c 130a 101.2bc 11.8abc 2.4 7292bc 3229.0abc 527a
11 55c 127ab 100.3bc 9.2bc 2.3 4167d 1992.3d 493a-d
Mean 55.7 127 103.4 11.6 2.4 6846.6 3085.44 489.09
LSD (5%) 1.51 15.04 12.238 4.54 Ns 2252.4 1125.7 35.52

54
Proceeding of Adaptation and Generation of Agricultural Technologies IQQO AGP-II
CV (%) 2.33 10.26 10.22 33.76 17.1 28.39 31.49 6.27
Key: Means with the same letters are non-significant, DF= Days to flowering, DM= Days to
maturity, PH= Plant height, PPP= Pods per plants, BY= Biomass yield, SY =seed Yield,
TSW= Thousand seed weight, CV= Coefficient of variation, LSD= Least significant
difference.

55
Proceeding of Adaptation and Generation of Agricultural Technologies IQQO AGP-II
Table.2. Effect of weed management practices on faba bean growth, yield and yield
components at Sinana on-farm during 2015 main cropping season
Treatments DF DM PH
(cm)
PPP SPP BY
(kg/ha)
SY
(kg/ha)
TSW
(g)
1 63d 132b 132 13 2.3ab 7431d 2349b 496
2 64cd 134ab 137 19 2.6ab 10417abc 3616a 496
3 64cd 135ab 131 14 2.6ab 10764ab 3577a 484
4 65ab 134ab 132 15 2.5ab 10764ab 3392a 489
5 66a 135ab 135 15 2.7ab 9375bcd 3262a 493
6 66a 135ab 134 17 2.7ab 11667a 3338a 459
7 64cd 134ab 135 18 2.2b 10139abc 3231a 451
8 65ab 135ab 135 17 2.4ab 10972ab 3422a 493
9 64cd 134ab 132 14 2.9a 10347abc 3212a 465
10 65ab 136a 133 20 2.4ab 10139abc 3621a 498
11 65ab 132b 129 16 2.5ab 8472cd 2987ab 474
Mean 64.6 134.2 133 16.2 2.5 10044.3 3273.4 482
LSD (5%) 1.66 3.70 ns ns 0.65 2047.9 706.51 ns
CV (%) 1.51 1.62 4.91 24.1 15.1 11.97 12.67 6.95
Key: Means with the same letters are non-significant, DF= Days to flowering, DM= Days to
maturity, PH= Plant height, PPP= Pods per plants, BY= Biomass yield, SY =seed Yield,
TSW= Thousand seed weight, CV= Coefficient of variation, LSD= Least significant
difference
Economic analysis of different weed management options revealed that weed control in faba
bean by the use of hoeing plus hand weeding frequencies gave different economic return as
compared to weedy check, weed removal at 50% pod setting stage and hand weeding
frequency (Table 3 and 4). Thus, hoeing at 7 DAE plus two times hand weeding at 25-30 and
then at 40-45 DAE and two times hand weeding at 25-30 and then 40-45 DAE gave the
highest net benefit (40674.00 and 36180.00 birr) followed by hoeing at 7 DAE plus hand
weeding at 25-30 DAE and hoeing at 28 DAE plus hand weeding at 40-45 DAE with net
56
Proceeding of Adaptation and Generation of Agricultural Technologies IQQO AGP-II
benefits of (38799.00 and 35936.25 birr) from on-station and on-farm respectively. However,
the maximum marginal rate of return (455.8 and 406.2%) was recorded for hoeing at 7 DAE
plus hand weeding at 25-30 DAE at both locations and showed that it was an economical for
weed management option in faba bean production. Thus, it was concluded that the use of
weed management options as of hoeing at 7 DAE plus hand weeding at 25-30 DAE was more
economical than other weed management options designed in this study.
Conclusion and Recommendation
Weed pressure is the main driver factors that influence the production and productivity of faba
bean. Even though integrated weed management approaches is the best option for effective
and sustainable weed control, cultural practice is one of the best strategy for the control of
weed, particularly in areas where access to post or pre-emergence herbicide is very limited.
Among different cultural practices, hoeing and hand weeding are some of them. The result of
this experiment, which focused on different cultural practices, revealed that hoeing at 7 DAE
plus two times hand weeding (25-30 DAE and then at 40-45 DAE) at on-station and hoeing at
28 DAE plus once hand weeding at 40-45 DAE and twice hand weeding at 25-30 DAE and
the at 40-45 DAE performed the best yield advantage compared to other treatments (Table 1
and 2). However, hoeing at 7 DAE plus once hand weeding at 25-30 DAE at both locations
showed economically an optimum and more than minimum acceptable MRR (456% and
406%) and hence advisable for weed control in areas where the weed pressure under different
crop stage is very high. In the other hand, even though some farmers in the study areas
practiced weed harvesting at pod setting stage for the purpose of animal feeds when the feed
shortage is critical, significant yield losses were observed and hence not advisable for faba
bean production.

57
Proceeding of Adaptation and Generation of Agricultural Technologies IQQO AGP-II
Table 3.Economic and Marginal Analysis of Weed Control Practices at Sinana Research Station, Highlands of Bale, during 2015
and 2016 Main Cropping Seasons
Treatments Yield (kg/ha) AdY (kg/ha) GI (Birr) VC (Birr) NB (Birr) MRR (%)
Weedy check 1990.2 1791.2 22389.75 0 22389.75 ---
HW at 25-30 & 40-45 DAE 3387.8 3049.0 38112.75 4500 33612.75 D
Hoeing at 7 DAE+HW at 25-30 & 40-45 DAE 4068.8 3661.9 45774.00 5100 40674.00 125
Hoeing at 7 DAE + HW at 25-30 DAE 3768.8 3391.9 42399.00 3600 38799.00 456
Hoeing at 7 DAE + HW at 40-45 DAE 3557.9 3202.1 40026.38 3900 36126.38 D
Hoeing at 14 DAE+HW at 25-30 & 40-45 DAE 2803.7 2523.3 31541.63 5400 26141.63 D
Hoeing at 14 DAE + HW at 25-30 DAE 3517.1 3165.4 39567.38 3900 35667.38 D
Hoeing at 14 DAE + HW at 40-45 DAE 2635.8 2372.2 29652.75 4200 25452.75 D
Hoeing at 21 DAE + HW at 40-45 DAE 2988.5 2689.6 33620.63 4500 29120.63 D
Hoeing at 28 DAE + HW at 40-45 DAE 3229.0 2906.1 36326.25 4800 31526.25 D
Weed Removal at 50% Pod setting stage 1992.3 1793.1 22413.38 2700 20613.38 D
Table 4.Economic and Marginal Analysis of Weed Control Practices at Sinana On-farm, Highlands of Bale during, 2015 Main
Cropping Season
Treatments GY(kg/ha)
AGY(kg/ha)
GI(ETB) VC (ETB) NB (ETB) MRR (%)
Weedy check 2349 2114.1 26426.3 0 26426 - Weed Removal at 50% Pod setting stage 2987 2688.3 33603.8 2700 30904 166 Hoeing at 7 DAE + HW at 25-30 DAE 3392 3052.8 38160 3600 34560 406 Hoeing at 7 DAE + HW at 40-45 DAE 3262 2935.8 36697.5 3900 32798 D
Hoeing at 14 DAE + HW at 25-30 DAE 3231 2907.9 36348.8 3900 32449 D
Hoeing at 14 DAE + HW at 40-45 DAE 3422 3079.8 38497.5 4200 34298 D
HW at 25-30 & 40-45 DAE 3616 3254.4 40680 4500 36180 180 Hoeing at 21 DAE + HW at 40-45 DAE 3212 2890.8 36135 4500 31635 D
Hoeing at 28 DAE + HW at 40-45 DAE 3621 3258.9 40736.3 4800 35936 D Hoeing at 7 DAE + HW at 25-30 & 40-45
DAE
3577 3219.3 40241.3 5100 35141 D
Hoeing at 14 DAE + HW at 25-30 & 40-45
DAE
3338 3004.2 37552.5 5400 32153 D

58
Proceeding of Adaptation and Generation of Agricultural Technologies IQQO AGP-II
HW = Hand weeding, DAE = Days after emergency, AdY = Adjusted yield, GI = Gross income, VC = Variable cost, NB = Net
benefit, MRR = Marginal rate of return, D = Dominated
59
59
Proceeding of Adaptation and Generation of Agricultural Technologies IQQO AGP-II
References
Ahmed M. El Naim, Mona A. Eldouma, Elshiekh A. Ibrahim, Moayad, M. B. Zaied.2011.
Influence of Plant Spacing and Weeds on Growth and Yield of Peanut (Arachis
hypogaea L) in Rain-fed of Sudan. Journal of Advances in Life Sciences 1(2):45-48.
Amaregouda A, Jitendra Jadhav, Chetti MB and Nawalagatti.2013.Effect of Weedicides on
Physiological Parameters, Growth, Yield and Yield Components of Soybean (Glycine
max. L) and Weed Growth. Journal of Agriculture and Allied sciences 2(4).
Bedry K. A. 2007. Effect of weeding regimes on faba bean (vicia faba L.) yield in the
Northern State of Sudan. University of Khartoum Journal of Agricultural Science, 15:
220-231.
CIMMYT (International Maize and Wheat Improvement Center). 1998. From Agronomic
Data to Farmer Recommendations: Economics Training Manual Completely Revised
Edition, Mexico.
Crepona,K.Marget,P.,Peyronnet,C.,Carrouea,B. Arese p.and Duc,G,2010.Nutritional value of
faba bean(Vicia faba L.) Seeds for feed and food:Field Crop Research. 115:329-339.
Crop Variety Registration year book.2016. Issue Number.18: June, 2016 Addis Ababa,
Ethiopia.
Getachew Agegnehu and Rezene Fessehaie, 2006. Response of faba bean to phosphate
fertilizer and weed control on Nitisols of Ethiopian Highlands. Ital. J. Agron. Riv.
Agron., 2006, 2:281-290.
Getachew Mekonnen, J. J. Sharma, Lisanework Negatu and Tamado Tana. 2017. Effect of
Planting Pattern and Weeding Frequency on Weed Infestation, Yield Components and
Yield of Cowpea [Vigna unguiculata (L.) WALP.] in Wollo, Northern Ethiopia.
Journal of Agriculture, Forestry and Fisheries. Science Publishing Group. 6(4): 111-
122.
Ghizaw A., Molla A. 1994. Faba bean and field pea agronomy research. In: Telaye A., Bejiga
G., Saxena M.C., Solh M.B. (eds.): Cool-season food legumes of Ethiopia.
Proceedings of the 1st National Cool-season Food Legumes Review Conference, 16-
20 December, 1993, Addis Ababa, Ethiopia. ICARDA/IAR. ICARDA: Aleppo, Syria,
199-229.
60
60
Proceeding of Adaptation and Generation of Agricultural Technologies IQQO AGP-II
Mizan, A., Sharma, J. J. and Gebremedhin, W. 2009. Estimation of Critical Period of Weed-
Crop Competition and yield Loss in Sesame (Sesamum indicum L.). Ethiopian Journal
of Weed Management, 3(1) 39-53.
SAAD EL-DIN, S. A.2003. Efficiency of some weed control treatments on growth, yield and
its components of broad bean (Vicia faba L.) and associated weeds. Egyptian Journal
of Applied Science 18 (6B): 586-604.
SAS Institute Inc. 2009. SAS/Genetics TM 9.1.3 Cary, NC, SA.
SHARARA, F. A. A.; MESSIHA, N. K.; AHMED, S. A.2005. Performance of some faba
bean cultivars and associated weeds to some weed control treatments. Egyptian
Journal of Applied .Science, 20 (4):101-105.
Talal Thalji and Ghalib Shalaldeh. 2006. Effect of planting Date on Faba Bean (Vicia faba L.)
Nodulation and Performance under Semiarid conditions.

61
61
Proceeding of Adaptation and Generation of Agricultural Technologies IQQO AGP-II
The Effect of Pre-emergence Herbicide (dual gold) and Hand Weeding Frequencies on
Growth, Yield and Yield components of faba bean in Bale highlands
Kissi Wakweya1* and Reta Dargie1
Oromia Agricultural Research Institute/Sinana Agricultural Research Center, P.O.Box 208,
Bale-Robe, Ethiopia.
*Corresponding authors: [email protected]
Abstract
This experiment was conducted at Sinana on-station and Agarfa sub-site during 2015 and 2016
“Bona” cropping seasons to evaluate the effect of pre-emergence herbicide (dual gold 960 EC) and
hand weeding frequencies on yield and major yield components of faba bean. The treatments consisted
of five weed control methods: Weedy check, Two times hand weeding at 25-30 and 40-45 days after
emergence (DAE), Sole dual gold, Dual gold + once hand weeding at 25-30 DAE, and Dual gold +
two times hand weeding at 25-30 and 40-45 DAE. It was laid out in a randomized complete block
design (RCBD) with three replications. Results indicated that number of pods plant-1, total biomass
and seed yield kg ha-1 and 1000 seeds weight were significantly influenced by different weed
management options. The highest values for those parameters were obtained when dual gold at the rate
of 1.5Lha-1 plus once and twice hand weeding and two times hand weeding while the lowest was
recorded by weedy check and sole dual gold application. The result showed that more than 38%, 27%
and 33% yield advantages were obtained when dual gold application in combination with one and two
times hand weeding and only two times hand weeding was used respectively. Moreover, more than
7% yield advantage was obtained when dual gold plus two times hand weeding were practiced as
compared to only two times hand weeding. The result of marginal rate of return analysis indicated that
the highest net return was obtained from dual gold application at the rate of 1.5 Lha-1 plus two times
hand weeding. Therefore, it was concluded that dual gold was used as a supplemental herbicide to
control weeds from faba bean field in combination with hand weeding and also economically
profitable to use. However, it was needed to find out another pre or post-emergency herbicide which
control weeds without supplementing of hand weeding.
Key words: Faba bean, Dual gold, Days after emergency, Hand weeding

62
62
Proceeding of Adaptation and Generation of Agricultural Technologies IQQO AGP-II
Introduction
Faba bean (vicia faba L.) is one of the most important legume crops world wide since it is
nitrogen fixing leguminous plant, offering highquality protein, capable of returning
atmospheric nitrogen to the soil (Amin, 1988). Faba bean is one of the greatest production
areas among major pulse crops grown in Ethiopia (CSA, 2012).. However, its productivity is
very low compared to its potential productivity (1.3 ton ha-1 compared to 1.8 ton ha-1 of world
average) (FAOSTAT, 2010). One of the main factors that attribute to low productivity is
abiotic factors, of which poor weed control option is the most important one that influence its
production and productivity.
Weeds are a challenging problem to pulse crop in general and to faba bean production in
particular. Faba bean is a very sensitive crop to the competition of both broadleaf and grass
weed species (Getachew and Rezene, 2006). In line with this, Fessehaie (1994) reported that
faba bean suffered a significant yield loss of about 24% due to weed competition. Since the
crop is highly sensitive to weed competition from the early establishment to the early
flowering stage, it requires weed control during these critical period. Research finding
reported by Getachew and Rezene (2006).at Holeta area showed that, different weed control
options significantly affected plant height, number of pods per plant and seeds per pod.
Bale highland is a wheat belt area where many alternative choices of herbicides to control
weeds and mechanization for postharvest handling of the cereal crops were available
However, hand weeding is the only option to control weeds from faba bean fields due to
unavailability of pre and/or post emergence herbicides to control weeds in the area. But, dual-
gold 960 E C is one of the pre-emergency herbicide which is available to kill both grassy and
broadleaf weeds at the early and later growth stage of the crop to reduce yield loss. On the
other hand, integrated weed management approaches, like pre-emergence application
combined with hand weeding practices can be the best options for sustainable weed
management practices. However, in the study area, no work has been done, particulary on the
effect of the application of dual gold for the control of weed problem in faba bean. Therefore,
the present study was designed to evaluate the effect of pre-emergence herbicide ( dual gold)

63
63
Proceeding of Adaptation and Generation of Agricultural Technologies IQQO AGP-II
application and hand weeding frequencies on yield and yield components of faba bean and to
see the economic feasibility of this herbicide.
Materials and Methods
Description of the study areas
The experiment was conducted under rain-fed conditions at Sinana on-station and Agarfa sub-
site during 2015 and 2016 main cropping seasons. Sinana is located at a distance of about 463
km from Addis Ababa in the South-Eastern direction in the highlands of Bale Zone, South-
eastern Oromia, and33 km East of Robe town, the capital of the Bale Zone. It is located at
707’N longitude and 40010’E latitude, at an elevation of 2400 meters above sea level. On the
other hand, Agarfa is located at a distance of about 460 km from Addis Ababa in the South-
eastern direction situated in the highlands of Bale zone, South-eastern Oromia. It is situated at
380 40’to 4603’ East longitude and 40 to 80 11’ N latitude at 2350 meters above sea level. The
soils of the areas are characterized by Cambisol at Sinana and Vertisol at Agarfa. The
preceding crop planted in experimental sites was bread wheat which is the precursor of the
current faba bean.
Experimental Treatments and Design
For this experiment, faba bean variety called ‘Mosisa’, which was released from Sinana
agricultural research center, was used as a test crop. The treatments consisted of five weed
management options: Weedy check, two times hand weeding at 25-30 days after emergence
(DAE) and 40-45 DAE, sole pre-emergence herbicide (dual gold 960 EC) application, dual
gold + one times hand weeding at 25-30 DAE, dual gold + two times hand weeding at 25-30
DAE and 40-45 DAE. The experiment was laid out in a randomized complete block design
(RCBD) with three replications. The size of each plot was 3 m x 2.4 m (7.2 m2) and distances
between the plots and blocks were 0.6 m and 1.5 m, respectively. The distance between rows
and plants were 40 and 10 cm respectively. Pre-emergence herbicide Dual gold 960 EC at the
rate of 1.5 lit ha-1 with 200 lit ha-1 of water was applied at the third date of planting. The crop
was planted at the recommended seed rate of 125 kg ha-1 and 100 kg ha-1 NPS fertilizer (19%
N, 38% P and 7% S) was uniformly supplied for each treatment at planting.
64
64
Proceeding of Adaptation and Generation of Agricultural Technologies IQQO AGP-II
Partial Budget Analysis
To evaluate the economic benefits of shift in practice, partial budget analysis was done to
identify the rewarding treatments according to CIMMYT (1998). Actual yields from
experimental plots were adjusted down ward by 10% to reflect the difference between the
experimental yield and the yield that farmers could expect from the same treatment. This is
due to optimum plant population density, timely labor availability and better management
(e.g. weed control, better security) under experimental conditions (CIMMYT.1998). To find
out the gross return, the price of faba bean (sale price of 12.50 Birr kg-1 ) prevailing in the
local market at the time of harvest which is the average of one month was taken into account.
Similarly, the variable cost that vary included were the cost of input, the field price of Dual
gold herbicide during planting time which is 450 Birr lit-1 (the herbicide cost plus the cost of
transportation from the point of sale to the farm) and labor cost for its application 1-3 days
after planting was 50 Birr ha-1. On the other hand, labor cost for integrated use of herbicide
and hand weeding frequencies were; one and two times hand weeding which followed dual
gold application and one times hand weeding were valued as 2100 and 1500 Birr ha-1
respectively. In similar manner, the only two times hand weeding treatment of the first hand
weeding (25-30 DAE) was 2700 Birr ha-1 due to weed pressure was high in the absence of
herbicide in the early growth stage of the crop. All costs and benefits were calculated on
hectar basis in Ethiopian Birr.
Data Collection
Data were collected on days to flowering, days to maturity, plant height, number of pods per
plant, number of seeds per pod, biomass and seed yield (kg/ha) and 1000 seed weight(g) from
each net plot. Days to flower were determined by counting the number of days from the date
of planting to the period when 50% of the plants had flower based on visual observations.
Days to maturity were determined by counting the number of days from the date of planting
to the period when 90% of the plants had reached the physiological maturity based on visual
observations. Plant height (cm) was recorded by measuring from the base of the plant to the
tip of the plant panicle by taking five plants from each plot at mature stage. Number of pods

65
65
Proceeding of Adaptation and Generation of Agricultural Technologies IQQO AGP-II
per plant were determined by counting the pods from each selected five plant and the average
count was taken and reported as number of pods per plant. Number of seeds per pod were
determined by dividing the total number of seeds from five randomly selected non-border
plant by the total number of pods from each selected five plants. Above ground biomass yield
(kg ha-1) were determined as; at physiological maturity, plants from the central four rows of a
net plot size of 1.6 m x3m (4.8m2) were manually harvested close to the ground surface using
a sickle. The harvested plants were sun-dried in the open air and weighed to determine the
above ground biomass yield. Seed yield was measured from the harvested central unit area of
4.8 m2 and then seeds were cleaned following harvesting and threshing, weighted using an
electronic balance and adjusted to 10.5% moisture content. Finally, yield per plot was
converted to per hectare basis.1000 Seed Weight (g) was determined based on the weight of
1000 seeds randomly sampled from the seed lots of each treatment by counting using an
electric seed counter and weighing by an electronic balance.
Data Analysis
All the agronomic data collected were analyzed using SAS statistical software version 9.1.3
(2009). The treatments were compared for their significance using calculated least
significance difference (LSD) values at 5% level of probability.
Result and Discussion
Flowering and maturity date
Analysis of variance showed flowering and maturity date of faba bean was not significantly
influenced by the different weed management options (Table 1). The result indicated that
though the variation was non-significant, weedy check treatment flower and mature early as
compared to the other intensive weed management treatments. This might be due to weed
competition effect for resources which caused forced phonological growth of the crop.
Plant height

66
66
Proceeding of Adaptation and Generation of Agricultural Technologies IQQO AGP-II
Plant height was not significantly influenced by the different weed management methods.
Though it was statistically non-significant; the highest values were obtained under intensive
weed management methods (dual gold application plus one and two times hand weeding).
While the shortest plant height was recorded for only dual gold applied treatments. In
agreement with this result, Sadegh et al. (2013) reported that the highest plant height was
recorded at Bentazon + once hand weeding and the lowest at control treatment in red bean
(phaseolus calcaratus L). Similarly, Kavurmaci et al. (2010) also reported that, the tallest
plant was obtained in weed free treatment while the shortest plant was observed from control
treatment. In contrary, Getachew et al. (2017) reported that the highest plant height was
obtained in weedy check plot than intensive weed controlled plots. They pointed out that,
weed infested plot compete for resources especially for light throughout the season which
resulted in enhanced plant height in weedy check.
Number of pods per plant
Analysis of variance revealed that the highest number of pods per plant (12.3) were recorded
by applying dual gold plus one times hand weeding at 25-30 DAE though it was statistically
at par with other treatments except under use of only dual gold application. The highest
number of pods per plant under integrated use of herbicide plus hand weeding might be due to
integrated role of herbicide and hand weeding in weed control. Thus, application of a suitable
herbicide at the early growth stages controls weeds efficiently and hand weeding removed late
comer weeds which makes crop the winner of competition which resulted in formation of
more number of pods per plant. Similar result was reported by Sadegh et al (2013), who
explains the integrated role of both herbicide and hand weeding in weed control.
Number of seeds per pod
The different weed control options had showed non-significant effect on number of seeds per
pod of faba bean. These results are in line with Getachew and Mekdes (2016) who observed
the different weed management practices (different herbicides, herbicide plus hand weeding at
different week interval after emergency) did not show significant influence on number of
seeds per pod of cowpea. However, contrary to the current result, Amaregouda et al. (2016)
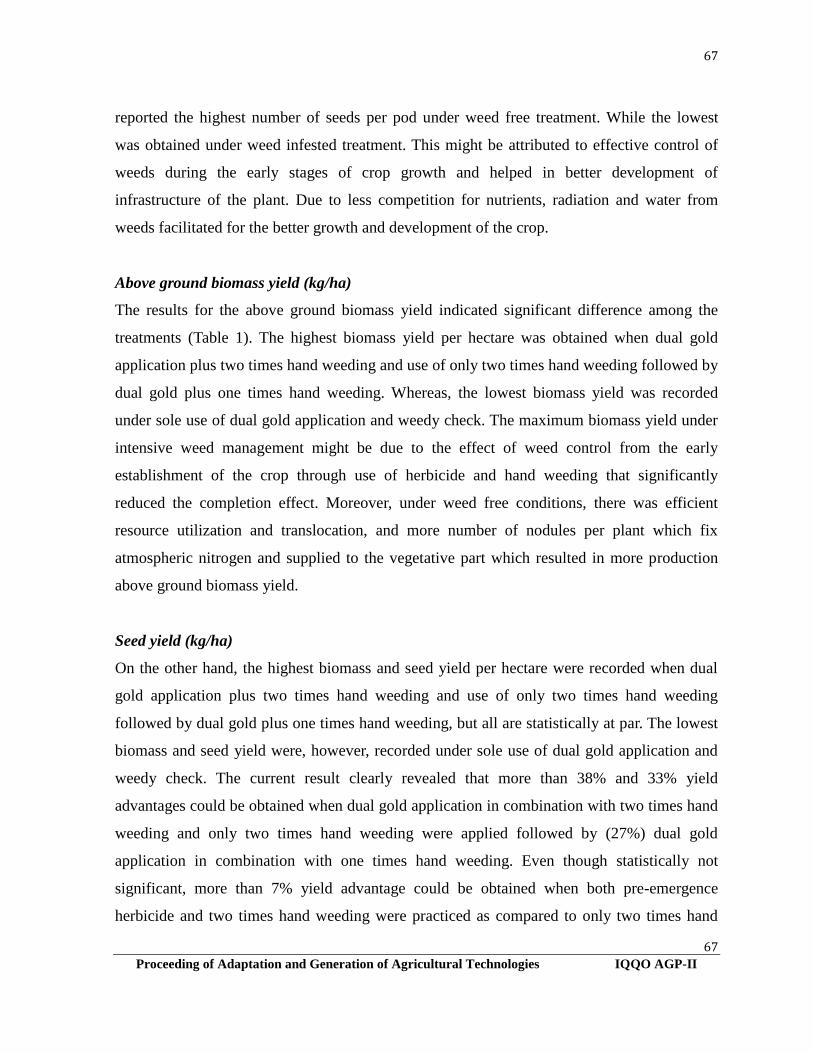
67
67
Proceeding of Adaptation and Generation of Agricultural Technologies IQQO AGP-II
reported the highest number of seeds per pod under weed free treatment. While the lowest
was obtained under weed infested treatment. This might be attributed to effective control of
weeds during the early stages of crop growth and helped in better development of
infrastructure of the plant. Due to less competition for nutrients, radiation and water from
weeds facilitated for the better growth and development of the crop.
Above ground biomass yield (kg/ha)
The results for the above ground biomass yield indicated significant difference among the
treatments (Table 1). The highest biomass yield per hectare was obtained when dual gold
application plus two times hand weeding and use of only two times hand weeding followed by
dual gold plus one times hand weeding. Whereas, the lowest biomass yield was recorded
under sole use of dual gold application and weedy check. The maximum biomass yield under
intensive weed management might be due to the effect of weed control from the early
establishment of the crop through use of herbicide and hand weeding that significantly
reduced the completion effect. Moreover, under weed free conditions, there was efficient
resource utilization and translocation, and more number of nodules per plant which fix
atmospheric nitrogen and supplied to the vegetative part which resulted in more production
above ground biomass yield.
Seed yield (kg/ha)
On the other hand, the highest biomass and seed yield per hectare were recorded when dual
gold application plus two times hand weeding and use of only two times hand weeding
followed by dual gold plus one times hand weeding, but all are statistically at par. The lowest
biomass and seed yield were, however, recorded under sole use of dual gold application and
weedy check. The current result clearly revealed that more than 38% and 33% yield
advantages could be obtained when dual gold application in combination with two times hand
weeding and only two times hand weeding were applied followed by (27%) dual gold
application in combination with one times hand weeding. Even though statistically not
significant, more than 7% yield advantage could be obtained when both pre-emergence
herbicide and two times hand weeding were practiced as compared to only two times hand

68
68
Proceeding of Adaptation and Generation of Agricultural Technologies IQQO AGP-II
weeding. This yield increment might be due to the effect of pre-emergence herbicide that
considerably control the weed infestation, particularly at the early establishment of the crop
that significantly reduce the competition. Hence, application of dual gold 1-3 days after
planting of the crop is very crucial to control early weed emergence. However, at least one
time hand weeding at a later stage is the most important practices as it was significantly
increased the yield performance of the crop compared to weedy check. In agreement with this
result, Diwash et al, (2014) reported that combined use of herbicide plus hand weeding
resulted in significantly higher seed yield of green gram.
1000 seed weight (g)
Contrary to the yield response, the highest 1000 seed weight (500.1g) was recorded when sole
application of dual gold and followed by only two times hand weeding and weedy check, but
all means showed statistical parity. However, the lowest values (461 and 471.3 g) were scored
by application of dual gold plus hand weeding at 25-30 DAE and two times hand weeding at
25-30 and 40-45 DAE, respectively. This result indicated that 1000 seed weight was inversely
correlated with a number of pods plant-1. This implies that as number of pods per plant
increase, there was more number of seeds per plant observed in which there is severe resource
competition between seeds. As a result, low 1000 seeds weight was recorded.
Table 1.Effect of Pre-emergency Herbicide (Dual-gold) on Faba Bean Growth, Yield and
Components of Yield at Sinana and Agarfa, in 2015 and 2016 Cropping Seasons
Treatments* DF DM PH
(cm)
PPP SPP BY
(kg/ha)
SY
(kg/ha)
TSW
(g)
Weedy check 61 121 101.9 9.8ab 2.4 6305.0b 2058.6b 481.9ab
Dual gold application 62 122 99.6 9.2b 2.3 7225.1b 2201.5b 500.1a
Dual gold + Hand weeded (1x) 63 125 107.0 12.3a 2.1 9030.7a 2808.2ab 461.0b
Dual gold + Hand weeded (2x) 63 124 104.6 10.6ab 2.4 9539.9a 3309.2a 471.3b
Hand weeded (2x) 62 123 101.7 10.0ab 2.5 9308.4a 3084.2a 479.1ab
Mean 62 123 103 10.4 2.3 8281.8 2692.3 478.7

69
69
Proceeding of Adaptation and Generation of Agricultural Technologies IQQO AGP-II
LSD (5%) Ns Ns Ns 2.50 Ns 1461.4 757.83 24.25
CV (%) 4.92 4.42 13.69 29.42 19.75 14.74 34.34 6.18
Key: Means followed by same letter(s) are not significantly different at 5% probability levels
following LSD, LSD = Least Significant Difference, CV = Coefficient of variation, ns = Non-
significant, DF = Days to flowering, DM = Days to Maturity, PH = Plant Height, PPP = Number of
pod per plant, SPP = Number of Seed per pod, BY = Biomass Yield, SY = Seed Yield, TSW =
Thousand Seed Weight.
Economic analysis
The Partial budget analysis for different weed control options in faba bean production
revealed that the use of pre-emergency herbicide (Dual gold 960 EC) combined with different
hand weeding frequencies gave a different economic return as compared to weedy check, and
either use of only pre-emergency herbicide or hand weeding alone (Table 2). Thus, application
of Dual gold at the rate of 1.5 lit ha-1 plus two times hand weeding at 25-30 and 40-45 DAE
gave the highest net benefit (32603.5 Birr) and marginal rate of return (575%). Alternatively,
application of dual gold combined with one time hand weeding is economically better than
two times hand weeding alone, particularly at critical labor competition for other farming
activities, since its MRR is greater implying that more return could be obtained as per unit
cost investment required to control the weed using dual gold application plus one time hand
weeding. This implies that uses of pre-emergence herbicide as supplemental weed control
options are very optimal in addition to hand weeding at the later stage.
In agreement with this result, Sadegh et al. (2013) reported that the maximum grain yield of
red bean was achieved in application of herbicide plus once hand weeding treatment. This
might be herbicide alone or hand weeding control methods were less effective in reducing the
number of weeds per unit area than using both chemical and hand weeding control methods.
Therefore, it can be concluded that the use of Dual gold (960 EC) application at 1-3 days after
planting in combination with two times hand weeding at 25-30 and 40-45 DAE could be used
as the best weed management options for faba bean production. Alternatively, combined use
of dual gold plus one time hand weeding at a later stage could also be advisable for the
control of weed in areas where labor competition is very high at critical period of time that
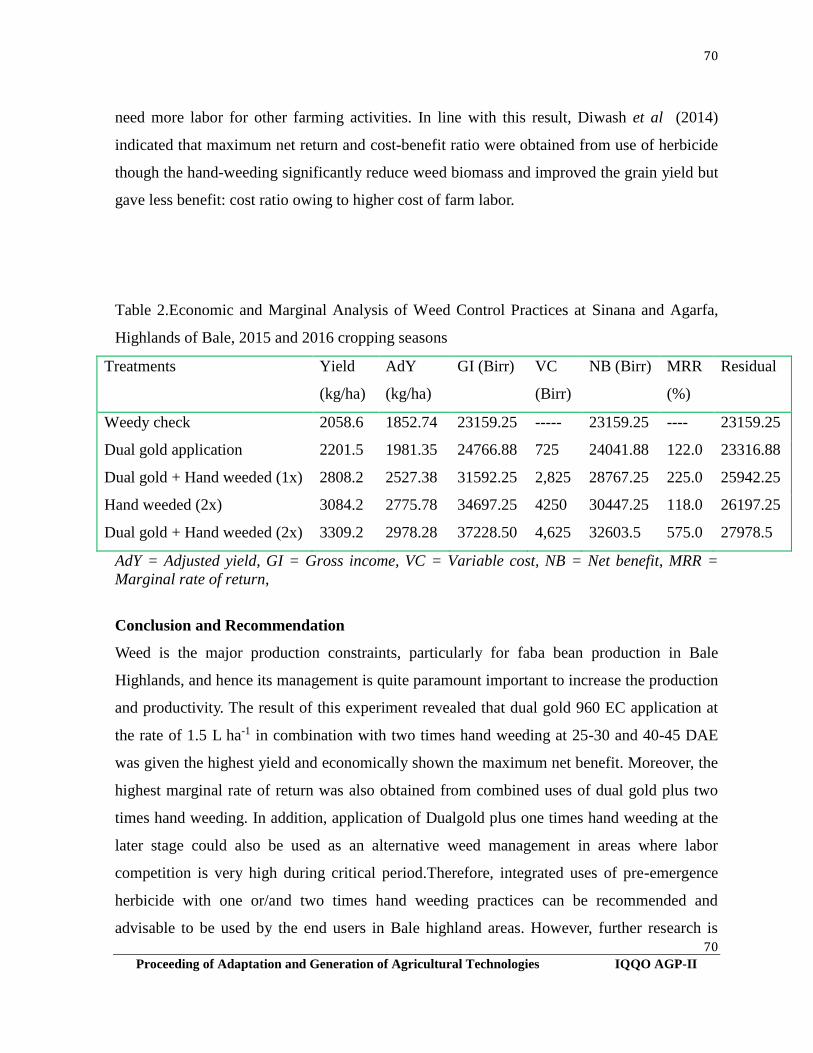
70
70
Proceeding of Adaptation and Generation of Agricultural Technologies IQQO AGP-II
need more labor for other farming activities. In line with this result, Diwash et al (2014)
indicated that maximum net return and cost-benefit ratio were obtained from use of herbicide
though the hand-weeding significantly reduce weed biomass and improved the grain yield but
gave less benefit: cost ratio owing to higher cost of farm labor.
Table 2.Economic and Marginal Analysis of Weed Control Practices at Sinana and Agarfa,
Highlands of Bale, 2015 and 2016 cropping seasons
Treatments Yield
(kg/ha)
AdY
(kg/ha)
GI (Birr) VC
(Birr)
NB (Birr) MRR
(%)
Residual
Weedy check 2058.6 1852.74 23159.25 ----- 23159.25 ---- 23159.25
Dual gold application 2201.5 1981.35 24766.88 725 24041.88 122.0 23316.88
Dual gold + Hand weeded (1x) 2808.2 2527.38 31592.25 2,825 28767.25 225.0 25942.25
Hand weeded (2x) 3084.2 2775.78 34697.25 4250 30447.25 118.0 26197.25
Dual gold + Hand weeded (2x) 3309.2 2978.28 37228.50 4,625 32603.5 575.0 27978.5
AdY = Adjusted yield, GI = Gross income, VC = Variable cost, NB = Net benefit, MRR =
Marginal rate of return,
Conclusion and Recommendation
Weed is the major production constraints, particularly for faba bean production in Bale
Highlands, and hence its management is quite paramount important to increase the production
and productivity. The result of this experiment revealed that dual gold 960 EC application at
the rate of 1.5 L ha-1 in combination with two times hand weeding at 25-30 and 40-45 DAE
was given the highest yield and economically shown the maximum net benefit. Moreover, the
highest marginal rate of return was also obtained from combined uses of dual gold plus two
times hand weeding. In addition, application of Dualgold plus one times hand weeding at the
later stage could also be used as an alternative weed management in areas where labor
competition is very high during critical period.Therefore, integrated uses of pre-emergence
herbicide with one or/and two times hand weeding practices can be recommended and
advisable to be used by the end users in Bale highland areas. However, further research is

71
71
Proceeding of Adaptation and Generation of Agricultural Technologies IQQO AGP-II
required to find out another pre and/or post-emergency herbicide which can control weed
problems without supplemental hand weeding practices.
72
72
Proceeding of Adaptation and Generation of Agricultural Technologies IQQO AGP-II
References
Amin A, 1988. Principles of Field Crops. Basra University Press, PP: 442-452.
Central Statistical Agency (CSA), 2012. Agricultural sample survey. 2011/2012 volume I
report on area and production of major crops. Statistical bulletin. May 2012, Addis
Ababa.
Central Statistical Agency (CSA).2013. Agricultural sample survey. Report on area and
production for major crops (private peasant holdings, meher season). Addis Ababa,
Ethiopia.
CIMMYT(International Maize and Wheat Improvement Center). 1998. From agronomic data
to farmer recommendations: Economics training manual completely revised edition,
Mexico.
Diwash Tamang, Rajib Nath and Kajal Sengupta.2014. Effect of Herbicide application on
Weed Management in Green Gram (vigna radiate). 3rd International Conference on
Agriculture and Horticulture. Conferences, Accelerating Scientific Discovery. October
27-29, 2014, India. Volume 2 Issue 4.
FAOSTAT .2010. Statistical databases and data sets of the Food and Agriculture Organization
of the United Nations.
Fessehaie R. 1994. Weed research in cool season food legumes. In: Telaye A., Bejiga G.,
Saxena M.C., Solh M.B. (eds.): Cool-season food legumes of Ethiopia. Proceedings of
the 1st National Cool-season Food Legumes Review Conference, 16-20 December,
1993, Addis Ababa, Ethiopia. ICARDA/IAR. ICARDA: Aleppo, Syria, 252-275.
Getachew Agegnehu and Rezene Fessehaie, 2006. Response of faba bean to phosphate
fertilizer and weed control on Nitisols of Ethiopian Highlands. Ital. J. Agron. Riv.
Agron., 2006, 2:281-290.
Getachew Mekonnen, J. J. Sharma, Lisanework Negatu and Tamado Tana. 2017. Effect of
Planting Pattern and Weeding Frequency on Weed Infestation, Yield Components and
Yield of Cowpea [Vigna unguiculata (L.) WALP.] in Wollo, Northern Ethiopia.
Journal of Agriculture, Forestry and Fisheries. Science Publishing Group. 6(4): 111-
122.
Getachew Mekonnen and Mekdes Dessie. 2016. Effect of Pre-emergence Herbicides on
Weeds, Nodulation and Yield of Cowpea [Vigna unguiculata (L.) WALP.] at Haik and
Mersa in Wollo, Northern Ethiopia. International Journal of Applied Agricultural
Sciences. Science Publishing Group. 2(6):99-111.
Kavurmaci, Z., U. Karadavut, K. Kökten and A. Bakoğlu, .2010. Determining critical period
of weed-crop competition in faba bean (Vicia faba). Int. J. Agric. Biol., 12: 318–320.
Sadegh Rahmatizadeh, Nour Ali Sjedi and Masoud Gomarian.2013. Response of Weeds and
Some Characteristics of Red Bean (phaseolus calcaratus L.) to Cultivation time and
Weeds Control Methods. International Journal of Farming and Allied Sciences. 2(20):
842-850.

73
73
Proceeding of Adaptation and Generation of Agricultural Technologies IQQO AGP-II
SAS Institute Inc. 2009. SAS/GeneticsTM 9.1.3 Cary,
Adaptation Study of Released Potato (Solanum tuberosum L.) Varieties for
Mid-altitudes of West and Kelem Wollega Zones
Dereje Abera*1, Zewudu Tegenu,2 Ashenafi Debela3 and Addisu Hailu4
Oromia Agricultural Research Institute Haro Sabu Agricultura Research Center, Haro Sabu,
Ethiopia
*Corresponding author email: [email protected]
Abstract
Adaptation trial of improved potato varieties were conducted at mata and Inango sites of
Haro Sabu Agricultural Research Centre (HSARC) during the 2015/2016 main planting
season with the objective of identifying adaptable, high yielding, insect pest and
diseaseresistant/tolerant varieties of potato. Seven improved potato varieties introduced from
Sinana and Holeta Agricultural Research Centers and one local check were evaluated using
Randomized Complete Block Design (RCBD) with three replications on gross plot size of 4.5
m × 3 m at spacing of 75 cmx30 cm between rows and plant, respectively. Inorganic
fertilizer- DAP-195 Kg/ha at planting while UREA-165 Kg/ha in split application (50% at
planting and the remaining 50% at pick vegetative stage) were applied. Data were collected
on thirteen traits and analysis of variance was done accordingly. The mean square for
specific loction indicated significant (p<0.01 or 0.05) varietal differences for all observed
traits except for number of tuber per hill (NTPH), number of marketable yield per hill
(NMYH), weight of marketable yield per hill (WMYH) and number of unmarketable yield per
hill (NUMYH) at Mata site; tuber size (TS) and number of unmarketable yield per hill
(NUMYH) at Inango site. The highest and significant mean performance of total tuber yield
(TTYQt-ha) were obtained from variety Belete followed by Gudane across locations. Gudane
and Jalane were the two earlier maturing varieties but Belete, Hunde and Ararsa were late
maturing. The disease data indicated that Jalane was significantly affected by bacterial blight
but Dagim, Belete, Gudane and Gera showed better resistance/tolerance. Therefore, Belete
and Gudane were identified as the best for different merits to be demonstrated and
popularized in the study areas and other similar agro-ecologies.
Key words: Solanum tubersom L., Adaptability, Yield Components

74
74
Proceeding of Adaptation and Generation of Agricultural Technologies IQQO AGP-II
Background and Justification
Potato (Solanum tubersom L.) is one of the most important food crops in developed as well as
developing countries. It is an important crop for smallholders in Kenya, Uganda and Ethiopia,
serving as both cash and food security crop. Potato is regarded as high-potential food security
crop because of its ability to provide a high yield of high-quality product per unit input with a
shorter crop cycle. It is considered to be one of the cheapest sources of energy and the
production of protein per unit land and it is the highest yielder among the four major food
crops (rice, maize, wheat and potato) (CIP and FAO, 1995). In Ethiopia it is the fastest
growing staple food crop and source of cash income for smallholders having high potential
for food security due to its high yield potential and nutritional quality, short growing period
(mostly< 120 days),and wider adaptability (Tewodros et al., 2014).
Irish potato is one of the major root crops produced in Ethiopia next to Taro/Godere and
sweet potato. The estimated producers of potatoes in both Belg and Meher season were
accounted 3,705,879 smallholders in the country (CSA, 2016). Most highlands with altitudes
ranging from 1,500 - 3,000 meters above sea level (m.a.s.l) and annual precipitation of 600 -
1,200 millimeters (mm) are suitable for potato cultivation (FAO, 2010). In west and kellem
wollega, farmers produced potato under rain fed, irrigation and residual moisture (bone) to
ensure food self-sufficiency and income generation. However, due to lack of improved and
adaptable potato varieties, farmers in these areas still use local potato variety which is
susceptible to disease and low yield potential. Moreover, farmers are following poor
agronomic and postharvest practices. Therefore, adaptation trial was carried out at Seyo and
Lalo Asabi sub-sites by collecting different released improved potato varieties from Sinana
and Holeta Agricultural Research Centers to identify adaptable and high yielding variety/ies.
75
75
Proceeding of Adaptation and Generation of Agricultural Technologies IQQO AGP-II
Materials and methods
The study was conducted at Mata sub site of Sayo district in Kelem Wollega and Inango sub
site of Lalo Asabi district in West Wollega during 2015/16 main cropping season from June to
November. These sites are located in western Ethiopia, Oromia Regional state. Seven
improved potato varieties introduced from Sinana and Holeta Agricultural Research Centers
(Dagim, Belete, Gudane, Hunde, Ararsa, Jalane and Gera) and one Local Check were
evaluated using Randomized Complete Block Design (RCBD) with three replications. The
gross plot size was 13.5 m2 (4.5 m × 3 m) arranged in six rows of 75 cm spacing between
rows and 30 cm between plants. The net plot size was 3 m × 3 m (9 m2). A spacing of 1.5 m
and 1 m between blocks and plots was maintained, respectively. Inorganic fertilizer DAP-195
Kg/ha at planting while UREA-165 Kg/ha were applied in split (50% at planting and the
remaining 50% was applied during earthling-up or hoeing). Field data were collected for
thirteen traits and analyzed using SAS statistical package (SAS, 2006 version 9.1.3).
Results and discussions
Analysis of Variance
Analysis of variance at Inango site revealed significant (p<0.01 or p<0.05) difference for all
traits with the exception of TS, NUMY and WUMY which were non-significant. On the other
hand, DE, NTPH, NMY, WMY, NUMY, and WUMY showed non-significant difference
while the remaining showed significant difference among varieties at Mata (Table 1).

76
76
Proceeding of Adaptation and Generation of Agricultural Technologies IQQO AGP-II

77
77
Proceeding of Adaptation and Generation of Agricultural Technologies IQQO AGP-II
Table 1: (Continued)
SV DF Mean square
NMY WMY NUMY TTY(Qt-ha) DR
Inango Mata Inango Mata Inango Mata Inango Mata Inango Mata
Replication 2 18.5 33.04 0.3* 0.08 6.13 33.04 4495.49* 607.62 0.12 0.05
Variety 7 78.80* 26.14 0.33* 0.13 5.24 26.14 6455.75** 6485.06** 0.91* 0.90**
Error 14 14.21 19.14 0.03 0.07 7.08 19.14 325.18 386.1 0.16 0.08
Key: DE = Days to 50% emerging, DM = Days to 90% maturity, DR=disease reaction, SCH = stand count at harvest, NMS = Number of main
stem, TS= tuber size in centimeter, NTPH = Number of tuber per hill, NMYH=Number of marketable yield per hill, WMYH=weight of
marketable yield per hill, NUMYH= Number of unmarketable yield per hill, SV=source of variation, WUMYH= Weight of marketable yield
per hill, TTY Qt-ha =total tuber yield in quintal per hectare.
Table 1: Analysis of Variance (ANOVA) of potato adaptation trial
SV DF Mean square
DE DM SCAH NMS TS NTPH
Inango Mata Inango Mata Inango Mata Inango Mata Inango Mata Inango Mata
Replication 2 1.04 0.17 7.29 9.04* 36.17 21.38 11.38* 11.38* 0.53 0.51 0.67 4.88
Variety 7 7.90* 3.23 134.23** 163.12** 114.19* 83.04* 26.99** 26.99** 0.56 0.69* 16.19* 9.71
Error 14 0.8 2.07 1.91 2.14 18.26 8.47 2.42 2.42 0.34 0.22 3.38 7.59

78
78
Proceeding of Adaptation and Generation of Agricultural Technologies IQQO AGP-II
Mean Performance of Yield and Yield Components
Mean separation was carried out for traits showing significant difference among the
genotypesin each location and combined over locations using least significant difference
(LSD) as suggested by Gomez and Gomez (1984). Different mean performance was observed
among varieties for most of the traits in present study and the results were presented in tables
2, 3 and 4). Statistically significant mean squares were observed among the tested varieties for
most of the traits at each location and combined over locations.
Yield components
Gudane, Belete, Jalane and Gera showed significantly higher mean value of total tuber yield
(TTY Qt ha-1) than the local check, however, Gudane (287.8 and 307) and Belete (262.6 and
303.9) were significantly higher yielder than the rest of the varieties at Inango and in the
combined over locations analysis, respectively. However, varieties such as Hunde, Ararsa and
Jalane showed lower mean tuber yield as compared to the local check at Mata (Table 2).
Hunde exhibited significantly lower mean value of Marketable yield (WMY Qt ha-1) than
Dagim, Gudane and Belete at both locations. Nevertheless, Hunde showed significantly lower
mean value of WMY as compared to Belete and Dagim only in the combined analysis (Table
2).
The highest mean value of number of marketable yield (NMY) was obtained for Gudane and
Jalane over local check at Inango. In contrary, no significant difference observed among
varieties for NMY at Mata site. None of the varieties recorded significantly higher mean value
of tuber size (TS) over the local check at Inango and in the combined analysis. However,
Dagim, Ararsa and Gera have higher mean value of TS at Mata (Table 2). Present study
identified Gudane as the exceptional variety with significant and higher mean value of
number of tuber per hill (NTPH). However, all the remaining varieties showed similar
performance as compared to the local check at both locations and in combined analysis (Table
2).
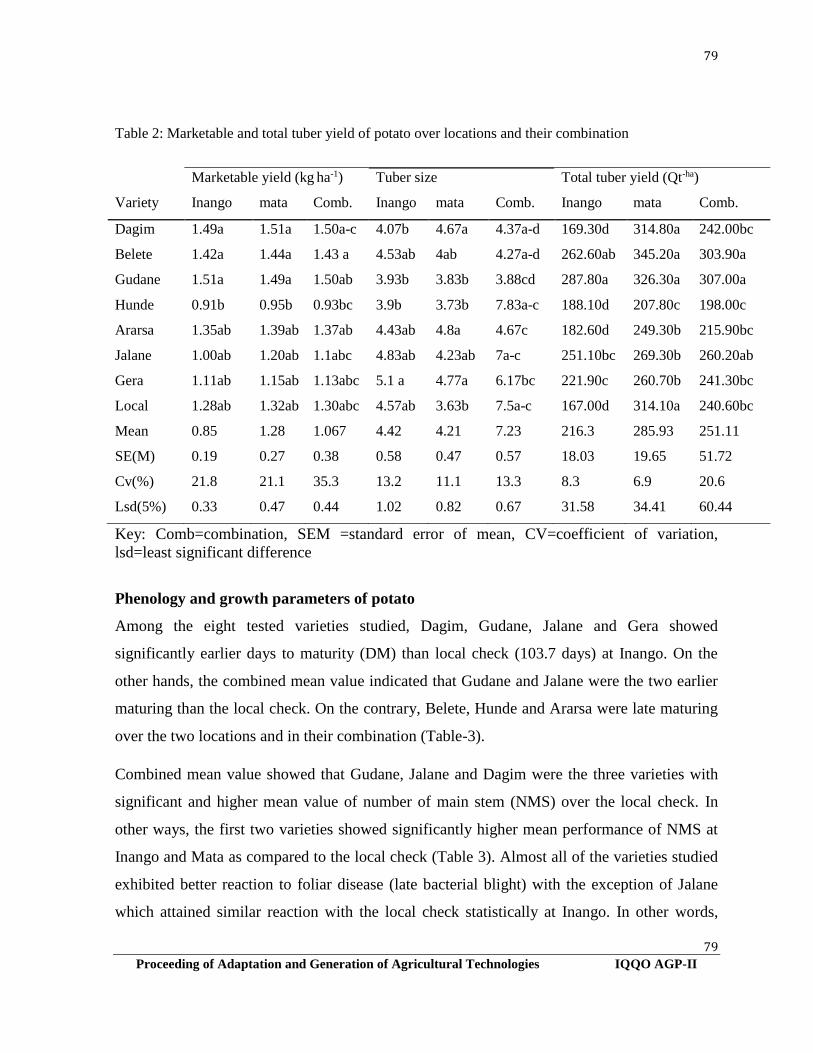
79
79
Proceeding of Adaptation and Generation of Agricultural Technologies IQQO AGP-II
Table 2: Marketable and total tuber yield of potato over locations and their combination
Key: Comb=combination, SEM =standard error of mean, CV=coefficient of variation,
lsd=least significant difference
Phenology and growth parameters of potato
Among the eight tested varieties studied, Dagim, Gudane, Jalane and Gera showed
significantly earlier days to maturity (DM) than local check (103.7 days) at Inango. On the
other hands, the combined mean value indicated that Gudane and Jalane were the two earlier
maturing than the local check. On the contrary, Belete, Hunde and Ararsa were late maturing
over the two locations and in their combination (Table-3).
Combined mean value showed that Gudane, Jalane and Dagim were the three varieties with
significant and higher mean value of number of main stem (NMS) over the local check. In
other ways, the first two varieties showed significantly higher mean performance of NMS at
Inango and Mata as compared to the local check (Table 3). Almost all of the varieties studied
exhibited better reaction to foliar disease (late bacterial blight) with the exception of Jalane
which attained similar reaction with the local check statistically at Inango. In other words,
Marketable yield (kg ha-1) Tuber size Total tuber yield (Qt-ha)
Variety Inango mata Comb. Inango mata Comb. Inango mata Comb.
Dagim 1.49a 1.51a 1.50a-c 4.07b 4.67a 4.37a-d 169.30d 314.80a 242.00bc
Belete 1.42a 1.44a 1.43 a 4.53ab 4ab 4.27a-d 262.60ab 345.20a 303.90a
Gudane 1.51a 1.49a 1.50ab 3.93b 3.83b 3.88cd 287.80a 326.30a 307.00a
Hunde 0.91b 0.95b 0.93bc 3.9b 3.73b 7.83a-c 188.10d 207.80c 198.00c
Ararsa 1.35ab 1.39ab 1.37ab 4.43ab 4.8a 4.67c 182.60d 249.30b 215.90bc
Jalane 1.00ab 1.20ab 1.1abc 4.83ab 4.23ab 7a-c 251.10bc 269.30b 260.20ab
Gera 1.11ab 1.15ab 1.13abc 5.1 a 4.77a 6.17bc 221.90c 260.70b 241.30bc
Local 1.28ab 1.32ab 1.30abc 4.57ab 3.63b 7.5a-c 167.00d 314.10a 240.60bc
Mean 0.85 1.28 1.067 4.42 4.21 7.23 216.3 285.93 251.11
SE(M) 0.19 0.27 0.38 0.58 0.47 0.57 18.03 19.65 51.72
Cv(%) 21.8 21.1 35.3 13.2 11.1 13.3 8.3 6.9 20.6
Lsd(5%) 0.33 0.47 0.44 1.02 0.82 0.67 31.58 34.41 60.44

80
80
Proceeding of Adaptation and Generation of Agricultural Technologies IQQO AGP-II
Hunde and Jalane showed lower bacterial blight reaction compared to the other varieties and
the local check while the remaining five varieties showed similar trend with the local at
Mata. The combined mean value exhibited that Jalane was significantly affected by bacterial
blight than the local check, however, Dagim, Belete, Gudane and Gera revealed had
significantly better degree of reaction to late bacterial blight than the local (Table 4).
Table 3: Phenology and growth parameters of potato
Days to emergency Days to maturity Number of main stem
Variety Inango mata Comb. Inango Mata Comb. Inango mata Comb.
Dagim 12a 12.67a 12.33 a 100.3d 99c 99.7c 169.30d 314.80 a 242.00bc
Belete 10.67ab 11.67ab 11.17ab 111.3a 112a 111.7a 262.60ab 345.20a 303.90a
Gudane 10b 10b 10bc 96.7e 96d 96.3d 287.80a 326.30a 307.00a
Hunde 10b 10b 10bc 110ab 110ab 110.0ab 188.10d 207.80c 198.00c
Ararsa 11.67a 10b 10.83ab 108b 108.7b 108.3b 182.60d 249.30b 215.90bc
Jalane 8c 10b 9 c 92.7f 93.3e 93.0e 251.10bc 269.30b 260.20ab
Gera 12a 10b 11ab 99de 97cd 98.0cd 221.90c 260.70b 241.30bc
Local 8c 10b 9 c 103.7c 96.7cd 100.2c 167.00d 314.10a 240.60bc
Mean 10.29 10.54 10.42 102.71 101.58 102.15 216.3 285.93 251.11
SE(M) 0.89 1.44 1.32 1.38 1.46 1.933 18.03 19.65 51.72
Cv(%) 8.7 13.7 12.7 1.3 1.4 1.9 8.3 6.9 20.6
Lsd(5%) 1.57 2.52 1.543 2.42 2.56 2.26 31.58 34.41 60.44
Key: Comb=combination, SEM=standard error of mean, CV=coefficient of variation, lsd=least
significant difference.
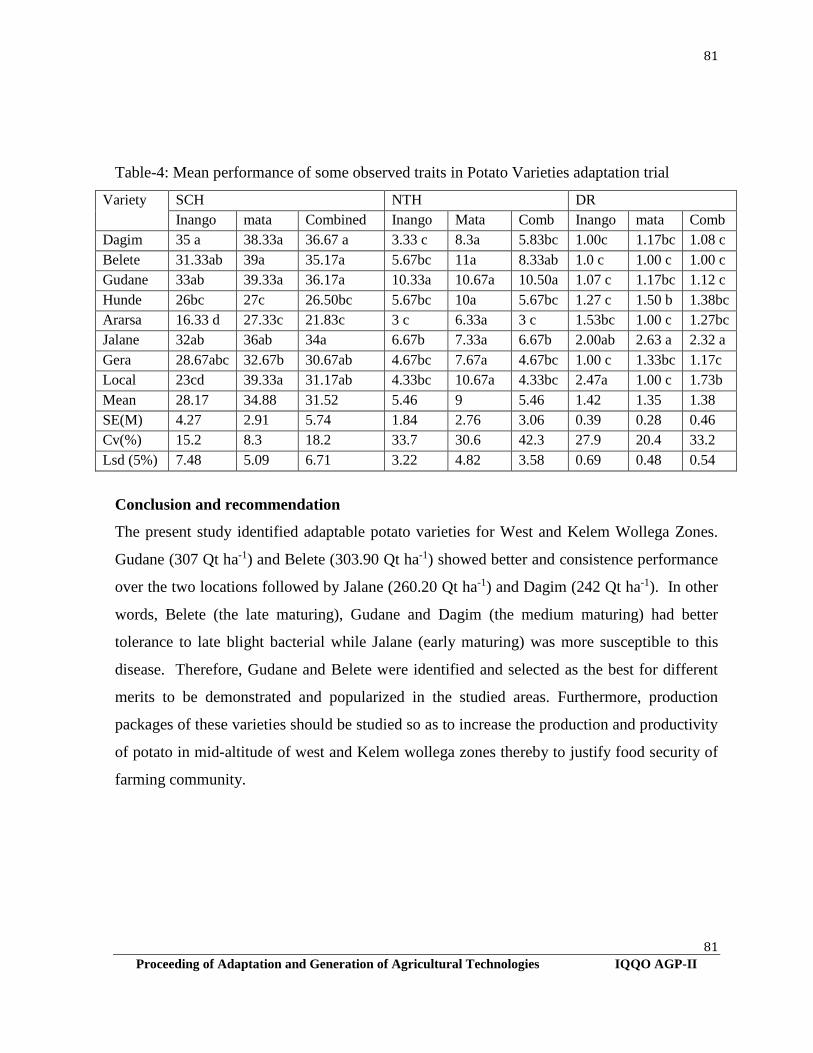
81
81
Proceeding of Adaptation and Generation of Agricultural Technologies IQQO AGP-II
Table-4: Mean performance of some observed traits in Potato Varieties adaptation trial
Variety SCH NTH DR
Inango mata Combined Inango Mata Comb Inango mata Comb
Dagim 35 a 38.33a 36.67 a 3.33 c 8.3a 5.83bc 1.00c 1.17bc 1.08 c
Belete 31.33ab 39a 35.17a 5.67bc 11a 8.33ab 1.0 c 1.00 c 1.00 c
Gudane 33ab 39.33a 36.17a 10.33a 10.67a 10.50a 1.07 c 1.17bc 1.12 c
Hunde 26bc 27c 26.50bc 5.67bc 10a 5.67bc 1.27 c 1.50 b 1.38bc
Ararsa 16.33 d 27.33c 21.83c 3 c 6.33a 3 c 1.53bc 1.00 c 1.27bc
Jalane 32ab 36ab 34a 6.67b 7.33a 6.67b 2.00ab 2.63 a 2.32 a
Gera 28.67abc 32.67b 30.67ab 4.67bc 7.67a 4.67bc 1.00 c 1.33bc 1.17c
Local 23cd 39.33a 31.17ab 4.33bc 10.67a 4.33bc 2.47a 1.00 c 1.73b
Mean 28.17 34.88 31.52 5.46 9 5.46 1.42 1.35 1.38
SE(M) 4.27 2.91 5.74 1.84 2.76 3.06 0.39 0.28 0.46
Cv(%) 15.2 8.3 18.2 33.7 30.6 42.3 27.9 20.4 33.2
Lsd (5%) 7.48 5.09 6.71 3.22 4.82 3.58 0.69 0.48 0.54
Conclusion and recommendation
The present study identified adaptable potato varieties for West and Kelem Wollega Zones.
Gudane (307 Qt ha-1) and Belete (303.90 Qt ha-1) showed better and consistence performance
over the two locations followed by Jalane (260.20 Qt ha-1) and Dagim (242 Qt ha-1). In other
words, Belete (the late maturing), Gudane and Dagim (the medium maturing) had better
tolerance to late blight bacterial while Jalane (early maturing) was more susceptible to this
disease. Therefore, Gudane and Belete were identified and selected as the best for different
merits to be demonstrated and popularized in the studied areas. Furthermore, production
packages of these varieties should be studied so as to increase the production and productivity
of potato in mid-altitude of west and Kelem wollega zones thereby to justify food security of
farming community.

82
82
Proceeding of Adaptation and Generation of Agricultural Technologies IQQO AGP-II
References
Central Statistical Agency (CSA). 2016. Agricultural Sample Survey 2015/2016 (2008 E.C.).
Report on Area and Production of Major Crops (Private Peasant Holdings, Meher
Season). Statistical Bulletin 548, Volume I, Addis Ababa, Ethiopia.
CIP (International Potato Center) and FAO (Food and Agricultural Organizations of the
United Nations).1995. Situation and Prospects of the World Potato Economy. Food
and Agricultural Organization of the United Nations. 1995, Rome, 39pp.
FAO (Food and Agriculture Organization). 2010. Strengthening Potato Value Chains:
Technical and Policy Options for Developing Countries.
Gomez, A.k. and Gomez, A.A. 1984. Statistical procedures for agricultural research, 2nd
edition. John and Son, inc., Institute of science pub. New York .679p.
Tewodros Ayalew, Paul C. S. and Adane Hirpa, 2014. Characterization of Seed Potato
(solanum tuberosum L.) Storage, pre -planting treatment and marketing systems in
Ethiopia: the case of west-arsi zone. African Journal of Agricultural Research, vol.9
(15)1218-1226.

83
83
Proceeding of Adaptation and Generation of Agricultural Technologies IQQO AGP-II
Milling and Bread-making Traits Associated with Grain Hardness in
Ethiopian Bread Wheat Varieties Grown under Bale Condition
Shure Soboka1, Tasfaye Letta1, Tilahun Bayissa2, and Wubishet Alemu3
1Oromia Agricultural Research Institute, Addis Ababa, Ethiopia.
2Sinana Agricultural Research Center, Bale-Robe, Ethiopia.
3Lions International PLC, Addis Ababa, Ethiopa
*Corresponding author: [email protected]
Abstracts
Many food processing industries utilizing bread wheat as a raw material are being
established in the country. As a result, information on physico-chemical characteristics to
match end use quality is very essential. In line with this, the current study was initiated with
objectives to characterize physico-chemical properties in relation to bread making quality
and to classify bread wheat cultivars as soft and hard wheat based on data generated on
quality analysis. The grain of 44 Ethiopian improved bread wheat cultivars were collected
from different agricultural research centers in the country and grown on under rain fall
condition at two locations (Ginnir and Sinana on station) during Bona (July-Jan., 2015/16
and 2016/17) growing season and analyzed for grain physical and flour chemical quality
characteristics. The experiment was laid out in RCBD with three replications. Result of
analysis of variance indicated that, there is significant variations in all quality parameters
considered among cultivars. Grain physical characteristics, such as thousand kernel weight
(TKW), percent vitreous kernel (%Vk), were showed highly significant difference (P<0.01)
due to cultivars. Grain chemical quality as expressed by protein quantity (%P) and quality,
percent gluten index (% Gl), Zeleny index (Zl), have also shown highly significant difference
(P<0.01) due to effect of genotypes. In addition strong environmental variation was observed
on measured quality characters. The present results indicated that there is huge genetic
variation among Ethiopian wheat varieties for quality traits considered in this study.
Introduction
Bread wheat (Triticum aestivum L.) is an autogamous allo-hexaploid species (2n = 6x = 42)
and three genomes, designated as A, B and D (AABBDD), were involved in its evolution
(Morris and Sears, 1967). It combines the genomes of three diploid ancestrals, Triticum
84
84
Proceeding of Adaptation and Generation of Agricultural Technologies IQQO AGP-II
urartu (2n = 14, AA), Aegilops squarrosa (2n = 14, DD) and Aegilops species (2n = 14, BB).
In Ethiopia, wheat ranked second in total cultivated land area coverage after tef & second
both in total grain production & productivity after maize (CSA, 2011). Ethiopia is the largest
wheat producer in the sub-Saharan Africa with a totall area covered by wheat is the country is
1.47 million hectares with a total production of 2.22 million tons (FAOSTAT, 2010). Of the
current total wheat production area, 75.5% is located in Bale, Arsi and Shewa highlands
(Hailu et al., 1991). Amount of wheat storage proteins as well as its quality is one of the most
important quality characteristics of bread wheat that influence bread-making property which
this quality trait is highly correlated with grain hardness.
Wheat is classified into hard & soft classes on the bases of texture of the grain which coincide
with differences in milling energy, milling time and end-use properties. The distinction
between soft and hard classes wheat is governed by the Hardness (Ha) locus on chromosome
5DS (Law et al., 1978) Hard wheat requires longer milling times and more milling energy,
and produce a larger amount of damaged starch.
Currently in Ethiopia, with the emerging agro-industries using wheat as a raw material, bread
wheat with good quality grain for processing has become increasingly important. There is a
high demand by both commercial and small-scale peasant farmers for wheat cultivars with
higher grain yield and better end-use quality (Efrem et al., 2002). As a result, marketing of
bread wheat is carried out as hard and soft bread wheat through physical observation of the
grain to decide whether it is Vitreous or not even though wheat class breeding is not started
yet. In terms of market value, hard bread wheat fetch a 50-100EB/qt more price than soft
bread wheat class. On the other hand, quality reports are available for only few of the bread
wheat cultivars released so far. Hence, it is important to characterize Ethiopian bread wheat
cultivars and promising genotyoes which are on pipe line for possible release for their quality
triats. Therefore, this study was initiated with objective to identify Ethiopian bread wheat
varieties with superior quality traits contributing to the bread making based on physico-
chemical quality characteristics and classify those varieties as hard and soft wheat class based
on quality traits.

85
85
Proceeding of Adaptation and Generation of Agricultural Technologies IQQO AGP-II
Materials and Methods
Description of the study area and Experimental Design
This experiment was conducted at two districts in Bale (Sinana representing highlands areas
Ginnir representing mid land areas. In this study, fifty bread wheat varieties of which 44
wheat were released cutivars and the remaining are promising genotypes selected for release.
Seeds of these test entries were collected from different research center who are working on
wheat research in Ethiopia and planted on the same plot of land at Sinana agricultural research
center experimental site and at Ginnir on farm field during Bona (July-December) 2015/16
and 2016/17 cropping seasons under rainfall condition on plot area of 6m2 (6 rows with 0.2m
spacing between rows and 2.5m length). Spacing between blocks and plots were 1.5m and 1m
respectively. The experiment was laid out in in RCBD with three replicatins. All agronomic
and disease management practices were carried according to the recommendation of bread
wheat at each location.
Data collected
Agronomic data such as grain yield (GY) (kg ha-1), and quality parameters including
thousand kernel weight (TKW), Hectoliter weight (HLW), grain moisture content, grain
protein content, percent gluten contents, Zylenel sedimentation volume and percent
virtuousness kernel were determined at 12.5 % moisture content based on standard protocols
(AACC, 2000) using dockage free samples from each wheat genotype.
Data Analysis

86
86
Proceeding of Adaptation and Generation of Agricultural Technologies IQQO AGP-II
Statistical Analysis System (SAS) was used for the analysis of variance (ANOVA) using
General Linear Model (GLM) procedure (SAS Institute, 2001) SAS version 9.1. Mean
separation was carried out using Least Significant Difference test (LSD) at P<0.05 and
P<0.01 probability levels.
Results and discussions
Statistically significant variation in all measured quality parameters (P<0.01) was observed
among Ethiopian bread wheat varieties grown under Bale condition (representative of both
mid and highlands of Bale (Table 1 and 2). Higher mean yield was recorded at Ginnir district
as compared to that of Sinana this perhaps due to the prevalence of conducieceve weather
condition for wheat growth at Ginnir than at Sinana. The effect of growing environment on
most of quality traits under study was also observed particularly on grain vitrousness which
accounts for about 97% at Ginnir and for about 60% at Sinana on station. Thousand kernel
weights has also shown significant variation at (P<0.01) due to genotypic effect at both test
locations. Its value ranges from 48 gm for variety Ogolcho to the smallest value of 32.57 for
the variety ET-13 at Ginnir whereas the observed value for this trait at Sinana ranges from
46.79g for the variety Dinkinesh to 30.0g for the variety Lakech at Sinana on station. Similar
variation in Thousan kernel weight in bread wheat genotypes were reported by different
authors in different bread wheat cultivars grown in different countries (Randhawa et al., 2002;
Brehanu, 2004 and Khodarahmi et al., 2010 in Pakistan, Ethiopia and Iran respectively.. In
general, the present study revealed existence of wide variation for TKW among different
wheat varieties considered in this study and this shows that there is huge possibility to exploit
in improvement of this particular quality trait in breeding program. Similarly, Ermias, 2007
and Solomon et al., 2000 also reported huge variability in bread wheat cultivars tested at
Harameya and Kulumsa respectively with the values ranging from 33.2g to 44.8 g. for the
wheat genotypes tested at Haramaya and 32.0g to 45.9 g for wheat genotypes tested at
kulumsa and hence these all reports are in agreement with the present study.
This significant difference (P <0.01) in TKW among wheat cultivars is mainly due to genetic
effects. Thousand kernel weight is an important indicator for flour yield (Zahoor, 2003) and

87
87
Proceeding of Adaptation and Generation of Agricultural Technologies IQQO AGP-II
wheat cultivars can be classified according to their thousand grain weight as 15-25 g (very
small), 26-35 g (small), 36-45 g (medium), 46-55 g (large) and over 55 g (very large)
(William et al., 1986). Accordingly, wheat cultivars in the current study fall in the range of
small to large grain weight category.
Hectoliter weights is also another quality parameter which showed significant variation (P
<0.01) due to test genotypes (Table1 and 2). Hectoliter weight (HLW) varied from 81.4
kg/hL for variety Galil to 86.40 kg/hL for variety Dinkinesh at Ginnir and 82.09 kg/hL for
variety Dinkinesh to 89.27 kg/hL for variet Dinkinesh at Sinana on station.. The hectoliter
weight, which is dependents on both grain size and shape, is considered to be one of the most
important physical criteria in all wheat grading systems. Flour yield and other quality
parameters positively correlated with HLW. The results obtained in this experiment were in
close agreement with the reports of Cornish et al. (2001) and Walle (2006) who reported that
HLW of 130 hard red spring bread wheat grown at different locations of USA varied from
66.2 to 80.20 kg/hL, and 77.91 to 82.15 kg/hL- in 20 bread wheat cultivars of Ethiopia,
respectively. It is also in consistent with the earlier findings of other researchers such as
Zahoor (2003), Muhammad et al. (2009) and Randhawa et al. (2002) who reported variations
ranging from 68.30 to 81.00 kg/hl in different wheat varieties from different countries.
Protein is one of the primary quality components that influence most of wheat grain milling
and baking quality characteristics. Protein quantity and quality determines wheat grain
hardness, which intern determines its end use quality. Significant variation among the test
cultivars was observed for grain protein content with the values ranging from 18.1% for
variety K6295-4a to 13.37% for the variety Mekelle 04 at Sinana on station. Similarly,
significant variation for grain protein content was with the of 15.03% for variey Millinium to
11.23% for variety Kubsa at Ginnir district. The high protein percent at Sinana on station is
most probably due to terminal water stress encountered which reduced starch accumulation.
Gluten percent on the other hand varied from 35.30% to 24.47% at Ginnir and from 44.27%
to 27.63% at Sinana on station. In the same way Zenly sedmentation volume which is an
indicator of wheat flour gluten strength varies from 75 for variety Mararo to 52.10 for variety
Dodota at Ginnir and 82 for variety Mararo to 55.27 for variety Kubsa at Sinana on station. In
88
88
Proceeding of Adaptation and Generation of Agricultural Technologies IQQO AGP-II
general, the mean values of measured quality parameters are higher at Sinana on station as
compared to Ginnir which indicate strong environmental influence in addition to genetic
variation.

89
89
Proceeding of Adaptation and Generation of Agricultural Technologies IQQO AGP-II
Table 1. Results of wheat grain quality characters for the experiment at Ginnir in 2015/16
SN Variet GY kg/ha TKW HLW % Vit Gluten %MC %PC %Z I
1 Hidase 3160.73d-l 44.47bc 84.13 b-j 98.73 a 29.03c-l 10.50 12.60 e-q 63.10b-m
2 Shorima 3283.00 c-j 41.50c-g 84.40b-i 98.67 a 31.00a-h 10.30 13.00c-k 65.73b-i
3 UTIQUE 3372.40c-j 39.17f-l 84.80b-g 98.61 a 31.70a-e 10.60 13.37b-j 65.20b-j
4 Bika 2946.53f-l 40.10e-j 84.13b-j 97.80 ab 31.60a-f 10.33 13.40b-i 70.27abc
5 Alidoro 3301.20 c-j 44.10 bc 83.67e-k 96.85 abc 31.27a-g 10.73 12.97c-m 55.43k-p
6 Enkoy 2805.80g-l 34.63n-q 83.87c-k 95.07 abc 32.33a-d 10.63 13.43b-h 60.00f-p
7 Dereselign 2913.53 f-l 39.90e-k 82.67j-m 96.33 abc 29.83c-j 10.43 12.80d-0 63.90b-k
8 Tay 3904.47a-e 36.60l-o 82.53klm 99.73 a 27.03f-m 10.63 12.60 e-q 58.40h-p
9 Milennium 2710.53 h-l 34.17opq 82.13lm 100.00 a 35.30a 10.50 15.03a 68.80a-e
10 Sofumer 3588.40a-h 42.87bcd 85.47ab 100.00 a 29.83 c-j 10.50 12.77d-p 62.00c-n
11 K6290-Bulk 2610.53i-l 38.23h-m 82.13lm 99.67 a 34.53ab 10.40 14.47abc 71.63ab
12 M. walabu 3458.33b-i 44.33 bc 85.00 a-e 97.57abc 27.23 e-m 10.93 12.57 e-q 58.00h-p
13 Dashen 3155.00 d-l 39.93 e-k 83.47f-l 98.18 ab 26.20i-m 11.50 11.93h-q 58.07h-p
14 Mekelle-03 3847.13a-f 40.43d-i 83.20h-l 98.20 ab 27.60 e-m 10.57 12.53 e-q 53.23op
15 K6295-4a 2943.40 f-l 33.63pq 84.27 b-i 99.00 a 33.10abc 10.70 13.97a-e 63.00c-m
16 Ogolcho 4469.80a 48.00a 84.00b-k 100.00 a 27.17 e-m 10.40 11.87j-q 60.27e-p
17 Hoggana 2514.20jkl 38.67h-l 83.60e-l 99.20 a 29.63 c-j 10.50 12.70e-q 60.40e-p
18 Gambo 4333.40ab 47.67a 84.93a-f 99.87 a 26.60h-m 10.73 11.70 l-q 59.73f-p
19 Digelu 2698.73 h-l 38.07 h-m 84.80 b-g 95.67 abc 25.80i-m 10.90 11.83k-q 54.43m-p
20 Danda 3688.67a-g 46.10ab 83.33g-l 97.33 abc 27.00g-m 10.53 11.90i-q 60.53e-p
21 Gasay 3478.67b-i 42.03c-f 85.20a-d 95.33 abc 26.27i-m 10.40 11.43n-q 57.03j-p
22 Jaferson 3731.13a-g 38.63 h-l 84.13 b-j 92.57c 28.73c-l 10.60 12.40 f-q 57.10j-p
23 Kingbird 3591.20 a-h 39.00 h-l 84.27 b-i 98.40 a 27.07f-m 10.67 12.27g-q 59.30g-p
24 PAVON-76 3577.80 a-h 37.53 i-n 84.40 b-i 99.33 a 29.30c-k 10.57 11.73l-q 62.10c-n
25 Simba 3227.33c-k 44.43 bc 84.13 b-j 100.00 a 30.97 a-h 10.63 13.30b-k 68.27a-f
26 Sirbo 2308.20kl 35.00n-q 84.67b-h 100.00 a 32.40 a-d 11.43 13.83 a-e 69.57a-d
27 Qulqulluu 2739.80h-l 35.43m-q 82.93i-m 99.63 a 31.47 a-g 11.07 13.47b-g 63.77b-k
28 Hulluka 3293.87 c-j 37.40j-n 83.87 c-k 77.33e 25.33j-m 10.80 11.50m-q 53.77nop
29 Dinkinesh 2955.33 f-l 42.80bcd 81.47m 100.00 a 32.30 a-d 10.63 14.23a-d 67.23a-g
30 Mandoyu 3619.80 a-h 37.50i-n 84.67b-h 95.33 abc 28.67c-f 10.37 11.93h-q 61.27d-o
31 Sula 3213.53c-l 39.90 e-k 85.20 a-d 99.00 a 30.20b-i 10.40 12.87d-n 66.33 b-h
32 ET-13 2330.47kl 32.57q 84.80b-g 96.00 abc 24.53lm 11.00 11.67 l-q 54.70l-p
33 Meraro 2284.27l 33.80pq 84.80 b-g 100.00a 34.70ab 10.63 14.60ab 75.00a
34 Mekelle -01 4019.20a-e 43.33bcd 85.33abc 100.00 a 31.13 a-h 10.50 13.10b-k 67.93a-f
35 Bobicho 3292.73 c-j 38.13 h-m 83.47 f-l 95.67 abc 27.97d-m 10.50 12.47 e-q 58.80g-p
36 Tossa 3240.67 c-k 37.37j-n 85.20 a-d 100.00 a 29.70 c-j 10.70 12.63 e-q 62.83c-m
37 Galil 3095.53e-l 39.97 e-k 86.40a 98.67 a 29.80 c-j 10.50 12.40 f-q 62.77c-m
38 Kubsa 3331.40 c-j 37.07k-o 83.73d-k 86.00d 23.73m 10.57 11.23q 52.43p
39 Abola 3167.73 d-l 34.27opq 84.80 b-g 95.33 abc 28.37d-l 10.50 12.43f-q 61.83c-o
40 Lakech 2820.87g-l 36.27l-o 85.07 a-e 98.00 ab 29.73 c-j 10.53 12.63e-q 62.87c-m
41 Mekelle 04 3983.40a-e 44.33 bc 84.13 b-j 96.33 abc 25.03klm 10.53 11.33npq 57.33i-p
42 Honkolo 4142.47abc 40.90d-h 85.20 a-d 100.00 a 28.83c-l 10.77 12.27 g-q 62.33c-n
43 Kakaba 4034.60a-d 40.80d-h 84.93a-f 82.00de 23.47m 10.33 11.27pq 53.33op
44 Dodota 3144.13 d-l 38.13 h-m 84.27 b-i 93.33c 27.70e-m 10.77 12.37 f-q 52.10p
Mean 3280.23 39.53 84.17 96.93 29.12 10.63 12.65 61.41
CV 17.55 4.67 1.09 3.19 9.73 2.72 7.33 8.63
F test ** ** ** ** ** ** ** **
LSD 934.25 3.00 1.49 5.01 4.60 0.47 1.51 8.60

90
90
Proceeding of Adaptation and Generation of Agricultural Technologies IQQO AGP-II
In hard wheat, variation in loaf volume of bread can be attributed directly to differences in
protein concentration (Fowler, 2002). The differences in protein content among different
wheat cultivars could be related to wheat genetic difference (Kent and Evers, 1994). The
results the present study is in agreement with the results reported by Solomon et al. (2002)
who reported significant difference in grain protein contents among ten Ethiopian bread wheat
cultivars grown under Arsi condition and with arrange of 7.7% to 13.2%. Besides, the results
of the present studies also in agreement with the report of Mahmood, (2004) who found
variation for this trait ranging from 9.71% to 15.42% among different bread wheat varieties.
The result of gluten content is also in close agreement with the findings of Miralbes (2003)
who found variation ranging from 15.6 to 39.3 % in wet gluten content in different wheat
varieties. Similar report was also obtained by Paliwal and Singh (1985) who reported wet
gluten in the range 12.77 to 44.06% in Uttar Paradesh wheat varieties. This variation in wet
gluten among the wheat cultivars considered in the present study may be attributed to the
differences in genotypes and the environmental conditions such as temperature and rainfall.

91
91
Proceeding of Adaptation and Generation of Agricultural Technologies IQQO AGP-II
Table 2. Results of wheat grain quality characters for the experiment at Sinana in 2015/16 SN Variety BM t/ha Gy (kg/ha) TKW HLW Gluten %MC %P ZI
1 Hidase 3.73 b-f 1593.17 b-f 44.13abc 86.25 a-i 35.03 i-q 11.50 a-f 15.40e-m 67.47 e-n
2 Shorima 3.47 c-f 1589.55 b-f 40.98 b-h 87.68 a-f 37.80 b-k 11.33 c-f 15.93 b-k 72.03 c-i
3 UTIQUE 5.50a-e 2115.05a-e 42.92 a-d 88.62abc 37.83b-k 11.27ef 16.07 b-i 73.50b-g
4 Bika 4.10 b-f 1488.01 c-f 39.78c-l 87.96a-e 40.43bc 11.20 ef 16.93 abc 79.07abc
5 Alidoro 5.33 a-f 1849.45 b-f 41.80 a-f 84.59c-j 36.33e-o 11.77 a-d 13.87no 55.57st
6 Enkoy 5.60 a-d 2279.96a-d 34.33 m-q 85.00 c-j 39.80b-f 11.40 b-f 15.97 b-j 63.53l-s
7 Dereselign 6.17ab 2212.34a-d 40.80 b-i 86.50 a-i 35.77g-q 11.23 ef 15.47d-l 65.43 g-q
8 Tay 5.93abc 2785.19a 40.96 b-h 85.09 c-j 34.83 j-r 11.37 b-f 15.43d-m 65.33 h-q
9 Milennium 4.33 b-f 1953.09a-f 35.49 j-p 83.15hij 38.97b-i 11.77 a-d 16.73 b-e 66.37 f-q
10 Sofumer 5.07 a-f 1699.92 b-f 42.10 a-e 84.30 e-j 34.23 k-r 11.90a 14.93 h-n 63.93 j-r
11 K6290-Bulk 5.13 a-f 2038.79 a-e 38.69 d-n 83.82 f-j 39.60b-f 11.50 a-f 16.77 a-d 71.67 c-k
12 M. walabu 5.07 a-f 1964.13 a-f 43.06a-d 84.98 c-j 34.43k-r 11.40 b-f 15.33f-m 63.90j-r
13 Dashen 7.06a 2314.52 abc 38.68 d-o 86.53 a-i 32.60n-s 11.40 b-f 14.73 i-n 65.83 g-q
14 Mekelle-03 4.60 a-f 2151.29 a-d 41.13b-g 82.78ij 33.77 l-s 11.80 abc 15.13h-n 56.63rst
15 K6295-4a 5.60 a-d 2061.06 a-e 33.42opq 83.26 g-j 44.77a 11.43 a-f 18.10a 76.03a-d
16 Ogolcho 4.83 a-f 2351.66abc 42.62 a-d 85.98 a-j 34.70 j-r 11.50 a-f 15.30g-m 69.03 d-l
17 Hoggana 4.47 b-f 1912.30 b-f 37.16 e-o 85.14 b-j 37.03 b-l 11.43 a-f 15.80 b-k 67.40 e-n
18 Gambo 5.73a-d 1528.27 c-f 42.56 a-d 88.43a-d 33.53 l-s 11.23 ef 14.90 h-n 67.13 e-o
19 Digelu 4.47 b-f 1102.97f 34.51 m-q 86.71 a-i 32.40o-s 11.67 a-e 14.63 j-o 58.77q-t
20 Danda 5.50 a-e 1860.56 b-f 45.11ab 86.06 a-j 32.70m-s 11.43 a-f 14.80 i-n 63.67k-r
21 Gasay 5.47 a-e 1703.56 b-f 38.08 d-o 87.88a-f 33.80 l-s 11.40 b-f 14.60 k-o 65.47 g-q
22 Jaferson 4.77 a-f 1893.59 b-f 34.70 l-q 88.24a-e 38.63b-j 11.47 a-f 16.20 b-h 68.30 d-m
23 Kingbird 4.93 a-f 1820.69 b-f 35.88 g-p 84.85 c-j 36.60c-m 11.53 a-f 15.87 b-k 67.90e-n
24 PAVON-76 5.40 a-e 2451.27ab 39.21c-m 85.22 a-j 31.07rst 11.83 ab 14.10mno 60.03n-t
25 Simba 4.47 b-f 1890.10 b-f 40.02 b-k 86.46 a-i 36.47 d-n 11.53 a-f 15.93 b-k 74.37a-f
26 Sirbo 3.93 b-f 1267.46ef 35.62 i-p 89.27a 40.63b 11.33 c-f 16.97 ab 81.13ab
27 Qulqulluu 4.60 a-f 1755.64 b-f 33.47 n-q 84.40 d-j 40.00b-f 11.30 def 16.77 a-d 71.80 c-j
28 Hulluka 4.33 b-f 1537.60 c-f 36.62 f-o 85.59 a-j 35.63h-q 11.33 c-f 15.47d-l 64.77 i-q
29 Dinkinesh 3.50 c-f 1600.65 b-f 46.79a 82.09j 36.17f-p 11.63 a-f 16.20 b-h 65.07 i-q
30 Mandoyu 4.70 a-f 2336.91 abc 36.01 g-p 87.53 a-f 35.10i-q 11.33 c-f 15.17g-n 65.87g-q
31 Sula 3.00 ef 1640.04 b-f 39.03 c-m 83.37 g-j 39.17b-h 11.83 ab 16.50 b-g 72.80c-i
32 ET-13 2.87f 1419.53def 35.83 h-p 88.08a-e 33.90 k-s 11.17f 14.87 h-n 66.93 e-o
33 Meraro 2.87f 1156.21f 31.20pq 85.78 a-j 40.40bcd 11.83ab 17.00 ab 82.07a
34 Mekelle -01 5.40a-e 1930.25 a-f 42.21 a-e 88.49a-d 36.83 b-l 11.43 a-f 15.60c-l 73.33 b-h
35 Bobicho 3.40 d-f 1775.00 b-f 38.81d-m 87.20 a-h 33.3l-s 11.30 def 14.90 h-n 62.63l-t
36 Tossa 5.10 a-f 2098.92 a-e 34.81 k-q 89.24ab 34.93j-r 11.30def 15.17g-n 67.47e-n
37 Galil 3.27 d-f 1731.75 b-f 36.31 g-p 83.18hij 40.23b-e 11.77 a-d 16.67b-f 74.53a-e
38 Kubsa 4.20 b-f 1488.41 c-f 36.26 g-p 84.69 c-j 32.07 q-s 11.50 a-f 14.37 l-o 59.07o-t
39 Abola 5.33 a-f 1961.59 a-f 35.00k-q 87.30a-g 33.33l-s 11.57 a-f 14.77 i-n 68.00d-n
40 Lakech 4.17 b-f 1491.94 c-f 30.00q 85.32 a-j 32.83 m-s 11.23 ef 14.73 i-n 60.53m-t
41 Mekelle 04 4.20 b-f 2168.97 a-d 42.24 a-e 85.98 a-j 27.63t 11.63 a-f 13.37o 56.50rst
42 Honkolo 3.87 b-f 2210.30 a-d 38.92 c-m 87.83 a-f 32.37p-s 11.23 ef 14.33 l-o 64.83 i-q
43 Kakaba 3.87 b-f 1660.21 b-f 40.59b-j 87.73 a-f 30.23st 11.27 ef 14.30 l-o 55.27t
44 Dodota 3.60 c-f 1710.23 b-f 37.87 d-o 85.45 a-j 35.43 h-q 11.53 a-f 15.37f-m 58.87p-s
Mean 5.35 1853.46 38.54 86.00 35.76 11.47 15.49 66.81
%CV 33.56 28.79 8.42 2.95 6.80 2.67 5.32 7.44
F test ** ** ** ** ** ** ** **
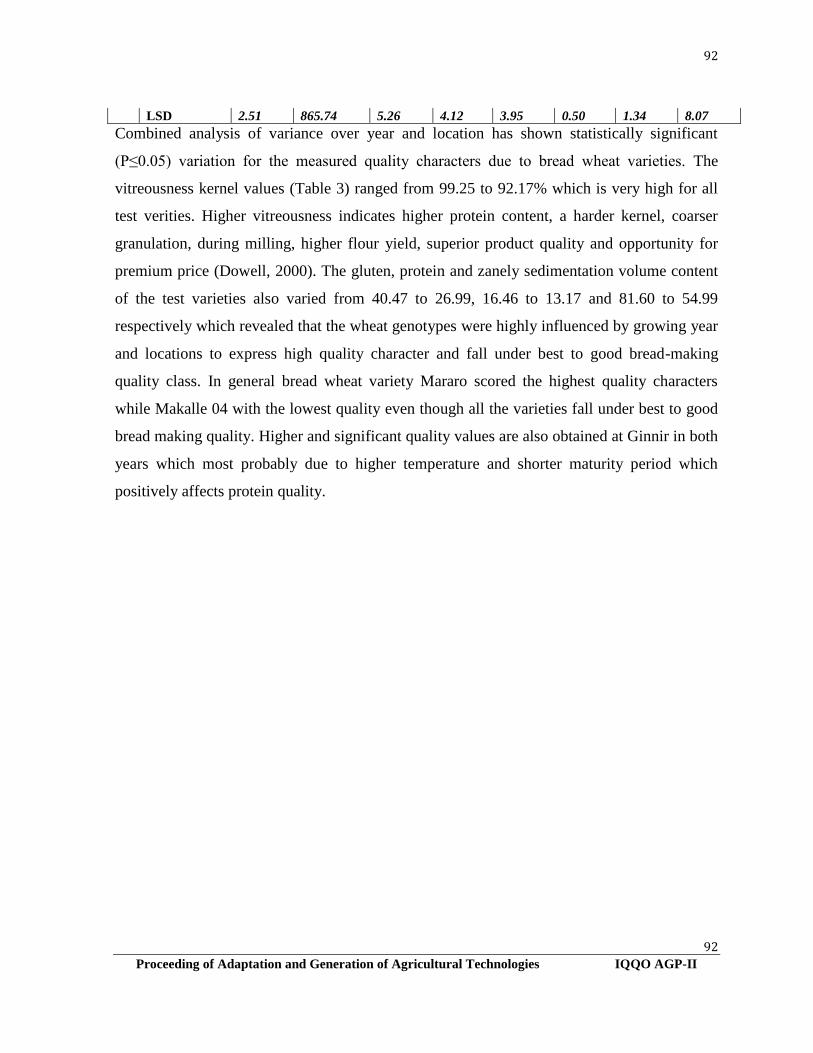
92
92
Proceeding of Adaptation and Generation of Agricultural Technologies IQQO AGP-II
LSD 2.51 865.74 5.26 4.12 3.95 0.50 1.34 8.07
Combined analysis of variance over year and location has shown statistically significant
(P≤0.05) variation for the measured quality characters due to bread wheat varieties. The
vitreousness kernel values (Table 3) ranged from 99.25 to 92.17% which is very high for all
test verities. Higher vitreousness indicates higher protein content, a harder kernel, coarser
granulation, during milling, higher flour yield, superior product quality and opportunity for
premium price (Dowell, 2000). The gluten, protein and zanely sedimentation volume content
of the test varieties also varied from 40.47 to 26.99, 16.46 to 13.17 and 81.60 to 54.99
respectively which revealed that the wheat genotypes were highly influenced by growing year
and locations to express high quality character and fall under best to good bread-making
quality class. In general bread wheat variety Mararo scored the highest quality characters
while Makalle 04 with the lowest quality even though all the varieties fall under best to good
bread making quality. Higher and significant quality values are also obtained at Ginnir in both
years which most probably due to higher temperature and shorter maturity period which
positively affects protein quality.

93
93
Proceeding of Adaptation and Generation of Agricultural Technologies IQQO AGP-II
Table 3. Effect of variety on some grain milling and bread making quality characters
combined over location and year
Varieties
Vit. (%) Gluten (%)
Moisture
(%)
Proteins
(%)
Z Index
(ml) Hidase 98.35±1.38abc 33.22±4.38e-i 11.13±0.44 a-d 14.57±1.60 a-h 68.84±8.24 c-k
Shorima 98.00±2.12 a-e 35.51±6.05a-h 11.04±0.51 a-d 15.09±2.13 a-h 70.21±11.92 b-k
UTIQUE 98.24±1.56a-d 34.65±6.01b-i 10.36±2.60bcd 14.93±1.84 a-h 69.61±12.00 b-k
Bika 97.28±1.85 a-g 33.98±7.10c-i 10.93±0.45 a-d 14.76±2.16 a-h 71.46±13.03 b-g
Alidoro 97.30±2.24a-g 34.76±4.94b-i 11.22±043 ab 14.18±1.69 c-h 61.33±7.70i-m
Enkoy 97.68±2.36a-f 36.68±6.34a-f 11.03±0.58 a-d 15.01±1.87 a-h 66.76±9.18c-l
Dereselign 97.50±1.88 a-f 33.03±4.26 e-i 10.95±0.39 a-d 14.37±1.39 c-h 66.07±8.17 c-l
Tay 98.84±1.12ab 33.73±5.94 c-i 11.12±0.36 a-d 14.83±1.87 a-h 67.58±11.18 c-k
Milennium 98.58±1.08abc 35.84±6.56a-g 11.17±0.53abc 15.48±1.93 a-f 66.63±11.19 c-l
Sofumer 99.08±1.51a 33.62±4.02 c-i 11.24±0.68ba 14.49±1.45 b-h 67.33±7.30 c-k
K6290-Bulk 98.17±2.37a-e 37.55±8.43a-e 11.17±0.57abc 16.08±2.98abc 72.97±14.77a-e
M. walabu 98.14±1.72 a-e 33.07±4.94 e-i 11.21±0.30 ba 14.66±1.68 a-h 66.01±8.89 c-l
Dashen 96.80±2.62 a-g 33.41±7.87 c-i 11.32±0.40a 14.74±2.71 a-h 68.63±16.52 c-k
Mekelle-03 96.88±1.68 a-g 31.16±4.27 g-j 11.18±0.60 abc 13.99±1.42 d-h 57.66±9.33lm
K6295-4a 98.33±1.83abc 40.47±10.04a 11.14±0.42 abc 15.88±5.03a-d 74.04±15.88abc
Ogolcho 98.00±4.51 a-e 30.73±8.28hij 11.16±0.56 abc 14.08±1.75 d-h 66.09±8.06 c-l
Hoggana 98.47±1.41abc 34.62±6.69b-i 11.18±0.50 abc 14.91±2.27 a-h 65.96±10.93 c-l
Gambo 96.22±6.72 a-g 33.90±7.15c-i 11.13±0.38 a-d 14.62±2.50 a-h 68.94±12.63 c-k
Digelu 98.17±2.29 b-e 32.09±7.32 f-i 11.33±0.57a 14.15±2.29 c-h 63.81±13.78 f-m
Danda 96.00±4.47 c-g 33.29±5.42 d-i 11.21±0.53 ba 13.28±4.28 gh 65.13±14.07c-l
Gasay 96.00±3.28 c-g 33.73±5.65c-i 11.03±0.53 a-d 14.33±2.00 c-h 67.41±9.80 c-k
Jaferson 95.06±5.91fg 33.60±5.11c-i 11.19±0.47 ba 13.43±3.91gh 61.38±9.39h-m
Kingbird 98.60±1.14abc 34.12±6.20c-i 11.19±0.21 ba 14.13±3.68 c-h 68.84±11.45 c-k
PAVON-76 97.92±1.68 a-e 32.04±5.43 f-i 11.18±0.53 abc 13.83±2.02 e-h 65.21±10.78 c-l
Simba 97.92±1.73 a-e 34.97±6.54b-i 11.18±0.46 abc 15.22±2.36 a-f 72.73±12.34a-f
Sirbo 96.75±4.45 a-g 38.34±6.02abc 11.34±0.28a 16.34±2.13ab 78.64±13.25ab
Qulqulluu 98.07±3.42 a-e 38.23±6.58a-d 11.21±0.44 ba 16.04±2.32abc 73.51±10.88a-d
Hulluka 92.17±9.63h 31.66±6.41 g-j 11.13±0.09 a-d 13.85±2.18 e-h 63.68±10.88f-m
Dinkinesh 98.50±1.09abc 35.74±5.59a-f 10.38±8.96bcd 15.73±2.22a-e 69.60±9.07 b-k
Mandoyu 96.67±2.19 a-g 33.28±5.80 d-i 11.00±0.62 a-d 13.34±3.89 gh 66.88±10.78 c-k
Sula 98.75±1.54abc 34.18±4.55c-i 11.21±0.70 ba 14.65±1.66 a-h 69.67±6.93 b-k
ET-13 98.25±1.76a-d 34.49±9.54c-i 10.43±2.89-d 15.01±3.15 a-h 70.44±17.39 b-i
Meraro 99.25±1.22a 39.29±6.05ab 11.23±0.51 ba 16.46±2.12a 81.60±11.02a
Mekelle -01 97.75±2.67 a-f 32.94±4.78 e-i 11.08±0.57 a-d 14.23±1.37 c-h 68.08±11.18 c-k
Bobicho 96.67±3.55 a-g 32.60±4.71 f-i 11.03±0.59 a-d 14.33±1.59 c-h 64.83±10.36d-l
Tossa 99.00±0.74a 33.21±3.84 e-i 11.13±0.35 a-d 14.36±1.43 c-h 67.04±6.96 c-k
Galil 99.00±0.74a 35.58±6.14 a-h 11.16±0.63abc 14.93±2.13 a-h 70.52±9.32 b-j
Kubsa 95.50±7.56 d-g 30.43±5.80ij 11.14±0.55abc 13.75±1.94 fgh 63.07±11.68g-m
Abola 95.42±4.80 e-g 32.33±4.75 f-i 10.27±2.78 cd 14.54±2.01 a-h 68.80±10.15 c-k
Lakech 98.42±1.56abc 30.61±3.29ij 11.13±0.44a-d 13.42±1.21gh 60.63±6.09 klm
Mekelle 04 97.25±2.22 a-g 26.99±8.82j 11.13±0.59 a-d 13.17±1.51 h 54.99±17.24m
Honkolo 98.92±0.79ab 32.85±6.66 e-i 10.34±2.80 bcd 13.35±4.39 gh 67.40±12.88 c-k
Kakaba 94.67±8.24gh 31.56±6.42g-j 10.23±2.76d 14.22±2.22 c-h 64.12±13.45e-l
Dodota 97.00±3.19 a-g 33.26±5.42 d-i 11.16±0.50abc 14.46±1.72 b-h 61.25±9.21j-m
Mean 97.48±3.59 33.90±6.45 11.04±1.13 14.57±2.47 67.39±11.94
CV 3.54 18.37 2.29 16.72 16.91
F test ** ** ** ** **

94
94
Proceeding of Adaptation and Generation of Agricultural Technologies IQQO AGP-II
Combined over location, non-significant but higher grain protein quantity and significantly
(P≤ 0.05) higher protein qualities (gluten and zanely index) were observed at Ginnir (table 4),
which most probably due to lower altitude, higher temperature and shorter crop maturity
period which hinders starch accumulation and accelerate protein storage.
Table 4. Some wheat quality parameters as affected by growing Environment
Conclusion
It has been known that the grain properties predetermine both the milling and final end-use of
quality of bread wheat. The result of the present study confirmed the existence of
considerable variation among the test varieties with respect to some physical and other grain
quality characters due to genetic and environmental variations. In addition to genetic
variation strong, environmental influence was also observed on all measured quality
characters. Higher grain protein quantity and qualities were observed at Sinana on station
which is due to the terminal moisture stress encountered during growing season. On the other
hand better vitreous grain quality was obtained at Ginnir site as the environment is mid
lowland having short maturity period with higher mean daily temperature. Generally, most
bread wheat varieties tested under this study fall under good to best bread making quality
properties based on qualities traits analyzed in this study, however, the experiment should be
repeated over seasons and locations to have a clear quality classification of Ethiopian bread
wheat varieties.
LSD 2.76 4.99 0.91 1.95 9.14
Environment Vitriousness (%) Gluten (%) Moisture (%) Protein (%) Zaleny Index
Ginnir 97.65±4.13 34.78±7.26a 10.74±10.74b 14.66±2.73 71.01±13.56a
Sinana 97.32±2.94 33.02±5.39b 11.34±11.34a 14.48±2.19 63.78±8.71b
G. Mean 97.48±3.59 33.90±6.45 11.04±11.04 14.57±2.47 67.39±11.94
CV 3.68 18.88 9.86 16.98 16.91
F test ns ** ** ns **
LSD 0.61 1.09 0.19 0.42 1.95

95
95
Proceeding of Adaptation and Generation of Agricultural Technologies IQQO AGP-II
References
AACC, 2000. Approved Methods of the American Association Cereal Chemists. American
Association of Cereal Chemists, Inc., St. Paul, Minnesota.
Berhanu Mamo, 2004. Genetic variability and character associations in bread wheat (triticum aestivum
L.) genotypes developed for semiarid areas. A thesis Submitted to the School of Graduate
Studies, In Partial fulfillment of the requirements for the Degree of M.Sc. Plant Breeding.
Alemaya University.
CSA (Centeral Statistical Authority), 2011. Agricultural Sample Survey 2004/2005. Report on Area
and Production for Major Mrops: Private Peasant Holding ‘Meher’ Season. Statistical Bulletin
331.CSA,Addis Ababa, Ethiopia.
Ermias Estifanos, Geremew Bultosa, Habtemu Zeleke and H. Sigh, 2007. Agronomic performance and
bread making quality of adivanced bread wheat (Triticum astivum L.) lines in east Oromia
Ethiopia. East African Jouornal of Science. 1(1):25-34.
FAOSTAT [Online]. Available at http://www.fao.org/faostat . Retrieved 18 Feb. 2010.
FAOSTAT, 2012.Agricultural data.Provisional 2003 Production and Production Indices Data.Crop
primary.(http:// apps.Fao/default.jsp).
Hailu Gebre-Mariam,1991. Wheat production and research in Ethiopia.pp.1-15. In : Hailu Gebre-
Mariam, Tanner, D.G., and Mengistu Hulluka (eds.) Wheat Research in Ethiopia: A Historical
perspective, IAR/ CIMMYT, Addis Ababa, Ethiopia.
Khodarahmi1, M., A. Nabipour and K. Zargari, 2010. Genetic improvement of agronomic and quality
traits of wheat cultivars introduced to temperate regions of Iran during 1942 - 2007. African
Journal of Agricultural Research. 5(9): 947-954.
Law, C.N., Young, C.F., Brown, J.W.S., Snape, J.W. and J.W.Worland. 1978. The study of grain
protein control in wheat using whole signify chromosome substitution lines. p. 483–502. In
Seed protein improvement by nuclear techniques. International Atomic Energy Agency,
Vienna, Austria.
Randhawa, M.A., F.M. Anjum and M.S. Butt, 2002. Physico-chemical and milling properties of new
spring wheats grown in Punjab and Sindh for the production of Pizza. Intarnational Journal of
Agriculture and Biological Science. 4(4): 21- 24.
Solomon Gelalcha, Desalegn Debelo, Bedada Girma, T.S., Payne, Zewde Alemayehu and Balcha
Yale, 2000. Milling and baking quality of Ethiopian bread wheat cultivars. In: CIMMYT.
2000. The eleventh regional wheat workshop for Eastern, Central and Southern Africa, A.A.
Ethiopia. CIMMYT.
Zahoor, T., 2003. High molecular weight glutenin subunit composition and multivariate analysis for
quality traits of common wheats grown in Pakistan. Ph.D. Thesis, Inst. Food Sci & Tech.,
University of Agriculture, Faisalabad, Pakistan.

96
96
Proceeding of Adaptation and Generation of Agricultural Technologies IQQO AGP-II
LIVESTOCK
The development of “Degagsa and Belebas” Pigeon pea (Cajanus cajan)
varieties for western Oromia
Mekonnen Diribsa*, Abuye Tulu, Wakgari Keba, Worku Temesgen and Gutu Fekeda
Oromia Agricultural Research Institute, Bako Agricultural Research Center, P.O.Box 03,
Bako, West Shoa, Ethiopia
Corresponding author: Tel/Mobil: +2519 13 92 31 56, e-mail: [email protected]
Abstract:
Ten pigeon pea genotypes including the standard check were tested across three
environments (Bako, Chewaka and Gute) in western Oromia, Ethiopia during 2014 and 2015
main cropping season to evaluate the performance of pigeon pea genotypes for both herbage
and grain yield, and their stability across environments. The genotypes were arranged in
randomized complete block design (RCBD) with three replications. Two genotypes ILRI Acc.
# 11575 and ILRI Acc.# 16527 were shown to have superior yielding ability both in herbage
and grain yield and other desirable traits over the standard check ‘Tsigab’ cultivar. The two
genotypes had significantly higher herbage yields of 7.22 and 6.40 ton ha-1 per harvest with
77% and 57% yield advantage over the standard check, Tsigab (4.07 ton ha-1), respectively.
Those two varieties were verified on station and on farmers’ field across location during
2016/17 cropping season, evaluated by the national variety releasing committee and finally
officially released on April 2017. Those variety now named as Degagsa (11575) and Belabas
(Acc. 16527). Degagsa and Belebas varieties gave high grain yield (22.59 qt ha-1 and 26.99 qt
ha-1) with the yield advantage of 41% and 68% over the best standard check Tsigab (16.02 qt
ha-1). GGE biplot analysis also confirmed Degagsa and Belebas varieties showed better
stability and thus ideal varieties recommended for production in the test environments and
other similar agro ecologies.
Keywords: Genotypes, herbage yield, ILRI, Pedigree; pigeon pea (Cajanus cajan), Stability

97
97
Proceeding of Adaptation and Generation of Agricultural Technologies IQQO AGP-II
Introduction
In Ethiopian livestock industry the crop-livestock mixed farming systems is one the most
common production systems practiced in mid and high altitude of the country. Most lands
previously meant for livestock production are under continuous stress due to increased crop
cultivation; as a result animals are kept on limited land that further leads to land degradation,
and declined size and productivity of grazing lands (Funte et al., 2010). This causes declined
quantity and quality of feeds that further exacerbated by the increase in human and livestock
population in most part of the country (Gemeda, 2010). The decreased feed production
resulted in low production and productivity of animals that further affected the benefits they
provide at household or national level. Adapted multipurpose trees which can be used as
cheap source of protein supplements to improve the nutrient supply and utilization of poor
quality feeds.
Pigeon pea is well adapted to the climate and uniquely combines such optimal nutritional
profiles, high tolerance to environmental stresses, high biomass productivity and most nutrient
and moisture contributions to the soil. Its foliage is an excellent fodder with high nutritional
value. It contains 20-22% crude protein, 1.2% fat, 65% carbohydrate and 3.8% ash. In
addition, they are found to possess different minerals and vitamins and are good source of
carbohydrates for all mono-gastric animals (Khandelwal et al., 2010). In addition, By-product
of split and shriveled seeds of Pigeon pea are used as livestock feed and as an inexpensive
alternative to high cost animal feed sources such as bone meal and fish meal. As a result,
production and feeding of such fodder tree legumes through integration with food crops were
suggested as some of the potential options to improve the nutrient supply to livestock
(Solomon, 2001).
Nevertheless, the adoption rate and wider use of multipurpose trees by livestock keepers in
Ethiopia is not significant probably because of scantiness in information regarding the feeding
value and less dissemination of these fodders, high genetic variability that exists within the

98
98
Proceeding of Adaptation and Generation of Agricultural Technologies IQQO AGP-II
cultivated and wild relatives remains to be explored for further uses. Hence, different
accessions of Pigeon pea were evaluated against standard check across different locations to
tackle the existing production problem. Therefore, the objective of the experiment was to
evaluate the performance of pigeon pea genotypes for both herbage and grain yield and their
stability across environments.
Materials and Methods
Ten pigeon pea genotypes including standard check ‘Tsigab’ were evaluated across locations
(Bako, Chewaka and Gute) in altitude ranging from 1300 to 1900 meters above sea level for
two years (2014-2015). The objective was to evaluate the performance of pigeon pea
genotypes for both herbage and grain yield and identify stable high yielder across
environment for further verification trial. Genotypes were arranged in a randomized complete
block design (RCBD) with three replications in which each plot comprises of four rows
having 4m length. The spacing between rows and plants were 50cm and 1m, respectively. A
100kg ha-1 DAP fertilizer was applied at planting. Agronomic management practices were
uniformly applied as per the recommendations for the particular plant. Data from herbage
yield, seed yield and other important agronomic traits and forage quality parameters were
measured as dependent variables. For sampling 200gm fresh biomass were taken and dried in
an oven at 65oC for 72 hours to a constant weight. Partially dried feed samples were crushed
and sieved by 1mm sieve screen using Wiley mill and stored in airtight plastic bags for
chemical analysis to Holeta Agricultural Research Center animal nutrition laboratory. Based
on yield and nutritional analysis data, two pipeline genotypes were selected for further
verification trial. During 2016/17 cropping season, verification trial was conducted at Bako,
Chewaka and Gute on station and on farmers’ field. The two best performing genotypes ILRI-
Acc#11575 (now named Degagsa) & ILRI-Acc#16527 (now named as Belebas) were grown
along with the standard check across location and evaluated by the national variety releasing
committee.

99
99
Proceeding of Adaptation and Generation of Agricultural Technologies IQQO AGP-II
Results and discussions
Varietal Origin/Pedigree and Evaluation
Degagsa and Belebas are the name given by the breeder to released pigeon pea (Cajanus
cajan) varieties with the pedigree of ILRI-Acc#11575 and ILRI-Acc #16527), respectively.
These and the other pigeon pea genotypes were originated from ILRI (International Livestock
Research Institute) and evaluated against the standard check ‘tsigab’, across three
environments (Bako, Chewaka and Gute in 2014 and 2015 main cropping seasons.
Herbage yield performances
Significant differences (P<0.01) were observed among genotypes in the mean herbage yields
and grain yields (Table 1). Degagsa and Belebas varieties gave higher herbage yields of 7.22
and 6.40 ton ha-1 per harvest with 77% and 57% yield advantage, respectively over standard
check (4.07 ton ha-1). Besides, the Degagsa and Belebas pigeon pea varieties had higher
(P<0.01) grain yields of 22.59 qt ha-1 and 26.99 qt ha-1 with 41% and 68% in that order than
the best standard check (16.02 qt ha-1).
Table 1: Mean herbage yield (DM tha-1) and Grain yield (Qtha-1) of different accessions of
Pigeon pea genotypes across locations from the year 2014 - 2015 G.C.
Genotypes
2014 2015 Mean
HY
Mean
GY Bako Chewaka Gute Bako Chewaka Gute
HY GY HY GY HY GY HY GY HY GY HY GY
ILRI-Acc#16274 2.69 10.76 4.99 12.89 3.57 13.89 2.66 16.11 3.37 12.61 2.85 15.56 3.36 13.64
ILRI-Acc#16277 2.80 9.98 4.48 21.60 4.62 15.33 3.22 15.38 3.58 12.28 2.93 19.66 3.61 15.71
ILRI-Acc#16520 2.57 10.35 5.27 20.54 3.80 14.03 2.77 13.99 3.27 9.72 2.78 22.35 3.41 15.16
ILRI-Acc#16524 2.56 8.31 3.84 26.08 2.91 18.50 3.71 17.33 3.53 9.13 2.70 21.48 3.21 16.81
ILRI-Acc#16526 2.33 13.37 4.53 23.41 3.53 15.94 3.60 19.43 3.31 13.39 2.97 21.61 3.38 17.86
Belabas(16527) 5.53 23.25 8.16 27.44 6.46 29.39 5.80 25.66 6.95 27.11 5.51 29.06 6.40 26.99
ILRI-Acc#16528 3.01 7.81 4.89 22.37 2.91 20.50 2.57 24.04 2.96 8.56 2.64 21.75 3.16 17.51
Tsigab (11566) 3.86 11.67 5.42 20.67 3.71 14.22 3.91 19.15 3.90 10.84 3.59 19.56 4.07 16.02
ILRI-Acc#16555 4.30 13.16 6.47 23.14 5.96 13.16 5.01 15.00 6.21 13.78 4.73 18.16 5.45 16.07
Degagsa (11575) 6.39 19.13 9.00 20.28 7.25 25.45 6.27 25.81 7.86 21.11 6.52 23.78 7.22 22.59
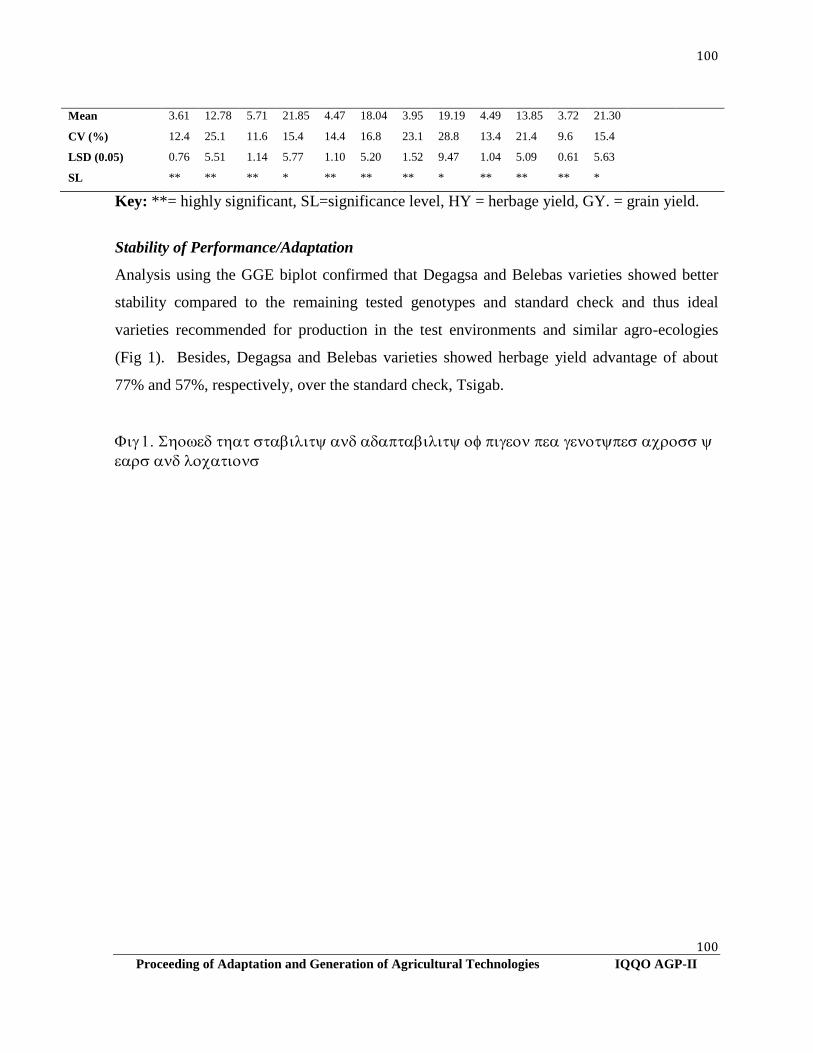
100
100
Proceeding of Adaptation and Generation of Agricultural Technologies IQQO AGP-II
Mean 3.61 12.78 5.71 21.85 4.47 18.04 3.95 19.19 4.49 13.85 3.72 21.30
CV (%) 12.4 25.1 11.6 15.4 14.4 16.8 23.1 28.8 13.4 21.4 9.6 15.4
LSD (0.05) 0.76 5.51 1.14 5.77 1.10 5.20 1.52 9.47 1.04 5.09 0.61 5.63
SL ** ** ** * ** ** ** * ** ** ** *
Key: **= highly significant, SL=significance level, HY = herbage yield, GY. = grain yield.
Stability of Performance/Adaptation
Analysis using the GGE biplot confirmed that Degagsa and Belebas varieties showed better
stability compared to the remaining tested genotypes and standard check and thus ideal
varieties recommended for production in the test environments and similar agro-ecologies
(Fig 1). Besides, Degagsa and Belebas varieties showed herbage yield advantage of about
77% and 57%, respectively, over the standard check, Tsigab.

101
101
Proceeding of Adaptation and Generation of Agricultural Technologies IQQO AGP-II
16520
16277
16527
16528
16274
16526
11575
16524
16537
16555
Comparison biplot (Total - 97.70%)
B1
C2G1
G2
B2
C1
PC1 - 95.42%
PC
2 -
2.27
%
AEC
Environment scores
Genotype scores
Key: B1=Bako 1st year, B2=Bako 2nd year, G1=Gute 1st year, G2= Gute 2nd year, C1= Chewaka 1st
year, C2= chewaka 2nd year
Nutritional Quality Analysis
Evaluation of nutritional quality of pigeon pea genotypes were conducted at Holota
Agricultural Research Center Nutrition laboratory. The analysis result showed that significant
variations were observed (p≤0.001) in Crude protein (CP) content among the pigeon pea
genotypes. The CP ranged from 18.98 to 22.08 %. Degagsa pigeon pea variety has higher CP
value (22.08 %) than the standard check ‘tsigab’ and other tested genotypes. On the other
hand, no different value was observed in dry matter and DOMD concentrations among the
genotypes. But Degagsa variety has recorded the higher numerical value in in vtro (DOMD)

102
102
Proceeding of Adaptation and Generation of Agricultural Technologies IQQO AGP-II
than the other genotypes (Table 3). But no significant variations were observed among the
genotypes in other quality parameters.
Table 2: Pooled mean DM, CP and DOMD values of different genotypes of Pigeon pea
across locations (Chewaka, Gute and Bako)
No
Genotypes
DM %
DM% CP DOMD
1 ILRI-Acc#16274 89.30 19.14cd 51.94bc
2 ILRI-Acc#16277 90.29 18.98d 51.93bc
3 ILRI-Acc#16520 89.58 20.04b 51.67c
4 ILRI-Acc#16524 88.73 19.90bc 51.60c
5 ILRI-Acc#16526 89.90 20.02b 51.88bc
6 Belabas (16527) 89.70 20.15b 51.90bc
7 ILRI-Acc#16528 88.69 19.80bc 51.65c
8 Stand. check (Tsigab) 89.20 20.32b 52.02ab
9 ILRI-Acc#16555 89.49 20.53b 52.29ab
10 Degagsa (11575) 89.64 22.08a 52.57a
Grand mean 89.45 20.10 51.94
LSD(0.05) 1.671 0.772 0.598
CV% 1.1 2.2 0.7
LS NS ** NS
p-value 0.637 <.001 0.073
Key: NS =none significant, **= highly significant, CV=coefficient of variation,
SL=significance level, LSD= least significant difference, DM=dry matter, CP=crude protein,
DOMD=digestible organic matter in dry matter (in vitro).
Reaction to Major Diseases
Phytophthora blight, Cercospora leaf spot and Fusarium leaf blight are economically
importance disease for pigeon pea production. Fortunately, the released varieties and other
tested genotypes including the standard check revealed resistance to these diseases throughout
the study periods (Table 3).
Agronomic and Morphological Characteristics
The released varieties, Degagsa (ILRIAcc. #11575) and Degebas (ILRIAcc.#16527) have
light yellow and yellow flower color, respectively. They are small perennial tree legumes.
Degagsa and Degebas pigeon pea varieties had 1000 seed weights of 22.59 and 26.98 g,
respectively and had 1.05 and 1.22 of leaf to steam ratio in that order. The detailed agronomic
characters of the newly released variety are indicated in (Table 3).
Table 3. Agronomic/morphological characteristics of Degagsa, Degebas varieties and standard
check.

103
103
Proceeding of Adaptation and Generation of Agricultural Technologies IQQO AGP-II
Characteristics Degagsa Degebas Tsigab (S.Check)
Adaptation area: Bako, Biloboshe, Gute, Chewaka and similar agro ecologies
Altitude (masl) 1300 – 1900
Rainfall (mm) 800 – 1200
Seeding rate (kg/ha): 4-4.5 kg
Spacing (m) Between row 1.00 and between plant 0.50
Planting time: At late June-early July
Fertilizer rate: (kg/ha): P2O5: 46; N: 18
Days to 50% flowering: 115
Days to seed maturity: 165 Height at biomass harvest (cm): 134.83 146.78 139.57
Growth habit: Small tree Small tree Small tree
Life span Perennial Perennial Perennial
Flowering color Light yellow Yellow yellow Seed color: Dark brown Red brown Saddle brown
Seed size: bold bold bold
Thousand seed weight (g): 97 93 89
Yield
Grain yield(qt ha-1) 22.59 26.98 16.02
Biomass yield (DM/t ha-1/cut): 7.22 6.4 4.07
Leaf-to-stem ratio 1.05 1.22 1.01
Crop pest reaction (1-9 scale)
Fusarium leaf blight 1 2 2
Cercospora Leaf Spot 2 2 2
Fodder quality:
DM (%): 89.64 89.70 89.20
CP (%): 22.08 20.15 20.30
OM (%): 92.74 93.31
IVDMD (%): 52.57 51.90 52.02
Ash (%): 7.26 6.69
NDF (%): 68.89 70.04
ADF (%): 46.47 46.49
ADL (%) 14.34 15.61
Special merits: High biomass yield High gran yield
Year of release: 2017 2017
Breeder/maintainer: BARC
Conclusion and recommendation
Degagsa and Belebas pigeon pea varieties outperform in both herbage and grain production
and other desirable traits over the standard check ‘Tsigab’ cultivar. The two varieties had
better nutritional quality, especially Crude Protein and invtro digestibility, good general
adaptability and moderately resistant to disease such as Cercospora leaf spot and Fusarium
leaf blight than the standard check. Therefore, the varieties were officially released and an

104
104
Proceeding of Adaptation and Generation of Agricultural Technologies IQQO AGP-II
ideal varieties recommended for production in the test environments and other areas with
similar agro-ecologies.
Acknowledgements
The authors acknowledge the Oromia Agricultural Research Institute, Agricultural Growth
and Transformation Project (AGP)-II for funding).Their great thanks also go to the Animal
Nutrition Laboratory of Holota Agricultural Research Center for their assistance in nutritional
quality analysis .The authors also express their gratitude to all staff members of the Animal
Feed and range land management research Team of the Bako Agricultural Research Center
for the execution of the experiment.
.
References
Funte, S, Negesse T., and Legesse, G., 2010. Feed resources and their management systems in
ethiopian highlands: The case of umbulo wacho watershed in southern Ethiopia. Tropical and
subtropical Agro-ecosystems, 12: 47-56.
Gemeda Duguma, 2010. Participatory definition of breeding objectives and implementation of
community-based sheep breeding programs in Ethiopia. PhD. Thesis, University of Natural
Resources and Life Sciences, Vienna, Austria.20p.
Khandelwal, S., Udipi, S.A. and Ghugre, P. 2010. Polyphenols and tannins in Indian pulses: Effect of
soaking, germination and pressure cooking. Food Research International 43: 526-530
Solomon Melaku, 2001. Evaluation of selected multipurpose trees as feed supplements in tef
(Eragrostis tef) straw based feeding of Menz sheep. PhD. dissertation. Humboldt University,
Berlin, Germany. 88p.
.

105
105
Proceeding of Adaptation and Generation of Agricultural Technologies IQQO AGP-II
Effect of planting season and stage of harvesting on forage yield and quality
of oats varieties in the highland of Bale
*Aliyi Kedu1, Taklu Wagi1, Dawit Abate2 and Birhanu Tasow1
1Sinana Agricultural Research Center P.O. Box 208, Bale-Robe, Ethiopia,
Email:[email protected]
2Adami Tulu Agricultural Research Center
Abstract
The experiment was conducted to determine the appropriate planting season and optimum
stage of harvesting for forage yield and quality of fodder oat varieties at Sinana on-station
and Agarfa (sub-site) of Bale highlands. Two newly released varieties of fodder oat (Bonsa
and Bonabas) were used for the study. The material were sown in two cropping seasons in a
year with varieties as main plot and stage of harvest as sub plot (boot, heading, milk, and soft
dough stage) for two years. The analysis of variance showed that interaction of varieties and
harvesting stages significantly affected (P<0.05) leaf to stem ratio (LSR) and total dry matter
yield (DM). The chemical analysis of the data indicated that varieties and harvesting stages
significantly affected (P<0.05) Dry matter (DM %), Ash (Ash %), Organic matter (OM %),
Crude Protein (CP %), Neutral detergent fiber (NDF %), Acid detergent fiber (ADF %). As
the age of the crop advances; biomass yield, Organic matter (OM %), Neutral detergent fiber
(NDF %) and Acid detergent fiber (ADF %) showed an increment and Quality parameters
such as Crude Protein (CP %), and invitro organic matter digestibility (TIVOMD %)
indicated decreasing. The highest DM (13.2 t/ha) and lowest CP% (7.0 ton/ha) was obtained
for Bonabas harvested at soft dough stage. Seasonal variation was also observed on yield and
quality of fodder oat.
Key words: Crude protein, Biomass, fodder oat

106
106
Proceeding of Adaptation and Generation of Agricultural Technologies IQQO AGP-II
Introduction
Livestock production has been an integral part of the Bale landscape for many centuries. Until
recent few decades the livestock system was extensive with small numbers of people and
livestock moving in a free and mobile manner. However since the time of Haile Selassie-I
regime there have been numerous influencing factors that have changed the trend of livestock
production in Bale. This began with the introduction of land measurement and taxes which
encouraged settled agricultural expansion, aggravated by the declaration of grazing lands as
‘no-man’s lands’. At the same time, large scale mechanized farms were established in the
areas, forcing livestock producers into the higher altitude regions and limit their livestock
number and types. Currently most of the areas in the highlands of Bale are under cultivation
of food crops. This was forced local farmers to keep large number of livestock on limited
grazing area leading to overgrazing and poor productivity of livestock. Though, expansion in
the cultivation of cereal crops was increased the utilization of crop residues for animal
feeding. Crop residues nutritive value is bellow requirement of the animal not only for
production even for animal body maintenance. According to NRC (1978) sole Barley and
wheat straw which is the commonly used basal diet in the area have CP of 4.1% and 4.2%,
respectively which is extremely bellow the animal requirement. Hence, shortage of nutrients
for livestock is increasingly becoming serious in the area.
Since last three decades, to harmonize the livestock production with extremely dominating
crop production activity in the area, different suitable technologies such as crop residue
utilization, grazing land improvement, fodder crop productivity improvement research and its
pre-extension activities has been carried out by Sinana Agricultural Research Center. One of
the recommended alternatives to improve livestock feeding, and thereby their productivity
was cultivation of improved forage crops. Fodder oats (Avena sativa), was among forage
species that has been promoted for cereal dominated production system of Bale highland.
Bonsa and Bonabas fodder oat varieties of SARC having 11.5% and 12.4% CP (Abate et.al.
2011), respectively, and can yield more than 10tone DM/ha are the promising varieties
particularly released for wheat and barley belt areas of Arsi and Bale highland.
107
107
Proceeding of Adaptation and Generation of Agricultural Technologies IQQO AGP-II
By their nature fodder oat (Avena sativa ) varieties are adapted to a wide range of soil types,
altitudes and rainfall conditions, and tolerate water logging than most of the other cereals
(Alemayehu, 1997). Currently it is the most common forage choice among the smallholder
farmers of Bale highland. These two fodder oat varieties have a little bit variation depending
on their age of maturity and their preference by the farmers also varies based on the length of
rain fall receiving period. Oat varieties which require long rainfall duration for maturation are
referred as late maturing types whereas the varieties with relatively require short rainfall
period called as early maturing ones. All types of oats are cultivated both in Bona and Ganna
seasons of a double-cropping system of Bale highlands. Planting season can be considered as
crucial factors that determines herbage yield and quality of cultivated forage crops. Studies
also indicated that herbage yield and quality of oats are determined by environment,
management practices, and genetics (Firdous and Gilani 2001; Yu et al., 2004).
Environmental factors such as temperature and precipitation which strongly influenced by the
seasons has great role for yield and quality of forage (Kim et al., 2001). Kim et al, (2001) also
indicated that growing season and variety differences have significant effect on the DM
content, CP and TDN of fodder oats. For instance, CP content of the oat variety at spring
season was lower than during the autumn season and CP content of late-maturing varieties
was higher than the early-maturing variety
On the other hand fodder oats is usually recommended to be harvested for feeding at the
dough stage of maturity. Study indicated that the differences in yield and feeding value of
fodder oats harvested at different stages of maturity: boot, flower, milk and dough (Meyer et
al., 1975). Within each of the forage species there are many varied cultivars which have
unique agronomic characteristics. Smallholder farmers of Bale highlands have been
recognized the difference in feeding value of forage (fodder oats) harvested at different stage
maturity. Studies also indicated that there are tremendous differences in yield and feeding
value of forage depending on which growth stage is chosen for harvest (Orloff, S. and D.
Drake, 1998). Maturity of forage is closely related to its crude protein and fiber content,
digestibility, dry matter yield. For instance in alfalfa, as the stage of maturity increases, so
does its fiber content and digestibility decreases. It was indicated that there was a greater

108
108
Proceeding of Adaptation and Generation of Agricultural Technologies IQQO AGP-II
digestibility, faster weight gains, and higher milk production from cattle fed alfalfa harvested
at an immature stage (Robinson, 2001).
Hence, in agro-ecologies like the highlands of Bale where there is two important cropping
seasons, there is a need to determine the more suitable season for good yield and quality
fodder oats production. Likewise, determination of optimum stage of harvest to obtain
maximum yield and quality is very important. Yet, studies were not conducted with regard to
management practices such as the best season of planting and optimum stage of harvest of
fodder oats varieties for the highland of Bale. Thus, the intention of this study was to
investigate the effect of planting season and stage of harvesting on forage yield and quality of
fodder oat (Bonsa and Bonabas) varieties.
Material and Methods
The experiment was conducted in highly cereal crop dominated, crop-livestock mixed
production system area of Bale highland at Sinana on-station and Agarfa (sub-site). The Two
newly released varieties of fodder oat (Bonsa and Bonabas) were used for the study. The
treatments were sown in two cropping seasons locally called ‘Bona’ (from August to
December) and ‘Ganna’ (March to July) with varieties as main plot and stage of harvest as
sub plot (boot, heading, milk, and soft dough stage) using split plot design replicated three
times. Row planting with 20cm between rows using a plot size 2mx1.8m and seed rate of
80kg/ha fertilized by 100kg/ha DAP and 50kg/ha UREA were used.
Agronomic and yield parameters such as percent of lodging, plant height at different harvest
stage, herbage dry matter yield at different harvesting stage, leaf to stem ration, and days to
different harvesting stage were collected. Two middle rows per different stage were harvested
to measure herbage yields at different harvesting stage. The total fresh biomass were recorded
in the field and about 500gm and 200gm forage samples were collected in paper bag for
determination of dry matter percentage and leaf to stem ratio, respectively. To determine dry
matter content of the samples, the samples were oven dried at 650C for 72 hours. The Feed
sample was analyzed for DM, CP and Ash content according to the standard methods of

109
109
Proceeding of Adaptation and Generation of Agricultural Technologies IQQO AGP-II
AOAC (1990). Neutral detergent fiber (NDF), acid detergent fiber (ADF) and acid detergent
lignin (ADL) analysis was followed the procedures of Van Soest et al, (1991). In vitro DM
digestibility was also determine by the Tilley and Terry method as modified by Van Soest and
Robertson (1985). Analysis of variance was performed using the statistical analysis system
(SAS 1999) software and mean separation was carried out using the Least Significant
Difference (LSD) test.
Result and desiccation
Agronomic and yield performances of early (Bonsa) and late (Bonabas) maturing oat
varieties during Bona (Meher) season are presented in Table 1. There were significant
difference (P ≤0.05) in plant height, leaf to stem ration, green forage and dry matter yield for
both varieties with harvest stages (Table 1). Plant height increased by 42 and 40.4% from boot
to soft dough stage for early and late maturing varieties of oat, respectively. The increment
was uniform despite the varieties. Leaf to stem ratio (0.95 and 0.79, respectively, for early and
late maturing oat varieties) at boot stage had greater (P<0.05) than all other harvesting stages.
This shows the proportion of leaf increased at immature stage and declines as its age
advances. Similarly, green forage yield decreased with harvesting stages. Dry matter yield
were lowest at boot stage and highest at soft dough stage for both varieties. Dry matter yield
increased by 5.1 and 4.4 tha-1, respectively, for early and late maturing oat varieties at soft
dough than boot stage. Besides harvesting stage, location and plating year affects agronomic
and yield performances. Plant height, Fresh biomass forage and dry matter yield were
significantly higher (P≤0.05) at Sinana on station than Agarfa sub site. This is related to low
temperature and soil character (water logging) at Agarfa.

110
110
Proceeding of Adaptation and Generation of Agricultural Technologies IQQO AGP-II
Table 1. Three years data analysis of agronomic and yield performances of early and late
maturing fodder oat varieties during Bona (Mehar) season
Harvesting Stages Bonsa Bonabas
PH
(cm)
LSR GFY
(t/ha)
DM
(t/ha)
PH
(cm)
LSR GFY
(t/ha)
DM
(t/ha)
Boot 96.1c 0.95a 49.3a 9.7c 108.8c 0.79a 48.6a 10.9b
Heading 114.7b 0.66b 53a 12.5b 127.8b 0.57b 47.9ab 14.2ab
Milk 130.4a 0.51c 49.4a 12.9a 147.3a 0.42c 37.9c 12.8ab
Soft dough 136.8a 0.47c 39.5b 14.8a 152.8a 0.41c 39.6bc 15.3a
Mean 119.5 0.65 47.8 12.5 134.2 0.55 43.5 13.3
CV (%) 14.2 30 20.5 25.5 12.9 35.8 29.7 39.6
lsd 11.3 0.13 6.5 2.1 11.6 0.13 8.6 3.5
Sinana on station 142.4a 0.61 63.6a 14.3a 148.3a 0.44b 56.8a 15.9a
Agarfa sub site 96.6b 0.69 32b 10.6b 120b 0.66a 30.2b 10.6b
Lsd 7.9 0.09 4.6 1.5 8.2 0.09 6.1 2.5
Key: CV=coefficient of variation, GFY=green forage yield, lsd=least significant difference, LSR=leaf
to stem ration, PH=plant height, Means within a column with different superscript differ significantly
(P<0.05)
Agronomic and yield performances of Bonsa and Bonabas fodder oat varieties during Gana
(Belg) season are presented in Table 2. There were significance differences (P<0.05) among
the parameters from boot to soft dough harvesting stages. The variations for plant height, leaf
to stem ratio and dry matter yield for both early and late maturing oat varieties follows the
same trend as that of Meher season except the green forage yield, which showed the reverse
pattern. Green forage yield was significantly (P<0.05) higher at soft dough stage than other
stages for early maturing variety and at boot stage for late maturing oat variety. This is due to
the short period overlapping of Mehar and Belg seasons i.e. when oat variety reached at soft
dough stage during the Belg season, the first rain for Mehar season starts and the variety
continue vegetative growth stages without seed filling. Due to this, seed quality was poor and
yield was very low for both varieties during Belg season at all location during the
experimental periods.

111
111
Proceeding of Adaptation and Generation of Agricultural Technologies IQQO AGP-II
When we compare the agronomic and yield performances of the varieties across season, the
performances during Meher season are much better than Belg season (Table 1 and 2). The
highest green forage yield obtained was 53 and 48.6 t/ha for Meher and 24.6 and 27.3 t/ha for
Belg season for Bonsa and Bonabas, respectively. Similarly, the highest dry matter yield
obtained was 14.8 and 15.3 t/ha for Meher and 5.5 and 7.3 t/ha for Belg season for Bonsa and
Bonabas respectively. This indicated that yield performances were doubled for Meher season
compared to Belg season which might be due to favorable environmental condition for Meher
as compared to Belg season.
Table 2. Three years analysis of agronomic and yield performances of early and late maturing
oat varieties during Gena (Belg) season. Harvesting
Stages
Bonsa Bonabas
PH (cm) LSR GFY(t/ha) DM (t/ha) PH (cm) LSR GFY(t/ha) DM (t/ha)
Boot 50.8d 0.99a 14.1b 2.9b 67.5c 0.86a 16.5b 3.9c
Heading 63.4c 0.89a 16.5b 4.0b 94.4b 0.71b 23.4a 5.8b
Milk 74.3b 0.73b 21.0a 5.5a 107.4a 0.41c 26.8a 6.4ab
Soft dough 83.9a 0.38c 24.6a 5.4a 110.9a 0.27d 27.3a 7.3a
Mean 68.1 0.75 19.1 4.5 95.1 0.56 23.5 5.8
CV (%) 18.4 29.8 35.1 46.9 16.1 25.5 26.2 39.2
Lsd 8.4 0.15 4.5 1.4 10.2 0.09 4.1 1.5
Location
Sinana 68.6 0.72 21.2a 4.2 95.6 0.55 26.6a 5.6
Agarfa 67.7 0.78 16.9b 4.7 94.6 0.56 20.5b 6.1
Lsd 5.9 0.11 3.2 0.99 7.2 0.07 2.9 1.1
Key: CV=coefficient of variation, GFY=green forage yield, LSD=least significant difference,
LSR=leaf to stem ration, PH=plant height, Means within a column with different superscript
differ significantly (P<0.05)
The effect of stage of harvesting on quality parameters such as OM, CP, fiber and IVOMD
during Meher is shown on Table 3. The Quality parameters were significantly varied (p<0.05)
with different stage of harvesting during different season of planting. The lowest DM
112
112
Proceeding of Adaptation and Generation of Agricultural Technologies IQQO AGP-II
percentage was obtained at early (boot stage) but its value increased as plant maturity advance
though not statistically significant among the three later stages. On the contrary, ash and crude
protein percentage sharply decline as plant maturity advanced. This agrees with the result of
Corleto et al. (2004) Conducted on safflower and Jagadeesh et al. (2016) done on hybrid
Napier grass (Penniserum purpureum L.). This is due to the facts of leafy material generally
has higher ash content than stem material (Monti et al., 2008) and decreasing of leaf to stem
ratio as the plant maturity stage advances. Decline in total ash content is also related to earlier
dilution and translocation of minerals from vegetative portion of the plant to roots at late stage
of maturity Maynard et al. (1981). In addition, Study by Gezahagn et al. (2014) and Kitaba et
al. (2007) also indicated that Crud protein content is positively correlated with ash content.
Considerably (p<0.05) the lowest fiber content (NDF, ADF and ADL) was noted at boot stage
for both varieties and the value increased as the plant advanced in maturity for Bonabas.
The highest contents of NDF % and ADF % was observed at milk stage and then decreasing
pattern for Bonsa which is due to early seed feeling character of the variety. This is related to
total fiber content declining of the cereal plant at the dough stage, resulting in a curvilinear
relationship between fiber and maturity (Corleto et al, 2004). This is due to the grain, being
very low in fiber, dilutes the increasing fiber of the stem, resulting in little change in total
plant fiber as the plant matures. In-vitro organic matter digestibility (TIOMD) and
metabolizable energy (ME) contents were higher at early stage (at boot stage) and declined as
stage of growth increased for both varieties as expected.

113
113
Proceeding of Adaptation and Generation of Agricultural Technologies IQQO AGP-II
Table 3. Quality analysis of early and late maturing oat varieties during Bona (Meher) season
Varieties Parameters Harvesting stages Mean CV
(%)
Lsd
(0.05) Boot Heading Milk Soft dough
Bonsa
DM (%) 88.6b 89.8a 90.2a 89.9a 89.4 0.57 0.62
Ash (%) 8.6a 6.7b 6.1bc 5.6c 6.7 12.3 1.0
CP (%) 10.6a 8.0b 7.1c 7.0c 8.2 5.3 0.53
NDF (%) 57.6c 65.9b 68.6a 67.2ab 64.8 3.3 2.6
ADF (%) 31.9c 40.0b 42.7a 39.3b 38.5 5.3 2.5
ADL (%) 2.3c 4.3b 5.2a 5.1a 4.2 11.7 0.59
TIVOMD (%) 58.8a 54.9b 53.5c 53.3c 55.1 1.3 0.84
ME(MJ/kg DM) 8.7a 8.4b 8.3b 8.3b 8.4 1.4 0.14
Bonabas
DM (%) 89.6b 90.2ab 90.6a 90.6a 90.2 0.85 0.93
Ash (%) 8.7a 6.3b 5.1b 4.8b 6.2 26.6 1.9
CP (%) 10.4a 8.0b 6.6c 5.9c 7.7 10.9 1.0
NDF (%) 62.1c 67.8b 70.3ab 72.1a 68.1 4.8 3.9
ADF (%) 36.9c 41.7b 45.3ab 46.8a 42.7 8.6 4.4
ADL (%) 4.1c 4.9bc 5.9ab 6.5a 5.4 19.1 1.2
TIVOMD (%) 58.5a 54.9b 52.7c 51.6c 54.4 2.3 1.5
ME(MJ/kg DM) 8.7a 8.4b 8.2bc 8.1c 8.4 2.1 0.21
Key: ADF=acid detergent fiber, ADL=acid detergent lignin, CP=crude protein,
CV=coefficient of variation, DM=dry matter, IVOMD=invitro organic matter digestibility,
lsd=least significant difference, ME=metabolizable energy, NDF=neutral detergent fiber,
Means within a column with different superscript differ significantly (P<0.05)
The effect of stage of harvest on quality parameters such as OM, N, fiber and IVOMD during
Belg season is shown on Table 4. Stage of harvesting significantly (p<0.05) affected the
quality of both varieties. All parameters showed similar trend of change by the influence of
maturity of plant as observed in Bona season except ash content which was not affected by
stage of maturity. The variation was similar with variation observed during Bona season.
Except the percentage of CP and TIVOMD, which were higher during Belg season compared
to Meher season, the percentage of the rest quality parameters were remain unchanged due to
season variation.

114
114
Proceeding of Adaptation and Generation of Agricultural Technologies IQQO AGP-II
Table 4. Quality analysis of early and late maturing oat varieties during Gena (Belg) season
Varieties Parameters Harvesting stages Mean CV
(%)
Lsd
(0.05) Boot Heading Milk Soft dough
Bonsa
DM (%) 88.4b 88.7b 88.9b 90.4a 89.1 0.59 0.64
Ash (%) 8.7 8.7 8.5 8.8 8.3 21.1 2.1
CP (%) 13.2a 12.1b 10.2c 8.4d 10.9 7.8 1.0
NDF (%) 57.6d 60.7c 63.5b 70.3a 63.0 2.8 2.1
ADF (%) 28.8c 31.3bc 33.5b 41.4a 33.7 7.8 3.1
ADL (%) 2.0c 2.5bc 3.2b 5.8a 3.4 19.1 0.78
TIVOMD (%) 62.9a 61.2b 58.2c 55.5d 59.4 2.2 1.6
ME(MJ/kg DM) 9.3a 9.1b 8.8c 8.3d 8.9 1.6 0.17
Bonabas
DM (%) 89.0c 89.4c 90.2b 90.7a 89.8 0.44 0.48
Ash (%) 8.0 6.7 7.0 7.9 7.4 17.9 1.6
CP (%) 13.0a 10.6b 9.4b 7.9c 10.3 11.3 1.4
NDF (%) 61.8c 65.9b 70.1a 72.3a 67.5 3.2 2.6
ADF (%) 31.6d 35.4c 40.6b 44.6a 38.1 8.3 3.8
ADL (%) 2.9d 3.8c 4.9b 6.5a 4.5 17.3 0.94
TIVOMD (%) 62.6a 58.9b 57.1b 54.7c 58.3 3.0 2.1
ME(MJ/kg DM) 9.3a 8.9b 8.6c 8.2d 8.8 2.2 0.24
Key: ADF=acid detergent fiber, ADL=acid detergent lignin, CP=crude protein, CV=coefficient of
variation, DM=dry matter, IVOMD=invtro organic matter digestibility, lsd=least significant
difference, ME= metabolizable energy, NDF=neutral detergent fiber, Means within a column with
different superscript differ significantly (P<0.05).
Conclusion and recommendations
The result of the experiment showed that varieties and harvesting stages significantly
(P<0.05) affected leaf to stem ratio (LSR), total dry matter yield (DM) and other quality
parameters. As the age of the crop advances biomass yield, Organic matter (OM %), Neutral
detergent fiber (NDF %) and Acid detergent fiber (ADF %) indicated increment, but quality
parameters such as Crude Protein (CP %), and invitro organic matter digestibility (TIVOMD
%) indicated decreasing. The earlier harvesting time the better in nutrition quality but the
lowest DM yield was observed. Accordingly, the highest DM (13.2 t/ha) and lowest CP% (7.0
ton/ha) was recorded for Bonabas harvested at soft dough stage. The chemical analysis of the
115
115
Proceeding of Adaptation and Generation of Agricultural Technologies IQQO AGP-II
sample indicated that varieties and harvesting stages was significantly affected (P<0.05) Dry
matter (DM %), Ash (Ash %), Organic matter (OM %), Crude Protein (CP %), Neutral
detergent fiber (NDF %), Acid detergent fiber (ADF %). Ganna season is not appropriate for
seed production probably due to the long rainy season that damage the seed quality. In
general, to attain both high quality and high biomass yield, harvesting at milk stage during
Gana season and also relatively better variety for fodder production is Bonsa. Bona season is
preferably better than Gana season on seed production for both tested varieties.
References Alemayehu Mengistu 1997. Conservation based forage development for Ethiopia. Institute
For Sustainable Development. Addis Ababa, Ethiopia. pp. 1-2, 57-60, 86-88.
AOAC (Association of Official Analytical Chemists). 1990. Official Methods of Analysis.
Fifteenth edition. AOAC Inc., Arlington, Virginia, USA. 1298pp.
C.H. Jagadeesh1, Y. Ramana Reddy1, D. Nagalakshmi1, M. Mahender2, N. Nalini Kumari1,
K. Sridhar1 and K.B. Suneetha Devi 2017. Effect of stage of harvest on the yield,
chemical composition, in vitro and in sacco digestibility of hybrid napier (Penniserum
purpureum) variety APB N. Indian Journal of Animal Research. 51 (1) pp. 116-120
Corleto A., E. Cazzato, V.Tufarelli, M. Dario, V. Laudadio 2004. The effect of harvest date
on the yield and forage quality of ensiling safflower biomass: 7th international
Safflower conference, Australia.
Dawit Abate and Taklu Wagi. 2011. Registration of ‘Bonsa’, and ‘Bonabas’ fodder Oat
Varieties for Bale Highlands, Ethiopia. East African Journal of Sciences (EAJS).
Firdous, R. and A. H. Gilani. 2001. Changes in chemical composition of sorghum as
influenced by growth stages and cultivar. Asian-Aust. J. Anim. Sci. 14:935-940.
Kim, J. G., E. S. Chung, S. Seo, J. S. Ham, W. S. Kang and D. A. Kim. 2001. Effects of
maturity at harvest and wilting days on quality of round baled rye silage. Asian-Aust. J.
Anim. Sci. 14:1233-1237.
Meyer, J.H., W.C. Weir, L.G. Jones and J.L Hull. 1975. The influence of stage of maturity on
the feeding value of oat hay. J. Anim. Sci. 16:623.
Monti A, DiVirgilio N, Venturi G (2008) Mineral composition and ash content of six major
energy crops. Biomass and Bioenergy, 32, 216–223.
NRC (1978). Nutrient requirements of Dairy cattle. Fifth revised addition. National Research
Council, subcommittee on dairy cattle nutrition. National Academy of Sciences,
Washington DC.
Orloff, S. and D. Drake. 1998. Evaluation of winter growing annual grass species for winter
and spring grazing and hay production. UC Cooperative Extension, Siskiyou County
publication
Robinson, P.H. 2001. Estimating the energy value of corn silage and other forages. In
Proceedings of the 31st annual California Alfalfa Symposium.
SAS (Statistical Analysis System), 1999. Version 8. Statistical analysis system institute Inc.,
NC. USA.

116
116
Proceeding of Adaptation and Generation of Agricultural Technologies IQQO AGP-II
Van Soest, P.J. and Robertson, J.B. 1985. Analysis of Forages and Fibrous Foods. A
Laboratory Manual for Animal Science 613. Cornel University, Ithaca. New York,
USA. 202 pp.
Van Soest, P.J., Robertson, J.B. and Lewis, B.A. 1991. Methods for dietary fiber, neutral
detergent fiber and non-starch polysaccharides in relation to animal nutrition. J.Dairy
Sci. 74: 3583-3597.
Yu, P., D. A. Christensen, J. J. McKinnon and H. W. Soita. 2004. Using chemical and
biological approaches to predict energy values of selected forages affected by variety
and maturity stage: Comparison of three approaches. Asian-Aust. J. Anim. Sci. 17:228-
236.
Gezahagn K, Getnet A, Alemayehu M and Fekede F 2014.Forage nutritive values of vetch
species and their accessions grown under nitosol and vertisol conditions in the central
highlands of Ethiopia. Livestock Research for Rural Development. Volume 26, Article
#20. Retrieved July 14, 2017, from http://www.lrrd.org/lrrd26/1/kebe26020.htm
Kitaba A., Tamir, B. 2007. Effect Of Harvesting Stage And Nutrient Levels On Nutritive
Values Of Natural Pasture In Central Highlands Of Ethiopia Agricultura Tropica Et
Subtropica. Vol. 40 (1). https://www.agriculturaits.czu.cz. Accessed on 14/07/2017
Maynard, A. L., Loosli, K. J., Hintz, F. H., 1981. Animal Nutrition. 7 th edition. Tata Mc
Graw-Hill Publishing Company Limited. New Delhi, India.

117
117
Proceeding of Adaptation and Generation of Agricultural Technologies IQQO AGP-II
Effect of planting season and stage of harvesting on forage yield and quality of
Vetch varieties in the highland of Bale, Ethiopia
*Aliyi Kedu1, Taklu Wagi1, Dawit Abate2 and Birhanu Tasow1
1Sinana Agricultural Research Center P.O. Box 208, Bale-Robe, Ethiopia
2Adami Tulu Agricultural Research Center, Batu, Ethiopia
*Corresponding author: [email protected]
Abstract
The experiment was conducted for three consecutive years at Sinana on-station and Agarfa
(sub site) of Bale highland with the objective of determining the appropriate planting season
and optimum stage of harvesting for forage yield and quality of vetch varieties. The area is
crop-livestock mixed with cereal crop dominating production system. Two newly released
varieties of fodder vetch (Gabisa and Lalisa) were used for the study. The material was sown
in both bona and Gena cropping seasons with varieties as main plot and stage of harvest as
sub plot (beginning of flowering, full flowering and Seed filling). Three years (Six seasons)
data analysis showed that varieties and harvesting stages significantly affected (P<0.05) leaf
to stem ratio (LSR) and total dry matter yield (DM). The highest DM (10.4 t/ha) were
recorded for Lalisa harvested at seed filling stage during Bona, while the highest LSR about
(1.0) were obtained from Bonsa at beginning of flowering and full flowering harvesting stages
of both season. The chemical analysis revealed that varieties and harvesting stages
significantly affected (P<0.05) Dry matter (DM %), Ash (Ash %), Crude Protein (CP %),
Neutral detergent fiber (NDF %), Acid detergent fiber (ADF %), Acid detergent lignin (ADL
%) during both season. The intermediate point negotiating Biomass yield and quality hay is
harvesting at flowering stage to obtain better LSR and CP of 13.7% and 14.4% during Bona
and 15.9% and 14.3% during Gena for Lalisa and Gabisa respectively. Ganna season is not
appropriate for seed production due to long rain damaging the seed quality.
Key words: Crude protein, Biomass, fodder vetch
118
118
Proceeding of Adaptation and Generation of Agricultural Technologies IQQO AGP-II
Introduction
Feed shortage is repeatedly reported as one of the major constraint of livestock production in
highlands of Bale. Improved forage legumes crops such as vetch are recognized for their
potential to produce good feed resource to solve the feed shortage. Vetch is one of annual
forage legume adapted to a wide range of soil types, altitudes and rainfall conditions
(Alemayehu 1997). It is found to be with high herbage yield under low input condition such
as fertilizer and can be used for livestock feeding in the form of green or conserved for dry
season use. It is also a highly efficient N fixer and can replace much of the N fertilizer. Some
of its agronomic traits are its competitiveness with weeds, growth under local management
condition. Vetch cropping promotes yields above those attainable from conventional cropping
system largely through improved soil quality. Including vetch into the cropping system
provides an environmentally friendly solution to reducing use of N fertilizer while improving
soil fertility and enhancing crop yield.
In Bale highland there is two important cropping seasons suitable for forage production.
Forage legumes such as vetch fit well in double cropping systems of Bale highland and
provide an important source of feed. The herbage yield and quality of forage can be affected
by growing season and harvesting stages. The performance of individual variety could also
vary from season to season. Environmental factors such as temperature, water stress, light,
and soil nutrients are well known to have a significant impact on the quality of forage plants,
particularly those grown in environments with varying degrees of different stresses. These
stresses can result in large variations, mainly between seasons in forage yield and quality.
Stress occurs when an environmental factor is not ideal for plant growth, for example, too low
or too high a temperature, water logging, drought, a soil nutrient deficiency (Buxton and
Fales, 1994).
Studies show that the effects of condensed tannin (CT) in forage legumes have been related to
the species (Jackson et al., 1996), plant part (Barahona et al., 1997), genotype within species
(Schultze-Kraft and Benavides, 1988), plant maturity (Lees et al., 1995), and environmental

119
119
Proceeding of Adaptation and Generation of Agricultural Technologies IQQO AGP-II
factors (Barry and Forss, 1983; Anuraga et al., 1993). The variation of CT levels with plant
genotype and environmental conditions suggests that CT accumulation can be regulated
through selection or breeding, and through targeting legumes to specific environmental
“niches” that favor low CT concentration in edible forage.
This needs the selection of the variety for its suitable cultivation season. Hence, depending on
which cultivar or variety is chosen, and how it is managed, it is possible to utilize the
maximum advantage of the forage for our animals. However, there is lack of adequate
information on the herbage yield and quality produced during these two different cropping
seasons. As the result the suitable cropping season for good herbage yield and quality not
clearly identified. Moreover, the appropriate stage of harvesting for optimum herbage yield
and quality of vetch is not yet determined. Hence, determination of appropriate planting
season and optimum harvesting stage of vetch varieties (Gabisa and Lalisa) for the highlands
of Bale is very crucial. Therefore; this activity was carried out to determine the appropriate
planting season and optimum stage of harvesting for forage yield and quality of vetch
varieties.
Material and Methods
The experiment was conducted at Sinana On station and Agarfa (sub-site) of Bale highland
for three consecutive years. The area is crop-livestock mixed with cereal crop dominating
production system characterized by bimodal rain fall resulting in two cropping seasons locally
called ‘Bona’(from August to December) and ‘Ganna’ (March to July). Two newly released
varieties of vetch (Gabisa and Lalisa) were used for the study. The experiment was arranged
in split plot design, replicated three times and sown in two cropping seasons with varieties as
main plot and stage of harvest as sub plot (beginning of flowering, full flowering and seed
filling). Recommended seed rate 30kg/ha and 100kg DAP/ha fertilizer were used on plot size
2*2.1 m2.
Data for grain yield and other agronomic traits such as plant height at different harvest stage,
days to beginning of flowering, full flowering and seed setting, herbage yield at different
harvesting stage, and leaf to stem ration were collected. For herbage yield, two middle rows

120
120
Proceeding of Adaptation and Generation of Agricultural Technologies IQQO AGP-II
were harvested at different harvesting stage. At harvest, total fresh biomass was recorded at
field and 500gm and 200gm forage samples were collect to paper bag for determination of dry
matter percentage and leaf to stem ratio respectively.
To determine dry matter content, the samples were oven dried at 650C for 72 hours and
weighted for DM yield estimation. The feed sample was analyzed for DM, CP and Ash
content according to the standard methods of AOAC (1990). Neutral detergent fiber (NDF),
acid detergent fiber (ADF) and acid detergent lignin (ADL) analysis was followed the
procedures of Van Soest et al. (1991). In vitro DM digestibility was also determined by the
Tilley and Terry method as modified by Van Soest and Robertson (1985). Least Significant
Difference (LSD) of Mean separation of different agronomic and yield parameters of different
harvesting stage to dry matter yield was carry out using statistical analysis system (SAS 1999)
software.
Result and Discussion
The agronomic and yield performances of vetch (Gebisa and Lalisa) varieties during Bona
(Meher) season are presented in Table 1. Leaf to stem ratio harvested at beginning of
flowering stage was significantly (P≤0.05) greater than that obtained at seed filling stage for
both varieties. The proportion of leaf was decreased as plants age increased for both varieties.
Green forage yield obtained at seed filling stage is higher (P<0.05) than that obtained at
beginning of flowering stage for Gebisa and remain unchanged for Lalisa variety. DM yield
harvested at seed filling stage had greater by 132% and 73%, respectively, for Gebisa and
Lalisa than harvested at beginning of flowering stage. This showed that the highest yield was
obtained at later harvesting stage and early immature harvest result in a loss in dry matter
yield. Plant height obtained at Sinana on station was significantly greater (P<0.05) than
Agarfa sub site for both varieties (Table 1).

121
121
Proceeding of Adaptation and Generation of Agricultural Technologies IQQO AGP-II
Table 1: The three years data analysis of agronomic and yield performances of vetch varieties
during Bona (Mehar) season Harvesting stages Gebisa Lalisa
PH
(cm)
LSR GFY
(t/ha)
DM
(t/ha)
PH
(cm)
LSR GFY
(t/ha)
DM
(t/ha)
Beginning of flowering 85.7b 0.98a 19.6b 3.1b 129.7b 0.89a 37.1 6.0b
Full flowering 87.9b 0.95a 21.5ab 3.8b 140.5ab 0.77a 39.7 8.6ab
Seed filling 117.9a 0.73b 28.1a 7.2a 160.8a 0.46b 35.8 10.4a
Mena 97.2 0.88 23.1 4.7 143.7 0.71 37.5 8.3
CV (%) 31 23.5 50.8 56.7 24.8 41.9 38.7 45.5
lsd(0.05) 20.2 0.14 7.9 1.8 23.8 0.19 9.7 2.5
Sinana on station 116.3a 0.82 24.2 4.9 169.1a 0.56b 41.3 8.3
Agarfa sub site 78.0b 0.94 22 4.5 118.2b 0.86a 33.7 8.3
LSD (0.05) 16.5 0.11 6.4 1.5 19.5 0.16 7.9 2.1
Key: CV=coefficient of variation, DM=dry matter, GFY=green forage yield, lsd=least
significant difference, LSR=leaf to stem ratio, PH=plant height
Agronomic and yield performances of vetch varieties during Gena (Belg) season are
presented in Table 2. Despite the higher performances of the agronomic parameters during
Bona (meher) season, the trends of their changes with harvesting stages were alike. Plant
height at seed filling stage increased by 67% and 66%, respectively for Gebisa and Lalisa than
beginning of flowering stage and on the contrary, leaf to stem ratio decreased as harvesting
delayed. Green forage and dry matter yield obtained at seed filling stage was significantly
greater (P<0.05) than beginning of flowering stage for both varieties. There were no
significant (P>0.05) difference observed for all agronomic parameters considered across
location.
Table 2: The agronomic and yield performances of vetch varieties during Gena (Belg) season Harvesting stages Gebisa Lalisa
PH (cm) LSR GFY (t/ha) DM (t/ha) PH (cm) LSR GFY t/ha) DM(t/ha)
Beginning of flowering 42.4c 1.0a 6.0b 0.99b 60.1b 1.12a 7.2b 1.5b
Full flowering 55.8b 0.9a 7.1ab 1.4b 75.4b 1.01a 11.6ab 2.4ab
Seed filling 70.9a 0.64b 9.7a 2.7a 99.9a 0.55b 17.7a 3.3a
Mena 56.4 0.85 7.6 1.7 78.5 0.89 12.2 2.4

122
122
Proceeding of Adaptation and Generation of Agricultural Technologies IQQO AGP-II
CV (%) 34.3 30.5 55.3 64 32.5 34.3 83.8 58.5
LSD (0.05) 12.9 0.17 2.8 0.73 17.1 0.21 6.8 0.93
Sinana on station 55.3 0.87 7.6 1.7 78.1 0.87 9.8 2.3
Agarfa sub site 57.4 0.83 7.6 1.7 78.8 0.93 14.6 2.5
LSD (0.05) 10.6 0.14 2.3 0.59 13.9 0.17 5.6 0.76
Key: CV=coefficient of variation, DM=dry matter, GFY=green forage yield, lsd=least
significant difference, LSR=leaf to stem ratio, PH=plant height
Early cutting had significantly higher (p<0.05) mineral and crude protein content compared to
late cutting as presented on Table 3. Ash and crude protein percentage obtained from cut at
the beginning of flowering stage is significantly (P<0.05) higher than seed filling harvest for
both varieties. This agrees with the result of C.H. Jagadeesh et al, (2016) done on hybrid
Napier grass (Penniserum purpureum). This is due to the facts of leaf material generally has
higher ash content than stem material (Monti et al., 2008) and decreasing of life to stem ratio
as the plant maturity stage advances. Decline in total ash content is also related to earlier
dilution and translocation of minerals from vegetative portion of the plant to roots at late stage
of maturity Maynard et al. (1981). In addition, Study by Gezahagn et al., (2014) and Kitaba et
al., (2007) also indicated that Crud protein content is positively correlated with ash content.
The Percentage of fiber contents (neutral detergent fiber, acid detergent fiber and acid
detergent lignin) did not significantly increased as harvesting delayed and was maximum at
fully flowering stage for Gebisa varieties and there is slight decrease in some of these
parameters at seed filling stage. This is due to the grain, being very low in fiber, dilutes the
increasing fiber of the stem, resulting in little decrease in total plant fiber as the plant matures
(seed filling stage). True in vitro organic matter digestibility (TIVOMD) and metabolizable
energy (ME) content decreased as harvesting stage delayed. TIVOMD percentage for both
varieties and metabolizable energy for Gebisa variety had higher (P<0.05) for early cut
(beginning of flowering) compared to late cut (seed filling stage). Generally quality
parameters decreased as stage of forage harvest advanced.
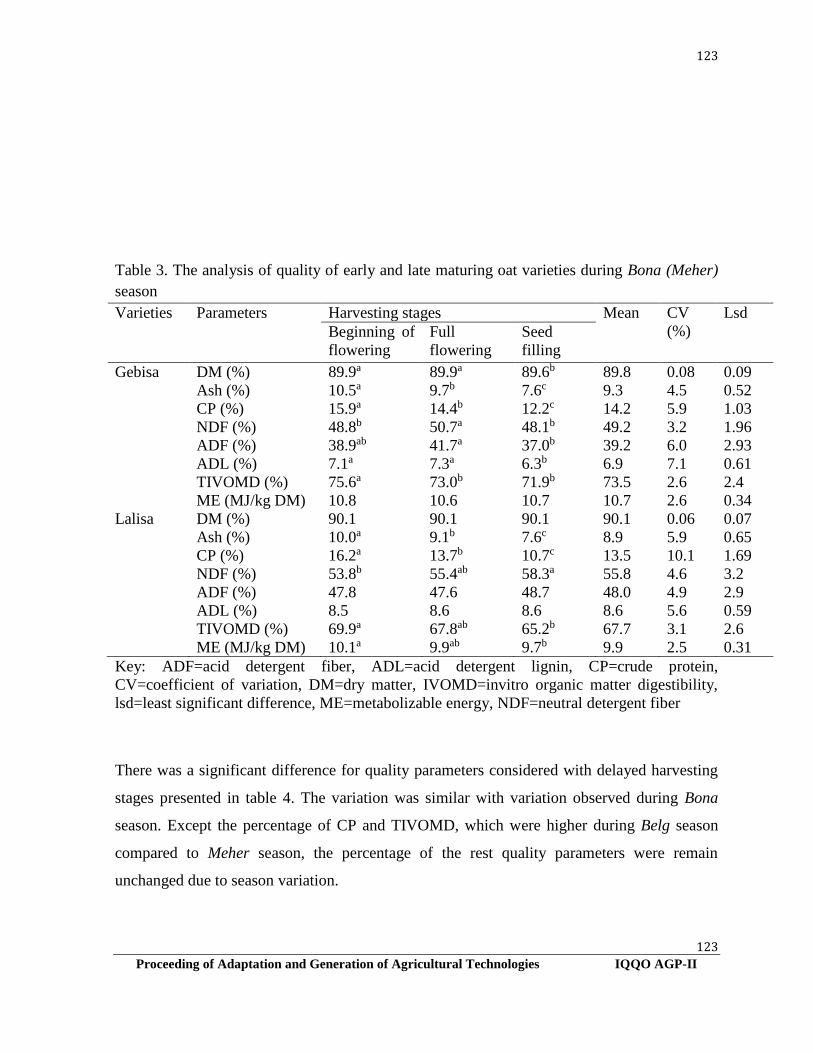
123
123
Proceeding of Adaptation and Generation of Agricultural Technologies IQQO AGP-II
Table 3. The analysis of quality of early and late maturing oat varieties during Bona (Meher)
season
Varieties Parameters Harvesting stages Mean CV
(%)
Lsd
Beginning of
flowering
Full
flowering
Seed
filling
Gebisa DM (%) 89.9a 89.9a 89.6b 89.8 0.08 0.09
Ash (%) 10.5a 9.7b 7.6c 9.3 4.5 0.52
CP (%) 15.9a 14.4b 12.2c 14.2 5.9 1.03
NDF (%) 48.8b 50.7a 48.1b 49.2 3.2 1.96
ADF (%) 38.9ab 41.7a 37.0b 39.2 6.0 2.93
ADL (%) 7.1a 7.3a 6.3b 6.9 7.1 0.61
TIVOMD (%) 75.6a 73.0b 71.9b 73.5 2.6 2.4
ME (MJ/kg DM) 10.8 10.6 10.7 10.7 2.6 0.34
Lalisa DM (%) 90.1 90.1 90.1 90.1 0.06 0.07
Ash (%) 10.0a 9.1b 7.6c 8.9 5.9 0.65
CP (%) 16.2a 13.7b 10.7c 13.5 10.1 1.69
NDF (%) 53.8b 55.4ab 58.3a 55.8 4.6 3.2
ADF (%) 47.8 47.6 48.7 48.0 4.9 2.9
ADL (%) 8.5 8.6 8.6 8.6 5.6 0.59
TIVOMD (%) 69.9a 67.8ab 65.2b 67.7 3.1 2.6
ME (MJ/kg DM) 10.1a 9.9ab 9.7b 9.9 2.5 0.31
Key: ADF=acid detergent fiber, ADL=acid detergent lignin, CP=crude protein,
CV=coefficient of variation, DM=dry matter, IVOMD=invitro organic matter digestibility,
lsd=least significant difference, ME=metabolizable energy, NDF=neutral detergent fiber
There was a significant difference for quality parameters considered with delayed harvesting
stages presented in table 4. The variation was similar with variation observed during Bona
season. Except the percentage of CP and TIVOMD, which were higher during Belg season
compared to Meher season, the percentage of the rest quality parameters were remain
unchanged due to season variation.

124
124
Proceeding of Adaptation and Generation of Agricultural Technologies IQQO AGP-II
Table 4. Analysis of quality of early and late maturing oat varieties during Gena (Belg) season
Varieties Parameters Harvesting stages Mean CV
(%)
lsd
Beginning of
flowering
Full
flowering
Seed
filling
Gebisa DM (%) 89.9a 89.8b 89.7b 89.8 0.07 0.08
Ash (%) 11.8a 11.3a 9.1b 10.7 9.6 1.29
CP (%) 15.8a 14.3b 13.7b 14.6 7.8 1.4
NDF (%) 48.6ab 47.5b 49.7a 48.6 3.3 1.9
ADF (%) 38.1 37.2 37.4 37.5 5.9 2.8
ADL (%) 6.7ab 6.5b 7.1a 6.8 7.1 0.59
TIVOMD (%) 78.6a 76.6b 73.6c 76.3 1.9 1.78
ME (MJ/kg DM) 11.0a 10.8ab 10.7b 10.8 1.8 0.24
Lalisa DM (%) 90.0a 90.0a 89.9b 89.9 0.04 0.05
Ash (%) 11.4a 10.9ab 10.8b 11.0 3.1 0.42
CP (%) 17.3a 15.9b 15.4b 16.2 2.8 0.55
NDF (%) 47.9b 50.0a 49.2ab 49 3.0 1.8
ADF (%) 39.3b 42.0a 40.3ab 40.5 4.2 2.1
ADL (%) 7.3 7.6 7.4 7.4 4.7 0.43
TIVOMD (%) 74.7a 72.1b 70.8b 72.5 2.2 1.95
ME (MJ/kg DM) 10.6a 10.3b 10.1b 10.3 1.8 0.24
Key: ADF=acid detergent fiber, ADL=acid detergent lignin, CP=crude protein,
CV=coefficient of variation, DM=dry matter, IVOMD=invitro organic matter digestibility,
lsd=least significant difference, ME=metabolizable energy, NDF=neutral detergent fiber
Conclusion and recommendations
125
125
Proceeding of Adaptation and Generation of Agricultural Technologies IQQO AGP-II
Dry matter yield harvested at seed filling stage had greater by 132% and 73%, respectively for
Gebisa and Lalisa than harvested at beginning of flowering stage. This showed that the
highest DM yield was obtained at late harvest stage but early immature harvest is a loss of
huge dry matter yield. Leaf to stem ratio which is the highest indicator of quality, harvested at
the beginning of flowering stage is significantly higher (P<0.05) than that obtained at seed
filling stage uniformly for both varieties. One of the important quality parameter CP percent
was also indicated decreasing pattern as the plant age advances. The intermediate point
negotiating Biomass yield and quality hay is harvesting at flowering stage to obtain better leaf
to shoot raition (LSR) and crude protein (CP) of 13.7% and 14.4% during Bona and 15.9%
and 14.3% during Gena for Lalisa and Gabisa, respectively. Ganna season is not appropriate
for seed production due to long rain damaging the seed quality. Therefore; the ideal
harvesting time and season for both high quality and high biomass yield is harvesting at full
flowering stage during Bona season. Depending on biomass yield and quality data the
relatively better variety for fodder production is Lalisa.
References
Alemayehu Mengistu 1997. Conservation based forage development for Ethiopia. Institute
For Sustainable Development. Addis Ababa, Ethiopia. pp. 1-2, 57-60, 86-88.
Anuraga, M., Duarsa P., Hill M.J. and Lovett J.V. 1993. Soil moisture and temperature affect
condensed tannin concentration and growth in Lotus corniculatus and Lotus
pedunculatus. Australian Journal of Agricultural Research 44: 1667-1681.
AOAC (Association of Official Analytical Chemists). 1990. Official Methods of Analysis.
Fifteenth edition. AOAC Inc., Arlington, Virginia, USA. 1298pp.
Barahona, R., Lascano C.E., Cochran R., Morrill J. and Titgemeyer E.C. 1997. Intake,
digestion, and nitrogen utilization by sheep fed tropical legumes with contrasting tannin
concentration and astringency. Journal of Animal Science 75: 1633-1640.
Barry, T.N. and Forss D.A. 1983. The condensed tannin content of vegetative Lotus
pedunculatus, its regulation by fertilizer application and effects on protein solubility.
Journal of the Science of Food and Agriculture 34: 1047-1056.
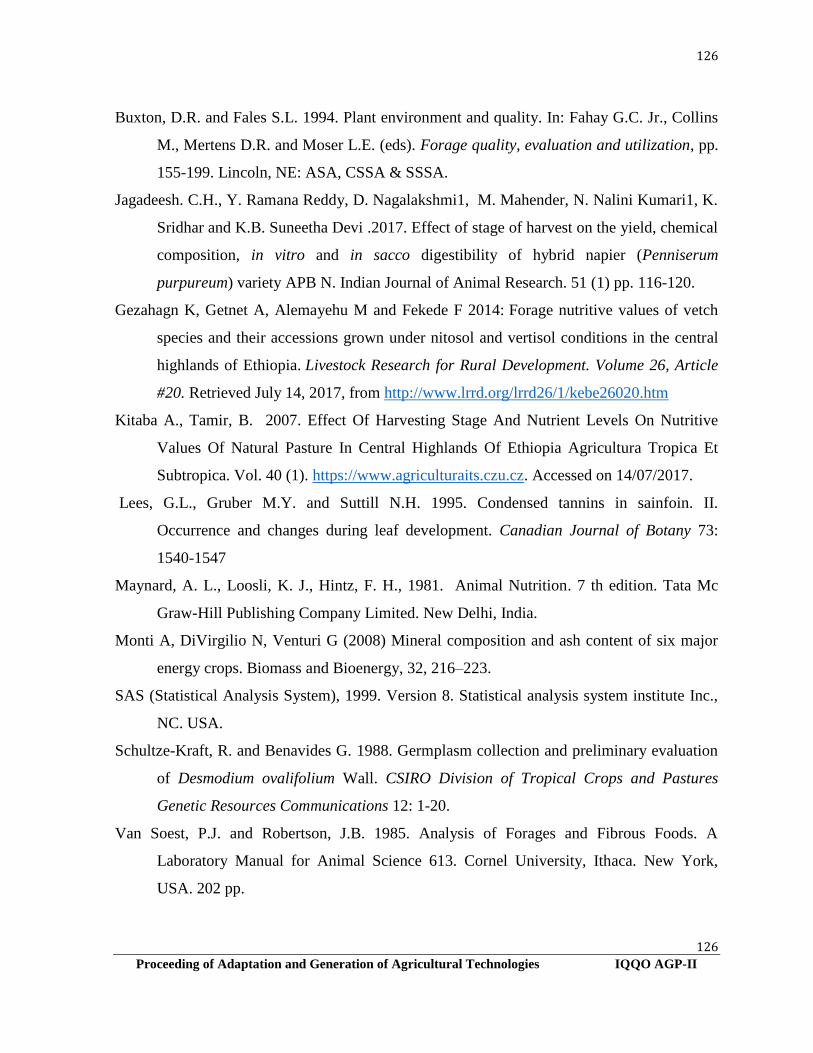
126
126
Proceeding of Adaptation and Generation of Agricultural Technologies IQQO AGP-II
Buxton, D.R. and Fales S.L. 1994. Plant environment and quality. In: Fahay G.C. Jr., Collins
M., Mertens D.R. and Moser L.E. (eds). Forage quality, evaluation and utilization, pp.
155-199. Lincoln, NE: ASA, CSSA & SSSA.
Jagadeesh. C.H., Y. Ramana Reddy, D. Nagalakshmi1, M. Mahender, N. Nalini Kumari1, K.
Sridhar and K.B. Suneetha Devi .2017. Effect of stage of harvest on the yield, chemical
composition, in vitro and in sacco digestibility of hybrid napier (Penniserum
purpureum) variety APB N. Indian Journal of Animal Research. 51 (1) pp. 116-120.
Gezahagn K, Getnet A, Alemayehu M and Fekede F 2014: Forage nutritive values of vetch
species and their accessions grown under nitosol and vertisol conditions in the central
highlands of Ethiopia. Livestock Research for Rural Development. Volume 26, Article
#20. Retrieved July 14, 2017, from http://www.lrrd.org/lrrd26/1/kebe26020.htm
Kitaba A., Tamir, B. 2007. Effect Of Harvesting Stage And Nutrient Levels On Nutritive
Values Of Natural Pasture In Central Highlands Of Ethiopia Agricultura Tropica Et
Subtropica. Vol. 40 (1). https://www.agriculturaits.czu.cz. Accessed on 14/07/2017.
Lees, G.L., Gruber M.Y. and Suttill N.H. 1995. Condensed tannins in sainfoin. II.
Occurrence and changes during leaf development. Canadian Journal of Botany 73:
1540-1547
Maynard, A. L., Loosli, K. J., Hintz, F. H., 1981. Animal Nutrition. 7 th edition. Tata Mc
Graw-Hill Publishing Company Limited. New Delhi, India.
Monti A, DiVirgilio N, Venturi G (2008) Mineral composition and ash content of six major
energy crops. Biomass and Bioenergy, 32, 216–223.
SAS (Statistical Analysis System), 1999. Version 8. Statistical analysis system institute Inc.,
NC. USA.
Schultze-Kraft, R. and Benavides G. 1988. Germplasm collection and preliminary evaluation
of Desmodium ovalifolium Wall. CSIRO Division of Tropical Crops and Pastures
Genetic Resources Communications 12: 1-20.
Van Soest, P.J. and Robertson, J.B. 1985. Analysis of Forages and Fibrous Foods. A
Laboratory Manual for Animal Science 613. Cornel University, Ithaca. New York,
USA. 202 pp.

127
127
Proceeding of Adaptation and Generation of Agricultural Technologies IQQO AGP-II
Van Soest, P.J., Robertson, J.B. and Lewis, B.A. 1991. Methods for dietary fiber, neutral
detergent fiber and non-starch polysaccharides in relation to animal nutrition. J.Dairy
Sci. 74: 3583-3597.
Zinash, S., Seyoum, B., Lulseged, G., Tadesse, T., 1995. Effect of harvesting stage on yield
and quality of natural pasture in the central highlands of Ethiopia. In: Proceedings of
third National Conference of the Ethiopian Society of Animal Production (ESAP), pp.
316 - 322. April 27 - 29, 1995, Addis Ababa, Ethiopia.
Evaluation of effective microbe treated barely straw supplemented with bypass protein
as intervention diet for cross breed dairy animal under small scale farmer’s condition
Girma Chalchissa* and Alemayehu Arega
Oromia Agricultural Research Institute, Adami Tulu Agricultural Research Center,
P.O. Box, 35, Zeway, Ethiopia
Corresponding author: [email protected]
Abstract
The study was conducted at on farm level with crossbred lactating dairy cows, maintained
under small scale mixed farming system at Kofele district, in West Arsi zone, Ethiopia to
assess the effect of feeding intervention diet (EM treated barley straw) supplemented with a
concentrate mixture (linseed cake 48%; wheat bran 50% and salt 2%). The study was
conducted to asses feed intake, milk yield and profitability during the dry season. A total of 26
households having one or two lactating cows per house hold were selected. Twenty six cows
in mid-to late lactation with an average body weight of 315.8±52.05 kg were selected and
balanced for their parity, stage of lactation, level of milk yield and divided into two groups
(13 cows per group). Thirteen cows were fed EM treated barley straw in addition to grazing
and supplemented with a concentrate mixture at 0.5 kg /kg of milk yield/cow/day (T1), and the
other 13 cows of one group were maintained as usually practiced by farmers (control) (T2).
Feeding EM treated barley straw supplemented with linseed cake and wheat bran concentrate
mixture significantly (P<0.01) increased feed intake and milk yield of the cows. Due to the
improvement in daily milk yield by 2.31 kg (4.98 vs. 2.65 kg), the net profit increased from

128
128
Proceeding of Adaptation and Generation of Agricultural Technologies IQQO AGP-II
ETB 39.24/cow/day in the control group to ETB 49.05/cow/day in T1 group. This study
indicated that the intervention diet increased the net profit for farmers to ETB 9.81/cow/day.
Feeding EM treated barley straw with bypass protein source was found to be an effective
approach to maximize the utilization of locally available feed resources for better animal
productivity during the dry season in mixed farming system of Ethiopia.
Key words: Effective Micro-organism, barley straw treatment, economic analysis, milk yield
Introduction
Crop and livestock production are commonly integrated in the mixed farming system of the
mid and high lands of Ethiopia. In such systems the land is dominantly utilized by
smallholder farmers for production of cereal and pulse crops and grazing land for livestock
through rain fed agriculture. As more and more land is put under crop production, livestock
feed becomes scarce and crop residues particularly cereal straws remain the major feed source
for the animals particularly during the dry period of the year (Solomon, 2004). Crop residues
such as cereal straws are low quality feeds which forms the basal feed in most parts of
Ethiopia. They are deficient in nitrogen, energy, vitamins and minerals, of which fermentable
nitrogen is usually the first limiting (Girma et al. 2014, Zewudie, 2010). The nutrient
deficiencies affect microbial growth, microbial protein synthesis and overall fermentation in
the rumen that further result in low voluntary intake and fiber fermentation and digestibility.
Barley straw is one of the major crop residues available in most cereal producing mixed
farming systems. However, it contain high fiber and hence has low degradability in the
rumen (530g/kg) (Zewudie, 2010). Therefore, the nutrient derived by feeding of barely straw
hardly supports the maintenance requirement and leading to low production and productivity
of dairy animals. There are various options reported to alleviate these constraints such as
supplementation, chemical treatment, biological treatment and manipulation of the rumen
ecosystem. Recently the treatment of crop residue with effective microbes (EM) is becomes
one of the biological methods of improving feed quality. The treatment of crop residues with

129
129
Proceeding of Adaptation and Generation of Agricultural Technologies IQQO AGP-II
EM and supplementation with escape protein resulted in remarkable results in improving
intake, digestibility and performances of animals.
Effective Microbes (EM) treated hay led to increased feed efficiency in stationed lactating
dairy cows under Ethiopian condition (Mulugeta, 2015). Although such information was
generated on research station, the efficacy of EM, particularly when used as under small
scale farmers condition and treating or ensiling crop residues has not been well
evaluated. Therefore, this study was aimed to evaluate the effect of EM-treated barely straw
supplemented with bypass protein feed on feed intake and milk yield and economic benefit
under on farm condition of small scale crossbreed dairy producers.
Materials and methods
Description of the study area
The study was carried out on-farm at West Arsi zone Kofele district, Wamigne Abosa Kebele
which located 285 km to the South East of Addis Ababa along the main road from
Shashamane to Bale Robe at 7o 7’ N latitude and 38o 30’ E longitudes. It has an altitude of
2670 meters above sea level (m.a.s.l). The area is a typical mixed crop livestock production
system, where small scale dairying based on crossbred animals are found here and there.
Cattle are dominant livestock species in the area while wheat, barley, potato, cabbage and
Inset are the major crops produced.
Experimental Animal, Design and Treatments
The experiment was conducted on mid to late lactating dairy animals of interested sixteen
farmers in the study area. Totally twenty six lactating cross breed dairy animals with average
body weight of 315.8±52.05 kg and an average milk yield of 2.67±0.41 kg/cow/day were
categorized equally in to two treatments to participate in the experiment.
The experimental cows were divided into two treatment groups (thirteen cows in each group).
Cows of the first group (T1 ) graze for 8 hours and supplanted with intervention diet (EM2
treated barley straw supplemented with a concentrate mixture composed of 48% linseed cake,

130
130
Proceeding of Adaptation and Generation of Agricultural Technologies IQQO AGP-II
50% wheat bran and 2% salt). Cows in the second group (T2, control) graze for eight hours
and they feed on untreated barley straw with wheat bran as supplements which is common
practices in the study area. During allocation of animals into experimental treatments the level
of milk yield, stage of lactation, body condition and parity were also considered. All the cows
were weighed and drenched with broad-spectrum anti-helminthes (Albendazole 2500mg)
prior to the start of the experiment.
Preparation of EM2 treated Barley straw
To prepare EM2 solution for ensiling barley straw; 1liter of EM1 (stock solution) was mixed
with 1liter of molasses and 18 liters of chlorine free water. The solution was then stored in an
air tight plastic container of capacity 20 litter for 12 days. After 12 days the activated EM2
solution was thoroughly mixed with chopped barely straw (in the ratio of 1liter EM2:1kg
straw) and compacted in an airtight plastic bag of capacity 20 kg. The mix was allowed to
ferment for 10 hours before fed to the animals. Stock EM solution (EM1) to be used for this
study was purchased from the recognized distributer (Woljejii PLC, Debrie-Zeit, Ethiopia).
The supplement in the intervention diet was fed at the level required to fulfill nutrient
requirement of the cows based on NRC (1989). The amount of supplement fed to each cow in
T1 during the adaptation period of two weeks was at the rate of 0.5 kg per kg of milk
production/day and 4kg of EM2 mixed barley straw early in the morning before grazing and
2kg in the afternoon. Hence, adjustment of the concentrate supplement and mixed straw was
made weekly based on the milk yield of each cow and voluntary intake at the rate of 0.5kg per
kg of milk production/day. It was fed in the morning and evening milking times, by dividing
the daily allowances into two equal parts.
Data collection, monitoring of experimental animals

131
131
Proceeding of Adaptation and Generation of Agricultural Technologies IQQO AGP-II
The data was recorded over a period of 105 days including an adaptation period of two weeks.
Field visits were carried out every two weeks to monitor the feed intake and milk yield of the
animals. The body weights of cows were measured each fifteen days by using heart girth
measurement. Adjustment of roughage offered was made weekly based on the amount of
refusal weighed and recorded every morning. All the cows were hand milked twice a day, in
the morning and in the evening. Milk yield was measured daily and recorded right at milking.
The animals had free access to water throughout the experimental period. The enumerators
daily recorded the intake of roughage and concentrate and milk yield on pre-designed data
recording sheet. These sheets were checked at each visit for precision and regularity.
Statistical and economic analysis
General Linear Model (GLM) procedure of SAS (2004) was used for analyzing data collected
during monitoring. Mean comparison was done using the Least Significant Difference (LSD)
for parameters with significant difference. Differences were considered statistically
significant at 5% level of significant. Data generated form monitoring study was analyzed
using the following model:
Yij = μ+ ri + eij
Yij is the dependent variable (feed intake, milk yield, body weight gain),
µ overall mean, ri effect of diet
Xij the record of live weight/milk yield of the jth cow on the ith diet,
eij random variation.
The economic analysis was based on calculations of the total cost of production and the
income from milk sales. The price of feeds and the price of milk were obtained from the
market price prevail in the area during experimental period. The net profit/cow/day was
calculated for the whole experimental period by reducing the cost of production from income
generated from milk sales.

132
132
Proceeding of Adaptation and Generation of Agricultural Technologies IQQO AGP-II
Results and discussion
Socio-economic characteristics of participating farmers
The average family size of the selected farmers was 8.42 members per household out of
which 48.2% were male and 51.8% were female members. Among the participant farmers,
92.3% were male headed households while 7.7% were female headed households.
The size of land holding of the participant farmers ranged from 10 ha to 14 ha. The average
land holding 12.58ha out of which 62% is allocated for grazing and the rest 38% was used for
crop production.
Available Feeds and feeding systems of milking dairy animals
In this study three major feed types used by dairy producers were identified: natural grazing,
crop residue (barley straw and wheat straw) and agro-industrial by product (wheat bran). Two
types of feeding systems (Extensive and semi-intensive) were used by dairy producers in the
area.
Chemical composition and in-vitro organic matter digestibility (IVOMD) of feeds
The chemical composition and in-vitro organic matter digestibility (IVOMD) of feeds offered
to experimental animals is presented in Table 1. The basal diet (natural pasture and untreated
barley straw) available for feeding during the dry season was low quality and do not meet
production requirement of animals (Table 1).
Table 1: Chemical composition, in-vitro organic matter digestibility and estimated
metabolizable energy of feeds (Mean ± standard deviation)
Variables Untreated
barley straw
Treated
barley straw
Wheat bran Linseed cake
Dry matter % 93.4 90.09 90.06 93.23
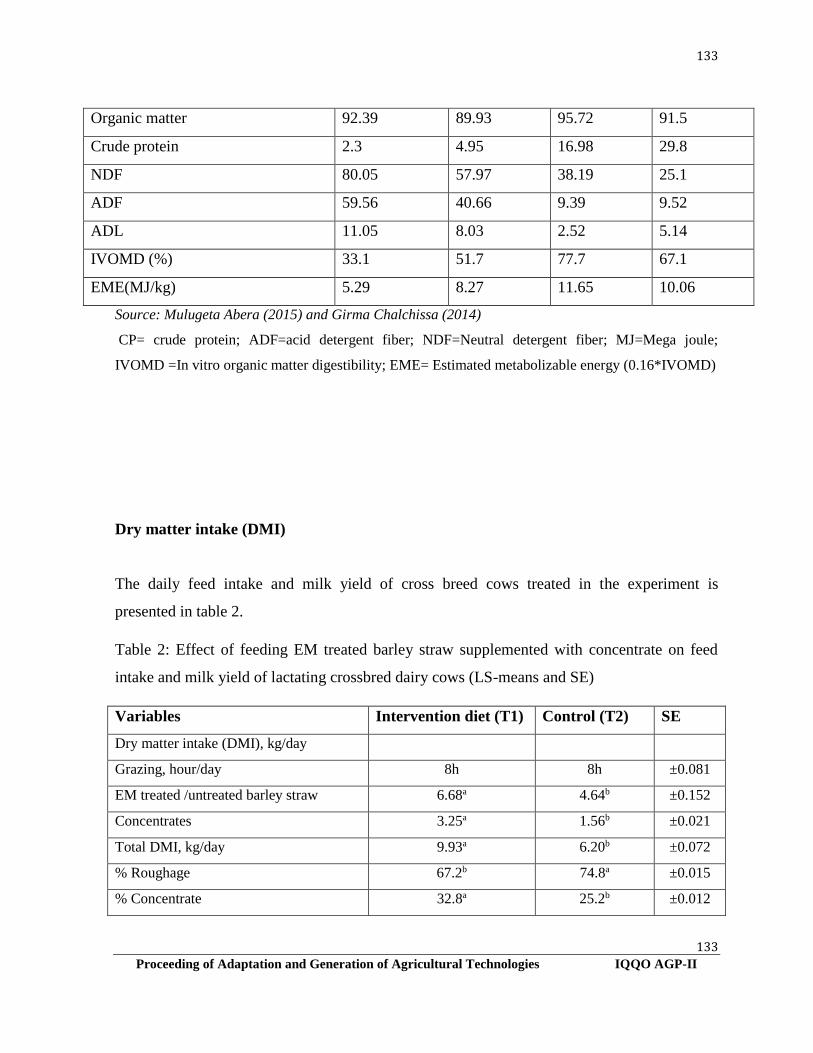
133
133
Proceeding of Adaptation and Generation of Agricultural Technologies IQQO AGP-II
Organic matter 92.39 89.93 95.72 91.5
Crude protein 2.3 4.95 16.98 29.8
NDF 80.05 57.97 38.19 25.1
ADF 59.56 40.66 9.39 9.52
ADL 11.05 8.03 2.52 5.14
IVOMD (%) 33.1 51.7 77.7 67.1
EME(MJ/kg) 5.29 8.27 11.65 10.06
Source: Mulugeta Abera (2015) and Girma Chalchissa (2014)
CP= crude protein; ADF=acid detergent fiber; NDF=Neutral detergent fiber; MJ=Mega joule;
IVOMD =In vitro organic matter digestibility; EME= Estimated metabolizable energy (0.16*IVOMD)
Dry matter intake (DMI)
The daily feed intake and milk yield of cross breed cows treated in the experiment is
presented in table 2.
Table 2: Effect of feeding EM treated barley straw supplemented with concentrate on feed
intake and milk yield of lactating crossbred dairy cows (LS-means and SE)
Variables Intervention diet (T1) Control (T2) SE
Dry matter intake (DMI), kg/day
Grazing, hour/day 8h 8h ±0.081
EM treated /untreated barley straw 6.68a 4.64b ±0.152
Concentrates 3.25a 1.56b ±0.021
Total DMI, kg/day 9.93a 6.20b ±0.072
% Roughage 67.2b 74.8a ±0.015
% Concentrate 32.8a 25.2b ±0.012

134
134
Proceeding of Adaptation and Generation of Agricultural Technologies IQQO AGP-II
Average milk yield, kg/cow/day 4.98a 2.65b ±0.470
Increase in milk yield, kg/cow/day 2.31 -
a,b means in the same row for each parameter with different superscripts are significantly different (P<0.05); LS-
means: Least square means; SE: Standard error
*The dry matter intake through grazing was not considered
Significant (P<0.01) improvement in DMI was observed due to feeding of the intervention
diet in lactating crossbred cows over farmers practice or control diet. This was in agreement
with the observation reported by Adebabay (2009) in treated rice fed indigenous breed cows,
which may be due to improved palatability.
Milk yield
There was no variation between the two treatments in initial average milk but treating barely
straw with bypass protein supplementation improved the performance of cross breed dairy
animals. Feeding of intervention diet resulted in a significant (P<0.01) increased in daily milk
yield by 2.31 kg (4.98 vs. 2.67 kg). Similar results also reported Dejene et al. (2009) indicated
that cows in urea treated teff straw supplemented diet had significantly higher milk yield than
for un-supplemented animals. This is due to the bypass protein through linseed cake
supplementation in addition to increased palatability, N content, digestibility, nutritive value
of the straw as a result of EM treatment. It has been accepted that intake and exploitation
efficiency of crop residues are influenced by the rate of rumen fermentation (Van Soest, 1982)
and the balance of nutrients absorbed in the intestines.
Economic analysis
The cost of grazing for the control groups was not considered while the total cost of
production (feeds, EM, labor for treating straw and material including plastic sheet used for
sealing the treated straw) was considered since other variable cost (medicaments) was the
same for both groups. The net profit increased from ETB 39.24/cow/day in the control group
(T2) to ETB 49.05/cow/day in T1 group due to the improvement in milk yield. Hence, this

135
135
Proceeding of Adaptation and Generation of Agricultural Technologies IQQO AGP-II
study demonstrated that feeding the intervention diet to crossbred dairy cows increased the net
profit for farmers to ETB 9.81/cow/day over the farmers’ practice (Table 3).
Costs of barley straw and grazing cost were not considered because farmers produce barley
straw and uses their own grazing lands. Participants observed that besides increase in milk
production, most of the cows in intervention diet showed symptoms of heat at the proper time
in contrast to the cows in T2. Considering the positive long-term impact of the intervention
diet on production, reproduction, body condition and general health of the animals, the
economic returns may be higher by using the intervention diet. Furthermore, considering the
cost of production and the market price of milk prevailed in the area during experimental
period, the intervention diet was found to be economical compared to farmers practice.
Table 3: Economic evaluation of feeding EM treated barley straw supplemented with
concentrates in lactating crossbred dairy cows
Variables Intervention diet
(T1)
Untreated diet (T2)
Cost of untreated straw, Ethiopian birr (ETB) 0 0
Cost of straw treatment
Cost of molasses 103.85 0
Cost of EM 576 0
Cost of plastic 54 0
Cost of labor 315 0
Cost of grazing 0 0
Cost of supplement (linseed cake & wheat bran), ETB# 2166.45 0
Total Variable cost, ETB 3215.3 819
Cost /cow/day 30.62 7.8
Cost /cow/kg of milk 6.14 2.94
Gross income from sale of milk, ETB" 8366.4 4939.2
Net profit, ETB 5151.1 4120.2

136
136
Proceeding of Adaptation and Generation of Agricultural Technologies IQQO AGP-II
Net profit/cow/day, ETB 49.05 39.24
Net profit over control, ETB 9.81
Remark: cost of concentrate: 8 ETB/kg of linseed cake, 5 ETB/kg of wheat bran, 1.50 ETB/kg of molasses, 3
ETB/kg of salt, labor cost (man day) was 35 ETB while cost of plastic sheet per meter was 18 ETB, Selling price
of milk was 16 ETB/kg of milk, $1 USD~ 24 ETB
Conclusion
Substantial increase in milk production per animal per day and net benefit derived from the
increased milk produced indicated that the use intervention diet is a sound technology for
cross breed dairy animals under small scale farmer’s condition. Thus it is possible to
substantially improve the productivity of crossbred dairy cows in similar production systems
by feeding EM2 treated cereal straw and supplementing with bypass protein. However, the
extent of improvement might need further investigation. The effect of EM on digestibility of
OM or fermentation of fiber should be investigated further. Finally, promotion of effective
infrastructure for technology transfer, further refinement of EM treatment technique and
ensuring either on-farm or nearby availability of supplies necessary for straw treatment are
important elements for ensuring impact of the technology.
References
Adebabay K., 2009: Characterization of Milk Production Systems, Marketing and On- Farm
Evaluation of the Effect of Feed Supplementation on Milk Yield and Milk
Composition of Cows at Bure District, Ethiopia. MSc. Thesis, Bahir Dar University,
Ethiopia. 64p.
Aemiro K., Getu K., Getinet A., Dereje F. and Zewdie W. 2012. Growth performance of
Boran Friesian (F1) crossbred calves supplemented with Effective Micro-organism
(EM) fermented wheat bran. Promoting Effective Micro-organisms Technology.
Proceedings of National Workshop on Effective Microorganisms in Ethiopia, 20
March 2012, Addis Ababa, Ethiopia.

137
137
Proceeding of Adaptation and Generation of Agricultural Technologies IQQO AGP-II
Dejene M, Bediye S, Kehaliw A, Kitaw G and Nesha K 2009: On-farm evaluation of lactating
crossbred (Bos taurus x Bos indicus) dairy cows fed a basal diet of urea treated teff
(Eragrostis tef) straw supplemented with escape protein source during the dry season
in crop- livestock production system of north Shoa, Ethiopia. Livestock Research for
Rural Development. Volume 21, Article #61. Retrieved May 23, 2017, from
http://www.lrrd.org/lrrd21/5/deje21061.htm.
Girma C., Yoseph M. and Mengistu U. (2014). Feed Resources Quality and Feeding Practices
In Urban and Peri-Urban Dairy Production of Southern Ethiopia. Tropical and
Subtropical Agroecosystems, Volume 17: page 539 – 546, Year 2014.
Kehaliew A., Getu K., Getnet A., Dereje F. & Zewdie W. 2014. Growth Performance of F1
Friesian X Boran Crossbred Dairy Calves Supplemented with Effective Micro-
Organism (EM) Fermented Wheat Bran (Bokashi) in the Central Highlands of
Ethiopia. Global Journal of Science Frontier Research: D Agriculture and Veterinary,
Volume 14 Issue 9 Version 1.0 Year 2014.
Mulugeta A., 2015. Evaluation of effective microbes (EM) treatment on chemical
composition of crop residues and performance of crossbred dairy cows). MSc. Thesis,
Haramaya University, Dire Dawa, Ethiopia. 23p.
National Research Council, 1989. Nutrient Requirement of Dairy Cattle. 6th ed., National
Academy Press, Washington, D.C. 157pp.
SAS, 2004. Statistical Analysis System software, Version 9.0, SAS Institute, Inc., Cary, NC
USA.
Solomon Bogale, 2004. Assessment of Livestock Production Systems Feed Resource base in
Sinana Dinsho district of Bale highlands, Southeast Oromia, An MSc. Thesis,
Alemaya University, Dire Dawa, Ethiopia.
Van Soest, P. J., 1982. Nutritional Ecology of the Ruminants: Ruminant metabolism,
Nutritional strategies, the cellulolytic Fermentation and the Chemistry of Forages and
Plant Fibers. Ithaca, New York. 373p.
Zewdie, W. 2010. Livestock Production Systems in Relation with Feed Availability in the
Highlands and Central Rift Valley of Ethiopia. MSc. Thesis, Haramaya University,
Dire Dawa, Ethiopia. 160p.

138
138
Proceeding of Adaptation and Generation of Agricultural Technologies IQQO AGP-II

139
139
Proceeding of Adaptation and Generation of Agricultural Technologies IQQO AGP-II
AGRICULTURAL ENGINEERING
On farm evaluation and verification of tef grain and chaff separator machine
Abayineh Awgichew
Oromia agricultural research institute, Asella Agricultural Engineering research center,
Ethiopia
Email: [email protected] Tel +251-0910387021
Abstract
Tef grain separating and cleaning activities are predominantly traditional methods that
depend on naturally blowing air and threshed grain thrown using flat materials such as
shovel. This method is time and labor consuming, and often lead to contamination of the
grain with foreign materials such as dust and silt. To this end, small engine driven tef grain
and chaff separator and cleaning machine was designed and manufactured to alleviate the
problems. The performance of the machine was evaluated interms of separation efficiency and
separation losses at different feed rate, sieves oscillations and sieves inclinations. The test
result showed that maximum separation efficiency and minimum separation loss of the
machine as 97.94, 0.71, respectively, with the output capacity of 8-10 quintals per hour.
Key words: efficiencies, feed rate, losses, Sieve oscillation, sieve slope, Tef separation
Introduction
Tef [Eragrostis tef (Zucc.) Trotter] is a cereal crop extensively cultivated in Ethiopia as a
major staple crop. It is one of the economical cereal crops in Ethiopia (Bekabil et al., 2011).
However, as most of its production systems are traditional process, the teff grain losses
occurred during grain is separated from chaff, winnowed and further cleaning. Research
result in this field showed that utilizing agricultural mechanization technology can reduce
post-harvests losses of teff by up to 30% (NAMS, 2014). So, to reduce this loss Asalla
Agricultural Engineering Research Center (AAERC) and Sasakawa Global Africa 2000
(SGA2000) were developed tef thresher. Despite having a fan, the developed thresher had
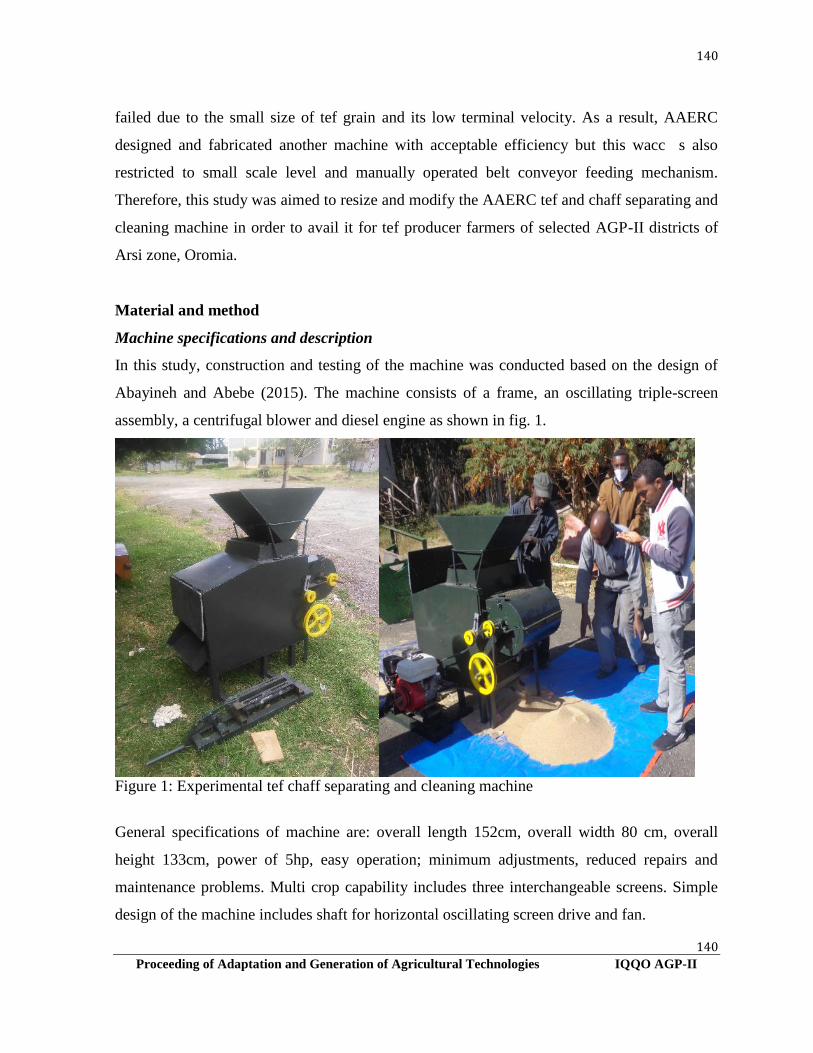
140
140
Proceeding of Adaptation and Generation of Agricultural Technologies IQQO AGP-II
failed due to the small size of tef grain and its low terminal velocity. As a result, AAERC
designed and fabricated another machine with acceptable efficiency but this wacc s also
restricted to small scale level and manually operated belt conveyor feeding mechanism.
Therefore, this study was aimed to resize and modify the AAERC tef and chaff separating and
cleaning machine in order to avail it for tef producer farmers of selected AGP-II districts of
Arsi zone, Oromia.
Material and method
Machine specifications and description
In this study, construction and testing of the machine was conducted based on the design of
Abayineh and Abebe (2015). The machine consists of a frame, an oscillating triple-screen
assembly, a centrifugal blower and diesel engine as shown in fig. 1.
Figure 1: Experimental tef chaff separating and cleaning machine
General specifications of machine are: overall length 152cm, overall width 80 cm, overall
height 133cm, power of 5hp, easy operation; minimum adjustments, reduced repairs and
maintenance problems. Multi crop capability includes three interchangeable screens. Simple
design of the machine includes shaft for horizontal oscillating screen drive and fan.
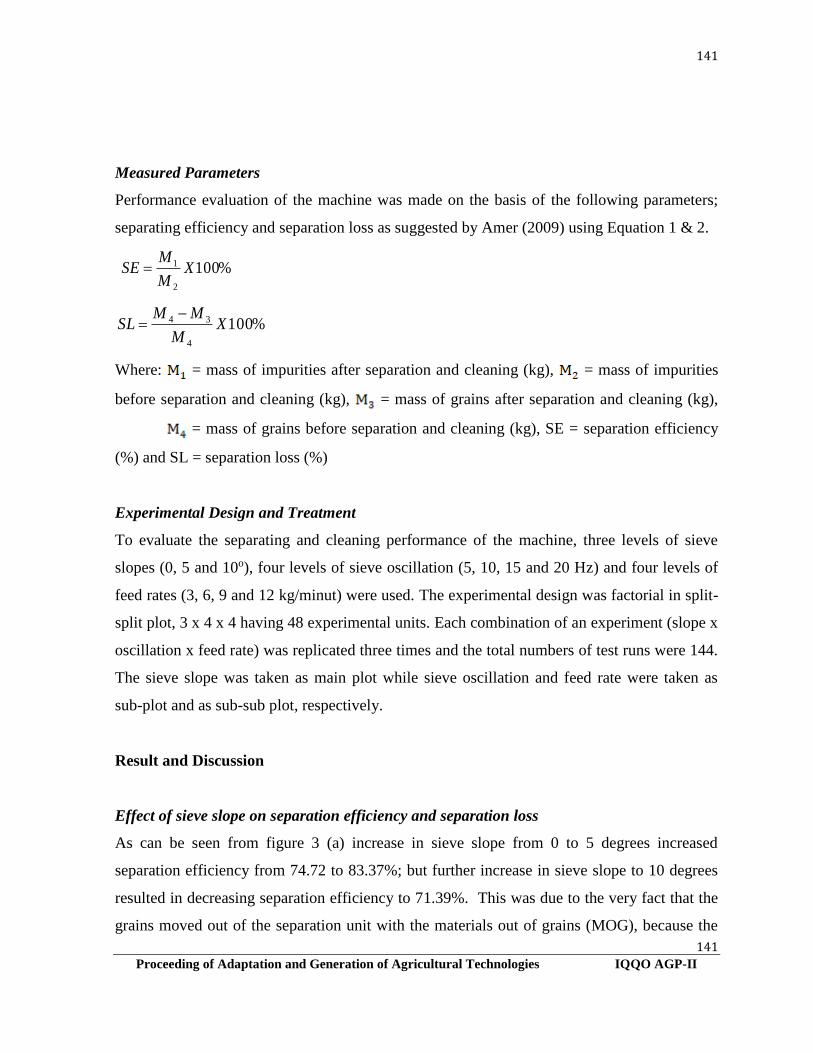
141
141
Proceeding of Adaptation and Generation of Agricultural Technologies IQQO AGP-II
Measured Parameters
Performance evaluation of the machine was made on the basis of the following parameters;
separating efficiency and separation loss as suggested by Amer (2009) using Equation 1 & 2.
%1002
1 XM
MSE
%1004
34 XM
MMSL
Where: = mass of impurities after separation and cleaning (kg), = mass of impurities
before separation and cleaning (kg), = mass of grains after separation and cleaning (kg),
= mass of grains before separation and cleaning (kg), SE = separation efficiency
(%) and SL = separation loss (%)
Experimental Design and Treatment
To evaluate the separating and cleaning performance of the machine, three levels of sieve
slopes (0, 5 and 10o), four levels of sieve oscillation (5, 10, 15 and 20 Hz) and four levels of
feed rates (3, 6, 9 and 12 kg/minut) were used. The experimental design was factorial in split-
split plot, 3 x 4 x 4 having 48 experimental units. Each combination of an experiment (slope x
oscillation x feed rate) was replicated three times and the total numbers of test runs were 144.
The sieve slope was taken as main plot while sieve oscillation and feed rate were taken as
sub-plot and as sub-sub plot, respectively.
Result and Discussion
Effect of sieve slope on separation efficiency and separation loss
As can be seen from figure 3 (a) increase in sieve slope from 0 to 5 degrees increased
separation efficiency from 74.72 to 83.37%; but further increase in sieve slope to 10 degrees
resulted in decreasing separation efficiency to 71.39%. This was due to the very fact that the
grains moved out of the separation unit with the materials out of grains (MOG), because the

142
142
Proceeding of Adaptation and Generation of Agricultural Technologies IQQO AGP-II
greater force (mgSinα) acting on the entire material, grain and chaff, down the slope and the
difference between gravity component and inertia component of forces (mgCosα <m2r) that
lead to sliding rather than tossing and flailing the grain and chaff Figure 2.
Figure 1: Forces acting on materials and their direction over the sieve surface (Fi = inertia
force and Ff =friction force)
Effect of sieve oscillation on separation efficiency and separation loss
Separation efficiency tended to decrease with increasing sieve oscillation while separation
loss increased with increasing sieve oscillation (Fig 3b). The increase in the separation loss
was from 4.93 to 22.64 % as sieve oscillation increased from 5 to 20 Hz. The decrease in
separation efficiency and increase of separation loss with increasing sieve oscillations may be
due to less resident time of materials to be separated on the sieve.
Effect of feed rate on separation efficiency and separation loss
Figure 3(c) indicates that separation efficiency decreased with increasing feed rate while the
separation loss increased with increasing feed rate. Increasing feeding rate from 6 to 12
kg/min decreased the separation efficiency from 72.69 to 55.98% while separation loss
increased from 10.6 to 20.66% and effect was highly significant at (P < 1%) (Table 1).
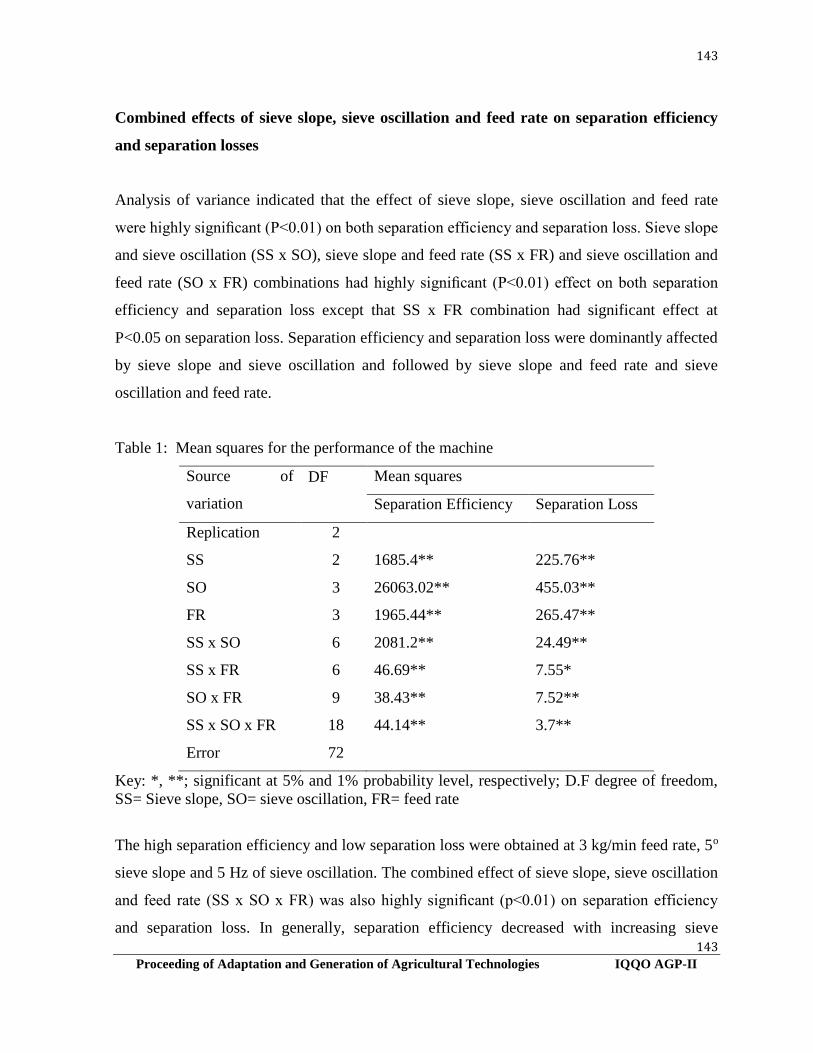
143
143
Proceeding of Adaptation and Generation of Agricultural Technologies IQQO AGP-II
Combined effects of sieve slope, sieve oscillation and feed rate on separation efficiency
and separation losses
Analysis of variance indicated that the effect of sieve slope, sieve oscillation and feed rate
were highly significant (P<0.01) on both separation efficiency and separation loss. Sieve slope
and sieve oscillation (SS x SO), sieve slope and feed rate (SS x FR) and sieve oscillation and
feed rate (SO x FR) combinations had highly significant (P<0.01) effect on both separation
efficiency and separation loss except that SS x FR combination had significant effect at
P<0.05 on separation loss. Separation efficiency and separation loss were dominantly affected
by sieve slope and sieve oscillation and followed by sieve slope and feed rate and sieve
oscillation and feed rate.
Table 1: Mean squares for the performance of the machine
Source of
variation
DF
Mean squares
Separation Efficiency Separation Loss
Replication 2
SS 2 1685.4** 225.76**
SO 3 26063.02** 455.03**
FR 3 1965.44** 265.47**
SS x SO 6 2081.2** 24.49**
SS x FR 6 46.69** 7.55*
SO x FR 9 38.43** 7.52**
SS x SO x FR 18 44.14** 3.7**
Error 72
Key: *, **; significant at 5% and 1% probability level, respectively; D.F degree of freedom,
SS= Sieve slope, SO= sieve oscillation, FR= feed rate
The high separation efficiency and low separation loss were obtained at 3 kg/min feed rate, 5o
sieve slope and 5 Hz of sieve oscillation. The combined effect of sieve slope, sieve oscillation
and feed rate (SS x SO x FR) was also highly significant (p<0.01) on separation efficiency
and separation loss. In generally, separation efficiency decreased with increasing sieve
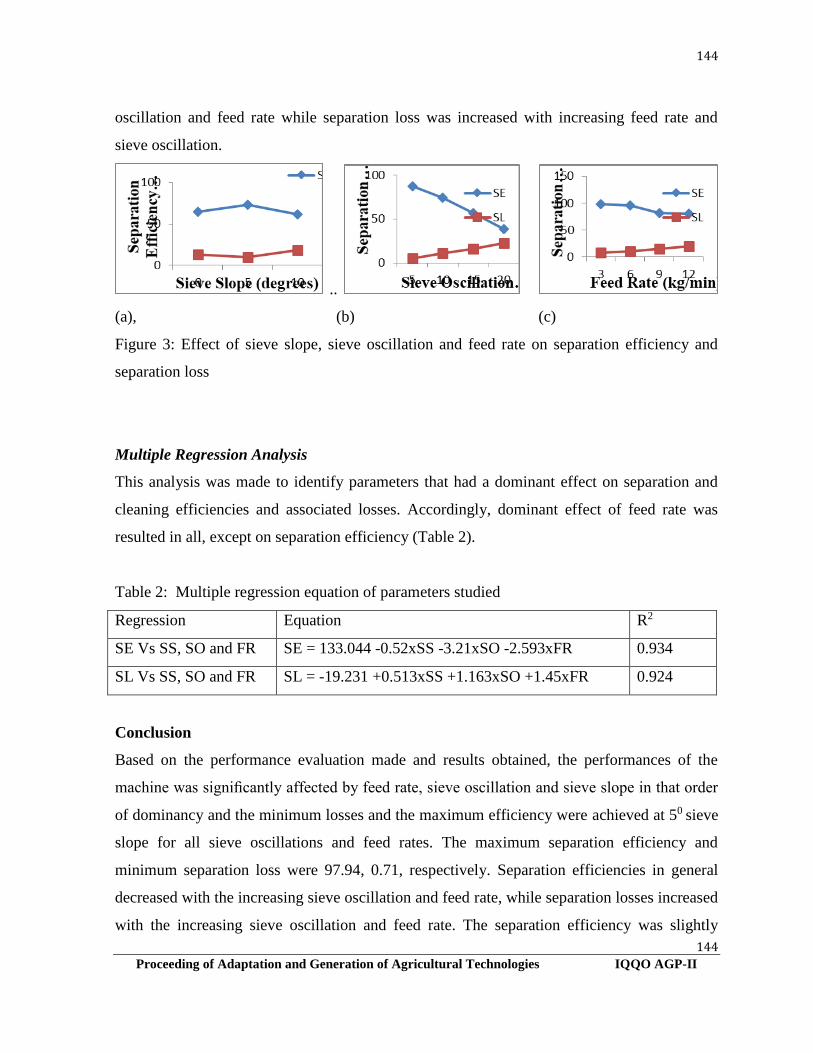
144
144
Proceeding of Adaptation and Generation of Agricultural Technologies IQQO AGP-II
oscillation and feed rate while separation loss was increased with increasing feed rate and
sieve oscillation.
..
(a), (b) (c)
Figure 3: Effect of sieve slope, sieve oscillation and feed rate on separation efficiency and
separation loss
Multiple Regression Analysis
This analysis was made to identify parameters that had a dominant effect on separation and
cleaning efficiencies and associated losses. Accordingly, dominant effect of feed rate was
resulted in all, except on separation efficiency (Table 2).
Table 2: Multiple regression equation of parameters studied
Regression Equation R2
SE Vs SS, SO and FR SE = 133.044 -0.52xSS -3.21xSO -2.593xFR 0.934
SL Vs SS, SO and FR SL = -19.231 +0.513xSS +1.163xSO +1.45xFR 0.924
Conclusion
Based on the performance evaluation made and results obtained, the performances of the
machine was significantly affected by feed rate, sieve oscillation and sieve slope in that order
of dominancy and the minimum losses and the maximum efficiency were achieved at 50 sieve
slope for all sieve oscillations and feed rates. The maximum separation efficiency and
minimum separation loss were 97.94, 0.71, respectively. Separation efficiencies in general
decreased with the increasing sieve oscillation and feed rate, while separation losses increased
with the increasing sieve oscillation and feed rate. The separation efficiency was slightly

145
145
Proceeding of Adaptation and Generation of Agricultural Technologies IQQO AGP-II
increase as sieve slope increase from 0 to 5 degrees but further increase of sieve slopes up to
10 degrees kept on reducing the efficiencies of separation. The separation losses were
decreased as sieve slope increased from 0 to 5 degrees and increased as sieve slope increased
to 10 degrees. In addition, the multiple regression analyses model developed can be used as
corner stones and spring boards to select optimum combination of the variable parameters to
further develop and/or improve seeds and grains separating and cleaning machine. The output
of the machine is estimated at 8-10 qt/ha, which depends on nature of input materials (mixture
of grain and straw/chaff).
Reference
Abayineh Awgichew and Abebe Fanta, 2015. Design and Construction of Tef Grain and
Chaff Separator and Cleaner. International Journal of Engineering Research.3 (6):
556-561. Articles Available Online Http://Www.Ijoer.In
Amer, E.A.H., 2009. Aerodynamic and Solid Flow Properties for Flaxgrains for Pneumatic
Separation by Using Air Stream. Journal of Agriculture & Biological Engineering,
2(4): 31- 45
Bekabil Fufa, Befekadu Behute, Rubert Simons and Tareke Berhe, 2011. Strengthening the
Tef Value Chain in Ethiopia. Ethiopian Agricultural Transformation Agency (EATA).
Addis Ababa, Ethiopia.
Ethiopian National agricultural mechanization strategy (NAMS) cooperating with ATA,
2014.Vision, Systemic Challenges and Strategic Interventions working document.
Addis Abeba , Ethiopia.

146
146
Proceeding of Adaptation and Generation of Agricultural Technologies IQQO AGP-II
Adaptation and Verification of Improved Row Crop Cultivator for Equine Animals
*Abulasan Kabaradin and Ashebir Tsegay
Oromia Agricultural Research Institute, Asella Agricultural Engineering Research
Center, Ethiopia
E-mail: *[email protected] and [email protected]
Abstract
Weeding is one of the critical stages in crop cultivation and affects quantity and quality of the
yield. In Arsi Zones of Oromia state, weeding is done tiresomely either manually uprooting or
using simple hand hoe. Thus, this activity was conducted to adapt and evaluate field
performance of row crop cultivator for Equine Animals and to compare with hand weeding
and hand hoe in local condition. Performance parameters such as field capacity, weeding
efficiency and plant damage of the row cultivator were considered during the performance
test at farmers’ field. The test results showed that, the developed row cultivator can work up
to 5.0 cm depth of operation with 0.075 ha/hr field capacity, 80.66% weeding efficiency,
9.65% plant damage and 114birr/ha cost of cultivation was obtained under the field test.
Therefore, this implement was recommended for popularization in any row planted crops as it
gave better field capacity and highly save the cost of operation.
Keywords: Row crop cultivator, Manual Weeding, Weeding Efficiency, Field Efficiency
Introduction
Weeding is one of the critical stages in crop cultivation and affects yield and quality of the
yield. It can reduce crop yields from 15 to 50% depending on species, density and weeding
time through competition with main crop for light, water and nutrition (Hasanuzzaman et al.,
2009). Weeding is done either manually uprooted or using simple hand hoe. Timeliness of
operations is one of the most important factors which can only be achieved if appropriate uses
of simple agricultural tools are made. Majority of crops are planted relatively at the same time
and this results in shortages of labor during the peak seasons of weeding. The intensification
and modernization of agricultural production is associated with use of better farm implements

147
147
Proceeding of Adaptation and Generation of Agricultural Technologies IQQO AGP-II
and increased power utilization. To popularize improved animal-drawn row cultivator, it had
been modified to equine animal drawn and evaluated for feasibility on farmers' fields.
Therefore, the objective of this study was to evaluate field performance of Horse drawn row
crop cultivator and compare to hand weeding and hand hoe for developing appropriate
mechanical weed control drawn by Equine Animals.
Materials and Methods
Description of the Row Cultivator
The developed row cultivator is light, simple in design, easy to operate, reduce drudgery and
manufactured from locally available materials and can be easily maintained. The
constructional details and main components of the row cultivator are main frame, tine and
shovel.
Test Conditions
Performances of row cultivator vary with the conditions of the field, soil, weed, crop, operator
and the ambient conditions. As the weed condition; type of weed, population density and the
height of weed were considered. Plant population and height were measured as crop
conditions.
Experimental Field
The practical field tests were conducted during the 2016/17 cropping season on purposely
selected farmers’ field in West Arsi Zone of Oromia Region. The row cultivator had been
evaluated on wheat (Kubsa variety), sown in 0.2m row spacing and single horse was used for
test. The test plot was 15 m x 20 m with three replications at each site. Cultivating operations
were done after three weeks of sowing with hand weeding, hand hoe and row cultivator.
Performance Indicator
Weeding efficiency, plant damage, field capacity and field efficiency was taken as
performance indicator. The weeding efficiency was determined by counting number of weeds

148
148
Proceeding of Adaptation and Generation of Agricultural Technologies IQQO AGP-II
before and after the cultivation by throwing a quadrant (metal frame of 1m × 1 m). The
weeding efficiency of the row cultivator was calculated by the following equation (Remesan
et al., 2007):
100
1
21 xW
WWe
1
Where: - e = weeding efficiency in percent, W1= number of weeds/m2 before weeding
W2= number of weeds/m2 after weeding
To determine the damaged plant, as a quality of work done, number of plants in a 10 m row
length before and after weeding was counted and percentage of plant damage was obtained by
the following equation (Yadav and Pund, 2007):
1001 xP
2
Where: - q = plant damage per cent, Q = Number of plants in a 10 m row length after weeding
P = Number of plants in a 10 m row length before weeding
Field capacity and field efficiency were calculated by the following equations (Hunt, 1995):
10
ee
FWSC
3
100t
ee
T
TF
4
Where: - Ce = effective field capacity (hah-1 ), S = the travel speed of the cultivator ( kmh −1),
W = working width (m), Fe = field efficiency (%), Tt and Te are the total and effective time (h)
Cost Analysis:
Cost analysis was done on the basis of fixed and variable costs of equipment. The cost items
include purchase price of the machine, salvage value of the machine, machine life (year),
interest rate (%), yearly repair and maintenance cost and labor cost.

149
149
Proceeding of Adaptation and Generation of Agricultural Technologies IQQO AGP-II
Results and Discussions
The results of field performance of different weeding methods were explained in table 1
below.
Table 1: Field Performance Test Results
No Particulars Row cultivator Hand-hoe Hand weeding
1. Area covered (ha) 0.03 0.03 0.03
2. Test duration (hr) 0.4 6 5.33
3. Row to row spacing (mm) 200 200 200
4. Age of the crop (days) 21 21 21
6. Mean plant population (per M2) 157.55 161.78 147.11
8. Plant damage (%) 9.65 8.01 5.43
9. Mean weed population(No/m2)
- Before cultivation
- After cultivation
113.22
21.89
170.22
24.44
130.33
23.11
10. Weeding Efficiency (%) 80.66 85.64 82.27
11. Depth of operation (cm) 7 4.67 -
12. Working width (cm) 550 - -
13. Mean speed of operation (m/s) 0.74 - -
14. Effective field capacity (ha/hr) 0.075 0.005 0.0056
15. Length of the row (m) 20 20 20
16. Grain Yield (kg per plots) 175.67 180.99 166.66
17 Grain Yield (Qun/ha) 58.56 60.33 55.55
Weeding Efficiency
The weeding efficiency was determined by considering the number of weed before and after
weeding operation. The highest weeding efficiency was observed for hand hoeing (Table 1),
which may be due to the fact that more precisely intra row area could be covered. Average
value of the row cultivator weeding efficiency was found to be 80.66%. It can be concluded
that the row cultivator is efficient because efficiency is more than 80% and also easy in
operation.
Plant Damage

150
150
Proceeding of Adaptation and Generation of Agricultural Technologies IQQO AGP-II
There was plant damage due to animal behavior while cultivation. Guiding Animal to follow
plant rows was tiresome because they don’t move straight forward while field operations. So
that higher percentage of plant damage was found in case of row cultivator (9.65%) followed
by hand hoe (8.01%) and hand weeding (5.43%) (Table1). The higher recorded percentage of
plant damage for row cultivator might be because of the higher speed of operation, width of
cultivator and depth of operation, caused injury to the plants by cutting either their roots or
stem.
Field Capacity
The field capacity of developed row cultivator was calculated by selecting respective plots of
size 15 × 20 m the row cultivator was operated and different observations were recorded. The
mean field capacity of the developed row cultivator was found 0.075 ha/h (table 1). This test
result indicates, the row cultivator was easy to operate and outcome of field capacity also
satisfactory.
Cost Analysis
On average, it took 59 and 67 hours for three people to weed a hectare of wheat land by hand
and hand hoe, respectively, while the time required for weeding a hectare of land using a row
cultivator was 13 hours. On average weeding with a row cultivator was 5 times faster than
hand and hand hoe weeding. Hence, one can note that the time requirement per hectare is
reduced by one-fifth and labor requirement reduced by the same amount. This clearly
indicates that total labor cost of weeding a hectare of land can be reduced to one-fifth.
Conclusion and Recommendations
The developed row cultivator attained satisfactory field performances of 0.075ha/hr effective
field capacity, 81.11% field efficiency, 80.66% weeding efficiency, 9.65% plant damaged,
58.56 qt/ha of wheat yield and also total labor cost of weeding a hectare of land with row
cultivator was only 114birr. Besides, tests did not reported any ergonomics defect or part
breakdown throughout the test and it was easy to operate. In general, field performance test
results indicated satisfactory result for adopting this row crop cultivator and it can also be

151
151
Proceeding of Adaptation and Generation of Agricultural Technologies IQQO AGP-II
used for other crops as row spacing can be adjusted. Thus, it can be concluded that newly
developed row crop cultivator could be recommended as the appropriate solution for the
weeding problem of small and medium scale farmers. Therefore, it can be recommended for
popularization for any row planted crops as it gave a better field capacity and higher saving in
the cost of operation and labor requirement as compared to traditional practices. Besides, the
newly developed row crop cultivator should also further modified to reduce percentage of
plant damage and better performance.
References
Hasanuzzaman M, Ali MH, Alam MM, Akhtar M, Fakhrul Alam K. (2009). Evaluation of
pre-emergence herbicide and hand weeding on the weed control efficiency and
performance of transplanted rice. American-Eurasian J. Agron., 2(3): 138-143.
Hunt D. (1995). Farm power and machinery management (9th Edn.). Iowa State University
Press. Ames, IA, USA.
Remesan R., Roopesh MS., Remya N., Preman PS. (2007). Wet land weeding- A
comprehensive comparative study from south India.The CIGR E-journal. Manuscript
PM 07011,9:1-21.
Yadav R and Pund S (2007). Development and ergonomic evaluation of manual weeder.
Agricultural Engineering International: the CIGR E Journal.Manuscript PM 07 022
IX.

152
152
Proceeding of Adaptation and Generation of Agricultural Technologies IQQO AGP-II
Participatory on Farm Evaluation and Verification of Poultry Feed Mixer
Gosa Bekele
Oromia Agricultural Research Institute, Asella Agricultural Engineering Research Center,
E-Mail: [email protected]
Abstract
On farm evaluation and verification of poultry feed mixer was done using sodium chloride
(NaCl) as tracer. The machine was tested using a feed composed of 40.05 kg cracked corn, 18
kg wheat bran, 7.50 kg noug cake, 3.75 kg cracked soybean, 3.75 kg fish meal, 0.75 kg lime
stone, 0.75 kg premix, 0.075 kg methionine, 0.15 kg lysine and 0.225 kg salt (NaCl) replicated
thrice at four mixing durations of 10, 15, 20 and 25 minutes and screw shaft speed of 100,
150 and 250 rpm. The effectiveness of mixing was assessed on the basis of percent salt
content, and percent coefficient of variation (CV %) and degree of mixing of sample collected
at the end of each test. The best values of coefficient of variation (8.42%) and degree of
mixing (91.58%) were obtained at mixing screw shaft speed of 150 rpm and holding time of
20.minutes. Hence, it can be concluded that the poultry feed mixer, should be operated at
speed of 150 rpm with maximum holding time of 20 in order to make the owning and
operating of the machine productive (in terms of kg/hr) and economical (in terms labour and
energy cost birr/kg of mixed quality feed.
Keywords: Poultry, poultry feeds, feed mixer
Background and Justification
Feed production for livestock, poultry or aquatic life involves a range of activities, which
include grinding, mixing, pelleting and drying operations. New (1987) gave a summary of the
different types of machinery needed for the production of various types of feeds and they
include grinders, mixers, elevators and conveyors, extruders, cookers, driers, fat sprayers and

153
153
Proceeding of Adaptation and Generation of Agricultural Technologies IQQO AGP-II
steam boilers. The mixing operation in particular, is of great importance, since it is the means
through which two or more ingredients that form the feed are interspersed in space with one
another for the purpose of achieving a homogenous mixture capable of meeting the nutritional
requirements of the target livestock, poultry or aquatic life being raised (Balami, et al., 2013).
Essentially, feed mixing can be done either manually or mechanically. The use of manual
labour to mix crushed poultry feed by the traditional agricultural sector that is characterized
by subsistence farming was perhaps the first form of poultry feed mixer. The manual method
of mixing feed ingredients is generally developed to characterized by low output, less
efficient, labour intensive and may prove unsafe, hence, hazardous to the health of the
intended animals, birds or fishes for which the feed is prepared. If feed is not completely
mixed, portions of the feed will contain either too much or too little of the formulated
ingredients. This excess variability causes economic losses to users of the feed (Barashkov et
al., 2007). Therefore, the objective of the study was to evaluate and verify the developed
vertical screw type poultry feed mixer amenable to local condition economically, socially and
technically.
Materials and Methods
Materials and instruments
Materials and instruments that used during on farm evaluation of the poultry feed mixer were:
feed mixer, taco meter, digital balance, stop watch, graduated cylinder, and sample holding
bags and others.
Mixer Performance Evaluation
The poultry feed mixer was loaded with all the feed ingredients` prepared on the basis of
required amount. A 100 g sample was taken during the discharge of the mixed feed. Herrman
and Behnke (1994) suggested that ten samples per batch per mixing time and speed would
yield sufficient and satisfactory coefficient of variance. The sodium chloride concentration
was determined according to the method developed by FAO (1981) for concentration analysis
as following equation:
154
154
Proceeding of Adaptation and Generation of Agricultural Technologies IQQO AGP-II
%1001.0
sampleofweight
factorTitreNaClcons (1)
Where: Titre value = volume of the titre used, factor = 0. 0058 and 0.1 = concentration of
AgNO3
The performance of the feed mixer assessed on the basis of salt concentration as analyzed in
the laboratory and its mean concentration, variation between samples (standard deviation) and
coefficient of variation (CV) and degree of mixing using the following equations as
recommended by Herrman and Behnke (1994).
100%
y
SDCV ;
n
yy
i
; 1
2
n
yy
SDi and CVDM %100% (2)
Where: % CV = percent coefficient of variation, %DM = percent degree of mixing, SD =
standard deviation, = mean, = sum, yi= individual sample analysis results and n = total
number of samples
Experimental Design
The experimental design was randomized complete block design with three replications.
Treatments consisted of factorial combinations of three mixing speeds and four holding.
Analysis of variance appropriate to the design of the experiment to evaluate the significance
of the factors on mean salt concentration, coefficient of variation and percent mixing were
tested using Geanstat 15th software. Test at 0.05 probability level was computed to delineate
the significance differences between and/or among treatment means.
Result and Discussion
Tests were carried out at four mixing periods (holding time) and three mixing speeds (auger
shaft speeds, rpm) to evaluate the mixing performance of feed mixer based on salt
concentration of mixed feed as measured by mean value of concentration, standard deviation,
coefficient of variability and degree of mixing. Table 1 gives the mean concentration of salt
y

155
155
Proceeding of Adaptation and Generation of Agricultural Technologies IQQO AGP-II
(sodium chloride, NaCl), mean percent coefficient of variation and mean percent degree of
mixing of feed ration mixed using the prototype poultry feed mixer developed at the auger
shaft speed of 100 rpm and various levels of holding/mixing time.
Table 1: Mean prototype poultry feed mixer performance at mixing time of 10, 15, 20 and 25
minutes for each auger shaft of 100, 150 and250 rpm.
Mixing dur.
(min)
Shaft Speed
(rpm)
Mean NaCl Conctrn
(%)
Mean CV
%
DM(%)
10 100 0.250 20.27 79.73
15 100 0.241 14.37 85.63
20 100 0.24 12.79 87.21
25 100 0.243 11.25 88.75
Mean - 0.244 14.67 85.33
10 150 0.24 17.43 82.57
15 150 0.235 14.54 85.46
20 150 0.25 8.42 91.58
25 150 0.248 10.42 89.58
Mean - 0.243 12.70 87.30
10 250 0.232 17.03 82.97
15 250 0.229 14.10 85.90
20 250 0.248 12.64 87.36
25 250 0.237 12.18 87.82
Mean - 0.236 13.99 86.01
From Table 1, it can be seen that, at the mixing auger shaft speed of 150 rpm, holding time of
20 and 25 minutes resulted in percent coefficient variation of 8.42% and 10.42%,
respectively. The two values of coefficient variations obtained at holding times 20 and 25
minutes are within upper boundary of rating as indicated by Herrman and Behnke (1994)
(values of percent coefficient of variations 10, 10 – 15, 15 -20 and 20 are rated excellent,
good, fair and poor, respectively, in terms of uniformity of mixing). Hence, the mixing
uniformity was superior at the combination of 150 rpm and 20 minutes of mixing time.

156
156
Proceeding of Adaptation and Generation of Agricultural Technologies IQQO AGP-II
The percent coefficients of variation of speeds below and above 150 rpm were higher though
the mixing time was increased up to 25 minutes. This is due to the very fact that at low
mixing auger shaft speeds (rpm) the magnitudes of both axial and radial acceleration of the
feed ingredients were so small that all materials might tend to move as a unit. On the other
hand, at high mixing auger shaft speeds (rpm) the magnitudes of both axial and radial
acceleration of the feed ingredients were so high that segregation of individual feed ingredient
became inevitable; hence increase percent of coefficient of variation is consequence. Results
of the analysis of variance (ANOVA) presented in Table 2 and Appendix Table 1 revealed
that the mixing screw shaft speed and the interaction of the same with holding time had high
significant effect (p < 0.05) on degree of mixing.
Table 2: Effects of auger screw shaft revolution and holding time on percent degree of mixing
(DM %)
Para
met
e
r
Source of variation Measure of
differences
Auger Screw Shaft Speed (R), rpm Degree of Mixing (%) LSD (5% ) SE(M)
100 85.33a
1.067
0.514 150 87.30b
250 86.01a
Mixing/holding time (T), min
1.232
0.594 10 81.75a
15 85.66b
20 88.72c
25 88.72c
Interaction (R*T)
2.134
1.029 10 min 15 min 20 min 25 min
100 rpm 79.73a 85.63b 87.21be 88.75d
150 rpm 82.57c 85.46b 91.58d 89.58d
250 rpm 82.97c 85.90b 87.36be 87.82bd
Key: Means followed by the same letter (or letters) do not have significant difference at 5%
level of probability.

157
157
Proceeding of Adaptation and Generation of Agricultural Technologies IQQO AGP-II
Conclusion and Recommendations
The optimum level of mixing with percent coefficient variation of 8.42 and percent degree of
mixing of 91.58 were observed at the mixer speed of 150 rpm and holding/mixing time of 20
minutes. Hence, it can be concluded that the machine should be operated at speed of 150 rpm
with maximum holding time of 20 minutes. Based on the experimental results, increase in
holding time beyond the time indicated above will require the farmers to spend extra money
on electrical power and labor costs during feed mixing. This mixer must be operated at
mixing auger speed of 150 rpm for a period of 20 minutes per batch of mixing; and the feed
ingredients must be prepared correctly by keeping their required size as recommended by
mono-gastric nutritionist for specific poultry growth stage.
References
Balami, A. A., D. Adgidzi and A. Mua’zu, 2013. Development and testing of an animal feed
mixing machine. International Journal of Basic and Applied Science, Jan 2013, 1(3):
491-503.
BarashkovNikolay, Eisenberg David, Eisenberg Sylvan, Mohnke Joseph, Ferromagnetic
micro tracers and their use in feed applications, XII International Feed Technology
Symposium, Novi Sad, 13-16th November, 2007.
FAO, 1981.The prevention of losses in cured fish. Fisheries Technical paper 219. FAO,
Rome. Pp 87.
Herman, T. and K. Behnke, 1994. Testing Mixer Performance. MF-1172. Kansas State
University Agricultural Experiment Station and Cooperative Extension Service
Bulletin.Kansas State University, Manhattan, KS.

158
158
Proceeding of Adaptation and Generation of Agricultural Technologies IQQO AGP-II
New, M. B., 1987. Feed and feeding of fish and shrimp, ADCP/REP/87/26, FAO/UNDP,
Rome
Adaptation and verification of wheat row planter for Equine animals
Ayalew Bekele Demie
Oromia Agricultural Research Institute, Asella Agricultural Engineering Research Center,
Ethiopia
Abstracts
In an intensive agriculture increase in crop yield, cropping reliability, cropping frequency and
crop returns depend on uniformity and timely establishment of optimum plant populations.
Because of tillage repetitions, in Arsi and W/Arsi Zones farmers face draft power shortage
during plantation days. To tackle this problem they had practice of using equine animals for
this operation by local implements. Thus, this work was focused on adaptation of improved
row planter for single animal harnessing system. The technology was redesigned,
manufactured and comparatively evaluated with local row planting practice. The evaluation
parameters used were labor requirements, time of operation, plant distribution uniformity,
seed rate and grain yield. From the results obtained, the improved technology performs well
within recommended ranges in distribution uniformity, plant population and improved
operation time when compared with local practice. With these merits, the technology had
recommended for large scale use in the study area.
Key words: Equine animals, Row planting
Background and justification
Under intensive cropping, timeliness of operations is one of the most important factors which
can only be achieved if appropriate uses of agricultural machines are advocated (Salokhe and
Oida, 2003). Increases in crop yield, cropping reliability, cropping frequency and crop returns

159
159
Proceeding of Adaptation and Generation of Agricultural Technologies IQQO AGP-II
all depend on the uniform and timely establishment of optimum plant populations. A
meaningful selection, setting and management of all farm machinery, especially the planting
operation is one of the most important agronomic requirements for optimum plant
establishment associated with crop production (Murray et al., 2006).
In wheat belt Woredas of Arsi and West Arsi, farmers repeat tillage several times to prepare
seed bed, usually from 3 to 6 before plantation. This activity is performed in 90 to 100 days.
During months of this operation, there is scarcity of draft animal in the area as well as forage
except plant residue. As per the information collected from Zonal Bureau of Agriculture, 5 to
10% of farmers face challenge of oxen because of long continuous operation time and
inadequate forage availability. To tackle these problems, farmers are practicing the use of
equine animals for sowing activities. Since the use of these animals is being practiced for
sowing, adapting of improved, proven and effective oxen drown wheat row planter to equine
(horse) is essential for farmers in the area.
Accordingly, the objective of this activity was to modify and evaluate the proven oxen drawn
wheat row planter for horse so that alternative draft power source with improved technology
will be availed for the selected area.
Materials and Methods
Material used to manufacture prototype
Raw materials used for the manufacturing of prototype technology were angle iron, flat iron,
sheet metals, aluminum flutes, 11/2’ galvanized water pipe, different size bolts and nuts,
bearings, beam and handle wood.
Parts modified to fit for harnessing system
The following parts of the original planter were modified to decrease the overall weight of
planter.

160
160
Proceeding of Adaptation and Generation of Agricultural Technologies IQQO AGP-II
Hopper: It was made up of 1.5mm sheet metal with four compartments. Reducing the overall
weight of the technology was mandatory to be pulled by single horse.
Ground wheel: The diameter of the existing wheel was reduced from 60cm dia to 55cm dia
which reduces both overall height and weight of the machine.

161
161
Proceeding of Adaptation and Generation of Agricultural Technologies IQQO AGP-II
Technology description
Fig 1: Pictorial description of the planter (1-hopper, 2-seed metering mechanism, 3-frame, 4-
beam, 5-handle, 6-wheel, 7-furrow opener, 8-chain and sprocket assembly, 9-furrow cover)
Seed box (hopper): is a box like structure made up of steel sheet metal of 1.5mm thickness
with four compartments for seed. Seed metering mechanism is placed at the bottom of the
box.
Metering mechanism: it picks up seeds from the seed box and delivers them in to the seed
tube. It is fluted roller feed type and provided at the bottom of the box. The numbers of fluted
rollers are equal to number of rows. The fluted roller is driven by a steel shaft. There are ten
horizontal groves provided along the outer periphery of the rollers and rollers can be shifted
along the shaft depending upon the seed rate. These rollers are mounted at the bottom of the
seed box. They are made of aluminum material with housing of galvanized water pipe.
Frame: Made of mild steel angle section and flats. It is designed in such a way that strong
enough to withstand all types of loads in working condition. All other parts of the seed drill
are fitted to the frame.
Beam: Made of wood and designed to fit with single animal harnessing mechanism and used
to connect the planter with animal.
Wheels: Are fitted on an axle for transporting the drill on roads. Flat iron wheels and or
pneumatic tire are used as transport wheels. They are fitted with chain and sprocket
1
2 3
4 5
6
7
8 9
162
162
Proceeding of Adaptation and Generation of Agricultural Technologies IQQO AGP-II
attachment to transmit motion of the wheel to the seed metering mechanism when the drill is
in operation.
Furrow openers: These are the parts which open up furrows in the soil for placing the seeds.
It is shovel structure made up of sheet metal and flat iron.
Covering device or furrow closer: It is a device which closes the furrow with soil after the
seed dropped in. The covering device is made in straight bar mode which is connected to
frame at the back.
Deriving mechanism: consists of a sprocket-chain assembly and drive and driven shaft that
carry the seed picking discs. The chain connects the drive shaft sprocket and the driven shaft
sprocket. As the drive shaft rotates with ground wheel, the driven shaft which carries the seed
metering discs rotates and picks up seed from hopper.
Experimental detail
The experiment was conducted on sandy loam soil in West Arsi zone of Oromia regional
state. It was conducted in 2016/17 cropping season. The wheat variety used was kubsa
. The experimental farmers were purposively selected. Treatments used to evaluate the
technology were local row planting practice, broad casting and row planting with improved
technology. The plot size was 20m X 5m replicated three times on similar soil types and
conditions. Comparative evaluation was done by selecting the following performance
indicator parameters.
Labor Requirement: It is the number of person required on operation/during planting time (in
person per operation)
Planting time: Time taken for sowing by animal drawn planter and manual hr/ plot
Distribution uniformity: Percentage of even distribution of plant /plot. The row spacing and
plant population in a row are treated here.
Plant population: It is the number of plants per hectare. The optimal yield is the factor of
planmt population.
Depth of planting: Depth of the hole was measured by scale ruler (cm)
Yield: The wheat harvested from each plot harvested, dried, cleaned and weighted to kg per
hectare.
Seed rate: Amount of seed required for one hectare planting in kg per hectare

163
163
Proceeding of Adaptation and Generation of Agricultural Technologies IQQO AGP-II
Result and discussion
The mean performance indicator parameters test results of the treatments were explained in
the following table.
Table 1: Field performance test results
Treatments Seed
rate
(kg/ha)
Field
capacity
(ha/hr)
Operational
speed
(m/sec)
Number
of rows
per pass
Depth of
plough(m)
Labor
required
per
operation
Broad
casting
152 0.044 0.72 1 0.17 3 men
Local row
planting
practice
146.5 0.04 0.69 1 0.17 3 men
Improved
technology
111 0.17 0.85 4 0.05 3 men
Seed rate: It is the amount of seed to plant one hectare in kg/ha. From the performance result
indicated in the above table (Table 1), amount of seed saved per hector by improved
technology was 41kg and 35.5kg when compared with broad casting and local row planting
methods respectively. Comparing seed rate the improved technology was found superior to
both local row planting practice and broad casting methods.
Field capacity: It is the amount of work performed in ha/hr. As indicated in the table; 5.88hrs,
25hrs and 22.72hrs were needed to cover one hectare by using improved technology, local
row planting practice and broad casting methods respectively.
Working width: It was also compared as 4 rows, 1row and one row for improved technology,
local row planting and broad casting respectively. Thus, improved technology drills four rows
per single pass while the other methods plants one row per pass.
Depth of planting: Plants as shallow as possible provide seed placed in the moisture zone but
deep enough so that the drying front will not reach the seedling roots before leaf emergence.
Optimum planting depth for wheat is between 50-70 mm. From test result obtained, the

164
164
Proceeding of Adaptation and Generation of Agricultural Technologies IQQO AGP-II
improved technology drills seed within recommended depth range while the local row
planting and broad casting ploughs deeper than recommended range.
Operation drudgery: One of the main objectives of engineering technologies is to reduce
work drudgery and related hardships to ease intended operation. On operation it was very
comfortable for operator to use improved technology while it was painful to use local row
planting practice especially, for the one who drops seed and fertilizer in a row. From the
comments of farmers and observations, improved technology eases row planting related
operational hardships. The following figures describe population density and distribution
uniformity of the treatment data taken during germination count.
Figure 1: Mean row spacing across sites Figure 2: Mean plant population per meter square
The performance results described on Fig 1 and 2 indicated plant population and distribution
uniformity. Improved technology (red line) had small variation in mean sample values and
that of local row planting technology showed relatively larger variation (Fig 1). The ideal row
spacing variation is zero, from the variation figure the superior treatment is improved
technology. The mean variation for plant population per meter square of the samples across
site indicated that improved row planter performs better than local practice (broadcasting).
From the recorded and analyzed data indicated on the same figure, it can be concluded that
improved technology performs better than the other two treatments. On figure 3, plant
population per square meter was compared. When population density was compared, again
the improved technology treatment performs better than the other treatments.
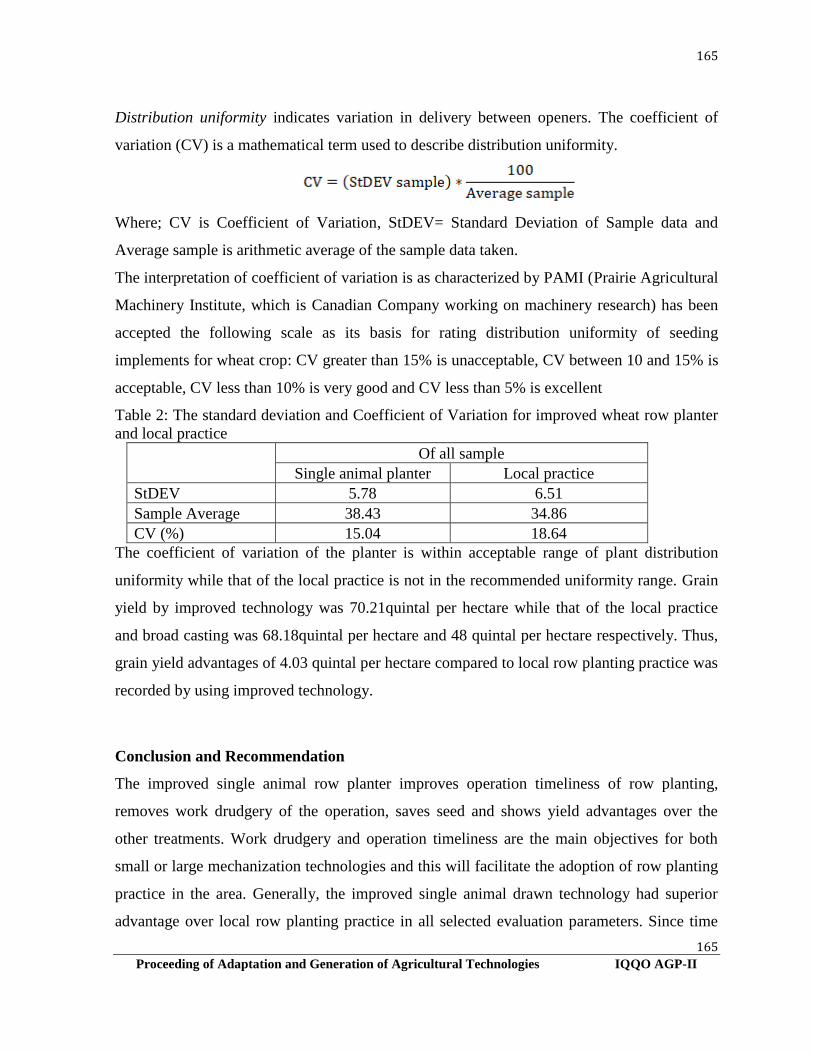
165
165
Proceeding of Adaptation and Generation of Agricultural Technologies IQQO AGP-II
Distribution uniformity indicates variation in delivery between openers. The coefficient of
variation (CV) is a mathematical term used to describe distribution uniformity.
Where; CV is Coefficient of Variation, StDEV= Standard Deviation of Sample data and
Average sample is arithmetic average of the sample data taken.
The interpretation of coefficient of variation is as characterized by PAMI (Prairie Agricultural
Machinery Institute, which is Canadian Company working on machinery research) has been
accepted the following scale as its basis for rating distribution uniformity of seeding
implements for wheat crop: CV greater than 15% is unacceptable, CV between 10 and 15% is
acceptable, CV less than 10% is very good and CV less than 5% is excellent
Table 2: The standard deviation and Coefficient of Variation for improved wheat row planter
and local practice
Of all sample
Single animal planter Local practice
StDEV 5.78 6.51
Sample Average 38.43 34.86
CV (%) 15.04 18.64
The coefficient of variation of the planter is within acceptable range of plant distribution
uniformity while that of the local practice is not in the recommended uniformity range. Grain
yield by improved technology was 70.21quintal per hectare while that of the local practice
and broad casting was 68.18quintal per hectare and 48 quintal per hectare respectively. Thus,
grain yield advantages of 4.03 quintal per hectare compared to local row planting practice was
recorded by using improved technology.
Conclusion and Recommendation
The improved single animal row planter improves operation timeliness of row planting,
removes work drudgery of the operation, saves seed and shows yield advantages over the
other treatments. Work drudgery and operation timeliness are the main objectives for both
small or large mechanization technologies and this will facilitate the adoption of row planting
practice in the area. Generally, the improved single animal drawn technology had superior
advantage over local row planting practice in all selected evaluation parameters. Since time

166
166
Proceeding of Adaptation and Generation of Agricultural Technologies IQQO AGP-II
operation is reduced by four folds the cost of operation will also reduce. Thus, it is
advantageous to multiply and distribute this technology in the study area.
Reference
Salokhe V.M. and Oida A., 2003.Development of Appropriate Agricultural Machinery for
Southeast- Asian Countries.Laboratory of Agricultural Systems
Engineering.Southeast- Asia
MurrayJ. R., TullbergJ, N.and BasnetB., 2006. Planters and their Components, Types,
Attributes, Functional requirements, Classification and Description, Australia.
http://www.daf.gov.au/wheat/planting-information, accessed on 19th May, 2015.

167
167
Proceeding of Adaptation and Generation of Agricultural Technologies IQQO AGP-II
Adaptation and Verification of Spike Tooth Harrow for Pack Animals
Asnake Tilaye and Bayan Ahmed
Oromia agricultural research institute, Asella Agricultural Engineering research center,
Ethiopia, Corresponding author: [email protected]
Abstract
It was observed that, farmers in the test area repeat farm tillage usually from 3 to 6 to
prepare seedbed by using oxen and traditional ‘Marasha’. But these practices are causing
exhaustion for both the farmers and oxen which are less resistive to such conditions. In
addition, as the affordability of the oxen is becoming difficult and the traditional ‘Marasha’ is
not suitable for reducing the repetitive tillage. Therefore this activity was aimed at modifying
and verifying existing spike tooth harrow for secondary tillage and for donkey and horse
harnessing suitability. Field evaluation of the modified implement was carried out to
determine plowing width and depth, clod breakage (soil pulverization) and working capacity
(hr/ha). Test result of the modified implement showed that 63.4 % clod breakage or soil
pulverization within an average time of 3.8 hr/ha, which takes a day by using the
(‘Marasha’). The average yield of grain worked by spike-tooth harrow was 80 quintal/ha and
that of ‘Marasha’ with oxen was 67quintal/ha.
Key words: clod size, tillage, spikes
Introduction
Optimum tillage to achieve maximum crop yields with minimum energy consumption is the
main goal of efficient seedbed preparation. A good seedbed preparation shows finer particles
and greater firmness in the vicinity of the seeds (Pandey, 1998). The use of animal traction
has enabled farmers to expand their area of farming and contributed to the timeliness of their
agricultural operations. The cost of maintaining cattle is often too great to make oxen a
feasible source of farm power when compared to pack animals. Donkeys and horses are
popular draft animals because they are inexpensive (often less than half the price of oxen on

168
168
Proceeding of Adaptation and Generation of Agricultural Technologies IQQO AGP-II
the live market), easy to train, and effective where shallow breaking is practiced before
planting begins (Dibbits and Bobobee, 1996)
Spike tooth harrow breaks clods, stirs the soil, uproots the early weeds, levels the ground, and
breaks soil crust. It also covers the seeds which usually operate at shallow depths up to 5 cm.
It was observed that, farmers around Asassa and Dodola woredas repeat tillage usually from 3
to 6 to prepare seedbed for plantation. This activity is performed in 90 days. During these
months of operation, most oxen exhausted and farmers face problem of draft power to
overcome the challenge, farmers are practicing the use of pack animals. They use traditional
‘maresha’ to accomplish these tasks. However, this traditional implement used is not suitable
for donkey and horse. They cause wounds and sores on the donkeys' necks, making donkeys
inflexible and rendering them unusable for several days (Kathy and Zahra, 1983). Therefore
the activity was aimed at modifying and verifying existing spike tooth harrow technology
used for secondary tillage and further for donkey and horse to overcome the above problems.
Material and methods
The material required to undertake this activity were:- Wheat grain, fertilizer, Harness
attached on the back of pack animal, donkey or horse to pull an implement, (150x150x4000)
mm and Ø (70, 80)mm eucalyptus tree, Ø (6, 8, 10)mm of round bar, M (10x120) mm bolt
and nut and 8mm nail.
Technology adaptation
The attachment of spike tooth harrow were modified and attached to harness system on the
back of pack animal that have good draft force and equipped to the beam (Fig 1).

169
169
Proceeding of Adaptation and Generation of Agricultural Technologies IQQO AGP-II
Fig 1: Modified spike tooth harrow
The diagonal dimension before modification of spike tooth harrow is 167cm.These diagonals
are designed and modified to 120.9cm. The right and left diagonals are the longest part of
spike tooth harrow used to support other parts attached on it. The width of largest bottom
before modification is 147cm. It is designed and modified to 101cm.The second part before
modification was 127cm and reduced to 85.4cm. The third one was 97cm before modification
and minimized to 64.6cm. The top one was 74cm and modified to 49cm.The numbers of
spikes available on spike tooth harrow before modification were 29 in numbers and it is
reduced to 24 spikes. Weight of modified technology (spike-tooth harrow + harness + ‘mofer’
attachment was; 40 + 7 + 9=56 kg). Its actual width was 85 cm and height of spikes was
18cm.
Performance evaluation of modified spike tooth harrow
Field test
Field test was done at two different sites of Asassa and Dodola woredas. The evaluation was
carried out to determine the following parameters under field conditions: plowing width and
depth of a modified spike tooth harrow, clod breakage into finer pieces (soil pulverization)
and for good soil bed and maximum working capacity (hr/ha). Total area of the tests was
20mx20m (400m2) which is divided to 20x10 m plot size for working with the spike-tooth
harrow and the other 20x10m for oxen with ‘Marasha’. Land preparation of the experimental
area before the test was coarse except compacted at Dabara walta’i kebele and soil type is
sandy loam.

170
170
Proceeding of Adaptation and Generation of Agricultural Technologies IQQO AGP-II
Result and Discussion
Field test for clod breakage
The clod breakage was measured using Varner caliper in selected 1m x 1m ploughed area.
Table 1- Average clod breakage
No Test site Parameter Tot.average (lxwxt)cm
1 Kachama chare Kebele Clod diam. Before 25x18x10.5
Clod diam. After 13x10x6
2 Dabara walta’i kebele Clod diam. Before 26.5x20.5x10
Clod diam. After 16x11x7
3 Huruba walkite kebele Clod diam. Before 26.5x20.5x10
Clod diam. After 16x11x7
An average actual plowing width per pass for modified spike tooth harrow was 85cm and
actual plowing depth was 9.3cm. Clod breakage or soil pulverization of about 54.9 % was
done at Kachama chare Kebele, 73.6 % at Dabara walta’i kebele and 61.4 % at Huruba
walkite kebele.
An average time used for assembling the modified implement was 4.2 and 2.1 minute for
disassembling during field operation. Two persons were used during assembling, operation
and disassembling. Generally, we found that an average of 63.4 % clod breakage or soil
pulverization was done by the technology modified. Time taken for spike-tooth harrow was
3.8 hr/ha which is approximate to 4 hr/ha.
Grain Yield and yield related data
An experimental crop harvested was taken by placing (1 x 1) m2 quadrant on the experiment
plot at three places.

171
171
Proceeding of Adaptation and Generation of Agricultural Technologies IQQO AGP-II
Table 2- Average yield of experimental crop
No. Parameter Average yield for
Harrow covered
Average yield for Oxen
covered
1 Weight of bundle (qt/ha) 194 166
2 Weight of cleaned grain (qt/ha) 80 67
3 Weight of straw (qt/ha) 125 99
4 Grain straw ratio 0.62 0.68
5 Sheave length (cm) 80.6 81.3
The total average weight of cleaned grain yield was 67 qtl/ha for oxen covered and 80 qtl/ha
for spike-tooth harrow. Generally, the average weight of cleaned grain covered by modified
technology had good result as compared to oxen covered.
Conclusion and recommendation
Spike tooth harrow is used to break down the clod size and to assist with field leveling after
ploughing. The technology recommended was not gender dependent, so that male and female
farmers can use equally. An average time used for assembling was 4.2 minute but 2.1 for
disassembling during field operation. Time taken for spike-tooth harrow was 3.8 hr/ha. 63.4
% clod breakage or soil pulverization was done by the technology modified. Wheat cleaned
grain yield is 67 qtl/ha for oxen covered and 80 qtl/ha for modified spike-tooth harrow. In this
test, it has been found that utilizing indigenous knowledge; features of traditional implements
and farmers’ know how in agricultural technology design, development and testing process is
a very effective approach for appropriate technology development.
References
Dibbits H.K. and E.Y.H. Bobobee (1996), Animal Traction Technology; Interim Report.
National Agricultural Extension Project of Agricultural Extension services. Ministry
of Food and Agriculture, Accra.
Kathy Marshal and Zahra Ali, 1983, Gender issues in donkey use in rural Ethiopia.

172
172
Proceeding of Adaptation and Generation of Agricultural Technologies IQQO AGP-II
Pandey (1998), Present Status and Future Requirement of Farm Equipment for Crop
Production
Watson, Peter R, 1982, Animal Traction, Appropriate Technologies for Development.
Manual M-12, Washington D.C.
NATURAL RESOURCE MANAGEMENT
Verification of Soil test based crop response phosphorous recommendation
for Teff at Omo Nada district, western Oromia
*Dagne Chimdessa and Abdulmalik Mohammed
Oromia Agricultural Research Institute, Bedele Soil Research Center, Bedele, Ethiopia
*Corresponding author: [email protected]
Abstract
On-farm verification trial of soil test based crop response calibrated phosphorus was
conducted at Omo Nada district of Jimma Zone during 2016 main cropping seasons. The
aims of the study was to verify recommended optimum nitrogen fertilizer rate for the district
during the soil test based crop response phosphorus calibration. The treatments were: soil
test based crop response phosphorus recommendation (STBCRPR) (T1), farmers’ practices
or blanket recommendation (T2) and control or without fertilizer (T3). The experiment was
conducted across seven sites and thus farmers were used as replication. The Plot size was
48m by 18m for each treatment. Yield data was analyzed using SAS and LSD was used for
mean separation. The initial soil reaction pH were strongly acidic ranging from 4.39 to 5.44
and the available P was very low ranged from 1.042 to 3.058 ppm. The results of the study
revealed that there were significant differences (P ≤ 0.05) among the treatments in teff grain
yield. The maximum mean grain yield (1047.14 kg ha-1) was recorded from the application of
STBCRPR (soil test based crop response phosphorus recommendation whereas the lowest
(740.00 kg ha-1) was recorded from the control. Nitrogen fertilizer rate of 23 kg N ha-1
showed better grain yield and thus recommended for the area. The study also showed that P-
critical value (4.5 ppm) and P- requirement factor (15.12) were determined for the
recommended phosphorus in the study area. Economic analysis was performed to compare
treatment advantages. The validity of critical value and economic evaluation showed that
STBCRPR would yield 2.06 Ethiopian birr for every birr invested. Thus, it is highly advisable
173
173
Proceeding of Adaptation and Generation of Agricultural Technologies IQQO AGP-II
to farmers and other tef growers in the test environment to use soil test based crop response
phosphorus recommendation so as to increase the productivity and profitability of teff.
Key Words: Soil tast based fertilizer recommendation, Phosphorus critical, available phosphorus
Introduction
Providing food for the ever-growing population is one of the critical challenges of today.
According to Beets (1982), production can be increased by expanding the area planted to
crops, raising the yield per unit area of individual crops or by growing more crops per year. In
the future, most of additional food the world needs must come from larger yields on the lands
already under cultivation and/or from lands now considered marginal (Chatterjee and Maiti,
1994). A major share of this increase will likely come from the use of irrigation, commercial
fertilizers, pesticides, improved crops culture, mechanization and improved soil and water
management (FAO, 1984). The demand for fertilization is evident, as growers around the
world have already recognized the return, which can be realized from added plant nutrients.
Quinenes et al. (1992) stated that unless something is done to restore soil fertility first, other
efforts to increase crop production could end up with little success. Moreover, using chemical
fertilizers that bring more than 100% extra yield is inevitable in most cases (Kelsa et al.,
1992).
In Ethiopia, low soil fertility is one of the factors limiting the yield of crops, including wheat.
It may be caused as a result of removal of surface soil by erosion, crop removal of nutrients
from the soil, total removal of plant residue from farmland, and lack of proper crop rotation
program (Tamirie, 1982). The results of several studies conducted on the status of P in
Ethiopian soils (Tekalign and Haque, 1987) indicated that most of the soils studied require
addition of P fertilizer for profitable crop growth.

174
174
Proceeding of Adaptation and Generation of Agricultural Technologies IQQO AGP-II
It is essential that the results of soil tests could be calibrated or correlated against crop
responses from applications of plant nutrients in question as it is the ultimate measure of
fertilization program. An accurate soil test interpretation requires knowledge of the
relationship between the amount of a nutrient extracted by a given soil test and the amount of
plant nutrients that should be added to achieve optimum yield for each crop Sound soil test
calibration is essential for successful fertilizer program and crop production (Abaidioo et al.,
2000). Soil test based phosphorus calibration study was conducted at Omo Nadaa district on
Teff for three years. Thus formula comprises critical phosphorus value and phosphorus
requirement factor were determined based on initial P level in the soil. Even though critical
phosphorus value and phosphorus requirement factor were determined verification trial was
not performed. Therefore, the objective of this research were to verify P critical value and P-
requirement factors on Teff.
Materials and methods
The study was conducted on farmers’ fields in the district. Seven sites were selected based on
their willingness, wealthy and initial soil test value. Kuncho variety was used as test crop.
Phosphorus recommendation was given according to the formula, P (kg/ha) = (P critical – P
ini)*Prf. This recommendation was compared with farmers practice and control. Urea and
DAP was used as the source of N and P, respectively. Phosphorus fertilizer was applied at
sowing whereas Urea was applied 30 days after planting. The experimental design was simple
RCBD replicated per farmers. The treatments were: soil test based crop response phosphorus
recommendation (STBCRPR) (T1), farmers’ practices (blanket recommendation) (T2) and
control (without fertilizer) (T3). The Plot size was 48m by 18m for each plots. Yield data was
analyzed using SAS and LSD was used for mean separation. Economic analysis was
performed to investigate the economic feasibility of treatments, which were based on
CIMMYT, 1988)
Initial soil pH, available phosphorus and EC status of the study area conducted pre-
verification season were used a base for the execution of the present study. Accordingly, the

175
175
Proceeding of Adaptation and Generation of Agricultural Technologies IQQO AGP-II
pH (H2O) of the soil samples collected before planting were ranged from (4.39 to 5.44) (Table
1). This showed that the soils were strongly acidic in reaction as the classification made by
FAO (FAO, 2008). Continuous cultivation and long-term application of inorganic fertilizers
lower soil pH and aggravate the losses of basic cations from highly weathered soils
(Mokwunye et al. 1996). Available Phosphorus (Olsen method) collected before planting
were ranged from (1.042 to 3.058) ppm (Table 1). The available P contents of the soil were
very low (Olsen et al., 1954). The Ethiopian agricultural soils particularly the Nitisols and
other acid soils have low available P content due to their inherently low P content, high P
fixation capacity, crop harvest and soil erosion (Mesfin, 1998; Yihenew, 2002; Dagne, 2016).
Table 1.Initial soil pH, available phosphorus and EC status before planting at Omo Nada
district in 20016 cropping season.
Sites PH(H2O) P-ava.
(Olsen method)
E.C
Site 1 4.39 1.255 0.054
Site 2 5.13 2.432 0.053
Site 3 4.62 1.986 0.038
Site 4 5.00 1.958 0.057
Site 5 5.44 3.058 0.083
Site 6 4.83 1.042 0.049
Site 7 4.43 2.375 0.034
P-available = available phosphorus
Results and discussions
Verification of Phosphorus Critical value and Requirement Factor
There were significant differences (P ≤ 0.05) among the treatments in teff grain yield. The
maximum mean grain yield (1047.14 kg ha-1) was recorded from the application of soil test
based crop response phosphorus recommendation (STBCRPR) whereas the lowest (740.00 kg

176
176
Proceeding of Adaptation and Generation of Agricultural Technologies IQQO AGP-II
ha-1) was recorded from the control plot (Table 2). STBCRPR increased yield per hectare by
23% over farmer’s practices (Table 2).
Table. 2: Verification of Phosphorus Critical value and Requirement Factor in 2016 cropping
season.
Treatments Yield /ha (kg)
STBCRPR ( soil test based crop response fertilizer
recommendation 1047.14a
Framers Practices (blanket recommendation) 848.57b
Control (without fertilizer) 740.00c
LSD (5%) 72.76
CV(%) 7.11
LSD = Least Significant Difference, CV = Coefficient of Variation
Economic analysis
In estimating economic parameters, products were valued based on market price collected
from local markets during January 2017 where Teff was 16.00 ETB kg-1 of grain at field
price. Fertilizers price of DAP and Urea, and seed price of Teff were 15.12, 11.26 and 25.91
ETB kg-1, respectively. A wage rate of 50.00 ETB per work-day and oxen plow rate of 150.00
ETB per work day were used.
The partial budget presented in (Table 3) showed that the least total variable cost (TVC) was
recorded by control treatment (without fertilizer), while the highest net benefit (NB) was
obtained from STBCRPR (10899.16 ETB ha-1), which gave 24.42% higher NB than farmers
practices fertilizer application. The analysis of marginal rate of return (MRR), on the other
hand, revealed that the rate of return per unit cost of production was highest from STBCRPR

177
177
Proceeding of Adaptation and Generation of Agricultural Technologies IQQO AGP-II
(% MRR = 206.16). This showed that it would yield 2.06 Ethiopian Birr for every Birr
invested.
Table 3. Partial budget with dominance and marginal rate of return analysis to establish the
profitability of teff production with Soil Test Based Crop Response Phosphorus
Recommendation at Omo Nada district
Partial budget with dominance
Treatments Yield
(Kg ha-1)
GFB
(ETB ha-1)
VC
(ETB ha-1)
NB
(ETB ha-1)
Dominance
Control (without fertilizer)
740.00
11840 .00
3779.60
8060.40
Blanket recommendation 848.57 13577.12 4817.34 8759.79 Un dominated
STBCRPR 1047.14 16754.24 5855.08 10899.16 Un dominated
Marginal rate of return (MRR %)
Treatments TVC
(ETB ha-1)
NB
(ETB ha-1)
Incremental
MRR
(%)
cost benefit
Control (without fertilizer) 3779.60 8060.40
Blanket recommendation 4817.34 8759.79 1037.74 699.39 67.40
STBCRPR 5855.08 10899.16 1037.74 21.37 206.16
Conclusion and recommendation
STBCRPR was superior to both farmer’ practices and control, Hence STBCRPR is selected
for the recommendation on Teff at Omo Nada district. Therefore awareness should be created
for farmers through demonstration. To sustain and/or improve the current soil fertility status
of the study sites, integrated soil fertility management practices (soil conservation, lime
application, crop rotation) can improve the current situation.
References
Abaidioo, R.C., Keyser, H.H., Singleton, P.W. and Borthakur, D. (2000). Bradyrhizobium
spp. (TGx) isolatesnodulating the new soybean in Africa are diverse and distinct
from bradyrhizobia that nodulate North American soybeans.
International journal of Systematic and Evolutionary Microbiology 50:225-234.
ETB = Ethiopian Birr; GFB = Gross field benefit; TVC = Total variable cost; NB = Net benefit; MRR =
Marginal rate of return; STBCR PR= Soil Test Based Crop Response Phosphorus Recommendation

178
178
Proceeding of Adaptation and Generation of Agricultural Technologies IQQO AGP-II
Beets, W.C., 1982. Multiple Cropping and Tropical Farming System. Gower, London, Britain
and West Views Press Colorado, USA. 256p.
Chatterjee, B.N. and S. Maiti, 1994. Cropping System; Theory and Practice. Oxford and BBH
Publishing Co, New Delhi, Bombay, Calcutta. 323p.
CIMMYT, 1988. From Agronomic Data to Farmer Recommendation: An Economics
Training Manual . Completely Revised edition. Mexico , DF .
Dagne Chimdessa, 2016. Soils Characteristics in Maize Based Farming System of Western
Oromia, Ethiopia. Journal of Energy and Natural Resources. 5 ; 37-46.
FAO, 1984. Fertilizer and plant nutrition guide. Food and Agriculture Organization of the
United Nations, Rome. pp. 54-67.
FAO, 2008.Efficiency of soil and fertilizer phosphorus use Reconciling changing concepts of
soil phosphorus behavior with agronomic information. Bulletin 18.
Kelsa Kena, Tadesse Yohannes and Tesfa Bogal, 1992. Influence of fertilizer and its related
management practices on maize grain yield in major producing areas of Ethiopia. pp.
15-104.Proceedings of the First National Maize Workshop of Ethiopia 5-7 may,
1992 Addis Ababa, Ethiopia.
Mesfin Abebe, 1998. Nature and management of Ethiopian soils. Alemaya University,
Ethiopia. 272p.
Mokwunye, A.U., A. de Jager and E.M.. Smailing, 1996. Restoring and maintaining the
productivity of West Africa Soils: Key to sustainable development. International
Fertilizer Development Center (IFDC), Muscle Shoals, Alabama. 94p.
Olsen, S.R., C.V. Cole, F.S. Watanabe and L.A. Dean, 1954. Estimation of available pho
sphorous in soils by extraction with sodium bicarbonate. USA Circular J. 939: 1-19.
Quinenes, M., A. Foster, D. Akibo and N.P. Siclima, 1992. Methodology used by SG 2000
Project in Africa for transfer of improved production technologies to small scale
farmer. pp. 149- 153.Proceeding of the First National Maize Workshop of
Ethiopia, Addis Ababa.
Tamirie Hawando, 1982. Problems of soils and its implications on crop improvement program
in Ethiopia context. Department of plant science, college of Agriculture, Addis
Ababa University. pp 5-12

179
179
Proceeding of Adaptation and Generation of Agricultural Technologies IQQO AGP-II
Tekalign Mamo and I. Haque, 1987. Phosphorous status of some Ethiopia soils. Sorption
characteristics. Plant and Soil. 102: 261-266.
Yihenew Gebreselssie, 20002. Selected chemical and physical characteristics of soils of Adet
Research Center and its testing sites in Northwestern Ethiopian. Society of Soil
Science. Ethiopian J, Natural. Resource. 4: 199-215

180
180
Proceeding of Adaptation and Generation of Agricultural Technologies IQQO AGP-II
Verification of soil test based crop response phosphorus calibration on maize (Zea mays)
at Wayu-Tuka district, Western Oromia.
Refiissa Leta* and Chaltu Regassa
Nekemte Soil Research Center, Oromia Agricultural Research Institute,
P.O.Box 587, Nekemte, Ethiopia
Corresponding author: Email: [email protected], Mobile: 0911-085-345
Abstract
The experiment was carried out on nine farmers’ field at Wayu-Tuka district, Western Oromia
in 2016 cropping season using optimum amount of urea (200kg/ha), critical P-value
(4.23ppm) and the phosphorus requirement factor ( 9.58) determined during soil test based
maize crop fertilizer response recommendation study in the years 2014 and 2015. The
experiment has three treatment including control (without fertilizer), farmers practices
(blanket recommendation) and soil test based crop fertilizer response recommendation (p
calculated value from Pc, Pf and initial soil available P). Improved maize variety BH-
661were used and sown at 75*30 cm inter and intra row spacing. The experimental design
was randomized complete block design with three replication having 10*10m plot size for
each treatment. These are zero, farmers practice (50 kg/ha) and recommended rate of P
which based on initial soil value. Mean grain yield of maize was highest for plots treated with
recommended rate having initial P- value less than critical P-value than farmers practice and
control. Whereas, plots having initial soil P-value equal and/or greater than critical P-value
gave more or less equal maize grain yield for the three treatments as they were equally
treated with the same amount of urea.
Key words: BH-661, critical p-value, phosphorus requirement factor, initial soil p-value

181
181
Proceeding of Adaptation and Generation of Agricultural Technologies IQQO AGP-II
Introduction
Soil fertility depletion and widespread soil degradation are the major biophysical root causes
of declining per- capita food production and natural resource conservation in Sub-Saharan
Africa (Sanchez et al., 1997; Farouque and Tekeya, 2008). In Ethiopia, century-long, low-
input agricultural production systems and poor agronomic management practices, limited
awareness of communities and absence of proper land-use policies have aggravated soil
fertility degradation (Getachew and Bekele, 2005). This has also encouraged the expansion of
farming to marginal, non-cultivable lands, including steep landscapes and range lands.
Phosphorous is the most yield limiting of soil-supplied elements, and soil P tends to decline
when soils are used for agriculture (David and David, 2012). Studies have demonstrated that
Nitisol areas in Ethiopia are marginally to severely deficient in P (Bekele et al., 1996, 92-99;
Regassa and Agegnehu 2011, 103-112). In Ethiopia, the blanket recommendations that are
presently in use all over the country were issued several years ago, which may not be suitable
for the current production systems (Bekele et al., 2002, Zeleke et al., 2010). Since the spatial
and temporal fertility variations in soils were not considered, farmers have been applying the
same P fertilizer rate to their fields regardless of soil fertility differences.
Calibration is a means of establishing a relationship between a given soil test value and the
yield response from adding nutrient to the soil as fertilizer. It provides information how much
nutrient should be applied at a particular soil test value to optimize crop growth without
excessive waste and confirm the validity of current P recommendations (Evans 1987,
McKenzeie and Kryzanowski 1997, 17-19). They enable to revise fertilizer recommendations
for an area based on soil and crop type, pH and soil moisture content at time of planting. An
accurate soil test interpretation requires knowledge of the relationship between the amount of
a nutrient extracted by a given soil test and the amount of plant nutrients that should be added
to achieve optimum yield for a particular crop (Muir and Hedge 2002, 32-33; Watson and
Mullen 2007. Soil tests are designed to help farmers predict the available nutrient status of
182
182
Proceeding of Adaptation and Generation of Agricultural Technologies IQQO AGP-II
their soils. Once the existing nutrient levels are established, producers can use the data to best
manage what nutrients are applied, decide the application rate and make decisions concerning
the profitability of their operations (Agegnehu and Lakew, 2013). However, local assessments
for the soil P critical levels and soil P requirement factors even for the major crops of the
country are negligible. Currently, soil fertility research improvement is agreed with respect to
Site specific fertilizer recommendation in the country.
An accurate soil test interpretation requires knowledge of the relationship between the amount
of a nutrient extracted by a given soil test and the amount of plant nutrients that should be
added to achieve optimum yield for each crop (Sonon and Zhang, 2008). Calibrations are
specific for each crop type and they may also differ by soil type, climate, and the crop variety.
Having this knowledge, Nekemte Soil Research Center under taken soil test besed maize crop
fertilizer P response calibration study at Wayu-tuka distrcit on Nitosols during the years 2014
and 2015 and determined Optimum nitrogen rate (200 kg/ha), P-critical (4.23 ppm) and P-
requirement factor (9.58). But similar to any other investigated or improved technology, to
have confidential on technology dissemination to end users, the economic visibility and
acceptance of the technology should be verified at the same area. Therefore, the objectives of
this study were to verify critical P-value with the relative yield response of maize on Nitisols
at Wayu-tuka district of East Wollega Zone and determine the critical P concentration and P
requirement factor.
Materials and methods
Experimental Site
Verification of phosphorus response trials with maize was conducted on farmers’ fields in
2016 during the main cropping seasons at Wayu-tuka district in East Wollega Zone of
Western Ethiopia. Wayu-tuka is located at an altitude of 2080 masl and at geographical
location of 36.4622 degree latitude and 9.08833 degree longitude. Rain fall (mm) of the
experimental area for the last ten years reveals that highest precipitation was recorded in 2008
while the lowest was recorded in 2011 as shown below. The maximum and minimum

183
183
Proceeding of Adaptation and Generation of Agricultural Technologies IQQO AGP-II
temperature of the experimental area for the last ten years (2005-2014) also indicated in fig 2
below. Immense generous
Source: Ethiopian metrological agency,
Fig 1: Rain fall (mm) of the experimental area for the last ten years
Source: Ethiopian metrological agency
Fig 2: Maximum and minimum temperature of the experimental area
For the selection of representative trial sites across the area, nine soil samples (0-20 cm depth)
were collected from farmers’ fields before the onset of the trial in 2016. Soil samples were

184
184
Proceeding of Adaptation and Generation of Agricultural Technologies IQQO AGP-II
analyzed for pH using a ratio of 2.5ml water to 1 g of soil and available P using Olsen
method. Based on the soil available P content for each site P-fertilizer to be applied was
calculated by the formula P (kg/ha) = [Pc-P0]*Prf.
Experimental Procedures
The experiment was arranged in simple randomized complete block design with three
treatments referring phosphorus rates (zero, farmers practice (50 kg/ha) and recommended P
which varies from farmer to farmer based on initial soil P-value) and replicated three times.
The gross plot size was 10m x 10m (100m2) with spacing of 75cm*30cm. The harvested plot
area measured was 6m*6m (36m2). The sources of N and P were urea and DAP respectively.
All agronomic practices were applied based on local research recommendations. Land
preparation was done in accordance with a standard practice locally used. The experimental
plot was cultivated by an oxen-drawn. An improved maize variety BH-661 was used.
Cultivation, weeding, chemical spray and harvesting were done at the appropriate time
according to the research recommendations. Application of phosphorus fertilizer was done by
banding the granules at the time of planting. Nitrogen at the rate of 92 kg N ha-1was applied in
the form of urea in two splits [(1/2 at planting, and ½ after first weeding, after 20 days).
Table 1: Initial soil P-value and amount of fertilizers added for maize during the experimental
year (2016).
Experimental
sites
Initial soil P-
value (ppm)
(Olsen method
)
Amount of Urea added
(kg/ha)
Amount of DAP
added (kg/ha) C FP RR C FP RR
Site-I 27 200 200 200 0 50 0
Site-II 4.6 200 200 200 0 50 0
Site-III 4.58 200 200 200 0 50 0
Site-IV 8.24 200 200 200 0 50 0
Site-V 6.49 200 200 200 0 50 0
Site-VI 4.12 200 200 200 0 50 2.29
Site-VII 17 200 200 200 0 50 0
Site-VIII 2.39 200 200 200 0 50 38.32
Site-IX 2.6 200 200 200 0 50 33.95
Grand total - 1800 1800 1800 0 450 74.56
C=control, FP= farmers practice and RR= recommended rate based on initial soil P-value
185
185
Proceeding of Adaptation and Generation of Agricultural Technologies IQQO AGP-II
Data Collection
As the trial is a verification experiment only maize grain yield was collected.
Statistical Analysis
The data were subjected to analysis of variance (ANOVA) using the procedure of the SAS
statistical package version 9.0 (SAS Institute, 2001). Mean separation for the treatments was
done using least significant difference (LSD) test.
Results and discussions
Statistical analysis showed that grain yield of maize was significantly affected by treatments
and also by sites at 5% level of significance (Table 2). Analysis of variance show that
phosphorous had a highly significant effect on maize yield and yield consistently increased as
the rate of P increased to critical value. Highest number of maize grain yield (9966.7 kg/ha)
was recorded by treatment three (T3) followed by treatment two (T2), (9537.7 kg/ha) while
the lowest maize grain yield (8400 kg/ha) was recorded by treatment one (T1). Regardless of
the phosphorus and nitrogen fertilizer rates, sites also showed significant difference on grain
yield of maize (Table 2). This might be due to the variation among farmers on their farm land
management, cropping history and other cases.
Partial Budget Analysis
Economic analysis was performed to investigate the economic feasibility of the treatments.
Partial budget and marginal rate of return analyses were used. The average grain yield was
adjusted to 10% downwards to reflect the difference between the experimental yield and the
yield farmers will expect from the same treatment. The average open market price (4 Birr kg-
1) for maize crop and the official prices of DAP (16 Birr kg-1) and as well as cost for fertilizer
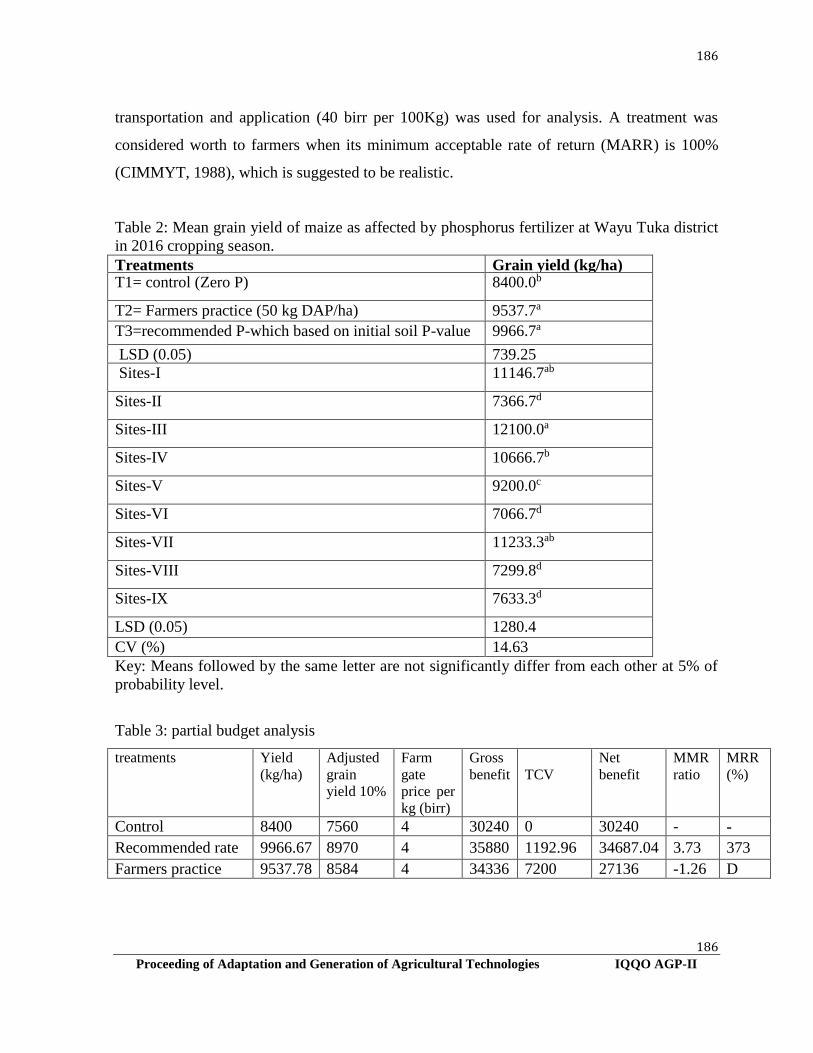
186
186
Proceeding of Adaptation and Generation of Agricultural Technologies IQQO AGP-II
transportation and application (40 birr per 100Kg) was used for analysis. A treatment was
considered worth to farmers when its minimum acceptable rate of return (MARR) is 100%
(CIMMYT, 1988), which is suggested to be realistic.
Table 2: Mean grain yield of maize as affected by phosphorus fertilizer at Wayu Tuka district
in 2016 cropping season.
Treatments Grain yield (kg/ha) T1= control (Zero P) 8400.0b
T2= Farmers practice (50 kg DAP/ha) 9537.7a
T3=recommended P-which based on initial soil P-value
9966.7a
LSD (0.05) 739.25
Sites-I 11146.7ab
Sites-II 7366.7d
Sites-III 12100.0a
Sites-IV 10666.7b
Sites-V 9200.0c
Sites-VI 7066.7d
Sites-VII 11233.3ab
Sites-VIII 7299.8d
Sites-IX 7633.3d
LSD (0.05) 1280.4
CV (%) 14.63
Key: Means followed by the same letter are not significantly differ from each other at 5% of
probability level.
Table 3: partial budget analysis
treatments Yield
(kg/ha)
Adjusted
grain
yield 10%
Farm
gate
price per
kg (birr)
Gross
benefit
TCV
Net
benefit
MMR
ratio
MRR
(%)
Control 8400 7560 4 30240 0 30240 - -
Recommended rate 9966.67 8970 4 35880 1192.96 34687.04 3.73 373
Farmers practice 9537.78 8584 4 34336 7200 27136 -1.26 D

187
187
Proceeding of Adaptation and Generation of Agricultural Technologies IQQO AGP-II
Application of soil test based recommended P-rate when combined with 200 kg/ha urea was
significantly increased grain yield of maize compared to the other treatments. The economic
analysis also showed that the highest net benefit (34687.04 ETB/ha) was obtained from
recommended treatment rate with marginal rate of return (373%) which is greater than the
minimum acceptable rate of return (100%).
Fig 1: Treand of grain yield of maize for the three treatments
Conclusion and recommendation
There were clear positive effects of P fertilizer on yield of maize on Nitisols of western of
Ethiopia. Across all nine sites, the critical soil P concentration was 4.23 mg ka-1 (Olsen
method). The results may be used as a basis for P fertilizer recommendations for the
production of maize on Nitisol areas. It can also be used for future intensification in other
areas for developing a system for soil- test P fertilizer recommendations. P fertilizer
application could be recommended for a build-up of the soil P to the critical value, or
maintaining the soil P at this level. Increasing P beyond this level, the cost of additional P
fertilizer to produce extra yield would likely be greater than the value of additional yield.
Thus, as the partial budget analysis reveals in table three and soils with available P status
below 4.23 mg kg-1, yield of maize could show a significant response to applications of P
fertilizers. Whereas in areas with available P status greater than 4.23 mg kg-1, the P
188
188
Proceeding of Adaptation and Generation of Agricultural Technologies IQQO AGP-II
concentration in the soil exceeds crop needs so that further addition of P fertilizer may not
result in a profitable yield increase. It can also be used for future intensification in other areas
for developing a system for soil test based fertilizer recommendation (Agegnehu et al., 2013).
References
Agegnehu Getachew and Berhane Lakew. 2013. Soil test phosphorous calibration for malt
barley production on Nitisols of Ethiopian highlands. Trop.Agric. 90: 177-187.
Bekele Taye, Belinash Tulema and Gebrageorges Gebre Kidan. 1996. “Soil fertility
management in Barley.” In Barley research in Ethiopia: past work and future prospects
edited by Hailu Gebre, van J. Leur, 92-99. IAR/ICARDA, Addis Ababa, Ethiopia.
Bekele Taye, Getachew
Gorfu and Selamiuhun Sertsu 2002. Results of Phosphorous Soil Test Calibration Study in
Hetosa Werede, Arsi zone: Proceeding of the Workshop on phosphorous soil test
calibration Study. Addis Ababa, Ethiopia: EIAR.
CIMMYT. 1988. From Agronomic Data to Farmer Recommends tions: An Economics
Workbook. Mexico, D.F., CIMMYT.
David M. E, and J.T. David. 2012. Modeling an Improvement in phosphorous utilization in
Tropical Agriculture. Journal of Sustainable Agriculture, 36: 18-35.
Farouque, M.G and H. Tekeya. 2008. Farmers’ use of Integrated Soil Fertility and Nutrient
Management practices for Sustainable Crop Production: A Field level Study in
Bangladesh. American Journal of Agricultural and Biological Sciences 3: 716-723.
Getachew Agegnehu and Taye Bekele. 2005. On-farm integrated soil fertility management in
wheat on Nitisols of central Ethiopian highlands. Ethiopian Journal of Natural
Resources 7: 141-155
McKenizie, R.H., and L. Kryzanowski. 1997. “Soil testing methods calibrated to phosphate
fertilizer trials.” Better Crops 81: 17-19.
Muir, J.H. and J.A. Hedge. 2002. “Corn response to phosphorous and potassium fertilization
at different soil test levels.” In Arkansas Soil Fertility Stugies edited by N.A.Slaton,
490: 32-33. University of Arkansas Agricultural Experiment Station Research Series.
Regassa Hailu and Getachew Agegnehu. 2011.” Potentials and limitations of acid soils in
highlands of Ethiopia: A review.” In Barley research and development in Ethiopia
edited by Beye Mulatu and S. Grando, 103-112. ICARDA, Aleppo, Syria.
Sanchez, P.A., K.D. Shepherd, M.J. Soule, F.M. Place, R.J. Buresh, A.M.N. Izac, A.U.
Mokwunye, F.R. Kwesiga, C.G. Ndiritu, and P.L. Woomer. 1997. Soil fertility
replenishment in Africa: An investment in natural resource capital, pp. 1-46. In: R.J.
Buresh et al. (ed.). Replenishing soil fertility in Africa. SSSA Special Publication 51.
SSSA, Madison, WI, USA.
SAS Institute Inc., SAS/C OnlineDocTM, Release 7.00, Cary, NC: SAS Institute Inc., 2001.
SAS/C OnlineDocTM, Release 7.00, April 2001.

189
189
Proceeding of Adaptation and Generation of Agricultural Technologies IQQO AGP-II
Watson, M. and R. Mullen. 2007. “Understanding soil test for plant- available phosphorous.”
Ohio State University, USA.
Zeleke Gete, Getachew Agegnehu, Dejene Abera, and Sofia Rashid 2010. Fertilizer and soil
fertility potential in Ethiopia: Constraints and opportunities for enhancing the system.
Washington, DC: IFPRI.
Evaluation of Different Drainage System on Grain Yield of Bread Wheat in
the Waterlogged Vertisol of Adaba & Agarfa District, southeast Ethiopia
Negash Bedaso, Mulugeta Eshetu, Tilahun Chibsa, Shure Seboka, Chala Chimdessa and
Abduraman Hussen
Oromia Agricultural Research Institute, Sinana Agricultural Research Center; PO. Box: 208;
Bale-Robe, Ethiopia
Corresponding author *[email protected].
ABSTRACT
Vertisols cover large part of the high rainfall areas of Ethiopia. However, the potential of
these soils is not well exploited because of heavy water logging during the main rain season;
this problem can be mitigated using different drainage systems. A field experiment was
conducted from 2015-2017 G.C. during "Gena" (from August to Decemeber) cropping season
to investigate the effects of different drainage systems on yield and yield components of bread
wheat (“Madda walabu”} verities on the waterlogged Vertisols of Adaba and Agarfa districts
in the West Arsi and Bale Highlands of Southeastern Ethiopia, respectively. The experimental
design was randomized complete block design (RCBD) with treatments (broad bed and
furrow (BBF), camber bed land form and a control (farmer practices) were used in three
replications. The plot size for the treatments was 7.8 m by 4.5 m (35.1 m2). Camber beds were
formed to make a raised profile 5 m wide and 50 cm high from the furrow to the top of the
bed. The broad bed and furrow (BBF) system used an 80 cm wide bed and 40 cm furrow
between beds. The result revealed that out of the different proper drainage system used in the
present study, camber bed had brought a significant yield improvement over the others viz
broad bed furrow (BBF) and the famers’ practice in particular. The highest bread wheat
biomass yield of 8.2 t ha-1 which is 39% higher over the farmers practice (flat bed) were
recorded under camber bed; followed by broad bed and furrow which gave 15% higher
biomass yield over the farmers’ practices. Similarly the highest grain yield of 5.8 t ha-1 which
is 45% higher over the famers’ practice was obtained when the bread wheat was grown using
camber bed, followed by broad bed and furrow (4.9 t ha-1) which was 22% higher over the

190
190
Proceeding of Adaptation and Generation of Agricultural Technologies IQQO AGP-II
farmers practices (flat bed). In addition, the application of both camber bed and broad bed and
furrow practices resulted in significantly higher values of plant height, spike length, number
of seeds per spike, number of tiller and spike lengths of “Mada walabu” bread wheat
varieties. The current study recommended both camber bed and broad bed and furrow for
mitigation of water logging in Vertisols at Adaba and Agarfa for production of bread wheat.
As future recommendation need to disseminate the results of the present study to the end users
were, high moisture stress is the limiting factor in Vertisols for sustainable crop production in
highlands of Bale at large.
Key words: Camber bed, Broad bed and furrow (BBF), bread Wheat, water logging
Introduction
Vertisols cover large part of the high rainfall areas of Ethiopia. However, the potential of
these soils is not well exploited because of heavy water logging during the main rainy season.
Vertisols are deep black clays which develop cracks when expanding and contracting with
changes in moisture content. Vertisol is the fourth soil order in Ethiopia covering about 12.7
million ha or about 10% that distributed in different part of the country (Mesfine, 1998).In
addition, there are 2.5 million ha of soils with vertic properties. While about 70% of these
soils are in the highlands, and about 25% (1.93 million ha) of the highland Vertisols are
cropped (Berhanu Debele, 1985). Vertisols are amongst the most common, high-potential
soils in the highlands of Ethiopia, where over 88% of human and 77% of livestock are located
(Erkossa, et al. 2005).
Farmers of the Vertisols area have realized the adverse effects of waterlogging on crop
productivity and have developed traditional methods for overcoming the problem. Their
strategy to utilize Vertisols has always been to plant late in the wet season, which means
harvesting a single crop and leaving the land under-utilized or idle (Tedla et al., 1993).
Generally, the traditional management of Vertisols in the Ethiopian highlands varies from
place to place depending on the amount and duration of rainfall, extent of drainage problems,
soil fertility and slope and farm size (Berhanu, 1985; Mesfin, 1998). Because waterlogging
resulted in poor aeration, lower soil microbial activities, loss and unavailability of plant
nutrients and poor workability (Trough and Drew, 1982). Waterlogging affect the amount of
oxygen in the soil,restricting aerobic respiration by growing roots and other living organisms.
Hence, soil chemical properties change when anaerobic conditions persist for several days,

191
191
Proceeding of Adaptation and Generation of Agricultural Technologies IQQO AGP-II
increasing the availability of some major or minor elements while decreasing the availability
of others and which will eventually have a negative effect on grain yield. Waterlogging also
denitrifay soil nitrogen and limits the wheat plant’s nutrient uptake by reducing plant
transpiration and diminishing root
These traditional land preparation techniques include flatbed planting, drainage furrows,
ridge and furrows, hand-made broad beds and furrows, post-rainy season planting and soil
burning (‘guie’) (Berhanu, 1985; Mesfin, 1998). Nevertheless, these soils are vastly
underutilized due to management difficulties using traditional cultivation practices (Mesfine,
1998). To minimize these difficulties it needs an identification and adoption of appropriate
moisture drainage technologies to the study areas for better production up to the potential of
the soil. Therefore this project was initiated to select appropriate moisture drainage system
through evaluation of the performance of bread wheat on waterlogged Vertisols under
different moisture drainage system.
Materials and methods
The experiment was laid out in RCBD with three replications using the following treatments,
T0 = Farmers’ practice (FB), T1= Cumber bed land form (CB) and T2 = Broad bed furrow
(BBF) conditions side by side on a land with uniform slope and similar history. The plot size
for all treatment was 7.8 m by 4.5 m (35.1 m2). Camber beds were formed to make a raised
profile 5 m wide and 50 cm high from the furrow to the top of the bed. The BBF system uses
an 80cm wide bed and 40 cm furrow between beds. In addition the distance between plots and
blocks (1 m) to minimize seed transfer during planting. Seed rate and fertilizer rates were the
recommended rates for each crop (41/20 N/P kg ha-1). Initial land preparation, crop
management factors was the same for all at each location. Data on plant height, biomass,
grain yield and TKW as well as soil sample analysis for pH, OC, total nitrogen and available
phosphorous were collected.
Data management and statistical analysis: Data collected was subjected to ANOVA using
GLM procedure of statistical analysis system of computer software (SAS, 1998) and LSD was
used for mean comparison, and combined analysis over location data was used for
interpretation.
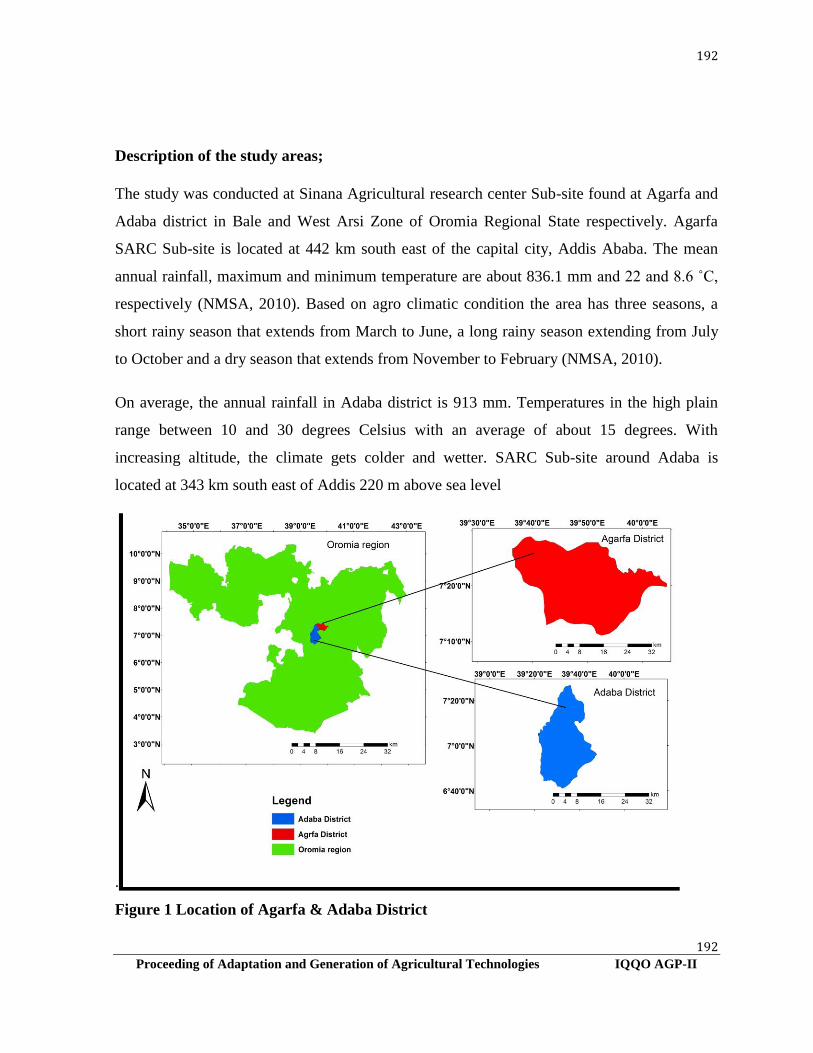
192
192
Proceeding of Adaptation and Generation of Agricultural Technologies IQQO AGP-II
Description of the study areas;
The study was conducted at Sinana Agricultural research center Sub-site found at Agarfa and
Adaba district in Bale and West Arsi Zone of Oromia Regional State respectively. Agarfa
SARC Sub-site is located at 442 km south east of the capital city, Addis Ababa. The mean
annual rainfall, maximum and minimum temperature are about 836.1 mm and 22 and 8.6 ˚C,
respectively (NMSA, 2010). Based on agro climatic condition the area has three seasons, a
short rainy season that extends from March to June, a long rainy season extending from July
to October and a dry season that extends from November to February (NMSA, 2010).
On average, the annual rainfall in Adaba district is 913 mm. Temperatures in the high plain
range between 10 and 30 degrees Celsius with an average of about 15 degrees. With
increasing altitude, the climate gets colder and wetter. SARC Sub-site around Adaba is
located at 343 km south east of Addis 220 m above sea level
.
Figure 1 Location of Agarfa & Adaba District
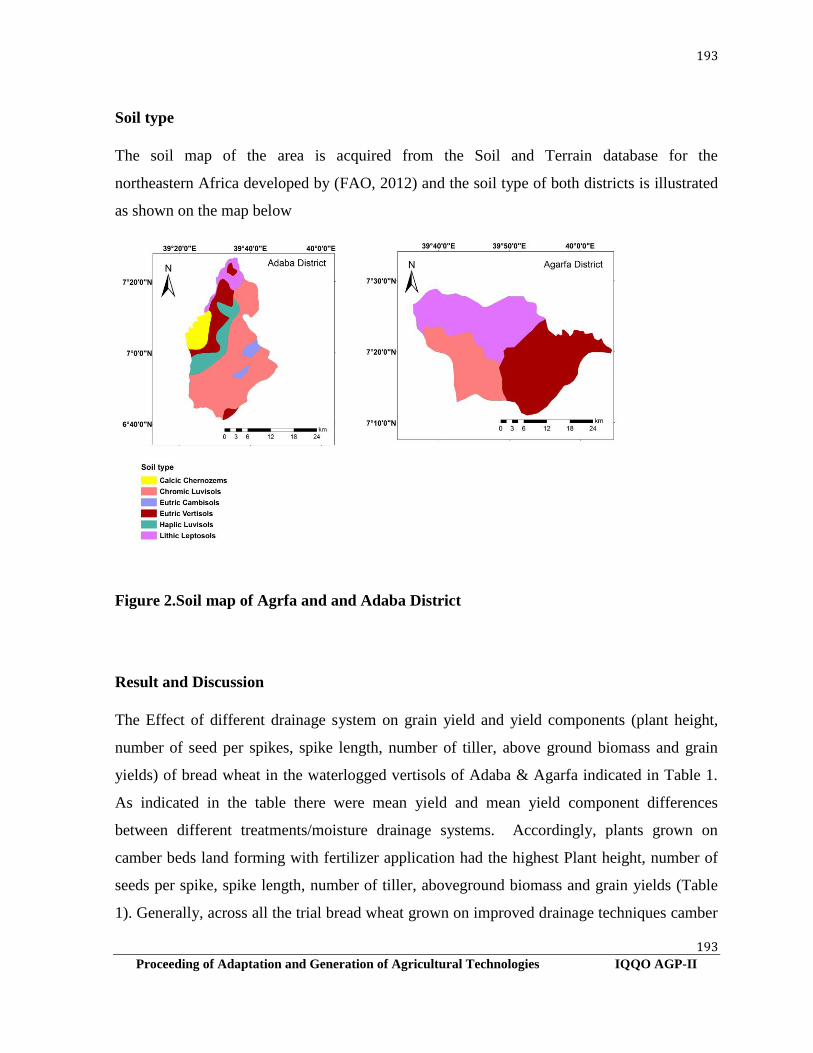
193
193
Proceeding of Adaptation and Generation of Agricultural Technologies IQQO AGP-II
Soil type
The soil map of the area is acquired from the Soil and Terrain database for the
northeastern Africa developed by (FAO, 2012) and the soil type of both districts is illustrated
as shown on the map below
Figure 2.Soil map of Agrfa and and Adaba District
Result and Discussion
The Effect of different drainage system on grain yield and yield components (plant height,
number of seed per spikes, spike length, number of tiller, above ground biomass and grain
yields) of bread wheat in the waterlogged vertisols of Adaba & Agarfa indicated in Table 1.
As indicated in the table there were mean yield and mean yield component differences
between different treatments/moisture drainage systems. Accordingly, plants grown on
camber beds land forming with fertilizer application had the highest Plant height, number of
seeds per spike, spike length, number of tiller, aboveground biomass and grain yields (Table
1). Generally, across all the trial bread wheat grown on improved drainage techniques camber
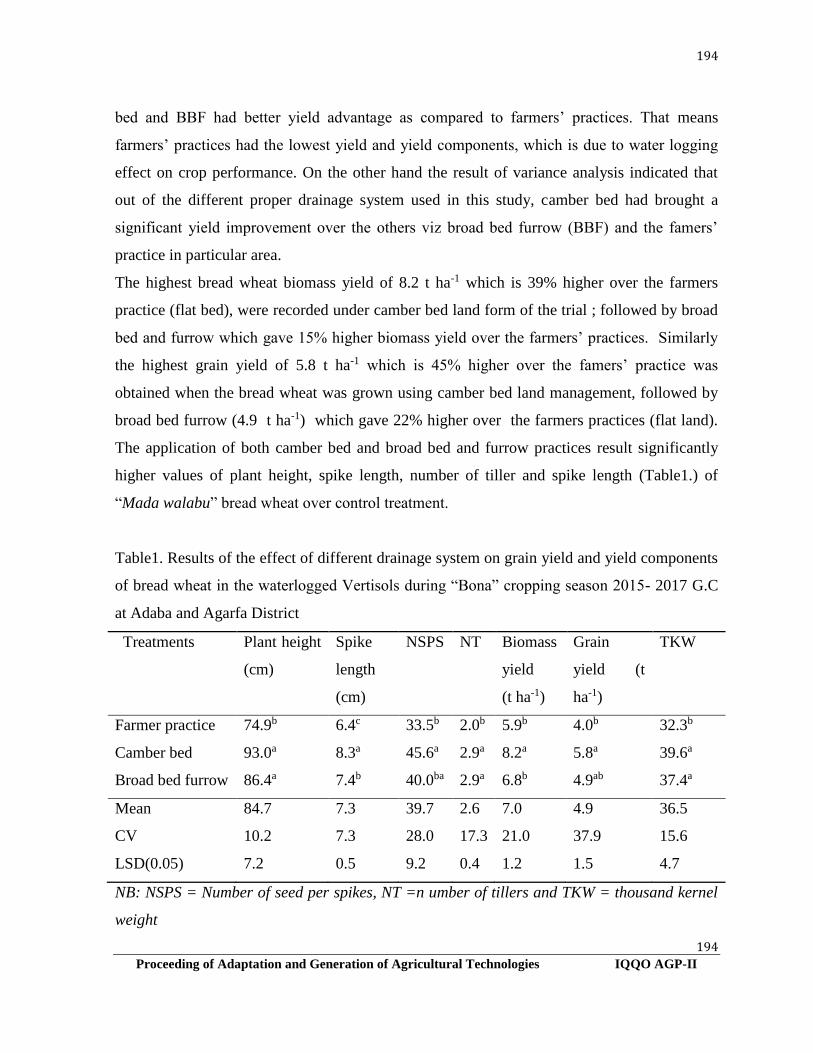
194
194
Proceeding of Adaptation and Generation of Agricultural Technologies IQQO AGP-II
bed and BBF had better yield advantage as compared to farmers’ practices. That means
farmers’ practices had the lowest yield and yield components, which is due to water logging
effect on crop performance. On the other hand the result of variance analysis indicated that
out of the different proper drainage system used in this study, camber bed had brought a
significant yield improvement over the others viz broad bed furrow (BBF) and the famers’
practice in particular area.
The highest bread wheat biomass yield of 8.2 t ha-1 which is 39% higher over the farmers
practice (flat bed), were recorded under camber bed land form of the trial ; followed by broad
bed and furrow which gave 15% higher biomass yield over the farmers’ practices. Similarly
the highest grain yield of 5.8 t ha-1 which is 45% higher over the famers’ practice was
obtained when the bread wheat was grown using camber bed land management, followed by
broad bed furrow (4.9 t ha-1) which gave 22% higher over the farmers practices (flat land).
The application of both camber bed and broad bed and furrow practices result significantly
higher values of plant height, spike length, number of tiller and spike length (Table1.) of
“Mada walabu” bread wheat over control treatment.
Table1. Results of the effect of different drainage system on grain yield and yield components
of bread wheat in the waterlogged Vertisols during “Bona” cropping season 2015- 2017 G.C
at Adaba and Agarfa District
Treatments Plant height
(cm)
Spike
length
(cm)
NSPS NT Biomass
yield
(t ha-1)
Grain
yield (t
ha-1)
TKW
Farmer practice 74.9b 6.4c 33.5b 2.0b 5.9b 4.0b 32.3b
Camber bed 93.0a 8.3a 45.6a 2.9a 8.2a 5.8a 39.6a
Broad bed furrow 86.4a 7.4b 40.0ba 2.9a 6.8b 4.9ab 37.4a
Mean 84.7 7.3 39.7 2.6 7.0 4.9 36.5
CV 10.2 7.3 28.0 17.3 21.0 37.9 15.6
LSD(0.05) 7.2 0.5 9.2 0.4 1.2 1.5 4.7
NB: NSPS = Number of seed per spikes, NT =n umber of tillers and TKW = thousand kernel
weight

195
195
Proceeding of Adaptation and Generation of Agricultural Technologies IQQO AGP-II
The fact from this experiment is similar with an experiment done by Duah-Yentumi et al.
(1992) using camber beds and ridges, in comparison with flatland, on the Vertisols in Ghana
indicated that the camber beds resulted in highest maize yield of 2215 kg ha-1, followed by
that on ridges (1504 kg ha-1) and the lowest on flats (851 kg ha-1),
Figure 3.Results of the effect of different drainage system on grain yield and yield components of
bread wheat in the waterlogged Vertisol
Conclusion and recommendation
The problem of high waterlogging in vertisol can be mitigated using different drainage
systems. In view of the profound influences of climate and crop management practices, the
choice and design of the conservation techniques should be done accordingly. As combined
analysis over location indicate, the highest bread wheat biomass yield of 8.2 t ha-1 which was
39% higher over the farmers practice (flatbed) were recorded under camber bed; followed by
broad bed and furrow which gave 15% higher biomass yield over the farmers’ practices.
Similarly the highest grain yield of 5.8 t ha-1 which is 45% higher over the famers’ practice
was obtained when the bread wheat was grown using camber bed , followed by broad bed
furrow (4.9 t ha-1) which gave 22% higher over the farmers practices (flat bed). The
application of both camber bed and broad bed and furrow practices resulted in significantly
higher plant height, spike length, number of seeds per spike, number of tiller and spike length
(Table1.) of “Mada walabu” bread wheat varieties over control treatment. The study

196
196
Proceeding of Adaptation and Generation of Agricultural Technologies IQQO AGP-II
recommended the use of both camber bed and broad bed and furrow as a drainage technique
for mitigation of water logging for production of bread wheat under waterlogged area of
Adaba and Agarfa. Finally, disseminating camber bed and broad bed and furrow as future
recommendation to the end users is paramount importance at large.
References
Ahenkora Y. 1995. Management of Vertisols for sustained rain fed small-holder production in
Ghana. Ghana-Vertisol IBSRAM Project, Phase1. Final tech. Report to ODA and
IBSRAM, pp. 40–45.
Berhanu Dabale.1985. The Vertisol of Ethiopia: Their properties, classification and
management. Pp. 31-54. In: fifth meeting of the East African Soil Correlation and
Land Evaluation Sub-Committee, 4-10 December 1983, Wad Medani Sudan. World
Soil Resource Report 56. FAO (Food and Agricultural Organaization of the United
Nations), Rome.
Duah-Yentumi S. E., Owusu-Bennoah E., Oteng J. W., Acquah D. K. and Ahenkorah Y.
1992. Improving the management of Vertisols for sustainable cropping. Report on the
major season trial with maize on Vertisols of the Accra Plains. In Africaland.
Management of Vertisols in Africa. Network Document No. 3, pp. 19–23. IBSRAM,
Bangkok.
Mesfin Abebe, 1998. Nature and management of Ethiopian soils. Alemaya University of
Agriculture, Ethiopia. 272p.
NMSA. (2010). National Meterological Service Agency. Meterological data, Bale robe,
Ethiopia.
Muchena F. N. and Ikitoo E. C. 1992. Management of Vertisols in semiarid areas of Kenya:
the effect of improved methods of surplus soil/surface water drainage on crop
performance. Report of the 1992 Annual Meeting on Africaland Management of
Vertisols in Africa. Network document No. 3. IBSRAM, Bangok.
SAS, 1989. SAS/STAT* User’s guide, version 6, vo. l.1.2, 4th ed. SAS Institute Inc., Cary,
NC, pp: 1-846.

197
197
Proceeding of Adaptation and Generation of Agricultural Technologies IQQO AGP-II
Teklu, E., K. Stahr, and Gaiser, T. 2005. Effect of different methods of land preparation on
runoff, soil and nutrient losses from a Vertisol in the Ethiopian highlands. Soil Use
Management, 21, 253-259.
Trough, M.C.T. and Drew, M.C. 1982: Effects of water logging on young wheat plants
(Triticum aestivum L.) and on soil solutes at different soil temperatures. Plant and Soil.
69, 311-326.
Moisture Conservation and Management Practices on Yield and yield
components of Maize in the Dry land of Bale, Southeastern Ethiopia
Chala Chimdessa, Mulugeta Eshetu, Tilahun Chibsa, Shure Seboka, Negash Bedasso and
Abduraman Hussen
Sinana Agricultural Research Center, P.O. Box 208, Bale Robe, Ethiopia
Corresponding authors: [email protected]
Abstract
Extreme variation in rainfall distribution during the cropping seasons often results in low moisture
stress condition which affects crop yields. A field experiment was undertaken from 2015 to 2017 G.C.,
during ?gana (from August to December) cropping season to study the effects of In situ moisture
conservation and management on yield and yield components of improved maize variety (Melkasa II)
at lowland of Bale (Goro and Ginnir districts), southeastern Ethiopian. The layout of experimental
design was randomized complete block design (RCBD) using three treatments (flat bed, ridging and
furrow with ties, and ridging and furrow without ties (open furrow)) with three replications. The plot
size for the treatments was 8m x 6m (48 m2). The results revealed that out of the different In situ
moisture conservation measures ridging and furrow with ties for Goro District and ridging and furrow
without ties (open furrow) for Ginnir district resulted in significantly higher yield improvement over
the famers’ practice (flatbed). The highest maize biomass yield of 6.0 t ha-1 which is 29% higher and
grain yield of 5.3 t ha-1 which is 28% over flatbed was recorded under ridging and furrow with ties for
Goro district. Whereas ridging and furrow without ties (open furrow) gave the highest grain yield of
8.8 t ha-1 (64%) and 11.6 t ha-1 (28%) for Harawa I and Ebisa of Ginnir district. Moreover, practices of
In situ moisture conservation of both ridging and furrow with ties for Goro; ridging and open furrow
for Ginnir districts resulted in significantly higher plant height, number of ear per plant, ear length,
number of kernel per ear (NKPE), biomass, grain yield, thousand kernel weight of “Malkasa II ”
maize variety. The present study recommended both ridging and furrow with ties and furrow, and

198
198
Proceeding of Adaptation and Generation of Agricultural Technologies IQQO AGP-II
furrow without ties (open furrow) for mitigation of low moisture stress at Goro and Ginnir districts,
respectively for production of maize. Therefore, demonstrating and popularizing these technologies in
low land of Bale zone, where moisture deficit is limiting factor for maize crop production, will be the
next measure to be taken by the extensions’.
Key word: moisture conservation, ridging, furrow, ties
Introduction
Periodic low soil moisture due to erratic and poorly distributed rainfall, severe soil erosion
and runoff loss of water and the resultant low soil fertility are the prominent causes for the
low agricultural productivity in the semi-arid areas of Ethiopia. In addition to accelerated soil
erosion and the alarming rate of land degradation, the loss of water as runoff coupled with
periodic drought during the cropping season on degraded lands was equally important in rain-
fed crop production (Tamirie, 1986; Heluf and Yohannes, 2002). The practice of judicial
water conservation undoubtedly plays a significant role in increasing agricultural production
in arid, semi-arid and sub-humid areas where agriculture is hampered by periodic droughts
and low soil fertility (Tamirie, 1986; Heluf, 1989; Heluf and Yohannes, 2002; Heluf, 2003).
Because moisture conservation and management practices provide better nutrient uptake and
higher yield as well as improve soil physic-chemical properties apart from reducing water and
nutrient losses. But there is no available information in the area to use either of the physical
moisture conservation methods available, which is efficient at those specific study areas.
Therefore, this experimental design of different structural moisture conservation methods in
the study area was intended to address low moisture problem for maize crop production on
sustainable bases. Thus, the objective of the experiment was to see the effect of different in
situ moisture conservation practices on yield and yield component of maize at Goro and
Ginnir districts of Bale Zone.
Materials and Methods

199
199
Proceeding of Adaptation and Generation of Agricultural Technologies IQQO AGP-II
The design used was RCBD in three replications. The treatments included flatbed (T0) as a
control treatment that practiced commonly by farming community in the study areas, In situ
rainwater harvesting practices (flatbed (T0), ridging and furrow with ties (T1), and ridging
and furrow without ties (open furrow) (T2).. The treatments identified as T2 and T3 were
applied two week before planting; T1 was applied at planting time. Each treatment was
applied on a plot size of 8m x 6m (48 m2), the distance between blocks and within plots are
2m. The spacing between plants within a row 0.25 m, between rows 0.75 m, between tied
ridges 0.75 m and between ties was 2 m. An oxen plow tied ridger implement was used for
constructing ridges of 0.3 m height. The time of application of all recommended P rate was at
planting but N was applied in split: 1/2 at planting, 1/2 after 35 days after sowing. The
seeding rate used was 25kg ha-1. All cultural management practices (such as two times hand
weeding during the cropping season) were equally made for all plots.
Data of water use efficiency of maize (daily rainfall amount until crop to the harvesting), soil
moisture from 0 – 0.3 m soil depth using soil auger at sowing and harvesting of crop, plant
height, ear height (PH), number of ears per plant (NEPP), ear length(EL), number of rows per
ear (NRPE), number of kernels per row (NKPE), biomass (BY), grain yield (GY), thousand
kernel weight (TKW) were collected. Finally, all agronomic data were recorded in EXCEL
and subjected to ANOVA using GLM procedures of SAS (2004) and LSD was used to
compare treatments mean.
Results and Discussion
Results of the effect of different method of moisture conservation practices on yield and yield
components (PH, NEPP, EL, NKPE, BM, GY, and TKW) of maize at Goro district of Bale
zone indicated that there were statistically higher significant differences (Table 1).
Accordingly, the result of analysis of variance indicated that out of the different in situ
moisture conservation techniques used in this study treatment, ridging and furrow with ties
showed significantly higher yield improvement over ridging and furrow without ties (open
furrow) and the farmers’ practice at Goro district. On the other hand, ridging and furrow
without ties (open furrow) resulted in significantly higher values of “Malkasa II ” maize yield
and yield components at Ginnir district. The highest maize BY of 6.0 t ha-1 which is 32.8%

200
200
Proceeding of Adaptation and Generation of Agricultural Technologies IQQO AGP-II
and GY of 5.3 t ha-1 which is 28.3% higher were recorded under ridging and furrow with ties
over the flat bed. Generally, across all moisture conservation trial areas, maize grown on
ridging and furrow with ties, and furrow and ridge without ties had better yield advantage as
compared to farmer practices. That means farmers’ moisture conservation practices resulted
in lowest yield and yield components, which is due to the problem moisture stresses.
According to Heluf and Yohannes (2002) findings, which support this experiment result, tied
ridge has resulted in yield increments of 15 to 50% on maize and increment of 15 to 38% on
sorghum was recorded on different soil types of eastern Ethiopia. Similarly, Heluf (2003)
stated that the increased yield of sorghum using tied ridge moisture conservation method
could be attributed to the reduced surface runoff, reduced risk of erosion and soil nutrients,
and also due to increased water holding capacity of the soil.Another advantage of tied ridge
was decreasing surface runoff from the field and increase water retention capacity of the field.
Similar finding was reported by Macartney et al. (1971) who reported that tied ridging in
Tanzania gave higher maize yields in high rainfall areas although this was an exceptional
case. According to Et-Swaify et al (1985)’s summaries, these system in Africa has been
beneficial not only for reducing run-off and soil loss, but also for increasing crop yields.
Table 1. The combined analysis results of the effect of In-situ moisture conservation practice
on yield and yield components of maize, at Goro District at “Gana” cropping seasons during
2015- 2017
Treatments PH
(cm)
NEPP EL(cm) NKPE BY (t ha-
1)
GY (t ha-
1)
TKW
Flatbed( control) 145.52b 18.96c 1.0c 33.27b 4.67b 4.13b 221.27b
Ridging and furrow with ties 171.59a 25.11a 1.61a 35.92a 6.0a 5.30a 284.45a
Furrow and Ridge without ties 162.26a 22.18b 1.28b 35.08ba 5.61a 5.08ba 256.19a
Mean 159.79 22.08 1.30 34.76 5.43 4.84 253.97
CV (%) 7.73 13.01 19.89 7.09 12.92 21.78 12.66
LSD(0.05) 12.03 2.80 0.25 2.40 0.68 1.02 31.28
NB: PH = Plant height, NEPP = Number of ear per pant, EL= ear length, NKPE = Number of
kernel per ear, By = biomass yield, GY = Grain Yield , TKW = Thousand kernel weight

201
201
Proceeding of Adaptation and Generation of Agricultural Technologies IQQO AGP-II
Effect of moister conservation practices on Soil Moisture (after 75 days of planting)
Different moisture conservation practices were also affected soil water storage at 0.3 m.
Greater soil moisture was recorded by tied ridge (17.4%) which was 18% over farmers
practice, followed by furrow and ridge 16.2% which is 10% higher moisture content over the
flat bed thereby improving growth and yield of maize. At flowering stage maize crop
experienced moisture stress in the case of flat bed.
.
Figure 1. Effect of moisture conservation practice on water use efficiency of Maize during
2015 at Goro
As shown in figure 1, water use efficiencies under the different moisture conservation
practices differed significantly higher as compared to flat bed. In this study Tied ridge
resulted in 56% moisture conservation advantage over the farmers practices; followed by
furrow and ridge which is 37% higher water use efficiency. Similarly, Tied-ridging increased
sorghum grain yield by more than 40% and soil water by more than 25% in northern Ethiopia
(Gebreyesus et al., 2006). The tie act as a barrier for the rain water movement and increases

202
202
Proceeding of Adaptation and Generation of Agricultural Technologies IQQO AGP-II
contact time available for infiltration thus enhances the availability of soil moisture to the
crops (Rana, 2007). Studies also showed that lack of greater response to applied N and P
fertilizer in Ethiopia was probably due to soil water deficit which is the major yield-limiting
factor and profitable crop response to applied nutrients depends on soil water availability
(Tewodros et al., 2009).
Effect of Moisture Conservation Practice on yield and yield component of Maize at
Ginnir district
As indicated in Table 2 and 3, statistically significant diference were recorded on BY and GY
for the ridge and furrow treatments at both locations of Ginnir district (at Harawa I during
2015 and 2016, and Ebisa during, 2016 of “Belg” (April – July) cropping seasons) ;. Flatbed
resulted in lowest grain and biomass yield. From this study results ridging and furrowing
increased the yield of maize over the flat bed. Similarly, Channappa and Ashoka (1992)
reported that there was 11.67 per cent increase in yield of Sorghum in the ridge and furrow
system over the flat method of sowing. There was 40.8 per cent higher yield of pod in the
ridge-furrow method than the flat bed sowing systems.
Table 2. Effect of moisture conservation practice on yield and yield component of maize at
Harawa one of Ginnir District (Gana cropping season 2015- 2016)
Treatments PH (cm) NEPP EL(cm) NKPE BY (t ha-1) GY (t ha-1) TKW
Flat bed( control) 157.21b 1.0c 19.82b 26.55b 6.01c 5.39c 305.26b
Ridging and
furrow with ties
170.05ba 1.56b 21.72b 33.89a 8.13b 7.47b 347.75b
Furrow and Ridge
without ties
196.27a 2.26a 26.85a 37.78a 9.73a 8.81a 437.95a
Mean 174.51 1.61 22.79 32.74 7.96 7.22 363.66
CV 17.24 14.02 14.22 11.34 9.60 13.30 13.40
LSD(0.05) 37.03 0.28 3.99 4.57 0.94 1.18 59.82
Table 2 .Effect of moisture conservation practice on yield and yield component of maize at
Ebisa site of Ginnir District during 2016

203
203
Proceeding of Adaptation and Generation of Agricultural Technologies IQQO AGP-II
Treatments PH(cm) NEPP EL (cm) NKPE BM (t ha-1) GY (t ha-1) TKW
Flat bed( control) 186.25 1.25b 28.33 34.25 11.81c 9.04b 259.33
Tied Ridge (with ties) 182.5 1.33ba 29.08 34.04 13.54b 9.92ba 362
Furrow and Ridge
(without ties)
188.75 1.63a 28.48 34.71 15.14a 11.57a 370
Mean 185.83 1.40 28.63 34.33 13.49 10.18 330.44
CV 7.55 11.88 3.37 4.19 5.61 10.69 20.96
LSD(0.05) ns 0.33 Ns Ns 1.51 2.17 ns
Generally the experiment results indicated that maize yield and yield components were
affected by different moisture conservation practices. Hence, significant maize crop yield
increament resulted from ridging and furrowing moisture conservation practice.
Conclusion and Recommendation
Moisture stresses caused by shortage of rainfall, irregular distribution of rainfall and erratic
rainfall characteristics as well as excessive infiltration rate are the major limiting factor for
crop production at rain fed agricultural system. However, the problem of moisture stress for
rain fed agricultural systems can be mitigated by moisture conserving practices that improved
storage of soil moisture at root zone and by wisely using rain water integrating with different
crop management practices. In this respect, the uses of tied ridges showed significant
difference at these specific areas (specific climate and soil type). Hence, the use of moisture
conservation method might be affected by climatic condition and soil type of the area. .
Therefore, the authors’ recommend the use of closed end tied ridges and ridges and furrow at
Goro and Ginnir districts; respectively. In addition, strong extension work for demonstration
and poplarization of the determined technologies should have great attention to overcome
problem of moisture stress condition and to improve land productivity for rain fed maize
production in the study area. On the other hand the recommended moisture conservation
methods can be extrapolated to other area with similar climatic condition and soil type. .
References
204
204
Proceeding of Adaptation and Generation of Agricultural Technologies IQQO AGP-II
Channappa, T.C. and Ashoka, H.G.1992. Effect of Moisture Conservation Practices on yield
and yield component of Sorgum. Indian J. Soil Conserv., 20: 1-8.
El-Swaify, S.A. 1983.Conservation-Effective Farming Systems for the Semi-Arid Tropics,
ICRISAT, Hyderabad, India.
Gebreyesus, B.Wortmann, C.S., Martha, M., Heluf, G. and Amare, B. 2006. Micro-basin
tillage for grain sorghum production in semiarid areas of northern Ethiopia. Agronomy
Journal, vol. 98:124-128.
Gregory, P.J. 1991.Concept of water use efficiency. In: Harris, H.C., P.J.M. Cooper and M.
Pala (eds.), Soil and Crop Management for the Improved Water Use Efficiency in
Rainfed Areas ICARDA, pp: 9–20.
Heluf Gebrekidan and Yohannes Uloro. 2002. Soil and Water Conservation (tied ridges and
planting methods) on cultivated lands: The case of Eastern Ethiopia; Soil and Water
Managemen Research Program, Alemaya University. Un published. p154.
Heluf Gebrekidan. 1989. Summary Results of Completed Soil and Water Conservation and
Soil Fertility Projects in Hararghe Highlands, Eastern Ethiopia.
Heluf Gebrekidan. 2003. Grain Yield Response of Sorghum (Sorghum bicolor) to Tied
Ridges and Planting Methods on Entisols and Vertisols of Alemaya Area, Eastern
Ethiopia Highlands. Jou. Agriculture and Rural Development in the Tropics and Sub
Tropics. 104(2): 113-128.
McCarthey, J., Northwood, P., Degg, M. and Dawson, R. 1971. The effect of different
cultivation techniques on soil structure conservation and establishment and yield of
maize at Kongwa, Central Tanzania; Tropical Agriculture (Trinidad); vol. 48(1): 9–23.
Rana, D.S. 2007. Integrated Water Management, Management of Rain fed Agriculture. Indian
Agricultural Research Institute New Delhi – 110 012.
Tamirie, H., Heluf, G. and Yohannes, U. (1986). Summary Results of Completed Soil Science
Research Projects.Hararghe Highlands, Eastern Ethiopia (1981-1985 Crop Seasons);
Research Report. AUA, Alemaya. 108.
Tewodros, M., Gebreyesus, B., Wortmann, C.S., Nikus, O andMamo, M. 2009. Tied-ridging
and fertilizer use for sorghum production in semi-arid Ethiopia. Nutr. Cycl.
Agroecosys, vol.85:87-94

205
205
Proceeding of Adaptation and Generation of Agricultural Technologies IQQO AGP-II