agricultural technology adoption and adaptation under
TRANSCRIPT

The University of San FranciscoUSF Scholarship: a digital repository @ Gleeson Library |Geschke Center
Master's Theses Theses, Dissertations, Capstones and Projects
Spring 5-19-2017
Agricultural Technology Adoption and Adaptationunder Climate Change: Microevidence from NigerBERENGER DJOUMESSI TIAGUEUniversity of San Francisco, [email protected]
Follow this and additional works at: https://repository.usfca.edu/thes
Part of the Environmental Studies Commons, and the Food Security Commons
This Thesis is brought to you for free and open access by the Theses, Dissertations, Capstones and Projects at USF Scholarship: a digital repository @Gleeson Library | Geschke Center. It has been accepted for inclusion in Master's Theses by an authorized administrator of USF Scholarship: a digitalrepository @ Gleeson Library | Geschke Center. For more information, please contact [email protected].
Recommended CitationDJOUMESSI TIAGUE, BERENGER, "Agricultural Technology Adoption and Adaptation under Climate Change: Microevidencefrom Niger" (2017). Master's Theses. 215.https://repository.usfca.edu/thes/215

1
Agricultural Technology adoption and Adaptation Strategies
Under Climate Change: Micro-evidence from Niger
JEL Classifications: Q01, Q12, Q16, Q18
Berenger Djoumessi Tiague
Advisors: Pr. Jesse Antilla-Hugues and Solomon Asfaw
Department of Economics
University of San Francisco
2130 Fulton St.
San Francisco, CA 94117
Thesis Submission for the Masters of Science Degree
in International and Development Economics
e-mails: [email protected], [email protected], [email protected]
April 2017
Abstract: Many regions of Sub-Saharan Africa (SSA) are experiencing fast increases in human
population pressure and urbanization. By 2050, feeding a planet of 9 billion people will require an
estimated 50 percent increase in agricultural production. Farmers in in the Sahel are exposed to a highly
variable weather over time, and to their limited adaptive capacity, therefore often use livestock as
income generator, export earnings, and as insurance against weather risk. There is an increasing
demand for livestock products, which increase pressure on crop residues use on the land. In this study,
I use panel socio-economic data combined with village rainfall level from Niger to investigate how
different types of weather shocks including drought and wet conditions influence farmer’s inputs
adaption. Using cluster and year fixed effects estimations, I find that exposure to drought results in a
strong and deep decrease in use of crop residues on the soil, which is particularly concerning because
crop residue is crucial for soil protection, and fertility. I also find that one of the reasons poor Nigerien
farmers remove crop residues on their land, is for livestock feeding purposes. This results in a bad
synergy because removing crop residues could decrease long-term food production, and might keep
households in poverty trap. Other determinants affecting inputs adoption on the land including
temperature increase, income, farm size, and rainfall level of the previous year. I discuss policy
recommendations.
Key words: Weather variability; Agricultural technology adoption; Adaptation; Risk; Fixed effects; Niger.

2
Introduction
By 2050, feeding a planet of 9 billion people will need an estimated 50 percent increase in
agricultural production (World Bank). Climate change threatens agriculture and livestock assets
in complex ways. Food security is becoming a problem worldwide, affecting the world’s poorest.
At the regional level, the biggest losses in cropland due to climate change are likely to be in
Africa. The change in climate may consist of worsening weather conditions in some regions and
improved weather in other regions and in a world without transaction costs, there may be
migration from regions with deteriorating climate to regions with improving climate (Zilberman
et al., 2012). Climate change also has a direct and indirect effects on livestock assets, and other
assets. Direct effects occur on reproduction, animal growth, and its products; while indirect
effects occur on availability, and quality of animal feeds such as pasture and forage (Seo and
Mendelsohn, 2006a).
In poor countries for example, over the 1950–2003 period, a 1-degree Celsius increase in
temperature in each year reduced economic growth in that year by 1.1 percentage points (Dell et
al. 2008). Adapting to climate change could raise the expected agricultural payoffs (Kelly et al.,
2005). Using a survey conducted in Ethiopia, Di Falco et al. (2011) find that there were significant
differences in food productivity between farm households that adapted and those that did not
adapt. The speed of adjustment to changing climate is an important question in economics, and
is far-reaching for policy design across many domains (Hornbeck, 2012). Changes in the climate
involve the long run period, and the key empirical challenge is in anticipating how economic
agents will adapt in the light of these long run changes. In case of a large and rapid adjustment,
the resulting economic damages related to climate change could be minimal. If the adjustment is
slow or impossible, the global damages from climate change could be much larger. A strategy
used by farmers to adapt to changes in climate is adoption of different inputs. The problem is
that poor countries are most adversely affected by the negative effects, lack adaptation capacities,
and are constrained to implement short-term survival strategies. For example, poor farmers in
the Sahel are exposed to a highly variable weather over time and space, and farmers tend to use
livestock as source of income, and as insurance against weather risk (Fafchamps and Gavian,
1996). This leads to an increase in use of land crop residues, especially in dry periods, to feed the
animals, and keep them alive and healthy (Duncan et al, 2016).

3
Moreover, livestock is one of the fastest growing agricultural subsectors in developing
countries (33 % of GDP) and is quickly increasing. The total meat production in the developing
world tripled between 1980 and 2002, from 45 to 134 million tons (World Bank 2009). The
demand for animal products is expected to increase in Sub-Saharan Africa, especially West Africa,
by more than 250% by 2020 (Club du Sahel/OECD, 1998), driven by population growth,
urbanization and increasing incomes (Delgado 2005). The country of focus in this study is Niger,
which has the highest fertility rate in the world, is among the poorest countries in the world, and
highly food insecure. For poverty alleviation and hunger eradication, it becomes important to
look at how possession of livestock might influence strategies adopted by Nigerien farmers in the
field, which has been done by few studies.
The closest paper to this study is Solomon et al (2016). The authors use the 2011 World
Bank Niger cross-sectional data on farming households to investigate the determinants of
technology adoption under climate change. In this study, I use long-term historical data on
temperature and rainfall across Niger from 1983-2014 that I combine with household’s socio-
economic data, and data on farm practices adopted in 2011 and 2014, to investigate how farmers
adapt to weather shocks. Particularly, I look at whether or not farmers’ adaptive responses to
different weather outcomes including drought and wet conditions differ with the possession of
livestock.
Many studies have used a cross-sectional approach to investigate adoption. One of the
greatest empirical challenges is the identification of adaptation responses to changing climatic
conditions. There is an active literature using cross-sectional approaches to the problem, which
are prone to suffering from the omitted variable issues (Aufhammer and Schlemker, 2014). To
avoid this issue, other studies use panel data to identify the effects of exogenous climate outcomes
(Schlenker and Roberts (2009), Dell, Jones, and Olken (2012)). The idea behind is that while
average climate could be correlated with other time-invariant factors unobserved to the
econometrician, short-run variation in climate or weather variation within a given area is
plausibly random, and thus better identifies the effects of changes in climate variables on
economic outcomes. The challenge with the use of panel data is that strategies adopted for a long
run adjustment might not be feasible in the short run, and a quick response to weather change in
the short run such as irrigation in a dry year, could not necessarily be implemented in the long
run (Burke and Emerick, 2015).

4
To construct the exposure to weather shocks, I create a normal distribution of the rainfall
across all clusters; I then create an exposure to drought dummy variable that takes the value 1 if
the Standard Precipitation Index (SPI) for the reference year was 1 standard deviation below the
long-term average (1983-2014). The same process was applied to construct exposure to wet
conditions if the SPI was 1 standard deviation above the long-term average. I look at how farmers
will adjust the use of three major inputs on their land including crop residues, organic fertilizers,
and modern inputs. Crop residues are a conservative agricultural technique that creates a drought
resistant soil by covering the soil, improving soil moisture, and water infiltration; organic
fertilizers come mainly from living organisms, and improve the natural fertility of the soil;
modern inputs which comprise chemical fertilizers and hybrid seeds provide high level of
nutrients to the soil, but could potentially decrease long-term soil fertility. I find that drought
results in a strong and deep decrease in the use of crop residues on the soil, which is particularly
concerning because of the importance of crop residues on long-term land sustainability. One of
the most important findings from my study is that, this negative adaptive response is partly
connected to the possession of livestock. In fact, farmers remove crop residues on land to keep
the animals alive and healthy, since livestock is an important asset. One explanation could be the
effect of an increasing demand for livestock products such as meat from urban areas in Niger. I
also find that farmers successfully adapt when exposed to wet conditions by using more crop
residues on their land. This helps protecting the soil against wind and water erosions. Moreover,
household’s characteristics including farm size, household size, land ownership, income status,
and previous year rainfall distribution affect inputs adoption as well.
The rest of the study is organized as follows: Section 2 of my paper presents the literature
review, which combines different strands of literature. Section 3 presents a background of Niger.
Section 4 examines the methods used in this study. In Section 5, I present the results and provide
possible explanations. Section 6 concludes and provides some policy recommendations.
2. Literature Review
I attempt to link different strands of literature that have developed separately but that
are key in discussing adaptation in agricultural systems; namely that on risk and adoption of
agricultural technologies based in the economic tradition, and that on vulnerability and adaptive
capacity as presented from different disciplinary perspectives in the climate change literature.

5
Both the literature on adoption and that on adaptation were developed in other disciplines and
were adopted and later adopted by economists. The research on adoption originated in sociology,
and its introduction to economics filled a gap and explained behavioral patterns that were
overlooked by neoclassical microeconomic models. Adaptation is an essential concept in biology,
and although there were several earlier attempts to integrate this idea into economics, now it has
become an important element in the economics of climate change (Zilbermann et al, 2012).
2.1 Adoption
Starting with the determinants of practice selection, much of the literature on adoption
and diffusion comes from the adoption in agriculture. This literature indicates that there are
several barriers to technology adoption including risk associated with the technology,
information, farmer’s attitude toward risk, limited access to credit, education, extension services,
access to the technology. Adoption is an individual decision on the technology in the sense of
whether to adopt (discrete) or not, and can also be associated with continuous variables (quantity
used). Rogers (2003) defines technology adoption as a decision of “full use of an innovation as the
best course of action available”. Some people adopt ideas when they are first introduced, others
wait a long time, while some never adopt (Beal & Bohlen, 1957). The idea that differential
adoption of new technology can explain productivity differences across regions had gained
acceptance in the economics literature. Income differences have been directly related to
differences across countries in technology adoption (Comin and Hobjin, 2004), and small
differences across countries in barriers to technology adoption could explain much of the
difference in income levels and growth across countries.
Economists and sociologists have extensively contributed to the literature on the
adoption and diffusion of technological innovations in agriculture. The pioneer work on adoption
of an innovation was done by economist Griliches (1957). His work was done after Ryan and
Gross (1943) had reported that a complicated range of objective and subjective considerations
has shaped the reception of hybrid corn cultivation, as a substitute for the traditional farming
regime based on open‐pollinated corn‐seed within Iowa farming communities. Griliches
specifically studied the introduction and acceptance (diffusion) of hybrid corn among U.S. farmers
in the Midwestern United States. His conclusion emphasized the role of economic factors such
as expected profits, economic incentives, and scale in determining the varying rates of hybrid

6
corn diffusion across the Midwestern states. In other terms, differentials in economic incentives
and profitability of hybrid corn is the principal systemic factor affecting the speed of its diffusion.
The model, however, assumes homogeneity across farmers. The literature eventually moved
beyond his initial contribution, both in the theoretical analysis of technology adoption and in the
specific econometric tools that have been employed.
Critical responses to Griliches (1957) that appeared in Rural Sociology from sociologists
Babcock (1960), and Havens and Rogers (1962), emphasized on personal and social
characteristics of the individual decision-maker, the structure of the networks, and interactions
among decision makers are main determinants of the adoption and diffusion processes. Rogers
(1962) modeled adoption as a multistage process with five stages including the knowledge about
the technology, the decision to adopt, and the implementation. The main idea behind his imitation
model is the presence of heterogeneity among farmers such as personality characteristics, ability
or risk preferences that can influence adoption. Griliches (1960, 1962) acknowledged the critics
and pointed out that the considerations the critics raised would affect both the reality and the
perception of the innovation’s profitability.
There can be heterogeneity across farmers in their perception of returns using a specific
technology. This means that if one agent that used more fertilizer has higher yields than the
lower user, it does not imply that all farmers should use more fertilizer. Two farmers can use the
exact same amount of inputs but end with different yields, because of the potential difference in
their land quality as well. Therefore, a farmer might decide not to adopt a lower yields variety
because the higher yield variety might not be suitable for his soil. And in that case, it doesn’t
mean that rejecting the innovation is inconsistent with maximization behavior.
At this point, the literature on the microeconomics of adoption and diffusion began to
move in the same direction. This development turned upon a more formalized acknowledgment
of the implications of heterogeneities in the adopter population.
Considering, the implications of population heterogeneities and combined with fixed costs
of adoption, David (1969) and Feder et al (1985) developed the “threshold model”. It allowed for
the possibility that expected scale of operations might enter investment decisions involving
choices between new and old techniques, such, that given the relative prices of the fixed and
variable inputs, there would be a “threshold” output scale below which adoption would not occur,
if the decision agents were myopic cost‐minimizers. Feder, Just and Zilbermann (1985) was the

7
first major empirical study on agricultural technology adoption using new type of data (plot-level
panel data) and techniques, with the idea that adoption is a dynamic process. This has contributed
to a big advancement in the topic of adoption. In their model, farmers have their land used either
with traditional inputs, or modern inputs such as new seed variety, inorganic fertilizers. In either
case, the adoption behavior is an investment decision and, as any investment decision, is
constrained and the farmer faces uncertainties associated with it. He forms expectations of the
profitability of modern inputs relative to the traditional input on plot j in period t, and considers
the farm characteristics, such as farm size, plot characteristics such as soil type or topography,
and individual characteristics such as risk preferences.
An important variable that largely affects technology adoption is farm size. The latter
contains the element of risk in the sense that small farms holders are more risk averse than large
farms holders (Feder et al., 1982). Foster and Rosenweig (2010) also argue that size is a large
barrier for adoption of technologies in developing countries, and a major contributor to low
productivity. Another important variable in adoption of new technology is learning. Since
adoption is a process, learning plays a key role, because it reduces uncertainty (Chatterjee &
Eliashberg, 1990). Learning can happen through own experience of profit differentials using that
technology, it can be augmented through network externalities (Katz and Shapiro, 1986), or
through exposure to agricultural extension services. Education is often linked with learning, in
the sense that more educated agents are better able to learn, to decode new information faster
and more efficiently (Foster and Rosenweig, 2010a). Cameron (1999) studied the impact of
learning from own experience on adoption of High Yielding Variety (HYV) cotton seed using
ICRISAT panel data on 31 households in Kanzara, India. He proposes a simple model of learning
where households are assumed to maximize their utility, subject to constraints, and adopt a given
technology if and only if the technology is available and affordable, and if at the same time the
selection decision is expected to be beneficial (in terms of profits or otherwise) (de Janvery et al.,
2010). The household is uncertain of the profitability of the modern inputs relative to the
traditional ones, and the household learns about this from agricultural extension services or from
own experience. Cameron (1999) also suggests that one can think of the farmers supplementing
their learning from sources at the village level learning (such as weather shocks) with learning
from own experience or extension services. The study concludes that learning plays an important
in adoption, as well as unobserved household heterogeneity factors.

8
Field experiments have recently started being used in the development world to
overcome certain issues in analyzing constraints to technology adoption. The technique is useful
because it creates variation in inputs use that is orthogonal to land, farmer quality as well as
time-varying profit shocks. Rousu et al. (2007) using experimental auctions in three US locations
and two European locations, examines the value of information on consumer’s willingness to pay;
they find that information about environment, characteristics of the product, prior belief, and the
source of information about the new product affect WTP of consumer to pay for Genetically
Modified food. Duflo et al. (2008) conducted an experiment on the impact of fertilizer subsidy on
fertilizer use in Kenya to understand the constraints of adoption. They find no impact of
education on technology adoption.
Although the studies presented highlight a set of determinants of technology adoption,
they do not investigate the impact of climate risk on adoption, or how farmers adjust their choices
of inputs when facing climate shocks. Climate variability is likely to have a predominant direct
effect through the psychological effects of risk and uncertainty (Porcelli and Delgado, 2009).
2.2 Adaptation to climate change
Turning to the literature on adaptation or adaptive capacity, the concepts of exposure and
sensitivity, as well as the scale of adaptive capacity are key. Adaptation can be defined in different
ways. Mendelsohn et al. (1994) using a Ricardian approach, defined it as adopting the best
technology available given the new weather. Adaptation is sometimes modeled as a transition
from one equilibrium to another in response to a shock, as in studies on the impacts of climate
change, (Schlenker et al., 2005; and Deschenes & Greenstone, 2007). A successful adaptation is
any adjustment that reduces the risks associated with climate change, or vulnerability to climate
change impacts, to a predetermined level, without compromising economic, social, and
environmental sustainability (de Franc Doria et al. 2009). Adaptive capacity expresses the ability
of a system to prepare for stresses and changes in advance or adjust and respond to the effects
caused by the stresses, thereby modulating the sensitivity to decrease vulnerability (Smit et al.
1999). A more recent definition of adaptation is provided by the National Research Council
(2010a, p. 19), and is considered as an adjustment in natural or human systems to a new or
changing environment that exploits beneficial opportunities or moderates negative effects.
Although the adjustment can be a proactive or reactive behavior, historically, most adaptation
activities have been reactive (Orlove 2005), meaning, in response to a shock. Climate change

9
however, offers an opportunity for proactive adaptation: adaptation in anticipation of the major
changes predicted by scientists. An example of proactive adaptation is integrating the use of
climate forecasts into cropping decisions (Howden et al. 2007).
There are many adaptation strategies including adoption of certain inputs, risk
management products, or migration. The logic behind adaptation is that once a decision maker
realizes that a change occurs, they modify their objective functions. At the farm level, there are a
wide range of strategies that may contribute to adaptation including: modifying planting times
and changing to varieties resistant to heat and drought (Phiri and Saka, 2008); development and
adoption of new cultivars (Eckhardt et al. 2009); changing the farm portfolio of crops and
livestock (Howden et al., 2007); improved soil and water management (Kurukulasuriya and
Rosenthal, 2003), adoption of crop insurance (Mendelsohn, 2006), and migration (Warner et al.,
2009). Asfaw et al. (2016) using cross-sectional data of Niger find that the probability of using
modern inputs and organic fertilizer is negatively and strongly correlated with variability in
rainfall and temperature.
2.3 Literature on Importance of Crop residues and demand for livestock products
The core element in this literature is the trade-off between the use of crop residues on the
land and for livestock feeding. To maintain soil fertility, in particular soil organic carbon, biomass
needs to be returned to the soil on a regular basis and in adequate amounts. The use of crop
residues in a conservation agriculture technique that allows to create a drought-resistant soil.
Hudson (1994) find that 1-percent increase in soil organic matter increases the available water
holding capacity in the soil by 3.7 percent. Moreover, Increased soil cover can result in reduced
soil erosion rates close to the regeneration rate of the soil or even lower (Debarba and
Amado,1997). However, farmers also need to sustain their livestock, and there is pressure to
remove residual biomass in the form of straws, and feed them to livestock (Giller et al., 2009).
Grazed feed resources used to form the major component of livestock diets in Ethiopia (Mekasha
et al., 2014). This trend of crop residues removal could be due to increasing urban demand for
livestock products, especially meat, and using livestock to smooth income during bad weather
shocks as well. Over the period 1968-1988, large quantities of livestock were exported from
Niger to Nigeria to satisfy the exploding demand for meat following the oil boom. Livestock
prices influence demand for livestock, and farmers respond by feeding more crop residues to
livestock. (Fafchamps and Gavian, 1996).

10
This study builds on previous work, a cross-sectional analysis that used the 2011 data
from the same country to identify determinants of technology adoption (Asfaw et al., 2016). I
expand the analysis by using both the 2011 and 2014 rounds of data (panel) to understand
adaptation, and specifically how adaptation interacts with possession of livestock. I hypothesize
that exposure to different weather outcomes including drought and wet conditions will not
change farmers’ decisions to use inputs on their land.
3. Country Background
Niger is a large landlocked country of 1.27 million square kilometers in Western Africa,
bordered by Algeria, Benin, Burkina Faso, Chad, Libya, Mali and Nigeria. The northern part is
covered by the Sahara desert that occupies about 75% of the country. Niger is among the poorest
countries in the world. About 14% of Niger’s GDP is generated by livestock production,
including camels, goats, sheep and cattle (Asfaw et al, 2016). The high level of poverty is
associated with high level of food insecurity, with only 56 kilocalories per person per day (World
Bank). In addition, Niger has the highest total fertility rate of any country in the world, averaging
close to 7 children per woman in 2016. Agriculture remains essential for rural households with
87% of the population relying on crop production and livestock growth for their livelihoods
(Smith, 2011), and 99% of the cultivable land is rely on rainfall. The weather is highly variable
in the Sahel, in general, causing frequent droughts and floods, degrading the land quality and
preventing food production from keeping up with population growth. This makes the need of
adaptation strategies very critical (IPCC, 2011).
Farmers in Niger often use livestock as source of income, and as insurance against
weather shocks (Fafchamps and Gavian, 1996). In recent years, Niger has suffered droughts on
average once every 2 years, and in 2009 the population was affected by both droughts and floods
(Smith, 2011). The 2009 drought is reported to be among the most severe experienced by the
Nigerien population. Although the main cultivated crops are well adapted to the tough climate
conditions of the country, insufficient rains caused national crop production to drop by 31%
compared to 2008 (IRIN, 2010). Given all those details, Niger is an interesting setting to
understand how farmers react to dramatic changes in weather, and it is especially important for
the new 17 Sustainable Development Goals, which include poverty reduction and hunger
eradication.

11
4. Methods
4.1 Data Description
I use two main sources of data in my analysis. The first set is recently released socio-
economic data from the Niger National Survey of Household Living Conditions and Agriculture
(ECVMA). The second set of data is historical data on surface rainfall and temperature from the
National Oceanic and Atmospheric Administration (NOAA) and the European Centre for
Medium Range Weather Forecasts (ECMWF), respectively.
The socio-economic panel data is the Niger ECVMA survey collected in 2011 and 2014.
The program was implemented by the Niger Institut National de la Statistique (INS) in
collaboration with the World Bank. The ECVMA is designed to have national coverage,
including both urban and rural areas. The target population is drawn from households in all eight
(8) regions of the country. The sample was chosen through a random two-stage process. In the
first stage, 270 enumeration areas (EAs) or communities were selected, with the probability
proportional to size using the 2001 General Census of Population and Housing as the base for
the sample and the number of households as a measure of size. In the second stage, 12 or 18
households were selected with equal probability in each urban or rural ZD, respectively.
In 2011, the first visit took place at the end of the planting season (July to September),
and the second visit took place at the end of the harvest season (November to January). In 2014,
the first visit was conducted post-planting season (September to November), and the second visit
was conducted post-harvesting season (January to March). To ensure the panel nature of the
dataset, the same households interviewed in 2011, were tracked in 2014. Households that did not
move were interviewed in their existing location. Households that had moved to other locations
in Niger were followed and interviewed in their new locations if they could be found in the new
location. Households that moved outside of Niger were not followed.
The household, agriculture/livestock and community/price questionnaires were
administered during the first visits. During the second visits, only household and
agriculture/livestock questionnaires were administered. In 2011, the total sample size after both
visits was 3,968 households drawn from 270 enumeration areas EAs, and 3,614 in 2014. However,
for this study, I restricted the sample to households involved in farming activities during the
rainy season. This results in an unbalanced panel of 2,338 households in 2011, and 2,105

12
households in 2014.
The household questionnaire was designed to provide information on various aspects of
household welfare in Niger, such as household composition and characteristics, health, wage
employment and income sources, as well as data on consumption, food security, non-farm
enterprises, and durable and agricultural asset ownership. For households that were involved in
agricultural activities, data were collected on access to land with information such as land tenure,
labor and non-labor input use, and crop cultivation and production at the plot level. Data were
also collected at the community level to capture determinants of system-level capacity in terms
of enabling factors for adaptation, which include issues related to collective action, access to
information and to infrastructure among other factors.
Rainfall data were extracted from the Africa Rainfall Climatology version 2 (ARC2) of
the National Oceanic and Atmospheric Administration’s Climate Prediction Center for each
decade (i.e., 10-day intervals) covering the period of 1983–2014. ARC2 data are based on the
latest estimation techniques daily, and have a spatial resolution of 0.1 degrees (10 km)1.
Temperature data are surface temperature measurements at each decade for the period of 1989–
2010 obtained from the ECMWF at a spatial resolution of 0.25 degrees (50 km)2. These data are
then merged with the socio-economic data at the EA/community level (270 EAs in ECVMA) to
create a set of exposure to weather variables to represent the short- and long-term variations
both within and across years in rainfall and temperature.
4.2 Descriptive Statistics
Given the data set, I focus on three (3) different potentially climate-smart agricultural
practices (crop residues and organic fertilizers) and consider two practices that are aimed
primarily at improving average yields (improved seeds and use of inorganic fertilizers). Since
there were few observations on use of improved seeds, I created a variable modern input that
combines inorganic fertilizer and improved seed.
Crop residues and organic fertilizers use on the land is a conservation agriculture method
1 Average of a 10-km radius buffer of decadal sum of daily values per each EA centroid. For more details on ARC2 algorithms, see http://www.cpc.ncep.noaa.gov/products/fews/AFR_CLIM/AMS_ ARC2a.pdf 2 Point extraction per each EA centre point of values of an average of a 50-km radius buffer of decadal values.
13
consisting on leaving residue from past harvest such as leaves, stalks and pods of legume crops
to provide natural nutrients to the soil. This technique has many benefits including improvement
in soil fertility originating from organic matter, earthworms and other soil life. It provides
healthy crops and good yields. Another benefit is that it covers the soil, reducing erosion, and
preserving the soil for the future. Modern inputs, on the other hand, are chemical fertilizers and
hybrid seeds that provide higher yields than using crop yields and organic fertilizers, but the risk
is that it might reduce the long-term natural fertility of the soil.
The use of crop residues is more widespread in the rural areas of the country and
particularly in the agricultural and agro-pastoral zones (Asfaw, 2016). Although Niger is among
the world’s largest producers of crop residues, 35% of the households use crop residues on their
land during both years 2011 and 2014. In fact, crop residues (CR) have become a limited resource
in mixed crop-livestock farms, which form the dominant farming system in the developing world
(Herrero et al., 2009, 2010). The use of organic fertilizer is another major component of a
sustainable agricultural system and a commonly suggested method of improving soil fertility
while capturing economies of scope in crop–livestock systems. The data show that organic
fertilizers (which is composed of animal manure, compost, and green manure) are used by 48% of
the households in the sample in 2011, and by 54% in 2014. Despite the potential productivity
benefit, the proportion of plots planted with improved varieties in Niger is only about 4%. I also
consider the utilization of inorganic fertilizers, and the data show that about 18% of the sample
used inorganic fertilizer on their land in 2011, and 24% in 2014. Mixed cropping, which involves
planting different types of crops on the same parcel, is practiced by 80% of the households in the
sample. It is important, however, to point out that for farmers in Niger, crop residues are highly
valuable as they are used as feed for livestock, and as fuel for cooking.
In 2011, 21% of the households in the sample have reported being affected by erosion, and
the number increased to 27% in 2014. This problem of environmental degradation is particularly
acute in the pastoral areas, where 31% of the households report being affected by erosion, as
opposed to 24% in agro-pastoral areas. Despite the high rate of erosion, the use of an anti-erosion
measure is very low in all the land use types. Only 5% in 2011, reported using anti-erosion
techniques aiming to offset the effects of soil degradation, and the number shrank to 2% in 2014.
The average age of household’s head is 46 years with a standard deviation of 14. The
14
average size of household is 7 with a standard deviation of 4. The average number of years of
education within the household is about 4 years with a standard deviation of 5 (See Table 3).
4.3 Empirical strategy
Based on the extensive literature on the choice of farming practice (including input use),
I model the farming practice selection decision as the outcome of a constrained optimization
problem by rational agents (Feder et al., 1985; Foster and Rosenzweig, 2003). Most of the
previous studies use cross-sectional data to model adoption, because panel data are difficult to
come by, resulting in an omitted variable problem. The same issue of omitted variables bias is
encountered when measuring the effects of climate change on different outcomes (Schlenker et
al. 2014).
In the model of adoption, households are assumed to maximize their utility, subject to
these constraints, and adopt a given technology if and only if the technology is available and
affordable, and if at the same time the selection decision is expected to be beneficial (in terms of
profits or otherwise) (de Janvery et al., 2010). The household is uncertain of the profitability of
the modern inputs relative to the traditional ones, and the household learns about this from
agricultural extension services. When forming expectations of the profitability of using modern
inputs relative to traditional inputs, the farmer considers the household or farm characteristics
such as farm size, plot characteristics such as soil type or topography, his or her knowledge about
the inputs, and observes the weather.
The model used in this study is a cluster and year fixed effects3 estimation. The fixed
effects model addresses the problem of unobserved heterogeneity and exogeneity. In other words,
it controls for all time-invariant differences between households or clusters, and the estimated
coefficients are unbiased. The complete model is:
Adoptionit = B0 + B1 Rainfall shockijt+ B2 Temperatureijt + B3 Controlsit + Ci+ eit
for each i=1…, n, and j= 1…, m
3 Hausman test proposed by Hausman (1978) was done between fixed and random effects to test for the exogeneity
of the unobserved household effects. P>chi2 =0.000, thus, fixed effect model yields consistent estimators.

15
where,
Adoptionit represents adoption of a farming practice (1 if the household adopts, 0
otherwise) at year t, and the farmer can adopt either crop residues, organic fertilizers or modern
inputs on his land, Temperatureijt is the total extra temperature above 29 degrees Celsius for the
growing season in cluster j at year t, Rainfall shockijt is a dummy representing whether or not,
during rainy season, in cluster j, at year t the rainfall level is one (1) standard deviation above,
and below the historical rainfall average (1983-2014). The variable Controlsit represents a set of
household control variables, including farm size, family size, income status, access to mobile
phone, livestock size, whether the household’s head is educated or not, the non-agricultural
wealth index, land ownership, and the rainfall distribution of the previous year. Farm size is
considered as an indicator for risk level of farmers, with small farmers being more risk averse.
Family size is considered as a potential indicator of labor supply for production, and labor
blockages can also be a significant constraint to the use of some farm management practices. The
variable income status is a dummy indicating if a household annual per capita expenditures is
below the national poverty line. I expect poor households to have constraints in adoption of
modern inputs since it requires access to capital. Education has been found by some authors to
be positively related to adaptation to climate shocks. The rainfall distribution of the previous
year is included as a control variable because it serves as a proxy of the agricultural income level
farmers had the previous year, and therefore might influence their current adaptation strategies.
All time invariant factors such as types and topography of soil are absorbed by the fixed effects
Ci. Thus, effects of temperature and rainfall shocks on input adoption are thus identified from
deviations from specific means. The variable eit represent the error term of the model.
For the rainfall shock dummy variable, I use long-term historical data on rainfall patterns
(1983-2014), and for each cluster, I create a historical long-term average rainfall. Then, for each
year (growing season), I create a score of rainfall that represents a deviation relative to the long-
term average rainfall level from 1983-2014 in each cluster. This results in a standard normal
distribution (zero mean and unit standard deviation), with the z value being the Standard
Precipitation Index (SPI) (McKee et al., 1993). The SPI values correspond to a standardization
of gamma-transformed total precipitation values, therefore a SPI equal to zero implies that there
is no deviation from the mean rainfall value at the chosen time scale for the analyzed period.

16
Positive values of SPI indicate that precipitation is above the mean value and negative values of
SPI indicate that precipitation is below the mean value. Thus, humid periods are characterized
by positive values of SPI (Guerreiro et al., 2008).
A one standard deviation below negative rainfall shock refers to exposure to drought,
whereas a positive rainfall shock refers to exposure to wet weather. There are different thresholds
below which a shortfall in precipitation can be considered a negative rainfall shock, and previous
papers using the cumulative precipitation anomaly index use a variety of measures, such as one
or two standard deviations from the mean. Thomas et al (2010) emphasize that using this index
is straightforward to calculate, and flexible.
I finally created a variable that characterizes temperature increase using a degree-month
technique (Schlenker and Robert, 2009; Wetherly and Antilla-Hughues, 2005). I first created a
dataset containing only temperatures above 29 degrees Celsius, with temperature below 29
considered as 0. I then summed the extra-temperature above 29 degrees Celsius for the growing
season (May-September) of each year, and within each cluster. This allows controlling for the
non-linearity effects of heat above a certain threshold. Temperature is included as a control
variable because of its correlation with precipitations, but it will be interesting to see how farmers
also react to temperature increase above 29 degrees Celsius threshold.
My identifying assumption is that rainfall outcomes are exogenous conditional on the
fixed effects, meaning that there is randomness within a village or cluster. I hypothesize that
there will be no effect of exposure to rainfall shocks on inputs adoption. In other words, farmers
will not adjust their inputs use when exposed to drought to wet weather. The alternative
hypothesis is that farmers will adapt by changing their inputs.
5. Results
5.1 Description of weather variability and reported adaptation strategies in Niger
I provide a description of the weather variables available (both objective and subjective)
and a preliminary view of how they may influence their adaptation strategies.
The amount of precipitations in the country is increasing over time. In 2011, 99 clusters
among the 270-sampled experienced a drought or negative rainfall shock, as opposed to none (0)

17
in 2014. This means that the amount of precipitations has increased from 2011 to 2014. The
increasing trend was found as well by forecasts from NECSD (2006), which predicted rainfalls to
increase in the Sahel region due to weather change.
Although Nigerien farmers are specialized in the cultivation of crops that are particularly
resistant to high temperatures (e.g., millet and sorghum), the increase in the temperature level
will eventually change farming environments in the three land use types (Asfaw et al. 2016).
I also present subjective data capturing perceptions of weather change of farming
household, as well as the strategies used to adapt to and mitigate the effect of weather changes.
Most of the households interviewed reported changes in rainfall and temperature patterns in the
5 years preceding the interview (See Table 1).
In all land use types, the most relevant phenomena are the early end of the rainy season,
the presence of more droughts, the reduction in the amount of rainfall (likely a consequence of
the drought in 2009), and the change in the distribution of rain. The general tendency for the
sample households was to report an early end of the rainy season (80%), more frequent droughts
(75%), less rainfall (69%), and worse rain distribution (71%), which is particularly true in pastoral
areas. Although agricultural areas share the same overall patterns, 38% of the households report
more frequent floods compared to 19% for both agro-pastoral and pastoral areas. About 72% and
82% of the sample households report respectively more of a delayed start and an early finish of
the rainy season in the 5 years before the interview. Changes in temperatures also affected 65%
of Nigerien households, who report longer heat periods.
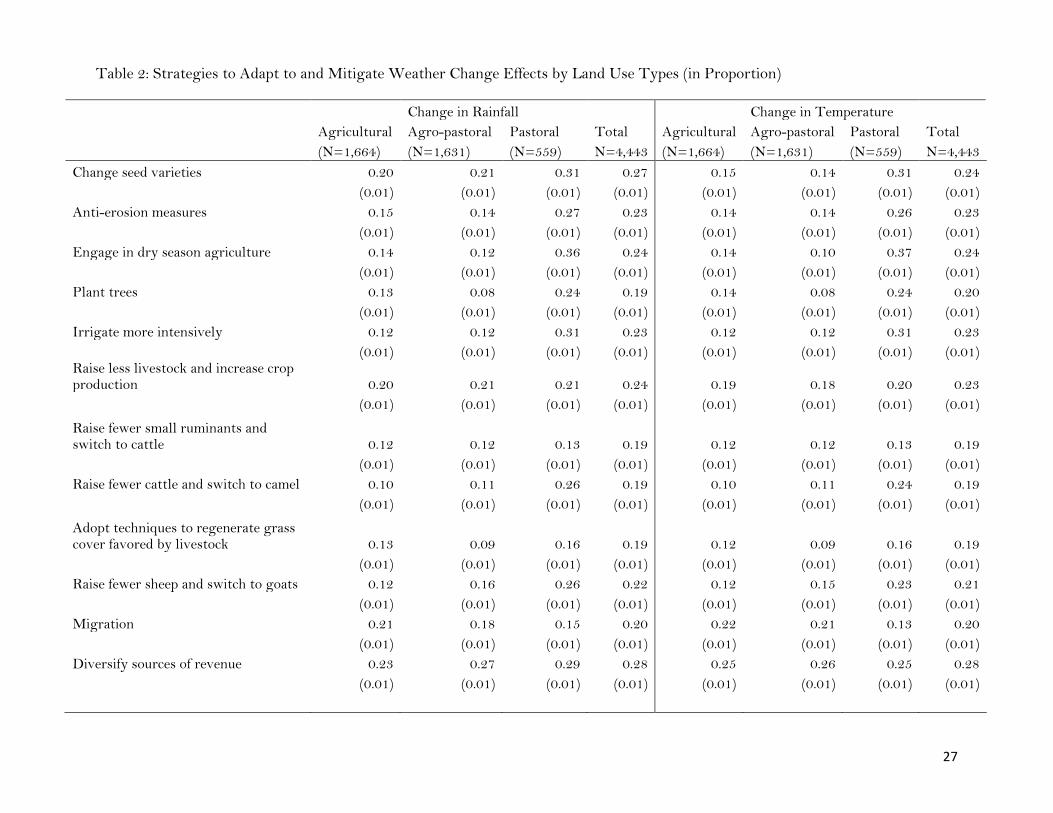
In Table 2, I describe the most common strategies farmers report using to adapt to the
effects of weather change. The most commonly used strategies are diversifying the sources of
revenues, changing seeds varieties, engaging in dry season agriculture, and use methods to
protect against erosion. I should also note that only 24% of the sample report prioritizing increase
crop production and raising less livestock.
5.2 Determinants of Technology Adoption and Adaptation to Climate Shocks

18
The primary objective of this study has been to investigate the link between exposure to
different weather outcomes and farmers’ inputs adoption decisions as adaptation responses. The
results suggest that households adjust differently when exposed to negative, and positive rainfall
shocks. Both Figure 1 and Table 3 in the appendix present the cluster and year fixed effects
results. These results describe how farmers in Niger respond to drought and wet conditions by
changing inputs use including crop residues, organic fertilizer, or modern inputs on the land.
The findings show that exposure to negative rainfall shocks reduces the likelihood of adopting
crop residues on the soil by about 32%.
One explanation for this result is that when exposed to droughts, farmers use less crop
residues on their field for livestock feeding purposes. To test this idea, I interact the exposure to
drought to the variable logarithm of livestock size expressed in Tropical Livestock Units (TLUs),
and I find that farmers with larger livestock size are 67% less likely to use crop residues on their
land (see Figure 2 and Table 4). It means that farmers in drought conditions, favor the animals’
nutrition and health over land sustainability, because livestock is an important asset. Livestock
is a very important asset for many farmers because they provide meat, milk, hides, and manure,
and they pull farm implements and carts. Thus, farmers often allow their animals to graze on
crop residues in fields to keep them alive. For example, Valbuena et al (2014) using a multi-
country comparative analysis including Niger to identify determinants of crop residues use find
that pressures and trade-offs of residues use are common particularly in the dry season. The
authors also find that crop residues became an essential resource for household activities,
especially for livestock keeping; a major livelihood element of smallholder farmers in the
developing world. Duncan et al (2016) also find that livestock pressure per hectare expressed as
Tropical Livestock Units over land size also show consistent effects, with higher livestock
density leading to more feeding and other uses, and less retention on land. Another interesting
is that where livestock product marketing was important, households fed more residues to
livestock.
Another possible explanation of this results is the influence of demand for meat. Economic
wealth in Western Africa as elsewhere tends to be concentrated in cities, and the aggregate
demand for meat is thus largely urban (Eddy, 1979). Over the period 1968-1988, large quantities
of livestock were exported from Niger to Nigeria, in part to satisfy the exploding demand for
meat following the oil boom. For example, Fafchamps and Gavian (1996) find that in Niger,
rainfall exerts a major influence on crop output, and thus on the production of crop residues that
19
are normally fed to livestock. Rational herd management dictates that animals should be sold
when pasture and fodder are unavailable and productivity is low. Poor rains should incite farmers
to sell part of their livestock assets to finance grain purchases. In other words, Sahelian livestock
producers are expected to liquidate some of their animals when rains are low and to purchase
animals or sell fewer of them when rains are good.
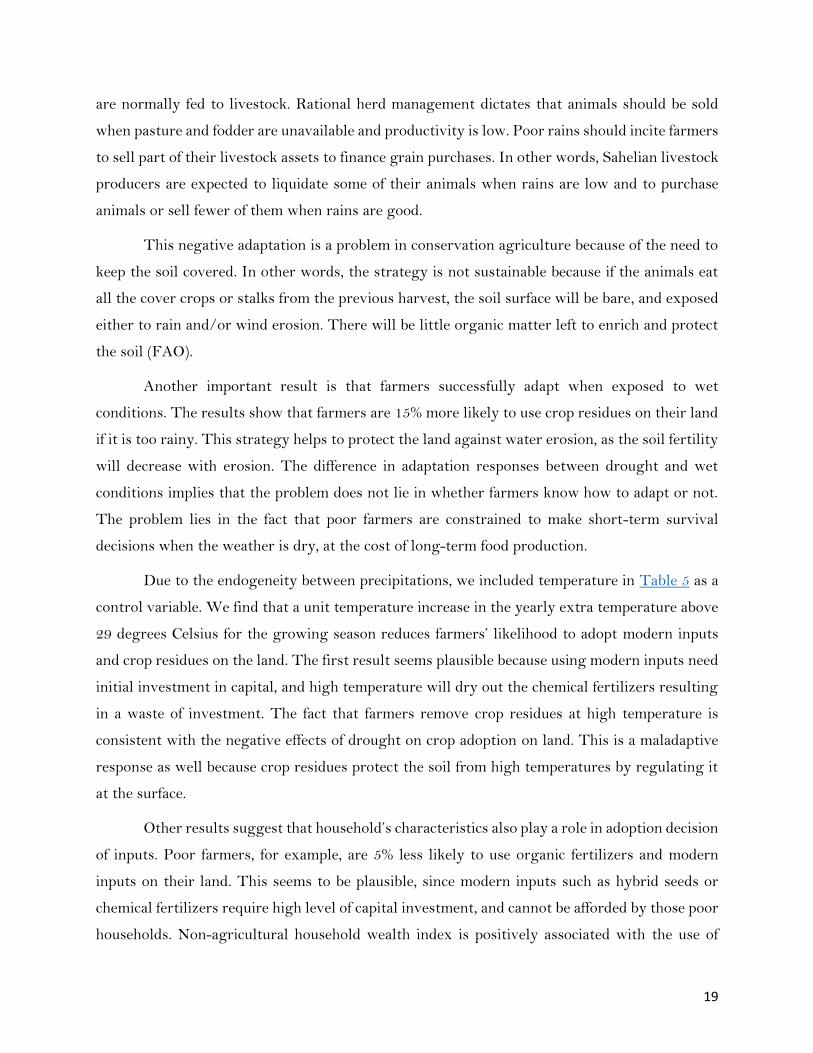
This negative adaptation is a problem in conservation agriculture because of the need to
keep the soil covered. In other words, the strategy is not sustainable because if the animals eat
all the cover crops or stalks from the previous harvest, the soil surface will be bare, and exposed
either to rain and/or wind erosion. There will be little organic matter left to enrich and protect
the soil (FAO).
Another important result is that farmers successfully adapt when exposed to wet
conditions. The results show that farmers are 15% more likely to use crop residues on their land
if it is too rainy. This strategy helps to protect the land against water erosion, as the soil fertility
will decrease with erosion. The difference in adaptation responses between drought and wet
conditions implies that the problem does not lie in whether farmers know how to adapt or not.
The problem lies in the fact that poor farmers are constrained to make short-term survival
decisions when the weather is dry, at the cost of long-term food production.
Due to the endogeneity between precipitations, we included temperature in Table 5 as a
control variable. We find that a unit temperature increase in the yearly extra temperature above
29 degrees Celsius for the growing season reduces farmers’ likelihood to adopt modern inputs
and crop residues on the land. The first result seems plausible because using modern inputs need
initial investment in capital, and high temperature will dry out the chemical fertilizers resulting
in a waste of investment. The fact that farmers remove crop residues at high temperature is
consistent with the negative effects of drought on crop adoption on land. This is a maladaptive
response as well because crop residues protect the soil from high temperatures by regulating it
at the surface.
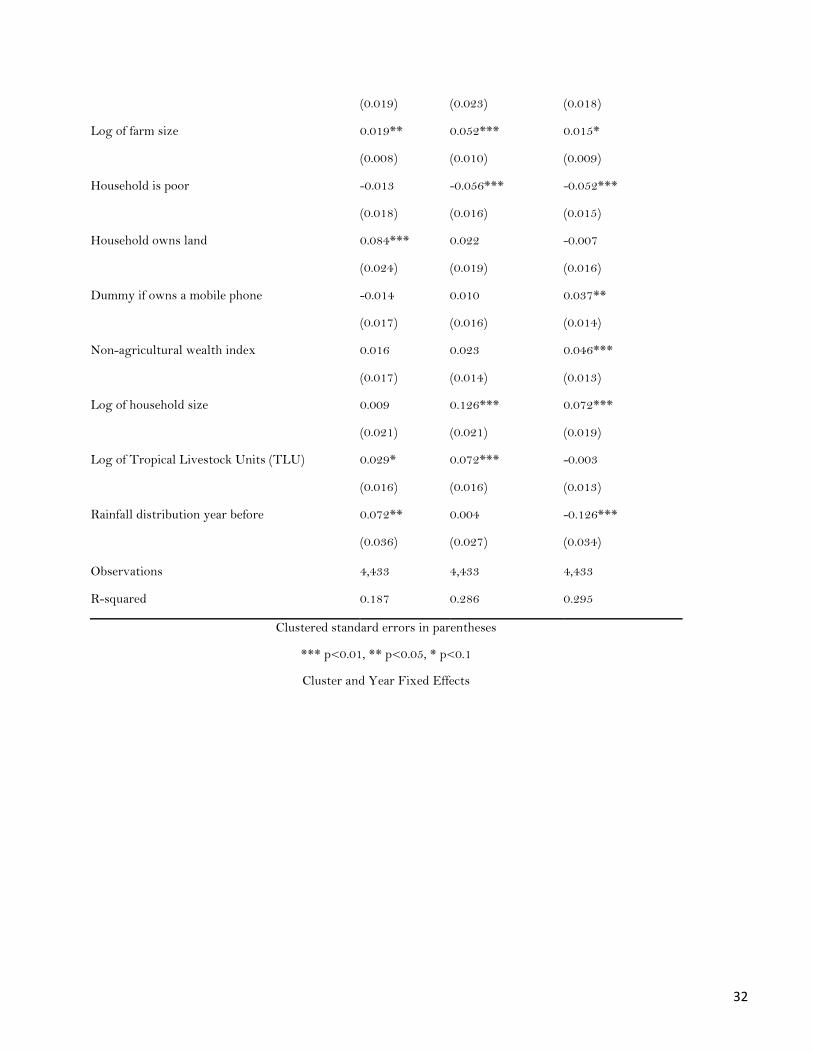
Other results suggest that household’s characteristics also play a role in adoption decision
of inputs. Poor farmers, for example, are 5% less likely to use organic fertilizers and modern
inputs on their land. This seems to be plausible, since modern inputs such as hybrid seeds or
chemical fertilizers require high level of capital investment, and cannot be afforded by those poor
households. Non-agricultural household wealth index is positively associated with the use of

20
modern inputs, which is reasonable because the wealthy households have more adoption choices,
and can afford modern technologies. Households that have access to a mobile phone seems also
more likely to use modern inputs. Owning land increases the probability that the household will
use crop residues by 8.4%. This result suggests the importance of land property rights on
farmers’ willingness to take care of their land. Having a mobile phone might facilitate access to
information about the use of modern technology, and therefore increases the likelihood to adopt
those inputs. Households with larger family size appear more likely to adopt all input practices.
As mentioned before, labor availability constraints input use. Table 7 (in the appendix)
summarizes the variables that could potentially affect the different input choices. I also
investigate if poor and rich farmers differ in their adaptation strategies when exposed to shocks.
I do not find any evidence of a difference in adaptive responses to drought between poor and rich
farmers. I observe that larger farms are more likely to adopt more of all inputs in general. Farm
size is a proxy for risk aversion, small farmers being more risk averse; it is also a proxy for income
and access to credit (Feder et al, 19882). Therefore, the results make sense because larger farmers
are not constrained to make short-term survival decisions as smallholders.
I conduct a robustness check by running a Hausman test between random effects and
fixed effects, the null hypothesis being that there is no systematic difference in coefficients
between both estimations. In case I fail to reject the null hypothesis, it would imply I should use
random effects. The results of the test show that I reject the null at 99% level of confidence across
all estimations, therefore the use of fixed effects is proper. Table 8 also presents another
robustness check where I did a comparison of my main coefficients across two different
specifications including household and year fixed effects versus cluster and year fixed effects. The
coefficients of the variables from the table are very close to each other, meaning that my use of
cluster and year fixed effects is appropriate.
6. Discussion and Conclusion

21
Farmers in Niger were aware of climate change but not all of them responded by adapting
to the change in climate to reduce the negative impact and increases resilience on cropping
systems. Socioeconomic factors of the households influenced farmer’s adaptation choices, where
some hinder, while others promote adoption of adaptation strategies.
Although conservation agriculture or the use of crop residues as soil cover has strong
benefits, the realities of smallholder farming in mixed systems in Sub-Saharan Africa do not allow
such an approach (Giller et al., 2009). Many households in poor countries are food insecure, and
the pressure not to return crop residues to soil remains strong. Because they rely on livestock to
survive at the expense of long-term agriculture, feeding residues to livestock is a rational choice
for farmers as a mean of stabilizing nutrients, and making them more available for crop use or
using them for other means. This results in a bad synergy because removing crop residues
decreases long-term food production and might keep households in poverty trap. Another
concern is that increasing demand for livestock products in Sub-Saharan Africa because of
urbanization, and increase in income is a sign of future high pressure on crop residues use on
land to feed livestock. The problem seems to be complex, and we need to be cautious before
implementing policies that intensify livestock production in the developing world because of
negative impacts on the return of biomass to soils (Duncan et al., 2016). To design inclusive
policies and programs that can help farmers adapt to climate change, it is critical to understand
what kind of choices people make when faced with climate shocks (CGIAR, 2016). In Niger, for
example, farmers without livestock pay herders to graze the crop residues in their fields. In
exchange, the livestock manure improves the soil nutrient status, enhancing crop yields (Powell
et al., 2004). Another alternative involves the diversification of farming practices by promoting
multipurpose crops or/and trees that provide food, feed, and fuel offering additional biomass
resources and reducing biomass demand. When synergies are not used, pressures can contribute
to increase trade-offs. The removal of residue from the soil combined with the low use inorganic
fertilizer and minimal return of manure increases the potential erosion and nutrient depletion of
already fragile and poor soils (Breman et al., 2001; Haileslassie et al., 2005).
To recover soil conditions, some researchers, donors, and NGOs have promoted the use
of crop residues for soil covering (Conservation Agriculture), trying to increase crop production
while also improving the overall sustainability of farming (FAO, 2009; Kassam et al., 2010). This
practice can yield substantial increases in crop production provided if it is accompanied by
additional input use, and if agro-ecological conditions (Giller et al., 2009), the level of agricultural

22
intensity (Valbuena et al., 2012), and specific household assets (Knowler and Bradshaw, 2007) are
suitable. These more sustainable alternatives of crop and livestock intensification are receiving
much attention to address both improvements in livelihoods as well as in the sustainability of
farming systems through combining more and/or better resources and technologies to increase
agricultural production while minimizing negative impacts on the environment (Pretty et al.,
2011). Policy makers will need to improve farmers’ socio-economic conditions, markets,
infrastructure, and strengthen the linkages within the rural economy.
23
References
Albouy, David. (2008). “What Are Cities Worth: Land Rents, Local Productivity, and the Value
of Amenities.” Unpublished.
Auffhammer M., and W. Schlenker. (2014). “Empirical studies on agricultural impacts and adaptation”. Energy Economics, 46:555-561.
Asfaw S., et al. (2016). “Agricultural Technology Adoption under Climate Change in the Sahel: Micro-evidence from Niger”, Journal of African Economies, 1–33.
Babcock, M. (1962). “Adoption of hybrid corn: A comment.” Rural Sociology, 27: 332-38
Beal, George M. and Bohlen, Joe M. (1957). The diffusion process. Special Report No. 18, Cooperative Extension Service, Iowa State University, Ames, Iowa. (also reprinted in November,1962).
Burke M. and K. Emerick. (2012). “Adaptation to climate change: Evidence from U.S. agriculture”. Available at SSRN 2144928,.
Cameron, L. A. (1999). "The Importance of Learning in the Adoption of High-Yielding Variety Seeds." American Journal of Agricultural Economics, 81: 83-94
Chatterjee R, Eliashberg J. (1990). “The innovation diffusion process in a heterogeneous population: a micromodeling approach”. Manag. Sci. 36:1057–79
David, P. (1969). “A Contribution to the Theory of Diffusion”. Center for Research in Economic Growth Memorandum, no. 71, Stanford University.
de Franc Doria, Boyd ME, Tompkins EL, Adger WN. (2009). “Using expert elicitation to define successful adaptation to climate change”. Environ. Sci. Policy, 12:810–19
de Janvery A., Dustan A., Sadoulet E. (2010) “Recent advances in impact analysis methods for ex-post impact assessments of agricultural technology: options for the CGIAR”, Increasing the Rigor of Ex-post Impact Assessment of Agricultural Research: A Discussion on Estimating Treatment Effects. Berkeley: SPIA.
Dell, M., B. F. Jones and B. A. Olken. (2012). "Temperature shocks and economic growth: Evidence from the last half century." American Economic Journal: Macroeconomics 4(3): 66-95.
Dell M., Jones, B.F. and Olken, B. A. (2013). What do we learn from the weather? The new climate-economy literature. NBER Working Paper No. 19578. (Under review by the Journal of Economic Literature.)
Deschenes O, Greenstone M. (2007). “The economic impacts of climate change: evidence from agricultural output and random fluctuations in weather”. Am. Econ. Rev. 97(1):354–85
Di Falco S., Veronesi M. (2014). “Managing Environmental Risk in Presence of Climate Change: The Role of Adaptation in the Nile Basin of Ethiopia”, Environmental and Resource Economics, 57: 553–77.
Duflo Esther, Michael Kremer, and Jonathan Robinson. (2008). “How High Are Rates of Return to Fertilizer? Evidence from Field Experiments in Kenya,” American Economic Review Papers and Proceedings, 98 (2), 482-488.

24
Fafchamps, M. and S. Gavian. (1997). “The determinants of livestock prices in Niger”, Journal of African Economies 6(2): 255-295.
FAO. (2009). “Scaling up Conservation Agriculture in Africa: strategy and approaches”. Addis Ababa, pp. 34.
Feder, G. and G. O’Mara. (1982). “On Information and Innovation Diffusion: A Bayesian Approach," American Journal of Agricultural Economics, 64: 141-145
Feder, G., Just, R. E., Zilberman, D. (1985). “Adoption of agricultural innovations in developing countries: a survey”, Economic Development and Cultural Change, 33: 255–97.
Foster, Andrew D. and Mark R. Rosenzweig, (1995). “Learning by Doing and Learning from Others: Human Capital and Technical Change in Agriculture,” Journal of Political Economy, 103 (6), 1176-1209.
Foster, A. and Rosenzweig M. (2010b). “Microeconomics of Technology Adoption”, Annual Review of Economics, 2, 395-424.
Griliches, Zvi. (1957). “Hybrid Corn: An Exploration in the Economics of Technological Change", Econometrica, 25 (4), 501-522.
Griliches, Zvi. (1960). “Congruence versus profitability: A false dichotomy”, Rural Sociology, 25:354-56
Griliches, Zvi. (1962). “Profitability versus interaction: Another false dichotomy”, Rural Sociology, 27:325-30.
Howden S., Soussana J., Tubiello F., Chhetri N., Dunlop M., Meinke H. (2007). “Adapting Agriculture to Climate Change”, Proceedings of the National Academy of Sciences, 104: 19691–6.
Havens, E. and E. Rogers. (1961). “Adoption of hybrid corn: Profitability and the interaction effect”, Rural Sociology, 26:409-14
Hsiang, S. M. (2010). "Temperatures and cyclones strongly associated with economic production in the Caribbean and Central America." Proceedings of the National Academy of Sciences 107(35): 15367-15372.
IPCC (2011). “Managing the risks of extreme events and disasters to advance climate change adaptation: Special report of Intergovernmental Panel on Climate change (IPCC)”.
IRIN (2010). Niger: Southern villages emptying as drought bites. Retrieved October 8, 2013, from IRIN news: http://www.irinnews.org/report/88385/niger-southern-villages-emptying-asdrought-bites
Katz ML, Shapiro C. 1986. “Technology adoption in the presence of network externalities”, J. Polit. Econ. 94(4):822–41
Kristjanson et al. (2012). “Are food insecure smallholder households making changes in their farming practices? Evidence from East Africa”. Food Security, 4: 381-397.
Mekasha, Aklilu, Gerard, B., Tesfaye, K., Lisanework Nigatu Duncan, A.J. (2014). “Interconnection between land use/land cover change and herders'/farmers' livestock

25
feed resource management strategies: a case study from three Ethiopian ecoenvironments”. Agric. Ecosyst. Environ. 188, 150–162.
Mendelsohn R, Nordhaus W, Shaw D. 1994. The impact of global warming on agriculture: a Ricardian analysis. Am. Econ. Rev., 84(4):753–71
Mendelsohn R. (2006). “The role of markets and governments in helping society adapt to a changing climate”. Clim. Change 78:203–15
Munshi, K. and Jacques M. (2006). “Social Norms and the Fertility Transition.” 2006. Journal of Development Economics, 80(1):1-38.
Natl. Res. Counc. (NRC). (2010a). “Adapting to the Impacts of Climate Change”. Washington, DC: Natl. Acad. Press
Orlove B. (2005). “Human adaptation to climate change: a review of three historical cases and some general perspectives”. Environ. Sci. Policy 8:589–600
Rogers, E. (1962). “Diffusion of Innovations”. New York: Free Press.
Rogers EM. (2003). Diffusion of Innovations. New York: Free. 5th ed.
Rousu M, Huffman WE, Shogren JF, Tegene A. (2007). “Effects and value of verifiable information in a controversial market: evidence from lab auctions of genetically modified food”. Econ. Inq. 45(3):409–32
Schlenker W. and M. J. Roberts. (2009). “Nonlinear temperature effects indicate severe damages to us crop yields under climate change”, Proceedings of the National Academy of sciences, 106(37): 15594-15598.
Seo, S.N. & Mendelsohn, R., (2006a). “Climate change impacts on animal husbandry in Africa: A Ricardian analysis.” CEEPA Discussion Paper No. 9, Centre for Environmental Economics and Policy in Africa, University of Pretoria, South Africa.
Smith, B., I. Burton, R.J.T. Klein, and R. Street. (1999). “The science of adaptation: a framework for assessment”. Mitigation and Adaptation Strategies for Global Change, 4, 199–213.
Smith B. (2011, March 30). “Niger Climate Change Overview”. Retrieved October 08, 2013, from weADAPT: http://weadapt.org/knowledge-base/national-adaptation-planning/Niger
Teklewold H., Kassie M., Shiferaw B., Kohlin G. (2013b). “Cropping System Diversification, Conservation Tillage and Modern Seed Adoption in Ethiopia: Impacts on Household Income, Agrochemical Use and Demand for Labor”, Ecological Economics, 93: 85–93.
Valbuena, D. et al. 2014. Identifying determinants: pressures and trade-offs of crop residue use in mixed smallholder farms in Sub-Saharan Africa and South Asia. Agric. Syst. 134, 107– 118.
Warner K, Erhart C, de Sherbinin A, Adamo S, Tricia C. (2009). “In search of shelter: mapping the effects of climate change on human migration and displacement”. CARE Rep. http://issuu.com/careandclimatechange/docs/care_in_search_of_shelter
World Bank. (2013) Data-Niger. Retrieved September 11, 2013, from http://data.worldbank.org/country/niger
Zilberman, D., Zhao, J., and Heiman, A. (2012). “Adoption Versus Adaptation, with Emphasis on Climate Change”. Annual Review Resource Economics, 4(1): 27-53

26
APPENDIX
Table 1: Perception of Weather Changes Reported for the Last 5 Years by Land Use Types
(in Proportion)
Land use types
Agricultural Agro-pastoral Pastoral Total
(N=1,664) (N=1,631) (N=559) N=4,443
Less rainfall 0.68 0.70 0.69 0.69
(0.01) (0.01) (0.01) (0.01)
More rainfall 0.21 0.21 0.13 0.20
(0.01) (0.01) (0.01) (0.01)
Worst distribution rainfall 0.73 0.73 0.62 0.71
(0.01) (0.01) (0.01) (0.01)
Shorter heat period 0.18 0.17 0.12 0.17
(0.01) (0.01) (0.01) (0.01)
Longer heat period 0.60 0.58 0.54 0.59
(0.01) (0.01) (0.01) (0.01)
More frequent droughts 0.71 0.77 0.90 0.75
(0.01) (0.01) (0.01) (0.01)
More frequent floods 0.35 0.22 0.17 0.27
(0.01) (0.01) (0.01) (0.01)
Delay start of the rainy season 0.71 0.65 0.83 0.70
(0.01) (0.01) (0.01) (0.01)
Early end of the rainy season 0.75 0.83 0.89 0.80
(0.01) (0.01) (0.01) (0.01)
27
Table 2: Strategies to Adapt to and Mitigate Weather Change Effects by Land Use Types (in Proportion)
Change in Rainfall Change in Temperature
Agricultural Agro-pastoral Pastoral Total Agricultural Agro-pastoral Pastoral Total
(N=1,664) (N=1,631) (N=559) N=4,443 (N=1,664) (N=1,631) (N=559) N=4,443
Change seed varieties 0.20 0.21 0.31 0.27 0.15 0.14 0.31 0.24
(0.01) (0.01) (0.01) (0.01) (0.01) (0.01) (0.01) (0.01)
Anti-erosion measures 0.15 0.14 0.27 0.23 0.14 0.14 0.26 0.23
(0.01) (0.01) (0.01) (0.01) (0.01) (0.01) (0.01) (0.01)
Engage in dry season agriculture 0.14 0.12 0.36 0.24 0.14 0.10 0.37 0.24
(0.01) (0.01) (0.01) (0.01) (0.01) (0.01) (0.01) (0.01)
Plant trees 0.13 0.08 0.24 0.19 0.14 0.08 0.24 0.20
(0.01) (0.01) (0.01) (0.01) (0.01) (0.01) (0.01) (0.01)
Irrigate more intensively 0.12 0.12 0.31 0.23 0.12 0.12 0.31 0.23
(0.01) (0.01) (0.01) (0.01) (0.01) (0.01) (0.01) (0.01) Raise less livestock and increase crop production 0.20 0.21 0.21 0.24 0.19 0.18 0.20 0.23
(0.01) (0.01) (0.01) (0.01) (0.01) (0.01) (0.01) (0.01)
Raise fewer small ruminants and switch to cattle 0.12 0.12 0.13 0.19 0.12 0.12 0.13 0.19
(0.01) (0.01) (0.01) (0.01) (0.01) (0.01) (0.01) (0.01)
Raise fewer cattle and switch to camel 0.10 0.11 0.26 0.19 0.10 0.11 0.24 0.19
(0.01) (0.01) (0.01) (0.01) (0.01) (0.01) (0.01) (0.01)
Adopt techniques to regenerate grass cover favored by livestock 0.13 0.09 0.16 0.19 0.12 0.09 0.16 0.19
(0.01) (0.01) (0.01) (0.01) (0.01) (0.01) (0.01) (0.01)
Raise fewer sheep and switch to goats 0.12 0.16 0.26 0.22 0.12 0.15 0.23 0.21
(0.01) (0.01) (0.01) (0.01) (0.01) (0.01) (0.01) (0.01)
Migration 0.21 0.18 0.15 0.20 0.22 0.21 0.13 0.20
(0.01) (0.01) (0.01) (0.01) (0.01) (0.01) (0.01) (0.01)
Diversify sources of revenue 0.23 0.27 0.29 0.28 0.25 0.26 0.25 0.28
(0.01) (0.01) (0.01) (0.01) (0.01) (0.01) (0.01) (0.01)

28
Table 3: Summary Statistics
Variable Mean Std. Dev. Min Max
Household Size 7 3 1 27
Head of Household Age 46 14 17 95
Average household years of education 3.49 4.82 0 19
Livestock size (TLU) 1.10 2.21 0 34.55
Percentage use of crop residues on land 0.35 0.48 0 1
Percentage use of organic fertilizers on land 0.51 0.50 0 1
Percentage use of modern inputs (inorganic
fert. and hybrid seeds) 0.24 0.42 0 1

29
Figure 1: Effects of Rainfall Shocks and Temperature on Inputs adoption
Figure 2: Effects of Livestock Possession on Adaptation to Drought
Wet Weather (Positive Rainfall Shock)
Drought (Negative Rainfall Shock)
-.6 -.4 -.2 0 .2
Crop Residue Organic Fertilizer
Modern Inputs
Wet conditions (Positive Rainfall Shock)
Drought (Negative Rainfall Shock)
Extra temperature above 29 degrees
Drought*Log Livestock size
-.5 0 .5
Crop Residue Organic Fertilizer
Modern Inputs

30
Table 4: Main effects of weather shocks on input use– Household Level Analysis
PSU-Year FE PSU-Year FE PSU-Year FE
VARIABLES Crop Residue Organic Fertilizer Modern Inputs
Wet Weather (Positive Rainfall Shock) 0.166*** -0.104** 0.038
(0.002) (0.019) (0.478)
Drought (Negative Rainfall Shock) -0.474*** -0.029 0.037
(0.000) (0.665) (0.551)
Observations 4,433 4,433 4,433
R-squared 0.172 0.253 0.264
Clustered standard errors in parentheses
*** p<0.01, ** p<0.05, * p<0.1
Cluster and Year Fixed Effects
Table 5: Effects of Rainfall Shocks and Temperature Increase
PSU-Year FE PSU-Year FE PSU-Year FE
VARIABLES Crop Residue Organic Fertilizer Modern Inputs
Wet Weather (Positive Rainfall Shock) 0.149*** -0.108** 0.019
(0.003) (0.016) (0.740)
Drought (Negative Rainfall Shock) -0.450*** -0.023 0.065
(0.000) (0.733) (0.315)
Extra temperature above 29 degrees -0.009*** -0.002 -0.010***
(0.001) (0.243) (0.000)
Observations 4,433 4,433 4,433
R-squared 0.177 0.253 0.273
Clustered standard errors in parentheses
*** p<0.01, ** p<0.05, * p<0.1
Cluster and Year Fixed Effects

31
Table 6: Effects of Livestock Size on Adaptation to Drought
PSU-Year FE PSU-Year FE PSU-Year FE
VARIABLES Crop Residue Organic Fertilizer Modern Inputs
Wet Weather (Positive Rainfall Shock) 0.149*** -0.108** 0.019
(0.003) (0.016) (0.740)
Drought(Negative Rainfall Shock) -0.365*** -0.074 0.092
(0.001) (0.356) (0.185)
Extra temperature above 29 degrees -0.009*** -0.002 -0.010***
(0.001) (0.243) (0.000)
Drought*Log Livestock size -0.301*** 0.183 -0.095
(0.002) (0.249) (0.283)
Observations 4,433 4,433 4,433
R-squared 0.178 0.253 0.273
Clustered standard errors in parentheses
*** p<0.01, ** p<0.05, * p<0.1
Cluster and Year Fixed Effects
Table 7: Adaptation to Weather Shocks – Raw Effects and Control Variables
PSU-Year FE PSU-Year FE PSU-Year FE
VARIABLES Crop Residue Organic Fertilizer Modern Inputs
Wet Weather (Positive Rainfall Shock) 0.142*** -0.126*** 0.019
(0.051) (0.043) (0.057)
Drought (Negative Rainfall Shock) -0.390*** 0.041 0.039
(0.095) (0.062) (0.060)
Extra temperature above 29 degrees -0.008*** -0.002 -0.011***
(0.002) (0.002) (0.002)
Dummy Head of household Educated 0.011 0.021 0.025
32
(0.019) (0.023) (0.018)
Log of farm size 0.019** 0.052*** 0.015*
(0.008) (0.010) (0.009)
Household is poor -0.013 -0.056*** -0.052***
(0.018) (0.016) (0.015)
Household owns land 0.084*** 0.022 -0.007
(0.024) (0.019) (0.016)
Dummy if owns a mobile phone -0.014 0.010 0.037**
(0.017) (0.016) (0.014)
Non-agricultural wealth index 0.016 0.023 0.046***
(0.017) (0.014) (0.013)
Log of household size 0.009 0.126*** 0.072***
(0.021) (0.021) (0.019)
Log of Tropical Livestock Units (TLU) 0.029* 0.072*** -0.003
(0.016) (0.016) (0.013)
Rainfall distribution year before 0.072** 0.004 -0.126***
(0.036) (0.027) (0.034)
Observations 4,433 4,433 4,433
R-squared 0.187 0.286 0.295
Clustered standard errors in parentheses
*** p<0.01, ** p<0.05, * p<0.1
Cluster and Year Fixed Effects

33
Table 8: Robustness Check – Household and Year fixed effects vs Cluster and Year Fixed effects
(1) (2) (3) (4) (5) (6)
HHID-Year FE HHID-Year FE HHID-Year FE PSU-Year FE PSU-Year FE PSU-Year FE
VARIABLES Crop Residue Organic Fertilizer Modern Inputs Crop Residue Organic Fertilizer Modern Inputs
Wet Weather (Positive
Rainfall Shock) 0.169*** -0.103** 0.051 0.166*** -0.104** 0.038
(0.001) (0.027) (0.342) (0.002) (0.019) (0.478)
Drought (Negative Rainfall
Shock) -0.480*** -0.016 0.022 -0.474*** -0.029 0.037
(0.000) (0.825) (0.691) (0.000) (0.665) (0.551)
Observations 4,030 4,030 4,030 4,433 4,433 4,433
R-squared 0.550 0.683 0.654 0.172 0.253 0.264
Clustered standard errors in parentheses
*** p<0.01, ** p<0.05, * p<0.1
Household and Year / Cluster and Year Fixed Effects