procedures for exercise physiology laboratories - nasa · procedures for exercise physiology...
TRANSCRIPT

NASA TM-1998-104826
Procedures for ExercisePhysiology Laboratories
Phillip A. BishopMarcas M. BammanSuzanne FortneyMichael GreenisenAlan D. Moore, Jr.Steven F. SiconolfiWilliam Squires
July 1998

The NASA STI Program Office . . . in Profile
Since its founding, NASA has been dedicated tothe advancement of aeronautics and spacescience. The NASA Scientific and TechnicalInformation (STI) Program Office plays a keypart in helping NASA maintain this importantrole.
The NASA STI Program Office is operated byLangley Research Center, the lead center forNASA’s scientific and technical information.The NASA STI Program Office provides accessto the NASA STI Database, the largestcollection of aeronautical and space science STIin the world. The Program Office is alsoNASA’s institutional mechanism fordisseminating the results of its research anddevelopment activities. These results arepublished by NASA in the NASA STI ReportSeries, which includes the following reporttypes:
• TECHNICAL PUBLICATION. Reports ofcompleted research or a major significantphase of research that present the results ofNASA programs and include extensive dataor theoretical analysis. Includescompilations of significant scientific andtechnical data and information deemed to beof continuing reference value. NASA’scounterpart of peer-reviewed formalprofessional papers but has less stringentlimitations on manuscript length and extentof graphic presentations.
• TECHNICAL MEMORANDUM. Scientificand technical findings that are preliminaryor of specialized interest, e.g., quick releasereports, working papers, and bibliographiesthat contain minimal annotation. Does notcontain extensive analysis.
• CONTRACTOR REPORT. Scientific andtechnical findings by NASA-sponsoredcontractors and grantees.
• CONFERENCE PUBLICATION. Collectedpapers from scientific and technicalconferences, symposia, seminars, or othermeetings sponsored or cosponsored byNASA.
• SPECIAL PUBLICATION. Scientific,technical, or historical information fromNASA programs, projects, and mission,often concerned with subjects havingsubstantial public interest.
• TECHNICAL TRANSLATION.English-language translations of foreignscientific and technical material pertinent toNASA’s mission.
Specialized services that complement the STIProgram Office’s diverse offerings includecreating custom thesauri, building customizeddatabases, organizing and publishing researchresults . . . even providing videos.
For more information about the NASA STIProgram Office, see the following:
• Access the NASA STI Program Home Pageat http://www.sti.nasa.gov
• E-mail your question via the Internet [email protected]
• Fax your question to the NASA AccessHelp Desk at (301) 621-0134
• Telephone the NASA Access Help Desk at(301) 621-0390
• Write to:NASA Access Help DeskNASA Center for AeroSpace Information7121 StandardHanover, MD 21076-1320

NASA TM-1998-104826
Procedures for ExercisePhysiology Laboratories
Phillip A. BishopUniversity of AlabamaTuscaloosa, Alabama
Suzanne Fortney, Michael Greenisenand Steven F. SiconolfiLyndon B. Johnson Space CenterHouston, Texas
Marcas M. Bamman and Alan D. Moore, Jr.Krug Life SciencesHouston, Texas
William SquiresTexas Lutheran UniversitySeguin, Texas
July 1998

ii
Dedicated to Captain Manley L. “Sonny” Carter, Jr., USNAugust 15, 1947 - April 5, 1991
Available from:
NASA Center for AeroSpace Information National Technical Information Service7121 Standard 5285 Port Royal RoadHanover, MD 21076-1320 Springfield, VA 22161Price Code: A17 Price Code: A10

iii
Preface
With the inception of the National Aeronautics and Space Administration’s Exercise Countermeasures Project and
Supporting Laboratories at Johnson Space Center, Houston, Texas, I directed that a procedures manual be established
which defined the laboratories’ method of collecting astronaut crew physiological performance data. The Exercise
Countermeasures Project Laboratory is a standard physiology laboratory; only our application to the study of human
physiological adaptations to space flight is unique. Therefore, in the absence of any other recently published
laboratory manual, it was decided to publish this “Procedures for Exercise Physiology Laboratories” as a useful
document for the staffs and students of other laboratories. Dr. William G. Squires coordinated the development of
this manual. Dr. Phillip A. Bishop was a contributing author and also worked with each author on section content.
Michael C. Greenisen
Manager, Exercise Countermeasures Project
Life Sciences Research Laboratories
Johnson Space Center

iv

Contents
Section Page
v
1 Introduction ....................................................................................................................................... 1
2 Laboratory Safety. ............................................................................................................ .................. 1
2.1 Emergency Procedures ........................................................................................................ ............... 1
General Emergency Steps................................................................................................... ........... 1
Telephone Procedures.................................................................................................................... 1
Graded Exercise Testing Emergency Procedures .......................................................................... 2
2.2 General Safety .............................................................................................................. ...................... 2
2.3 Equipment and Electrical Safety............................................................................................. ............ 3
2.4 Personnel Safety Training................................................................................................................... 3
3 Calibration ................................................................................................................... ....................... 5
3.1 Treadmill Calibration ....................................................................................................... .................. 5
Calibration of Treadmill Speed............................................................................................ .......... 5
Calibration of Treadmill Grade ............................................................................................ ......... 7
Speed and Grade Adjustments............................................................................................... ........ 8
3.2 Cycle Ergometer Calibration ................................................................................................. ............. 8
Calibration of Ergometer Speed/Distance................................................................................... ... 9
Calibration of Ergometer Friction Brake ................................................................................... .... 10
4 Laboratory Procedures......................................................................................................... ............... 11
4.1 Preparation of Human Subjects ............................................................................................... ........... 11
4.2 Graded Exercise Testing (GXT)............................................................................................... .......... 11
General Procedures........................................................................................................ ................ 11
Breathing Apparatus and Related Equipment ................................................................................ 12
Care and Cleaning of Mouthpieces and Respiratory Valves.......................................................... 15
Troubleshooting............................................................................................................................. 15
Staff Responsibilities ..................................................................................................................... 16
Safety Procedures. ......................................................................................................................... 17
Subject Screening .......................................................................................................................... 17
Contraindications........................................................................................................................... 18
Pre-Exercise Testing Measurements.............................................................................................. 19
Subject Monitoring and Recording of Responses .......................................................................... 19
Perceived Exertion Measurements................................................................................................. 20
Termination Criteria ...................................................................................................................... 20
Recovery Procedures ..................................................................................................................... 21
Medical Interpretation of Results .................................................................................................. 21
Record Keeping ............................................................................................................................. 21
4.3 Measurement of Oxygen Consumption Using the Douglas Bag Method............................................ 22
4.4 Anaerobic Capacity Measurement...................................................................................................... 24

Contents(continued)
Section Page
vi
4.5 Strength and Power Measurement ...................................................................................................... 25
Iso-load Testing ............................................................................................................................. 26
Isometric Testing ........................................................................................................................... 26
Isokinetic Testing .......................................................................................................................... 26
Isotonic Testing ............................................................................................................................. 27
4.6 Blood Lactate Measurement ............................................................................................................... 28
4.7 Measurement of Body Composition ................................................................................................... 32
Equipment .................................................................................................................................... 32
Hydrostatic Weighing Procedures ................................................................................................. 33
Residual Volume Procedures......................................................................................................... 36
Sources of Error............................................................................................................................. 39
4.8 Criterion Measurement of O2 and CO2 with the Micro-Scholander .................................................. 41
Equipment ................................................................................................................. .................... 41
Chemicals ................................................................................................................. ..................... 43
Supply Sources .............................................................................................................................. 44
Formula Preparation ....................................................................................................... ............... 44
a. Acid Rinse ............................................................................................................ .................... 44
b. CO2 Absorber........................................................................................................................... 45
c. O2 Absorber.............................................................................................................................. 45
Reaction Chamber Preparation ...................................................................................................... 45
Pre-Operational Procedures ........................................................................................................... 46
Scholander Operation .................................................................................................................... 48
4.9 Environmental Measures .................................................................................................................... 51
Wet Bulb Globe Temperature (WBGT) ........................................................................................ 51
Hg Barometer Operation ............................................................................................................... 52
Appendix: Useful Common Conversions................................................................................................................ A-1
Figures
1 Assembly of 2-way non-rebreathing valve and mouthpiece ............................................................... 13
2a Assembled breathing apparatus and headgear .................................................................................... 14
2b End-tidal sampling line and expiratory hose attachment .................................................................... 14
3 Hydrostatic weighing harness ............................................................................................................. 35
4 Residual volume measurement equipment ......................................................................................... 38
5 Samples tracing for residual volume measurement ............................................................................ 39
6 Micro-Scholander gas analyzer .......................................................................................................... 42

1
Section 1Introduction
This manual provides reference procedures for exercise and work physiology research laboratories. It is recognized
that every laboratory is unique in its goals and capabilities. Where possible we provide generic examples; at other
places we provide operating instructions for specific pieces of equipment. This manual is not exhaustive, and in
many cases there are multiple procedures for measuring a particular parameter. In some of these procedures, we
provide a brief introduction, then refer the user to other sources that describe the technique in detail.
Section 2Laboratory Safety
The key concern in all laboratory operations is ensuring the safety of both the research subjects and the laboratory
technicians. Safe laboratory operation depends upon constant vigilance by everyone in the laboratory from the most
naive subject to the experienced investigator. Every person in the lab should be trained to question any situation or
instruction which might result in injury.
2.1 Emergency Procedures
General Emergency Steps
In all emergencies, notify emergency medical technician (EMT) services as soon as possible. Initiate first aid as
needed.
Telephone Procedures
Post a notice of the type that follows above the most accessible telephones in the laboratory.
EMERGENCY
telephone 33333
READ SLOWLY AND CLEARLY:
This is the Exercise Physiology Laboratory in Building 261. We have a cardiac emergency and need your assistance
immediately. Please come to our laboratory on the first floor. Someone will be in the front lobby of Building 261 to
meet you.

2
Graded Exercise Testing (GXT) Emergency Procedures
a. Daily precautions
1. Check the operation of the telephone
2. Check the operation status of the defibrillator
b. Monthly precautions
1. Practice emergency procedures
2. Inspect expiration dates on all crash cart supplies
c. Emergency action responsibilities
1. Medical Officer • Direct all emergency procedures.
2. Laboratory Staff • Stop treadmill and apply brake.
• Remove breathing apparatus and disconnect blood pressure (BP) cuff.
• Move subject to floor or cot.
• Telephone rescue squad and read emergency statement.
• Initiate cardiopulmonary resuscitation (CPR) if indicated.
• Pull crash cart to victim.
• Assist Medical Officer.
• Clear lab of all unauthorized personnel.
• Meet rescue squad in lobby of building 261.
• Assist during the emergency as necessary.
• Keep log of all events, including (if applicable) time of event, medication
dosages and times of administration, defibrillation attempts and outcomes,
heart rates, and blood pressures.
2.2 General Safety
Safe operation of a laboratory requires constant effort. Never assume an unsafe condition is acceptable, even if it has
existed a long time. Particular physiology safety concerns are listed below.
a. Think about how the action you are about to take may influence safety. What will happen if you flip this
switch? If you are unsure, don’t touch it.
b. Anticipate the worst case. What happens if a subject faints during a blood draw? What happens if a subject
stumbles on the treadmill? Is the area as safe as possible, or does the equipment arrangement cause small
accidents to become big ones?

3
c. Be especially careful with human body fluids, including blood and blood products, saliva, sweat, and urine.
Wear gloves, mask, and eye protection when handling body fluids, toxins, or other potential hazards. All
laboratory personnel who work with body fluids should have hepatitis B vaccinations. A blood-borne pathogen
program which includes training of personnel should be implemented and updated annually.
d. Dispose of all laboratory waste properly. All sharp objects should be disposed of in a sharp biohazard container.
All biohazards including body fluids should be disposed of appropriately. If you are unsure, contact a nearby
health care facility or clinical laboratory for proper disposal.
e. Render hazards as safe as possible as soon as possible. For example, if you have an analyzer (such as an
automatic lactate analyzer) which temporarily stores body fluids, put some bleach in the waste bottle to kill
microorganisms at the earliest point.
f. Keep all bottles and other containers clearly labeled to show contents and date of origin.
2.3 Equipment and Electrical Safety
a. Ensure that all laboratory electrical outlets have ground fault interrupter (GFI) protection to reduce the risk of
electrocution in the often wet environment of laboratories.
b. Ensure that electrical circuits are not overloaded.
c. Avoid electrical cords or other fall hazards, particularly in foot-traffic areas.
d. Clearly label all on/off switches and circuit breakers.
e. Ensure a positive disconnect before removing the cover of any electrical or otherwise powered equipment.
2.4 Personnel Safety Training
a. All laboratory personnel should be well trained in current methods of basic CPR and first aid.
b. Personnel should practice the habit of routinely quizzing each other on their responsibilities in the event of
accidents such as heart attacks, falls, and fires.
c. Drills of potential emergency situations may be used to increase awareness of safety as a continuing and
important concern. An invitation to local emergency medical technicians to visit your laboratory can increase
safety awareness and make them aware of your needs.
d. If possible, personnel who perform graded exercise tests should be certified by the American College of Sports
Medicine (ACSM) as Preventive and Rehabilitative Exercise Test Technologists, Exercise Specialists, or
Program Directors.

4
Section 3Calibration
by
Phillip Bishop and Alan D. Moore, Jr.
Of all the steps which can be taken to ensure accurate measurement, none is more vital than careful and frequent
calibration. Calibration methods should always provide the highest accuracy within the expected range of the
measurement. For example, for measurement of resting metabolism, equipment should be calibrated for resting
ventilation and resting expired gas concentrations at expected resting temperatures rather than for some arbitrary
values.
The necessary frequency of calibration is partially dependent upon what is being measured and the functional
characteristics of the device. A gas analyzer which is known to drift substantially in 30 minutes will need more
frequent rechecking than one which is characteristically very stable. Each laboratory team must use its own
judgment, but calibration log books conveniently located at each instrument will provide a helpful means of tracking
equipment stability and status. This technique is particularly valuable when many different users operate the same
piece of equipment.
Included in the following sections are basic instructions for calibration of some equipment. Development of specific
written calibration procedures for your own laboratory will help ensure accuracy and consistency of operation of
your particular equipment.
3.1 Treadmill Calibration
Treadmill calibration is very simple; perhaps its simplicity is the reason that this calibration is often overlooked.
Since the treadmill is used so often in most exercise laboratories, periodic calibration is important to ensure the
validity of reported measures.
The two variables that most influence the metabolic equivalent workload elicited from a subject during treadmill
graded exercise testing are the speed and the grade of the treadmill. Calibration of a treadmill involves determination
of the accuracy of these two variables.
Calibration of Treadmill Speed
a. Make a mark near the edge of the treadmill belt with chalk or masking tape. Measure the complete length
(entire circumference) of the belt with an accurate metal or non-stretching tape measure. Make sure to mark a
reference point before the treadmill belt is moved (you will be able to measure in only 5- to 6-foot increments
before moving the belt). Keep the tape measure the same distance from the edge of the treadmill belt during all
measurements. Move the treadmill belt with your hands or very slowly with the motor when changing from one
reference point to another. It will help in later calculations to report the distance in feet and tenths (i.e.,
18’6"=18.5 ft, 15’3"=15.25 ft, 16’2"=16.17 ft).

5
b. Turn on the treadmill and set it to the highest anticipated testing speed (7.0 to 10.0 mph is the typical range).
c. Measure the time (in seconds to the nearest tenth) it takes for the belt to make 10 to 30 revolutions. (Note: The
more revolutions the better, but accuracy tends to suffer due to human error if too many revolutions are
attempted.) Repeat this measurement three times. If one of the measurements is an obvious outlying point,
repeat the measurement, and disregard the outlying point in further calculations.
d. Repeat steps b and c throughout the range of speeds you anticipate using. (In most labs 2.0 through 10.0 mph at
1.0 mph increments would be adequate.)
e. Use the mean value of the triplicate measurements at each speed setting as the “actual time.”
f. Use the “actual time” to calculate the speed of the belt in revolutions per minute:
rev/min = revolutions x 60 sec/min
“actual sec”
g. Calculate actual speed (ft/min): Speed (ft/min)= (belt length) x (rev/min)
h. Convert speed in ft/min to speed in mi/h: Speed (mi/h) = Speed (ft/min) x 0.01136363 (the standard ft/min to
mi/h conversion factor)
i. To ensure that treadmill belt slippage is not a problem, check the speed with a heavy subject running on the
treadmill. If the data are different, adjust treadmill belt (see manufacturer’s documentation on this procedure).
Sample Speed Calibration
Measured Belt Length = 17.0 ft/rev
Indicated Speed = 7.0 mi/h
Time for belt to travel 20 revolutions (“actual time”) = 32.1 sec.
rev/min = 20 rev x 60 (sec/min)
32.10 sec
rev/min = 37.38
Speed(ft/min) = 17.0 ft/rev x 37.38 rev/min
Speed(ft/min) = 635.46
Speed (mi/h) = 635.46 ft/min x 0.01136363
Speed (mi/h) = 7.22 (The treadmill, at this indicated speed (7 mi/h, is 0.22 mi/h too fast.)

6
Calibration of Treadmill Grade
a. Using a carpenter’s level (the longer, the more accurate), verify that the treadmill is level when the grade
indicator reads 0% grade.
b. Mark two lines on the floor adjacent to the treadmill, one near the rear of the treadmill bed, the other near the
front, so that the distance between the lines is slightly shorter than the treadmill bed. The distance between these
two lines is the “run”.
c. Raise the treadmill to a 5% indicated grade. Measure the height of the treadmill bed at the front line and at the
back line. Repeat these measurements in triplicate. If one of the measurements is an obvious outlying point,
disregard it for further calculations. Use the level or a plumb line to ensure that you are measuring straight up
and down.
d. Subtract the height at the back line from the height at the front. The resulting value is the rise.
e. Calculate the slope (slope = rise/run). This value, multiplied by 100, is known as percent grade.
f. Repeat steps c through e at 5% grade increments throughout the grades you anticipate using. (Grades of 5, 10,
15, 20, and 25% are good selections).
Sample Grade Calibration
The run distance you marked on the floor adjacent to the treadmill is 5.0 ft (60 in.).
The treadmill is set at indicated 15.0% grade.
Height of treadmill bed at front of run = 14.75 in.
Height of treadmill bed at rear of run = 5.50 in.
Rise of treadmill = 14.75-5.50 = 9.25 in.
Slope = rise/run = 9.25/60 = 0.154
% Grade = Slope x 100 = 0.154 x 100 = 15.4%
The treadmill, at this grade, is 0.4% too high.

7
Speed and Grade Adjustments
Adjustments to the treadmill speed and grade will depend upon the model of the treadmill. The preferable method is
to adjust the indicators to accurately show the variables; the second most desirable method is to alter the computer
program if applicable. If no other adjustment is possible, a calibration curve or nomogram can be constructed and
placed close to the treadmill indicator. A less attractive alternative is to neatly and clearly relabel the indicators. If
the adjustment is so substantial that it cannot be made on the indicator, be sure to post a prominent warning that the
indicator is in error and should be corrected. A calibration log showing all calculations is useful for tracking changes
or possible errors and for determining future calibrations.
3.2 Cycle Ergometer Calibration
The following procedure applies to a cycle ergometer similar to the Monark model no. 686, braked using a friction
belt. (For electronic ergometers, follow the manufacture’s directions. Under most circumstances, an electronically
braked cycle ergometer requires special equipment not readily available in most laboratory settings.)
Two primary variables influence the metabolic equivalent workload elicited from a subject during cycle ergometry:
the speed of the flywheel and the tension applied to the flywheel by the friction belt. Calibration of a cycle
ergometer involves determination of the accuracy of these two variables.
Friction cycle ergometers use a known resistive force applied to the ergometer flywheel (usually the front wheel
serves both as a flywheel and a friction wheel) by a friction belt. As the wheel turns, the friction is increased by
some means, either a weight pan or a screw-type adjuster. As the friction reaches a certain level a weight is raised
or, as is the case for most Monark cycles, a pendulum weight is lifted. Therefore, if 2 kp of friction (kp is the force
exerted per kg at standard gravity) is exerted, the pendulum (or weight) will be raised to the 2 kp mark if the cycle is
properly calibrated. The product of speed of wheel motion times the resistance is power output. Since speed is most
easily measured in rev/min, the length of the wheel must be known to compute speed in m/min. The operator’s
manual should list the distance. The Monark 868 lists one pedal revolution yielding 6 m of flywheel distance. Since
pedal revolutions are usually the issue, the distance of wheel travel per pedal revolution is usually the critical
dimension. If the flywheel distance is not listed in the manual, it can be carefully measured. Fasten a very thin low-
stretch string securely to a spot on the flywheel, then make one pedal revolution, winding the string onto the wheel
and marking the point on the string to get flywheel travel distance. Repeat this procedure. Use a reference (such as a
ruler and a narrow line drawn on the pedal shaft) to ensure exactly one pedal revolution each trial.
Calibration of Ergometer Speed/Distance
Ergometer speed is regulated by the subject. Visual and audio feedback mechanisms (a speedometer and a
metronome) help the subject regulate a constant speed. The speedometer and the metronome, not the ergometer, are
calibrated.
a. Set the metronome to the cadences at which you plan to pace subjects. Since the metronome is set at 2 times the
cycle rev/min (one tick for each time a foot pushes the pedal down), and most testing protocols are at 50-60
rev/min, settings of 100 and 120 beats/min are most common.

8
b. With a stop watch, count the number of ticks. Start the stop watch on a tick, which is counted as zero; the next
tick is one, etc.
c. Speed up or slow down the metronome until the desired cadence is obtained.
d. Repeat steps b and c as many times as needed to ensure accuracy.
e. Note which setting on the metronome yields the desired cadence and use this setting for subsequent testing.
f. Have a subject pedal at the appropriate cadence (paced by the metronome). The indicated speed on the
speedometer is the calibrated speed used for subsequent testing. Repeat this step until you are sure of
measurement accuracy.
Calibration of Ergometer Friction Brake
The tension on the friction belt is provided by a pendulum on which variable settings can be calibrated using
reference weights. The Monark model 686 cycle ergometer pendulum has indications from 1 to 7 kg.
a. Set the cycle ergometer on a level surface. Check to be sure that the pendulum hangs at an indicated “0” load
when no friction is applied to the belt. If a “0” load is not indicated, move the pendulum blade (scale) using the
front set screw until a “0” load is indicated.
b. Disconnect the friction belt from the pendulum by stretching the spring (front of the ergometer) found in series
with the pendulum and the belt until the belt can be separated from the spring.
c. Hang a 1-kg weight from the pendulum at the spring attachment. (A wire or a string is used to hang the weight.
In theory, for maximum accuracy the string or wire should be weighed, and this weight accounted for in your
calibration. In practice, due to their light weight compared to the resolution of the crude scale on the pendulum,
these values can be ignored.) The deflection of the pendulum should be to 1kp. Be sure that the calibration
weight and its hanger are not touching the flywheel or otherwise being deflected.
d. If the calibration weight is touching the flywheel of the cycle, place a 1- to 2-inch shim under the rear support of
the cycle. This will allow the weights to hang freely. If a shim is required, the cycle pendulum must be
temporarily zeroed in this new configuration, then step (a) must be done afterwards.
e. Repeat step (c), using weights of 1 to 7 kg, or throughout the weight range in which you anticipate testing. It is
important that verification to the maximum weight used for testing is performed. (Interpolation of some lighter
settings is permissible, but do not extrapolate heavier ones.)
f. If the indicated settings are correct, calibration is complete. If the indicated pendulum settings are in error,
either a nomogram can be constructed to show the settings to use during testing, or the scale on the pendulum
can be re-marked to show the correct settings.
g. If a shim was used for your calibration, remove it from the rear support of the cycle and re-zero the pendulum to
the level floor. The other settings will adjust exactly as much as the “0” does.

9
Section 4Laboratory Procedures
4.1 Preparation of Human Subjects
Safe, accurate measurement begins with proper subject preparation. All research using human subjects requires
approval by a research board whose responsibility is objective assurance of protection of the health and welfare of
participants. Depending upon the specific measurement to be made, subject safety may require a medical
examination, medical history, activity history, etc. It should always include briefing the subject in detail on exactly
what is expected and why the test is being conducted. In most cases a written informed consent is required for
participation as an experimental subject, but regardless, it is the tester’s responsibility to ensure that the subject is
fully aware of what will occur. Subjects should also be briefed if rating of perceived exertion (RPE) or other subject
cooperation or performance is needed. Some things that appear easy may prove to be a problem for many subjects.
For example, walking on a treadmill can be initially difficult for some subjects.
4.2 Graded Exercise Testing
by Alan D. Moore, Jr.
This sectioni was written to apply to operations of the Exercise Physiology Laboratory at the Johnson Space Center;
however, most of the information can be applied to any exercise physiology laboratory.
General Procedures
The following steps in a typical GXT session may be used as a checklist during laboratory operations or as an aid intraining lab personnel.
a. Before subject arrives
1. Check emergency procedures, defibrillator and drug tray, telephone.
2. Check electrocardiogram (ECG) recorder and scope.
3. Verify operational status of treadmill or cycle and other monitoring equipment.
b. After subject arrives
1. Meet subject, explain purpose of test, answer questions.
2. Using screening form, get subject's medical history, current medical status, and medications currently in
use. Witness subject's informed consent signature.
3. Report pertinent medical information from screening form to physician.
4. Explain communication needs, importance of different symptoms, and exertion scale to subject.
5. Locate anatomical sites for ECG electrodes, prepare skin, apply electrodes, and connect subject to ECG.
i Portions of this section were adapted, with permission, from the “Cardiac and Intervention Center at VirginiaTech—Organizational Guidelines.” The author acknowledges the contribution of the Virginia Tech CardiacProgram Staff and of William G. Herbert, Ph.D., Program Director.

10
c. Before the Test Begins
1. Subject should rest for 5 minutes before measurements are performed to ensure valid resting measures.
2. Locate brachial artery, measure resting (supine) BP in same arm to be used in GXT, record supine ECG.
3. Perform hyperventilation ECG (if desired); note any significant ECG changes.
4. Measure BP (standing for treadmill test, sitting for cycle test) in same arm to be used in GXT; record ECG
in same posture.
5. Familiarize subject with exercise procedures, such as the need to avoid gripping the bar and extraneous
movement.
d. During the Graded Exercise Test
1. Start GXT; start metabolic analysis system (if used).
2. Measure and record exercise BP and ECG during each stage of exercise (usually BP and then ECG during
the last minute of a stage is sufficient).
3. Continually monitor the oscilloscope; record and report any significant ECG changes (ectopy).
4. Observe subject, note signs and symptoms, obtain perceived exertion measures, operate exercise mode.
5 Keep time, and change stages at the appropriate time.6. Terminate test in presence of appropriate criteria (see section on Termination Criteria).
e. Following the Graded Exercise Test
1. Record ECG (in even min.) during recovery; record significant changes.
2. Measure and record recovery BP following each recovery ECG.
3. Explain recovery procedures (do not take a hot shower immediately after leaving the laboratory, etc.).
Breathing Apparatus and Related Equipment
When respiration is to be monitored, the equipment shown in figures 1 and 2 is assembled and used with the
treadmill or ergometer tests. Figure 1 identifies the parts of the breathing apparatus, lists assembly steps, and shows
the relationships of the joined parts. The assembled parts are secured to a headpiece with a rubber gasket, then fitted
to a comfortable position on the subject’s head (figure 2a). A clip is provided for the subject to place on the nose to
ensure mouth breathing during the test. The last assembly step is to attach the end-tidal sampling line and the
expiratory hose from the metabolic measurement system (Q-Plex) to the assembled unit (figure 2b). The expiratory
hose should not be connected to the Q-Plex until calibration is complete.

11
#1 Saliva Collection Tube
#2 & #3 Spiral Valve
#4 Mouthpiece Port
#5 Exhalation Port(Clear Plastic)
#6 InhalationPort (WhitePlastic)
#7 Large 2-way NRBV
#8 Mouthpiece
Assembly steps
a. Connect #1 to the bottom of #7. d. To the back of #7, connect #4
b. Place #2 and #6 to the right side of #7. e. Connect #8 to #4.
c. To the left end of #7, attach #3 and #5.
#1
#2 #3
#4#5
#6
#7 #8
Red Ring
End-TidalSampling Line
ExpiratoryHose fromQ-Plex
Figure 1. Assembly of 2-way non-rebreathing valve and mouthpiece.

12
Second, have subjectplace mouthpiece inmouth.
First, adjusthead band.
Third, adjust valvesupports on bothsides of the headwhile subject holdsvalve in acomfortableposition.
Fourth, have subjectplace noseclip on.
Figure 2a. Assembled breathing apparatus and headgear.
Expiratory hosefrom Q-Plex
End-TidalSampling line
Red ring
Figure 2b. End-tidal sampling line and expiratory hose attachment.
Care and Cleaning of Mouthpieces and Respiratory Valveii
a. Disassemble mouthpiece, using gloves to protect hands.
b. Prewash mouthpiece in mild soap and tap or distilled water.
c. Disinfect mouthpiece by either chemical or heat application.
1. Chemical Disinfection: Use a mild glutaraldehyde solution such as Cidex, Sporicidin, Metricide, Glutarex,
or Hibiclens. Follow the manufacturer’s directions regarding the use of these products. Avoid alcohol-
based solutions.
2. Heat Disinfection: Do not exceed 45 °C (113 °F). Avoid autoclaving, pasteurization, or gas sterilization.
ii Recommended by Hans Rudolph, Inc., October 1989
13
d. Rinse mouthpiece components with tap, distilled, or sterile water.
e. Dry mouthpiece with a heated chamber.
f. Inspect mouthpiece components for deformity, distortion, cracks, or deterioration, and check cleanliness.
g. Lubricate mouthpiece joints with recommended silicone grease2.
h. Assemble mouthpiece for immediate use or package for future use.
i. Check disinfection materials regularly to ensure appropriate cleaning of mouthpieces.
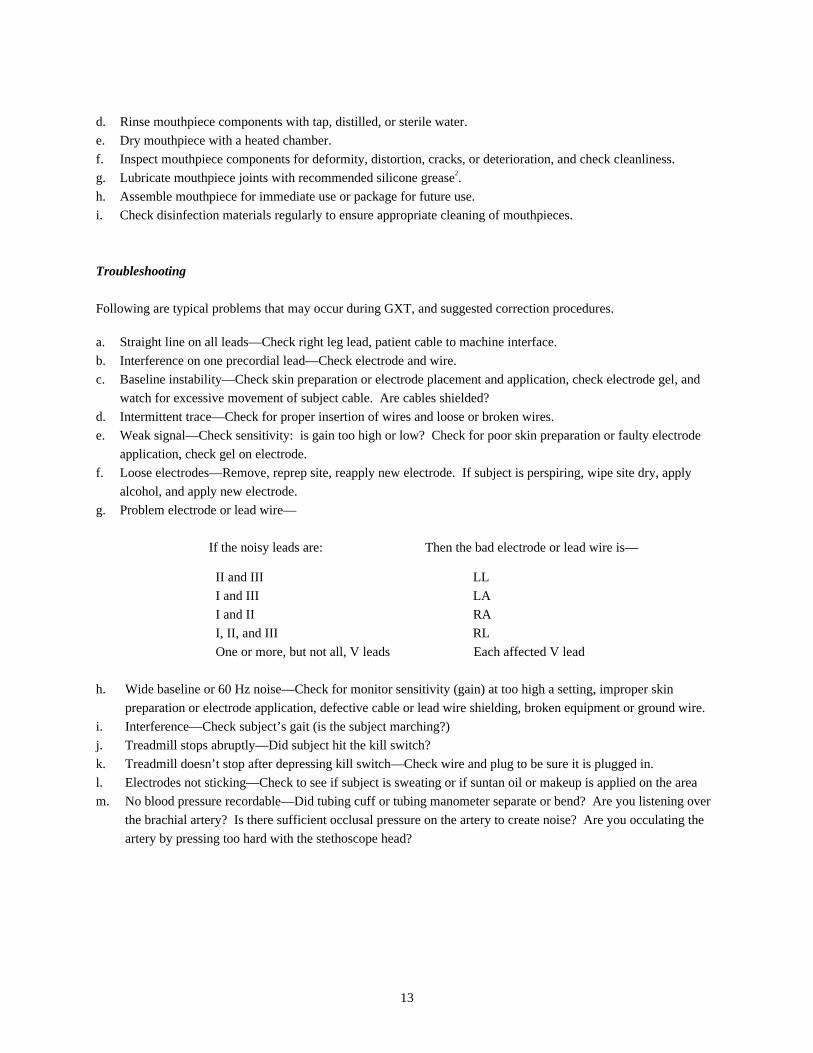
Troubleshooting
Following are typical problems that may occur during GXT, and suggested correction procedures.
a. Straight line on all leads—Check right leg lead, patient cable to machine interface.
b. Interference on one precordial lead—Check electrode and wire.
c. Baseline instability—Check skin preparation or electrode placement and application, check electrode gel, and
watch for excessive movement of subject cable. Are cables shielded?
d. Intermittent trace—Check for proper insertion of wires and loose or broken wires.
e. Weak signal—Check sensitivity: is gain too high or low? Check for poor skin preparation or faulty electrode
application, check gel on electrode.
f. Loose electrodes—Remove, reprep site, reapply new electrode. If subject is perspiring, wipe site dry, apply
alcohol, and apply new electrode.
g. Problem electrode or lead wire—
If the noisy leads are: Then the bad electrode or lead wire is—
II and III LL
I and III LA
I and II RA
I, II, and III RL
One or more, but not all, V leads Each affected V lead
h. Wide baseline or 60 Hz noise—Check for monitor sensitivity (gain) at too high a setting, improper skin
preparation or electrode application, defective cable or lead wire shielding, broken equipment or ground wire.
i. Interference—Check subject’s gait (is the subject marching?)
j. Treadmill stops abruptly—Did subject hit the kill switch?
k. Treadmill doesn’t stop after depressing kill switch—Check wire and plug to be sure it is plugged in.
l. Electrodes not sticking—Check to see if subject is sweating or if suntan oil or makeup is applied on the area
m. No blood pressure recordable—Did tubing cuff or tubing manometer separate or bend? Are you listening over
the brachial artery? Is there sufficient occlusal pressure on the artery to create noise? Are you occulating the
artery by pressing too hard with the stethoscope head?

14
Staff Responsibilities
The following lists outline the major responsibilities of laboratory staff members during GXT. It should be
recognized that one staff member may actually perform the duties of both test coordinator and technician. At least
two technicians and a physician, if indicated, should be present during GXT.
a. Physician’s duties
1. Direct testing
2. Interpret/confirm test results
3. Confirm prescriptions/counsel subjects
4. Direct emergency procedures
5. Approve subjects for further participation
b. Test Coordinator’s duties
1. Direct emergency procedures during non-physician-supervised tests
2. Ensure lab readiness
3. Manage equipment operation, calibration, maintenance, repair
4. Ensure crash cart readiness
5. Train and supervise GXT staff
6. Control quality of GXT data
7. Administer screening form prior to GXT
8. Maintain blank forms in files
9. Administer and witness informed consent, at direction of Principal Investigator
10. Communicate results of test to P.I. if appropriate
c. ECG Technician duties
1. Secure background medical records
2. Manage subject safety during GXT
3. Prepare patient for ECG
4. Operate and maintain ECG recorder
5. Possibly act as a BP technician
6. Work with test coordinator in preparing lab reports
7. Perform data reduction
d. BP Technician’s duties
1. Check defibrillator before testing session
2. Manage subject safety during and after GXT3. Be responsible for VO2 procedures (if applicable) and system care, operation, validity, and reliability
4. Be responsible for BP procedures and system care, operation, system validity, and reliability
5. Orient subject
6. Obtain RPE during exercise
7. Perform data reduction

15
Safety Procedures
A written plan for emergencies should be posted in the laboratory and rehearsed at least monthly. Cardiac
resuscitation equipment, including a portable defibrillator, drugs, airway tubes, and oxygen supplies should be on
hand. The defibrillator should be checked before each GXT and emergency drugs should be inventoried every 6
weeks. The telephone should be checked before each test session. All laboratory personnel should have current
certification in CPR. It is recommended that personnel who regularly participate in GXT be certified in Advanced
Cardiac Life Support (ACLS). Detailed emergency procedures are given in section 2.1 of this manual.
Subject Screening
Subjects for GXT should always be screened, regardless of their age, gender, or normal activity level. Usually,
subjects with no or only one coronary artery disease risk factor, and who are below a specific age (40 years for
males, 50 for females) may engage in maximum GXT without physician supervision. An excellent discussion ofsubject screening for GXT is contained in the American College of Sports Medicine: Guidelines for Exercise Testing
and Prescription, 5th ed., 1995. Use of a standard screening procedure for subjects is encouraged to minimize
omission of important information. At the Johnson Space Center, physicians of the health screening facility perform
an initial examination of all subjects tested.
The primary investigator for the study being performed, or an individual knowledgeable in the procedures, should
obtain written informed consent. The consent form outlines the procedures for testing, the risks inherent in the
investigation, and the benefits to the subject. It should also state that the test is being conducted voluntarily, and that
the subject is free to withdraw from the study at any time. The investigator who administers the informed consent
should be sure that the subject understands all aspects of the test and is fully aware of the risks and benefits of the
testing procedures. The investigator should witness the subject’s signing of the informed consent form, and answer
any questions the subject may have regarding the study.
The individual responsible for test logistics and operations interviews the subject on the day of the test, and if
physician coverage of the test is required, briefs the attending physician on any pertinent information dealing with the
subject’s past and present medical status obtained from the screening form and physical examination. The physician
reviews the records of the subject to be evaluated. If warranted, the physician will conduct a follow-up interview and
a brief physical exam before the test.
Contraindications
Most subjects who volunteer for studies conducted in an exercise physiology laboratory require, at most, physician
supervision during the test. However, there are conditions (absolute contra-indications) that can preclude safe
conduct of an exercise test because the risk of conducting the test clearly exceeds any potential benefits. There are
other circumstances (relative contraindications) under which the risk of conducting the test is relatively high
compared to the benefits obtained. Testing of subjects with relative contraindications in a typical exercise
physiology laboratory is not advised unless the test is being conducted to diagnose or further evaluate the clinical
condition of a subject to define treatment, or the test is specifically being conducted to collect research data which

16
may lead to the improved treatment of a patient population of which the subject is a member. The following lists of
contraindications to exercise testing have been developed by the American College of Sports Medicine.iii
a. Absolute Contraindications
1. A recent significant change in the resting ECG suggesting infarction or other acute cardiac events
2. Recent complicated myocardial infarction
3. Unstable angina
4. Uncontrolled ventricular dysrhythmia
5. Uncontrolled atrial dysrhythmia which compromises cardiac function
6. Third-degree A-V block
7. Acute congestive heart failure
8. Severe aortic stenosis
9. Suspected or known dissecting aneurysm
10. Active or suspected myocarditis or pericarditis
11. Thrombophlebitis or intracardiac thrombi
12. Recent systemic or pulmonary embolus
13. Acute infection
14. Significant emotional distress (psychosis)
b. Relative Contraindications
1. Resting diastolic blood pressure > 120 mmHg or resting systolic > 200 mmHg
2. Moderate valvular heart disease
3. Known electrolyte abnormalities (hypokalemia, hypomagnesemia)
4. Fixed-rate pacemaker (rarely used)
5. Frequent or complex ventricular ectopy
6. Ventricular aneurysm
7. Cardiomyopathy including hypertrophic cardiomyopathy
8. Uncontrolled metabolic disease (e.g., diabetes, thyrotoxicosis, myxedema)
9. Chronic infectious disease (e.g., mononucleosis, hepatitis, AIDS)
10. Neuromuscular, musculoskeletal, or rheumatoid disorders that are exacerbated by exercise
11. Advanced or complicated pregnancy
Pre-Exercise Test Measurements
A 12-lead resting ECG and blood pressures are typically recorded with the subject supine prior to exercise. A 30-
second hyperventilation ECG is performed with subject sitting on the cot (first 20 seconds), and then ECG recordings
are done with the subject recumbent (last 10 seconds). The purpose of the hyperventilation ECG is to screen out
changes in the electrocardiogram, particularly T-wave flattening or inversion and minor ST-segment depression, that
may occur due to hyperventilation, and are not associated with myocardial ischemia. The hyperventilation tracings
need be performed only prior to the subject’s first graded exercise test. Several laboratories perform hyperventilation
recordings only if the subject completes a test and has ST-T wave changes. Resting standing 12-lead ECG blood
pressures are assessed before treadmill testing; resting sitting measurements are recorded before cycle testing. iii From American College of Sports Medicine: Guidance for Exercise Testing and Prescription, 5th ed.Philadelphia, Lea & Febiger, 1995. Reproduced with permission.

17
Subject Monitoring and Recording of Responses
The EEG is continually monitored on an oscilloscope. A three-channel scope is optimal. Leads II (left inferior), V2
(septal), and V5 (lateral) are the preferred leads to monitor under most circumstances. Heart rate, RPE, blood
pressure, and a 12-lead ECG are recorded during the final minute of each exercise level. If oxygen uptake
measurements are desired, these should be done continually during the exercise test. Any signs/symptoms of
exertion intolerance should also be recorded during the exercise test.
Perceived Exertion Measurement
Give the subject these or similar instructions for describing his or her effort during exercise test:
During the exercise test it is important for us to know how difficult the exercise feels to you. These feelings of
effort, taken at each stage of the test, help us determine how much longer you will be able to exercise and help us
monitor your subjective response to the exercise.
Keep in mind that you are describing your body’s “feeling of effort” at each exercise level. Pay attention to your
breathing, body heat, sensations of effort in your legs and chest. Ignore such things as the treadmill speed or incline.
This chart shows a set of terms and related numbers from which you can choose a rating for each level of activity.
While you exercise, a chart like this will be held for you to see. Simply point to the rating that best describes how
you feel.
Borg’s Rating of Perceived Exertion
1 - Very weak
2 - Weak
3 - Moderate
4 - Somewhat strong
5 - Strong
6
7 - Very strong
8
9
10 - Maximal

18
Termination Criteria
The graded exercise test continues until the subject reaches a volitional endpoint or the exercise bout is terminated
due to the onset of signs or symptoms of intolerance or the appearance of significant ECG aberrations. The
following indications for stopping an exercise test have been published by the American College of Sports
Medicine.iv
a. Progressive angina (stop at 3+ level or earlier on a scale of 1+ to 4+)
b. Ventricular tachycardia
c. Any significant drop (20 mmHg) of systolic blood pressure, or failure of the systolic blood pressure to rise with
an increase in exercise load after the initial adjustment period
d. Lightheadedness, confusion, ataxia, pallor, cynosis, nausea, or signs of severe peripheral circulatory
insufficiency
e. Early onset deep (>4mm) horizontal or downsloping ST-depression or elevation
f. Onset of second or third degree A-V block
g. Increasing ventricular ectopy, multiform premature ventricular contractions (PVCs), or R on T PVCs
h. Excessive rise in blood pressure: systolic pressure >250 mmHg; diastolic pressure >120 mmHg
i. Chronotropic impairment: increase in heart rate that is < 25 bpm below age-predicted normal
value (in the absence of beta blockage)
j. Sustained supraventricular tachycardia
k. Exercise-induced left or right bundle branch block
l. Subject requests to stop
m. Failure of the monitoring system
Recovery Procedures
Monitoring of the subject continues until his/her responses stabilize at near pre-exercise levels or until the attending
physician feels the subject is sufficiently recovered to dismiss (usually this requires a minimum of 5 minutes
monitored recovery). Between post-exercise ECG recordings the subject is interviewed to determine peak exercise
ratings of perceived exertion and symptoms which caused the termination of the test. The subject may be offered
fluids during this recovery period. The subject should be cautioned regarding showering following the activity (use
only lukewarm water, do not stand completely still, etc.)
Medical Interpretation of Results
Laboratory affiliated physicians base their interpretation of GXTs on the guidelines established by the American
College of Sports Medicine and the American Heart Association. Abnormal test results may be a result of
electrocardiographic changes (e.g., ST segment depression or elevation, ventricular or supraventricular dysrhythmias,
exercise induced bundle branch block), blood pressure changes (e.g., failure of SBP to rise, rise in DBP), or
symptoms (e.g., chest pain). The interpretation should be recorded, and recommendations regarding further
iv From American College of Sports Medicine: Guidelines for Exercise Testing and Prescription, 5th ed.Philadelphia, Lea & Febiger, 1995. Reproduced with permission.

19
participation as a subject should also be recorded. The attending physician is required to sign the graded exercise test
summary form.
Record Keeping
Following each GXT, physiological data, the ECG, and the physician’s interpretation of the test should be placed in a
subject’s file. Confidentiality of subject information should be maintained. Each file should also contain
information concerning past and present medical status, the results of previous GXTs, and laboratory evaluations.
Selected Bibliography
American College of Sports Medicine. Guidelines for exercise testing and prescription. 5th ed. Philadelphia: Lea &
Febiger; 1995.
American College of Sports Medicine. Resource manual for guidelines for exercise testing and prescription. Blair,
S.N.; Painter, P.; Pate, R.R.; Smith, L.K.; and Taylor, C. B. (editors). Philadelphia: Lea & Febiger; 1991.
American Heart Association. Exercise standards: a statement for health professionals. Dallas: American Heart
Association; 1991.
Borg, G.A.V. Psychophysical bases of perceived exertion. Medicine and Science in Sports and Exercise. 14(5):
377-381; 1982.
Cardiac and Intervention Center at Virginia Tech. Operational guidelines: organization, policies and procedures.
Blacksburg, VA: Cardiac Therapy Center at Virginia Tech; 1983.
McKirnan, M.D.; Froelicher, V.F.. General principles of exercise testing. In: Skinner, J.S., editor, Exercise Testing
and Exercise Prescription for Special Cases. Philadelphia: Lea & Febiger; 1987.
Exercise Physiology Laboratory Procedures Manual. Moore, A.D.; Bishop, P.A.; Buntin, C.M.; Squires, W.G.; and
Wells, K.D. (editors). Houston: Lyndon B. Johnson Space Center, Space
Biomedical Research Institute; 1991. [Internal report JSC-25030.]
4.3 Measurement of Oxygen Consumption Using the Douglas Bag Method
by Suzanne Fortney
The Douglas bag method of indirect, open circuit spirometry involves collecting the expired gases of a subject and
calculating oxygen consumption. The following equipment is used in the procedure.
a. Douglas bags or modified Douglas bags (rubberized weather balloons) with a sampling port of Polyethylene
(PE) or rubber tubing ending in a stopcock.
b. Dry gas meter with thermometer to measure gas temperature

20
c. Metabolic gas analyzers (O2 and CO2), with drying line holding a drying compound such as drierite.
d. Barometer
e. Two-way, high velocity, low resistance breathing valve
f. Mouthpiece
g. Noseclip (or gas collection mask)
h. Large bore, low resistance tubing
i. Collins 3-way valves (one for each Douglas bag)
j. Portable cart on wheels to support Douglas bags, tubing, and Collins valves connected in series (optional for
multiple measurements)
k. Small hand-held vacuum cleaner and hose attached to output side of the dry gas meter (optional)
The subject breathes through the mouthpiece connected to a 3-way breathing valve. The expired side of the
breathing valve is connected by large bore flexible tubing to a Collins 3-way valve. On another side of the Collins
valve, the Douglas bag (weather balloon) is attached. Between measurements, the Collins 3-way valve is turned so
that the expired air is vented to the room. At timed intervals (usually 1 min.) the Collins 3-way valve is turned so
that the expired air throughout that entire minute is collected into the Douglas bag. Douglas bags may be connected
in series with additional tubing and 3-way valves so that multiple serial collections may be made.
To analyze the gas from the Douglas bag, a thin piece of PE or rubber tubing is connected from the throat of the
Douglas bag, ending in a stopcock. Each Douglas bag is gently mixed prior to gas analysis. This stopcock is
connected to the gas analysis system via a drying column containing a chemical drying compound and opened for a
given time for sampling (usually about 1 min., depending on the length of PE tubing and the sampling rate of the
analyzers). The analyzer sampling rate must be known. The Douglas bag is next connected through large bore
tubing to the input side of the dry gas meter. A zero reading on the meter is recorded. The Douglas bag is then
completely emptied through the dry gas meter. This can be done by manually folding up the bag, or, more
accurately, by attaching a small vacuum cleaner to the output side of the dry gas meter so that the bag is slowly
evacuated. When no further air can be drawn from the Douglas bag, the final volume reading is obtained from the
dry gas meter and the temperature of the air is recorded from the thermometer attached to the dry gas meter. Thevolume measurement is adjusted upwards to account for the volume of air drawn from the bag during the gas O2 and
CO2 analysis. The total gas volume is corrected to STPD and these values of volume (ventilation), O2 and CO2
concentrations from the expired samples are used in the following equation to calculate oxygen consumption.
Ve (FeO2i - FeO2e) - VCO2 . FeO2i
VO2 =______________________________
1 - FeO2i
Ve = total ventilation, standardized to STPDFeO2i = fraction of O2 in the inspired air (0.293)
FeO2e = fraction of O2 in the expired air
VO2 = oxygen consumption
VCO2 = carbon dioxide production
FeCO2i = fraction of carbon dioxide in the inspired air (0.0003)
FeCO2e = fraction of carbon dioxide in the expired air
VCO2 = Ve (FeCO2e - FeCO2i)

21
4.4 Anaerobic Capacity Measurement
by Steven P. Siconolfi
The Wingate test is frequently used to assess anaerobic capacity. In brief, the Wingate test consists of 30 seconds of
all-out cycling with the ergometer load predetermined based upon body weight or other predictors. The subject is
instructed to achieve as many revolutions as possible in 30 seconds. Revolutions are counted to the nearest half,
preferably by means of electronic counter or video taping. Peak mechanical power, average power, and power
decline can then be calculated. The same procedure can be performed with the arms if arm cranks are substituted for
pedals. The best type of ergometer is one in which the resistance can be added very accurately and quickly, such as
the Monark 814E or 864 in which the resistance is added by dropping weights onto a holder. Ergometer wheel
inertia influences the outcome of many cycle ergometer tests. Procedures for accounting for wheel inertia are
provided in Bassett (1989). Some have suggested that the resistance of weight-loaded ergometers is affected by
heating of the friction wheel, but this possible deficiency should be weighed against the advantage of instantaneous
landing.
An alternative measure for anaerobic power can be obtained with the Margaria power test, which is described in
detail in di Prampero (1981). This test needs only a safe set of stairs, a scale for measuring body weight or mass, and
a timing device, preferably a mat switch timer which can be activated with foot contact.
A third measure of anaerobic capacity can be performed through a brief intensive treadmill run. Cunningham and
Faulkner proposed a run to exhaustion after jumping on a moving treadmill belt at 8 mi/h and 20% grade. We have
experimented with an 8 mi/h run at 20% grade after allowing a 1-min warm-up at 5 mi/h. In this case an automated
treadmill (Quinton Q-65) was used which increases from 5 to 8 mi/h in about 15 sec and from 0 to 20% grade in 40
sec. Subjects typically are able to run for only about 60 sec from the end of warm-up. A safety harness system has
been used in this test to maximize safety and increase subject confidence.
Selected Bibliography
Bassett, D. Correcting the Wingate test for changes in kinetic energy of the ergometer flywheel. Int. J. Sports Med.
10(6):446-449; 1989.
Bergh, U. The cycle ergometer as a tool for muscle strength measurements. In: Bergh, U. and Robertsson, H.
(editors), 10th Int. Congress of Biomechanics, Umea, Sweden; 1985.
Coggan, A. R.; Costill, D. L., Biological and technological variability of three anaerobic ergometer tests. Int. J.
Sports Med. 5(3):142-145; 1984.
Cunningham, D. A.; Faulkner, J. A/ The effect of training on aerobic and anaerobic metabolism during a short
exhaustive run. Med. Sci. Sport 1:65-69, 1969.
Davies, C. T. M.; Wemyss-Holden, J.; and Young, K. Maximal power output during cycling and jumping. J.
Physiol. 322-43; 1982.

22
di Prampero, P. E. Energetics of muscular exercise. Rev. Physiol Biochem. Pharmacol. 89:143-222; 1981.
Evans, J. A.; Quinney, H. A. Determination of resistance settings for anaerobic power testing. Can. J. Appl. Sports
Sci. 6(2):53-56; 1981.
Jakobs, I. The effects of thermal dehydration on performance of the Wingate anaerobic test. Int. J. Sports Med.
1:21-24; 1980.
Jakobs, I. O. Bar-or; Karlsson, J.; Dotan, R.; Tesch, P.; Kaiser, O.; and Inbar, O. Changes in muscle metabolites in
females with 30 sec exhaustive exercise. Med. Sci. Sports Exerc. 14(6): 457-460; 1982.
Nadeau, M.; Cuerrier, J.P.; and Brassard, A. The bicycle ergometer for muscle power testing. Can. J. Appl. Sports
Sci. 8(1):41-46; 1983.
Sargeant, A. J.; Hoinville, E.; and Young, A. Maximum leg force and power output during short-term dynamic
exercise. J. Appl. Phsyiol.: Resp. Environ. Exerc. Physiol. 51(5):1175-1182; 1981.
Schnobel, A.; Kindermann, F.W. Assessment of anaerobic capacity in runners. Eur. J. Appl. Physiol. 52:42-46;
1985.
4.5 Strength and Power Measurement
by Marcas M. Bamman
Maximal strength is typically defined as the peak force or torque exerted during a maximal voluntary contraction
(MVC) under a given set of conditions (e.g., contraction mode, velocity) [Sale 1992]. The SI units for force and
torque are the Newton (N) and Newton·meter (N·m), respectively. Power is the time rate at which mechanical work
is performed and its SI unit is the Watt (W). A power of 1.0 W is equal to a force of 1.0 N acting at a linear velocity
of 1.0 m/s (or a torque of 1.0 N·m acting at an angular velocity of 1 rad/s).
The ability to accelerate the body mass or an external object is dependent upon one's strength and power [Sale 1992].
For athletes, one's level of performance on a particular strength or power test is linked to training specificity (i.e., a
power athlete will likely display a relatively higher level of performance at fast rather than slow velocities in an
isokinetic test) [Thorstensson et al. 1977]. Fortunately, there are several modes of strength and power testing
available. It is important to note that all tests of strength and power should be preceded by sufficient warm-up
contractions.
Iso-load Testing
The term isotonic is often used loosely to describe weight lifting type exercise in which the load being lifted is
constant (e.g., 100 kg); however, in its strict definition isotonic actually means constant tension in the muscle. Since
the actual tension (e.g., torque) applied to a weight varies as it is lifted through a range of motion due to alterations inmechanical advantage and acceleration/deceleration, this type of strength assessment is more accurately termed iso-
load testing (i.e., weight lifting). It is a measure of concentric contraction strength and one's maximum lift is limited

23
by the weakest point in a given range of motion. Typically, maximum strength is defined as the heaviest weight the
subject can lift once (one-repetition maximum, or 1RM) through a full range of motion. To perform a test for 1RM,
the subject should first warm up thoroughly, then attempt 1RM with increasing resistance until two attempts fail.
The heaviest load lifted successfully is the 1RM. Attempts should be separated by 2 to 3 minutes to allow full
recovery.
Isometric Testing
The term isometric indicates constant muscle length. Thus, an isometric strength test is one in which joint angle is
held constant and the subject exerts maximal effort in a static contraction. Typically, contractions should continue
for 2 to 5 seconds to ensure that peak tension is reached. A minimum of three trials should be performed separated
by 2 to 3 minutes to allow full recovery.
Since no mechanical work is performed in isometrics (i.e., displacement and velocity are zero), power cannot be
computed [Sale 1992]. Often times, however, the rate of tension development (RTD) is assessed. At the Johnson
Space Center RTD has been studied to determine whether muscles contract faster or slower after a period of
unloading. RTD can be computed on an absolute scale (e.g., time from 20 N·m to 100 N·m) or a relative scale (e.g.,
time from 10% to 60% MVC).
Isometric contraction is the ideal test mode when surface electromyography is applied to investigate motor unit
recruitment and/or firing frequency because movement artifact is minimized. At the Johnson Space Center EMG
during isometric contraction has been studied to determine whether neural activation of agonists and antagonists is
altered with unloading.
Isokinetic Testing
Isokinetic, or constant velocity, contractions are often tested to investigate speed-specific performance of a muscle
group. Isokinetic testing allows the investigator to determine maximal performance in both concentric and eccentric
modes. Further, isokinetic testing enables the subject to exert maximal effort throughout the full range of motion
(i.e., accommodating resistance) as opposed to iso-load testing. The resistance mechanism of an isokinetic
dynamometer acts to increase resistance as velocity increases to slow the actuator to the preset velocity, and vice
versa. At higher preset velocities, the time taken to achieve the isokinetic phase is longer so the isokinetic phase is a
smaller portion of the total movement [Sale 1992]. Therefore, when comparisons of performance among velocities
are to be made, it is important to standardize the actuator position at which the measurements are taken, which
should be in the middle of the range of motion. For example, torque-velocity relationships for the knee extensors
have been developed using multiple angular velocities and recording torque output at 30° of knee flexion [Caiozzo et
al. 1981]. Isokinetic dynamometry is an ideal test mode when one is investigating torque, work, and power
simultaneously.
A repetition continuum of 3 to 5 maximal efforts should be performed at each velocity. Studies have shown,
particularly at higher velocities, that performance improves during the first 2 to 3 repetitions; thus single repetition
trials may not elicit true maximal performance at a given velocity [Johnson & Siegel 1978]. When testing
performance at multiple velocities, each velocity-specific trial should be separated by 2 to 3 minutes to allow full
recovery.

24
Isotonic Testing
True isotonic testing allows the investigator to preset a force or torque which is maintained throughout the range of
motion by accommodating velocity. Many isokinetic dynamometers offer an isotonic mode. Isotonic testing can
measure the acceleration, peak velocity, work, and power achieved at a preset force.
For a detailed description of procedures for testing strength and power, see Sale [1992].
Selected Bibliography
Bandy WD and WP Hanten. Changes in torque and electromyographic activity of the quadriceps femoris musclesfollowing isometric training. Phys Ther. 73(7):455-67. 1993.
Caiozzo VJ, JJ Perrine, and VR Edgerton. Training-induced alterations of the in vivo force-velocity relationship ofhuman muscle. J Appl Physiol: Respirat Environ, and Exerc Physiol. 51:750-4, 1981.
Coyle EF, DC Feiring, TC Rofkis, RW Cote III, FB Roby, W Lee, and JH Wilmore. Specificity of powerimprovements through slow and fast isokinetic training. J Appl Physiol: Respirat Environ, and Exerc Physiol.
51:1437-42, 1981.
Duchateau J, and K Hainaut. Isometric or dynamic training: differential effects on mechanical properties of a humanmuscle. J Appl Physiol. 56:296-301, 1984.
Hakkinen K, PV Komi, and M Alen. Effect of explosive type strength training on isometric force- and relaxation-time, electromyographic and muscle fiber characteristics of leg extensor muscles. Acta Physiologica Scand.
125:587-600, 1985.
Heinonen A, H Sievanen, J Viitasalo, M Pasanen, P Oja, and I Vuori. Reproducibility of computer measurement ofmaximal isometric strength and electromyography in sedentary middle-aged women. Eur J Appl Physiol.
68:310-4. 1994.
Johnson J, and D Siegel. Reliability of an isokinetic movement of knee extensors. Res Quar. 49:88-90, 1978.
Knapik JJ, JE Wright, RH Mawdsley, and J Braun. Isometric, isotonic, and isokinetic torque variations in fourmuscle groups through a range of joint motion. Phys Ther. 63:938-40, 1983.
Narici MV, GS Roi, L Landoni, AE Minetti, and P Cerretelli. Changes in force, cross-sectional area and neuralactivation during strength training and detraining of the human quadriceps. Eur J Appl Physiol. 59:310-9.
1989.
Perrine JJ, and VR Edgerton. Muscle force-velocity and power-velocity relationships under isokinetic loading. Med
Sci Sports. 10:159-66, 1978.
Sale DG, JD MacDougall, SE Alway, and JR Sutton. Voluntary strength and muscle characteristics in untrained menand women and male bodybuilders. J Appl Physiol. 62:1786-93, 1987.

25
Sale DG. Testing Strength and Power. In: Physiological Testing of the High-Performance Athlete. JD
MacDougall, HA Wenger, and HJ Green, Eds. Human Kinetics: Champaign, IL. 1992, pp. 21-97.
Thorstensson A, L Larsson, P Tesch, and J Karlsson. Muscle strength and fiber composition in athletes andsedentary men. Med Sci Sports. 9:26-30, 1977.
Viitasalo JT, S Saukkonen, and PV Komi. Reproducibility of measurements of selected neuromuscular performancevariables in man. Electromyogr Clin Neurophysiol. 20:487-501, 1980.
4.6 Blood Lactate Measurement
by Phillip Bishop
Blood for lactate analysis can be handled in a number of ways, including treatment with various anti-clotting and
anti-glycolytic agents, treatment with stabilizing elements for long-term storage, dilution with lysing agents, and
separation of plasma by centrifugation. Although these procedures are frequently employed in different
combinations, consideration should be given to their impact upon the resulting lactate values. Erythrocyte lysing
agents such as Triton X-100 (TX) are frequently used in blood handling in field situations and do influence measured
lactate even in plasma (Bishop, et al. 1992b).
Both manual and automated enzymatic techniques for lactate measurement are popular. Tests of the Yellow Springs
Instruments (YSI) 23L lactate analyzer indicate extremely good stability and accuracy in comparison to a manual
biochemical technique, Boehringer Mannheim single vial lactate kit 149943 (BMM). The correlation between BMM
lactate concentrations and YSI lactate values was .99+ (Bishop, et al., 1992a). The newer YSI automated analyzers
utilize the same measurement methods and should yield similar accuracy.
The regression equations for lactate concentration measured by BMM technique predicted from lactate measured by
a YSI 23 L analyzer without (YSINON) and with Triton-X100 (YSITX) were:
BMM = 1.19 YSINON + 0.38; R2 = .990; Sxy = .46; C.V.=4.0
BMM = .95 YSITX + 0.31; R2 = .997; Sxy = .26; C.V.=3.4
(Bishop et al. 1992).
It can be seen in these equations that the slope for YSITX was very close to 1; however, the intercept was
significantly different from zero. The small coefficient of variation emphasizes the good agreement between the
methods. It appears that blood lactate levels obtained by BMM or YSI lysed methods are interchangeable with only
small adjustments except at very low levels. At low lactates the YSI may have some small advantages.
The Boehringer Mannheim method of lactate analysis utilizes LDH as a catalyst for the production of pyruvate and
NADH from lactate and NAD+. The NADH is measured photometrically at 340 nm. One-half mL of blood diluted
with an equal value of perchloric acid is utilized in the assay. Lactate concentration is calculated from the absorption
coefficient for NADH, the molecular weight of lactic acid, and the volumes and dilutions utilized in the analysis.
This method is reported to be linear up to blood lactate concentrations of 10 mmol/L. Boehringer Mannheim reports
a correlation of .999, beta weight of 0.92 and intercept of 2.048 for the regression of BMM lactate concentration on

26
concentrations obtained by the Gutmann and Wahlefield method. Kits for the Boehringer Mannheim method of
lactate analysis and the Sigma Method, which is similar, can be obtained from the addresses below:
Boehringer Mannheim
1-800-262-1640
PO Box 50414
Indianapolis, IN 46209-5044
Lactic acid kit #139084 (25 assays, $65. Includes 1 standard)
Sigma Scientific
1-800-336-9719
PO Box 14508
St Louis, MO 63178-9916
Lactate Reagent 735-10 (100 assays-$90) Standards set 735-11 $38, metabolite Control S 3005 440.
The YSI automated system uses a three-layer membrane, with the middle membrane containing a lactate oxidase
compound which catalyzes the production of hydrogen peroxide and pyruvate from lactate acid and oxygen. The
hydrogen peroxide produced diffuses through one side of the triple membrane and, on contact with a platinum
electrode, yields electron flow proportional to peroxide production. The YSI machine requires 25 µL of blood and is
reported to be linear up to 15 mmol/L (Yellow Springs, 1985).
It is important that YSI be used only for lactates below 15 mmol/L (Yellow Springs, 1985). If blood is diluted during
collection, final lactate concentrations must be in the 3-12 mmol/L range for the greatest accuracy.
Since blood is frequently handled in a variety of ways, regression equations have been developed for conversion
from blood to plasma or vice versa. Equations are shown below.
If no lysing agent is used, blood lactate can be predicted from plasma lactate concentration by
Blood lactate=0.67 × Plasma lactate +0.04
The R2 =.98 and Syx=0.14
If the plasma was treated with Triton X-100 (a lysing agent), the equation becomes
Blood lactate=0.77 × Plasma lactate -0.18
The R2 =.97 and Sys=0.15
Employing initial hematocrit was not useful in improving prediction. (Bishop et al., 1992b.)
Selected Bibliography
Bishop, P.A.; Smith, J.F.; Kime, C.J.; Mayo, J.; Tin, Y.T. Comparison of a manual and automated enzymatic
technique for determining blood lactic acid concentrations. Int. J. Sports. Med. 13(1):56-59; 1992a.

27
Bishop, P.A.; May, M.; Smith, J.F.; Kime, J.C.; Mayo, J.; and Murphy, M. Influence of blood handling techniques on
lactic acid concentrations. Int. J. Sports Med. 13(1):56-59; 1992b.
Boehringer Mannheim Diagnostics: Single vial lactate UV method 149993. Indianapolis: Boehringer Mannheim
Diagnostics Division; 1985.
Buono, M.; Roby, F. Acid-base, metabolic, and ventilatory responses to repeated bouts of exercise. J. Appl. Physiol.
53:436-439; 1982.
Buono, M.J.; Yeager, J.E. Intraerythrocyte and plasma lactate concentrations during exercise in humans. Eur. J.
Appl. Physiol. 55:326-329; 1986.
Daniel, S.S.; Morishima, H.O.; James, L. S.; and Adamsons, K., Jr. Lactate and pyruvate gradient between red blood
cells and plasma during acute asphyxia. J. Appl. Physiol. 19:1100-1104; 1963.Decker, D.; Rosenbaum, J. The distribution of lactic acid in human blood. Am. J. Appl. Physiol. 138:7-11; 1942.
Deuticke, B. Monocarboxylate transport in erythrocytes. J. Membr. Biol. 70:89-103; 1982.
Deuticke, B., Beyer, E., and Forst, B. Discrimination of three parallel pathways of lactate transport in the humanerythrocyte membrane by inhibitors and kinetic properties. Biochem. et Biophys. Acta. 684: 96-110, 1982.
Devadatta, S. Distribution of lactate between the corpuscles and the plasma in the blood. Quart. J. Exp. Physiol. 24:
295-303, 1934.
Dubinsky, W.; E. Racker. The mechanism of lactate transport in human erythrocytes. J. Membr. Biol. 44: 25-36,
1978.
Gesell, R.; Krueger, H.; Nicholson, H.; Brassfield, C.; and Pelecovich, M. A comparison of the response of the
anesthetized dog to lowered alveolar oxygen during normally controlled ventilation. Am. J. Physiol. 100(1): 202-
226, 1932a.
Gesell R.; Krueger, H.; Nicholson, H.; Brassfield, C.; and Pelecovich, M. A comparison of the response of the
anesthetized dog to intravenous administration of sodium cyanide during uniform artificial ventilation and during
normally controlled ventilation with the additional observations of the effect of methlene blue. Am. J. Physiol.
100(1): 227-240, 1932b.
Gutmann, I.; Wahlefield, A. Methods of enzymatic analysis. 2nd English ed. Beringer, H.V., editor. New York:
Academic Press; 1974: p.1464.
Halestrap, A. Transport of pyruvate and lactate into human erythrocytes. Biochem.J. 156:193-207; 1976.
Harris, R.; Dudley, G. Exercise alters the distribution of ammonia and lactate in blood. J. Appl. Physiol. 66:31-37;
1989.
Huckabee, W. Control of concentration gradients of pyruvate and lactate across membranes in blood. J. Appl.
Physiol. 9(2):163-170; 1956.

28
Ohira, Y.; Ito, A.; and Ikawa, S. Concentration of water content and solute concentration in blood during
hemoconcentration. J. Appl. Physiol. 42:739-742; 1977.
Sigma Diagnostics. Pyruvate/lactate quantitative, enzymatic determination in whole blood at 340 nm. No. 726-
uv/826-uv. St. Louis Sigma Diagnostics; 1988.
Weil, M.H.; Leavy, J. A.; Rackow, E.C.; Halfman, C. J.; and Bruno, S. J. Validation of semi-automated technique
for measuring lactate in whole blood. Clin. Chem. 32(12):2175-2177; 1986.
Yellow Springs Instruments: YSI model 23L lactate analyzers instruction manual. Yellow Springs, OH: Scientific
Division; 1985.
4.7 Measurement of Body Composition
by Steven F. Siconolfi and Alan D. Moore, Jr.
The following hydrostatic weighing procedure is specific to the equipment in the Exercise Physiology Laboratory at
the Johnson Space Center but may be adapted for the equipment found in most laboratories that use hydrostatic
weighing. The general discussion is applicable to any laboratory. Other techniques of estimating body composition,
such as skin fold measurements, impedance, isotope dilution, potassium-40, radiography, ultrasound, or nuclear
magnetic resonance imaging, are beyond the scope of this section.
Body composition is often measured to determine subject characteristics for studies performed in the Exercise
Physiology Laboratory at the Johnson Space Center. The technique that is currently used in the laboratory is
hydrostatic weighing (commonly referred to as the underwater weighing method). A complete discussion of body
composition may be found the paper of Wilmore (1983). The hydrostatic weighing technique is also discussed inseveral reference sources, including the American College of Sports Medicine’s Guidelines for Exercise Testing and
Prescription.
The hydrostatic weighing technique is based upon Archimedes’ principle: an object’s loss of weight in water equals
the weight of the volume of water it displaces. In hydrostatic weighing, body density is calculated from the
relationship between body weight (mass) and body volume (D=m/v). Body volume is equal to the loss of weight in
water with the appropriate temperature correction for the density of water.
Residual volume (RV) of the lungs has to be measured or estimated to correct for the gas in the subject’s lungs and
airways after full expiration when hydrostatic weighing is conducted. One technique has been described by Wilmore
(1969). Error induced by RV measurements performed before or after (as contrasted to during) hydrostatic weighinghas been quantified as negligible (Hsieh, et. al. 1985; Robertson, 1978.) However, simultaneous measurement of RV
is faster and in some individual cases more accurate.

29
Equipment
Equipment for Hydrostatic Weighing
a. Hydrostatic weighing tank
b. Chatillion autopsy scale with 358° potentiometer mounted to the indicator needle; or load cell.
c. Weighing harness and chain
d. Strip chart recorder
e. Thermometer
f. Tare weight and belt
g. Medical scale (to obtain dry weight)
h. Calibrated snorkel (a 2.5 cm respiratory hose marked in 1 cm increments)
Equipment for Residual Volume Estimation
a. Mass spectrometer, or oxygen and carbon dioxide analyzers
b. Rebreathing bag (6L)
c. Mouthpiece with end tidal sample port
d. 100% oxygen source
e. Three-L calibration syringe
Hydrostatic Weighing Procedures
a. Connect potentiometer to strip chart recorder.
b. Turn on power to strip chart recorder and potentiometer.
c. Calibrate potentiometer signal to strip chart recorder.
1. Electrical zeroing of strip chart recorder;
• Put Zero/Measure button in zero position.
• Check sensitivity to 50 mV units.
• Set paper speed 20 cm/min with min/hr button to min.
• Start paper recorder and adjust pen to zero line.
• Stop paper recorder.
2. Calibration of signal:
• Put Zero/Measure button in measure position.
• Adjust scale indicator to zero grams and start recorder.
• Repeat above step for 1000, 2000, 3000, 4000, 4500, 4700, 4800, 4900, 4950, and 5500 grams.
d. Hang scale above tank.
e. Compare dry weight scale to autopsy scale.
1. Hang tare weight on autopsy scale (above the water) and record the weight.
2. Place tare weight on a calibrated dry weight scale and record the weight.
3. If weights are the same, make no change in computations; if they are different, adjust autopsy scale weights

30
f. Prepare the subject.
1. Encourage subject to urinate prior to testing.
2. Weigh subject in dry swim suit (have subject face away from scale with head up, both feet fully on the
scale). Record in kg.
3. Measure the subject’s height. Record in cm.
4. Outfit subject with harness (fig. 3).
5. Have subject enter the tank and instruct subject to remove all air bubbles from skin, hair, suit, and harness
by rubbing these areas vigorously until no air bubbles are released.
6. Hand subject the tare weight belt and have subject remove any air bubbles from belt (rub and/or squeeze
belt).
7. Have subject place tare weight belt around waist and dangle the weight between legs in front of body.
8. Feed lightweight chain (used to connect subject to the scale) through top ring (chest/back ring) of the
harness and hold both ends.
9. Have subject stand on tiptoe underneath the scale.
10. Attach both ends of the chain to S-hook on the scale.
11. Place mouthpiece on calibrated snorkel.
12. Hand mouthpiece end to subject and hang other end off of the chain (after the subject submerges).
13. Turn off the tank’s filter/heater system.
g. Instruct the subject:
1. “Place mouthpiece in your mouth. Hold snorkel tube with one hand and squeeze your nose with the other.
2. Breathe in a slow rhythmic manner when submerged.
3. When asked, please SLOWLY inhale maximally and SLOWLY exhale maximally and hold
that position for a count of 5 (5 seconds) or until I indicate it is okay to breathe. Remember,
the more air you expel the leaner you will appear. You will repeat this procedure at least 10
times.
4. Breathe normally between these measurements. If you need to surface please do so, but remember that this
will add to your time in the water.
5. Any questions?
6. When submerged keep your eyes closed; the water is heavily chlorinated.
7. Tuck chin into chest, bring legs to chest (i.e., in a ball).
8. Submerge slowly, breathe and relax.”
h. Attach other end of snorkel to the chain.
i. Measure hydrostatic weights.
1. Allow subject to stabilize breathing and position in the water. If the subject is swinging in the water, try to
steady him or her at the base of the scale before measurements are made. If the subject is only turning in
the water, no adjustment is necessary. No portion of the body may be out of the water or touching a surface
of the tank.
2. Instruct subject to inhale slowly. Watch scale for a reduction of weight.
3. At or near maximum inhalation instruct subject to slowly exhale. Watch scale for oscillations. When
oscillations die down and become small and consistent, subject is near maximum exhalation.

31
Figure 3. Hydrostatic weighing harness.
4. Record weight by starting the paper on the strip chart recorder. When a straight line is achieved, have
subject breathe. While recording the weight, note the number on the calibrated hose at the surface of the
water. Record this number on the strip chart recorder paper.
5. Repeat steps 1 through 4 at least 10 times.
6. Have the subject surface and place snorkel in the water.
7. Check water temperature (°C) and record on strip chart recorder paper.
8. If subject’s underwater weight is between 4500 and 5500 g (point where strip chart pen wraps to bottom of
paper), add additional tare weight.
j. Obtain a tare weight.
1. Have subject undo harness (Velcro straps) first.
2. Have subject remove weight belt and attach to lower ring on harness.
3. Have subject move to the side of the tank to a position in which the water covers at least the shoulders.
4. Pull the chain to move the scale gently up and down once .
5. Record the tare weight both visually and on the strip chart recorder.
k. Instruct subject to hand you the chain, harness, tare weight, and snorkel. Subject may exit the tank.

32
l. Do a post-test calibration check.
1. Identify the range of recorded hydrostatic weights.
2. Position the indicator needle on autopsy scale approximately 100 g below the range and record.
3. Move the autopsy scale indicator needle at 100 g increments until you have recorded steps to 100 g above
the range.
4. If post-test calibration indicates that recording paper has slipped, this calibration is used in the computation.
If no slippage is indicated, pretest calibration is used.
m. Body volume, body density, and two compartment model estimates of fat percent are computed with an Excel
spreadsheet programmed with the formulas of Siri (1956) or Brozek and Keys (1951).
1. Hydrostatic weights are computed from the strip chart recorder and entered into the spread sheet with the
corresponding hose length number recorded from the snorkel during the weighing (see step i.4). This
reading is necessary to correct for water displaced by the hose due to change in the amount of hose
submerged during subject weighings.
2. Enter appropriate parameters for the computation of residual volume.
3. The spreadsheet can be setup to use the average of the two smallest measured residual volumes that were
within 50 ml of each other.
4. The spreadsheet can be setup to use the average of the two heaviest hydrostatic weights that were within 50
g of each other.
Residual Volume Procedures
Residual volume is most efficiently measured simultaneously with underwater weight. Regardless of the time it is
measured, the principles are the same (Wilmore, 1969, 1980).
a. Set up a gas transfer system from the 100% oxygen source to a calibrated syringe (fig. 4). This system must
incorporate a valve assembly to allow the user to select either delivery to the calibrated syringe or sampling from
the rebreathing bag with NO BAG GAS CONTAMINATION during the rebreathing or sampling period.
Transferring the gas directly to a wet spirometer obviates the need to use a syringe and speeds the procedure.
The spirometer and tubing dead space must be included in the calculations, however.
b. Empty rebreathing bag (or spirometer) of all gas.
c. Fill rebreathing bag (or spirometer) with oxygen.
1. Turn on oxygen tank and add approximately 1 L of gas to the calibration syringe.
2. Flush this gas through the system by turning the rebreathing valve clockwise and depressing the plunger
on the calibration syringe. IMMEDIATELY close valve (turn counterclockwise).
3. Add 3 L of oxygen to the calibration syringe.
4. Transfer this volume of gas to the rebreathing bag by turning both valves clockwise and inserting the
plunger into the calibration syringe.
5. Close both valves (turn counterclockwise).
6. Add 2 L of oxygen to the calibration syringe.
7. Transfer this volume of gas to the rebreathing bag by turning both valves clockwise and inserting the
plunger into the calibration syringe.

33
8. Close both valves (turn counterclockwise).9. Measure the concentration of oxygen or nitrogen (N2) in the rebreathing bag with the mass spectrometer
and record as bag O2 or N2. The mass spectrometer (or other rapid analyzer) can be output to a chart
recorder, producing a graph similar to figure 5.
10. Switch mass spectrometer channel to nitrogen.
11. Place mouthpiece and end-tidal sample adapter on rebreathing bag (fig. 4).
d. Provide the subject with these pretest instructions:
1. When instructed to start, take a deep breath in and then exhale all the air out of your lungs and hold that
position.
2. I will tell you when to inhale. When you inhale breathe FAST and DEEP until I ask you to exhale all the air
out of your lungs for a second time.
3. Try breathing fast and deep now. (Correct subject’s respiratory pattern at this time.)
4. We will do at least two of these measures.
e. Measure the residual volume.
1. Put nose clip on the subject.
2. Have subject place mouthpiece of rebreathing bag into his or her mouth.
3. Have subject maximally inhale and then maximally exhale. Record the concentration of nitrogen at the endof the exhalation. This is N2% Initial.
4. Turn rebreathing valve and have the subject breathe FAST and DEEP until the nitrogen readings on the
mass spectrometer appear to level off.
5. Have the subject maximally inhale and then maximally exhale. Record the concentration of nitrogen at theend of the exhalation. This is N2% Final.
6. Compute the residual volume (formula of Wilmore, 1980).
f. Repeat steps c and d.
g. If the two residual volume measurements are not within 50 mL of each other, repeat step e until any two
measurements meet this criteria.

34
CalibrationSyringe
W.E. CollinsY-Valves
6 Liter Rebreathing Bag
Sampling Valve
Mouthpiece
End-TidalSamplingPort
SamplingValve
6 Liter Rebreathing O2 Supply
Figure 4. Residual volume measurement equipment.

35
StartRecording
StopRecording
Baseline
a. Subject is exhaling.b. Subject is at RV and holding.c. Subject is inhaling.
a
b
c
11.0
cm
Figure 5. Sample tracing for residual volume measurement.
Sources of Error
Potential sources of error common to the hydrostatic weighing technique are listed below:
a. Failure to obtain an accurate pretest body weight
b. Failure to remove all trapped air from the subject’s bathing suit and hair
c. Failure to subtract the weight of the chair, harness, weight belt, or volume of the submerged breathing tube from
results
d. Failure to use the water temperature correction factor

36
e. Failure to measure or properly measure residual volume
f. Failure to obtain an adequate number of trials
g. Measurement error produced by subject anxiety
h. Failure of subject to follow pretest instructions
Selected Bibliography
American College of Sports Medicine. Guidelines for exercise testing and prescription. 4th ed. Philadelphia.: Lea
& Febiger, 1991; p. 44-48.
Brozek, J.; Grande, J.; Anderson, J.; Keyes, A. Desiometric analysis of body composition: Revision of some
quantitative assumptions. Ann N.Y. Acad. Sci. 110:113-140; 1963.
Hsieh, S; Kline, G.; Porcari, J.; Katch, F.: Measurement of residual volume sitting and lying in air and water (and
during underwater weighting) and its effects on computed body density. Med. Sci. Sports Exerc. 17:204; 1985.
Robertson, C.H. Lung volumes in men immersed to the neck: dilution and plethysmographic techniques. J. Appl.
Physiol. 44:679; 1978.
Siri, W.E. Body composition from fluid spaces and density. In: Brozek, J; Henschel, A, eds. Techniques for
measuring body composition. Washington, D.C.: National Academy of Science; 1961; p. 223-244.
Wilmore, J. The use of actual, predicted, and constant residual volumes in the assessment of body composition by
underwater weighing. Med. Sci. Sports Exerc. 1:87; 1969.
Wilmore, J. Body composition in sports and exercise: directions for future research. Med. Sci. Sports Exerc. 15:21-
31; 1983.
4.8 Criterion Measurement of O2 and CO2 with the Micro-Scholander
by Phillip Bishop
In most laboratories, metabolic gas measurement is performed with electronic analyzers. As discussed in the general
calibration section of this manual, there is a need to ensure the validity of these gas composition measurements. This
section will discuss briefly the chemistry and mechanics of a simple volumetric technique for physiologic gas
measurement. This technique is considered by many to be a criterion method for measuring the gas composition of
calibration gases used to rapidly reset the analyzers used in metabolic measurement. In the hands of a skilledoperator, this technique, the Micro-Scholander method, provides very accurate and reliable measures of CO2 and O2
concentrations.
The Micro-Scholander technique has many uses because it is fairly rapid (about 3-5 min per sample), it requires no
power (it can be agitated by hand), it is relatively inexpensive ($592.50 in 1992), and it is very accurate. It has been
used in laboratories as well as in remote field sites. Once you’ve invested the time to become proficient, you’ll have
a useful skill that can be summoned when needed. Patience, persistence, and thinking are the main requirements for
successful operation.
A schematic of the Micro-Scholander is given in figure 6. The operation uses mercury (Hg) to move gases andliquid O2 and CO2 absorbers in order to volumetrically measure the O2 and CO2 contents of an unknown gas. In
brief, about 0.5 mL of unknown gas is introduced into a reaction chamber. The initial unknown gas volume (at

37
I
A
B
C
D
E
F
G
H
J K
L
M
AGITATORMOTOR
KEY
a. Reaction chamber. Just above the point of the “A” is where the Permount is applied.
b. Gas introduction site. Top of capillary is the hollowed area just under the “B”. The void is half filled with acidrinse as a seal when a gas sample is introduced.
c. CO2 absorber sidearm. It is topped with a small syringe stopper. This sidearm should be kept free ofcompressible gas bubbles.
d. O2 absorber sidearm. Keep free of bubbles.
e. Hg reservoir. Hg level should be about 3/4 to 1 inch, with the reservoir open to the Scholander and the sidearmsfilled with absorber.
f. The three-way valve. A blue-tipped mark on the handle indicates alignment of bores with the handle wherepositions are selected. Position I connects the micrometer with the reaction chamber; position II connects themicrometer and the reservoir, etc.
g. Micrometer with plastic handle which insulates the micrometer from the heat of the hand. If the Micrometer isnot mounted, use gasket material from an auto-parts store rather than a paper washer to seal the micrometer tothe glass.
h. Glass acid rinse pipet. Can be replaced with plastic disposable transfer pipets.
i. Thermobarometer stopcock. Can be used to seal off system during analysis. Not absolutely necessary.
j. Index mark on capillary.
k. Gas transfer pipet showing blister at “K”.
l. Eccentric wheel and agitator motor which will be mounted on the chemical ring stand below the Scholander.
m. Storage for acid rinse and pipet.
Figure 6. Micro-Scholander gas analyzer.

38
atmospheric pressure) is carefully measured and recorded. A small amount of a CO2 absorbent liquid is introduced
into the reaction chamber without otherwise changing the overall system volume (combination of all liquid and theunknown gas volumes). The change in system volume due to CO2 absorption is recorded and the percentage
decrease in volume represents the percentage by volume of CO2 present in the unknown. This step is repeated with
an O2 absorbent and again the change in volume represents the proportion of O2 initially present in the unknown gas
sample. CAUTION: Since the Hg is very toxic, care should be taken. An Hg clean up kit is advisable, as is a
vacuum source and an Hg absorber. It is necessary that Hg be used under a fume hood.
Equipment
a. A vacuum with a trap (a bottle with an inlet and suction tubes separated by dead space) is necessary for
removing acid rinse and cleaning up accidental Hg droplets.
b. A complete Scholander with gas transfer pipets or carefully matched glass syringes and plungers. If the agitator
motor-to-Scholander belt is broken, it can cheaply be replaced with a large rubber O-ring (4-5 inches long).
c. Mortar and pestle.
d. Half a dozen 250-mL flasks with stoppers.
e. Scales with a resolution of 1 mg (must be available with small and large weighing boats).
f. Syringes (10- and 5-mL) with short 24- to 26-gauge needles. Also, a 20-gauge needle will facilitate Hg transfer.
g. Inert stopcock grease.
h. Disposable plastic transfer pipets, a cheaper and unbreakable substitute for the acid rinse pipet and bulb that is
usually supplied with the Scholander.
i. Volumetric pipets (1-mL and 10-mL are best) and pipette pump.
j. Pasteur pipets.
k. A matched plunger and barrel glass syringe fitted with a three-way valve makes a good substitute for the gas
transfer pipets usually supplied with the Scholander. This is especially helpful to beginners, but not a necessity.
A Yale 10-cc matched glass syringes (BD# 2312, Fisher # 14-826-45; $40.20 as of 1991) is recommended.
l. Magnetic stirrer (helpful but not required).
m. An aquarium bubbler to stir the water bath to maintain a uniform temperature. Attach the bubbler to a piece of
glass or dense plastic tubing with the free end plugged and small holes punched in the farthest end to provide a
stirring bubble stream.

39
Chemicals
a. Permount (Fisher Sci SP15-100) or any similar resin-in-solvent such as Preservaslideb. Potassium Dichromate (K2Cr2O7)
c. Sodium Hydrosulfite (Na2S2O4)
d. Sulfuric Acid (H2SO4)
e. Potassium Hydroxide (KOH)f. Sodium Sulfate (Na2SO4)
g. Sodium anthraquinone-beta-sulfonate (Anthraquinone-2 sulfonic acid, sodium salt monohydrate) (Aldrich 12-
324-2 100g-$10.60)
h. Toluenei. Copper Sulfate (CuSO4) (a blue-colored water bath)—optional
j. Distilled water
Supply Sources
Curtin Matheson Scientific (equipment)
713-878-3500
9999 Veterans Mem. Dr.
Houston, TX 77038-2499
800-392-3353
Sigma Scientific (chemicals)
PO Box 14508
St. Louis, MO 63178-9916
800-325-3010
Aldrich Chemical
PO Box 2060
Milwaukee, WI 53201
800-558-9160
Rudolf Holker (makes glassware, sells Scholanders)
1139 Villanova Ave
Swarthmore, PA 19081
215-543-7021
Fisher Scientific (equipment)
1-800-241-8192

40
Formula Preparation
a. Acid Rinse—Used to clean the reaction chamber between samples and to remove traces of CO2 and O2
absorber which would affect composition of the subsequent unknown sample. It is an acid solution that
neutralizes the absorbents, which are bases. Acid rinse also serves as a liquid seal when unknown samples are
introduced and as the indicator drop which acts as a stopper for sealing in the unknown gas sample. The rinse
should be mixed carefully to ensure that vapor pressures are correct; otherwise, the vaporization of the various
liquid components will cause a consistent error in the readings.
1. To a large beaker containing 400 mL of distilled water (measured with a graduated cylinder), add 1 mL ofconcentrated sulfuric acid (H2SO4) measured with a 1- or 5-mL volumetric pipet. Never add water to acid.
2. With the beaker on a magnetic stirrer with a stirring bar, slowly add 72 g of dry sodium sulfate (Na2SO4).
Because Na2SO4 is very hard to dissolve, using a magnetic stirrer is faster than hand mixing.
3. Add 50.4 g (or 21 mL) of glycerol to the solution. The glycerol is very viscous, so measure it out with a
disposable syringe, or weigh a 100-mL beaker and add glycerol until the weight increases by 50.4 g, then
rinse out with some of the acid solution. The glycerol controls the vapor tension of the acid rinse, so it is
important to be accurate.
4. Store this solution in a stoppered container.
5. Measure out 50 mL and combine with 40 mg potassium dichromate (K2Cr2O7) immediately before
Scholander use. You may eventually double to 100 mL and 80 mg if you are going to process a lot of
samples, but that’s enough for now. It will probably be most convenient to preweigh several vessels with40 (or 80) mg of K2Cr2O7.
b. CO2 Absorber—In an Erlenmeyer flask with a stopper, combine 100 mL distilled water, 11 gm KOH, and 40
mg potassium dichromate (K2Cr2O7). If it is exposed to enough CO2, this absorber will become saturated and
be useless. It should be stored in a dated, stoppered container. Fortunately, room air contains very little CO2, so
as long as it is properly stored, the shelf life should be 3 to 6 months.
c. O2 Absorber—Mixed in two parts to avoid saturation with the oxygen in room air. To mix the liquid part of
O2 absorber (solution A), combine 100 mL distilled water with 6 g of KOH and store in a stoppered container.
To prepare powder A, use a mortar and pestle, thoroughly combining 20 g of sodium hydrosulfite (Na2S2O4)
with 100 mg (0.1 gm) sodium anthraquinone-beta-sulfonate (Anthraquinone-2-sulfonic acid, sodium salt
monohydrate). Store powder A in very carefully labeled and tightly sealed containers in a refrigerator to
maximize shelf life. Minimize oxygen and moisture exposure and increase convenience by preweighing several
small sealable vials of 0.6 g powder A.
For use in the Scholander, combine 0.6 g of powder A with 5 mL of solution A, minimizing air exposure. This
can be easily done by filling a small syringe with 5 mL of the solution, emptying a preweighed vial of the
powder into the syringe, then quickly inserting the syringe plunger, holding needle end upward and expelling the
air. After the powder has dissolved (some directions say this needs to be done under hot water, but if the water
is too hot the solution is ruined) admit about 0.5 mL of air to allow the nitrogen in the air to equilibrate with thesolution. If O2 absorber goes bad, its color will change from a rich dark red (magenta) to a rusty brown.

41
Reaction Chamber Preparation
The reaction chamber apparatus is the largest removable piece of the Scholander (see part A of figure 6. The
reaction chamber itself is the small empty bulge at the bottom of the long capillary, right above the junction of the
chamber apparatus with the glass stem.
Preparation of the reaction chamber is the most difficult part of the procedure. The very top of the reaction chamber
has been ground to roughness so the Permount will adhere. If the Scholander has been previously used and stored
away for a few years, the old reaction chamber may still be usable and it’s probably worth a try. To find out, first tipthe Scholander from side to side to admit a little bit of CO2 and O2 absorbent (2 to 4 mL total) and use the Hg
reservoir to raise the absorbers to submerge the lower end of the capillary. This alkaline treatment may make the
reaction chamber usable. After letting it sit 5 to 10 minutes, try an analysis. If the indicator drop does not respond
immediately and crisply to the micrometer, the reaction chamber needs retreatment.
First, use toluene to clean out the old preparation. The treated area is at the bottom of the long capillary and the top
of the reaction chamber. After it is clean, rinse it with distilled water and blow air through it with a hair dryer or lab
air source until it is dry.
Dip just the tip of the clean Pasteur pipet about 3 to 4 mm into the Permount. Wipe any Permount off the outside of
the pipet. Attach a small eye-dropper type rubber bulb to the pipet. Now, while holding the reaction chamber flat,
insert the Pasteur tip from the bottom into the top of the reaction chamber. Use the rubber bulb to expel a small
amount of the Permount onto the ground glass part of the reaction chamber end of the capillary. Quickly attach the
air source to the opposite end of the capillary and blow air from top to bottom to ensure the Permount does not fill up
and subsequently seal off the capillary. It’s better to start with too little Permount because excess must be removed,
a difficult procedure. The objective is to get a good coating of Permount on the ground area where the capillary andthe reaction chamber meet. The function of the Permount is to disrupt the surface tension of the O2 and CO2
absorbers which will be swirled around in the reaction chamber and would otherwise form a bubble that would
disrupt the procedure. The surface film may also form a bridge between the indicator and the absorbent. Such a
bridge would interfere with proper analysis. Eventually, after hundreds of analyses, recoating may be needed.
Absorbent or acid rinse left on the Permount coating for several hours will ruin the coating. Always leave the system
with distilled water over this area (see shutdown procedures near the end of Scholander Operation section).
Pre-Operational Procedures
With the Permount-treated reaction chamber mounted in the Scholander bath and the micrometer attached to the
bottom of the system, turn the valve at the bottom to connect the Hg reservoir that hangs on the outside of the bath.
Carefully add Hg to the system until the level rises to the bottom of the reaction chamber. The bottom valve has a T-
shaped opening. Each arm is a hole and there is a hole where the blue tip is. A little logic and practice will showyou how to turn the valve to move Hg around as needed. ALWAYS USE CAUTION WITH Hg BECAUSE IT ISVERY TOXIC. CONTACT WITH THE SKIN OR INHALATION OF VAPORS IS VERY DANGEROUS.
Several hours prior to operation, fill the water bath with clean water and allow it to come to room temperature. Asmall amount of CuSO4 added to the bath will give the water a light blue tinge, improving visual contrast and
retarding algae growth.

42
Mix up 50 to 100 mL of acid rinse plus K2Cr2O7 and place it in a tube submerged partially in the bath. The acid
rinse should be held at the same temperature as the reaction chamber and bath.
With a syringe and fine needle (24 to 26 gauge), remove the air from the small long vertical chamber on the left side(viewed from the front) of the reaction chamber. Fill the syringe with 4 to 5 mL of CO2 absorber and insert CO2absorber into the left chamber, being careful not to add air. As you add CO2 absorber, the Hg will be displaced.
Create more room for it by moving the valve at the bottom of the Scholander to connect the Hg reservoir with the
reaction chamber. If you didn’t add too much absorber initially, there should be no problem, but be careful not tocause Hg spills by overfilling. The CO2 absorber should be pale yellow and fill the top two thirds of the left side
arm.
Repeat the same procedure on the right side, using the dark red O2 absorber. With both absorbents added, there
should be enough Hg to allow you to raise and lower the Hg level to the top of the capillary with the micrometer set
at zero, but not so much that the reaction chamber has more than half an inch in the bottom. (The micrometer is used
to control the Hg level as unknown sample gas is absorbed. It also serves as the volume measuring device.)
Now you are ready to start running a sample. First half-fill the top of the capillary area with acid rinse from the
container in the water bath, then prepare a gas transfer pipet as follows.
a. Place a large-bore (20-g) needle on a syringe and draw a small amount of clean Hg into the syringe. Handle the
syringe carefully, being careful not to spill Hg.
b. With a clean dry gas transfer pipet held at about 45 degrees from horizontal, place a drop of Hg (about 1/8 inch
long) in the bubble end of the pipet.
c. Place a clean dry rubber tip on the small end of the pipet. The rubber tip may have to be rotated to align the
hole of the rubber tip with the pipet bore. If the rubber tip hole is too small, it can be enlarged with a 20-g
needle.
d. When the pipet is upright, the Hg drop should fall slowly but steadily, pushing out the gas held in the bore of the
pipet.
Practice, using room air, aligning the pipet tip with the top of the reaction apparatus capillary while the pipet tip is
submerged under acid rinse. It will help if you hold the pipet in your left hand and rest your left hand on the edge of
the water bath. After allowing a bubble of air to escape the pipet tip, you should be able to pull a gas sample into the
capillary by using the micrometer handle to lower the system Hg level. As the sample is pulled in, you should be able
to watch the Hg drop in the transfer pipet. Always draw down on the pipet; never reverse the micrometer because
this inevitably pushes acid rinse into the transfer pipet and ruins it. The objective is to transfer the sample at neither
positive nor negative pressure; it should freely transfer as the Hg in the Scholander is drawn off by the micrometer.
After the sample is drawn, remove the pipet. Immediately pull off the rubber tip with a lab tissue and dry the pipet
tip thoroughly, keeping the pipet upright. Avoid letting acid rinse (or anything else) get sucked into the bore or
letting the Hg get stuck down in the fine part of the pipet bore. Either of these will render the transfer pipet
inoperable by stopping up the bore. After a little practice, you should be able to pull a sample into the capillary
easily. The values you get with room air reflect water vapor pressure, so don’t expect dry gas percentages.
Although it is best to learn Scholander technique with room air, eventually you will want to load a sample gas into
the pipet. This is done by attaching a small length (6 inches or so) of very flexible tubing to the gas pressure
43
regulator on the tank or to the outlet of some other unknown gas source. The bore of the tubing needs to be such that
the rubber pipet tip will seal against the inside of the tubing bore. Adjust the regulator or gas source pressure to just
a trickle of escaping gas. (Remember you need only 0.5 mL of sample.) Use the flexible tubing and your fingers to
either clamp off the gas flow or allow some to escape. With the tubing crimped off with your hand, mate the tip of
the transfer pipet to the end of the tubing and tilt the pipet to 45 degrees. Allow a little gas to escape from the tubing
to push the Hg drop up to the blister in the pipet. If the pipet is tilted correctly, and the drop of Hg isn’t too big, the
gas should push the Hg drop to the side of the blister and then “burble” on by. After the gas has flushed the pipet,
slowly raise the angle of the pipet slightly to seal off the top with the Hg and remove the transfer pipet. Cap the
rubber tip of the pipet with a finger and you should have an almost full transfer pipet of unknown gas ready to load
into the Scholander. Be careful in loading the transfer pipet because too much pressure will blow the Hg drop across
the fume hood, ruining the transfer and creating a substantial Hg hazard. REMEMBER, Hg IS TOXIC.
To make the transfer easier and more efficient, use a piece of rigid tubing and a three-way stopcock to extend the tip
of a 10 to 25 mL glass syringe so that a rubber transfer pipet tip can be placed on it. If the plunger and the barrel are
well matched, the stopcock can be used to flush the syringe with the unknown gas, and the syringe can be used to
provide many samples of unknown gas to the Scholander without gas resupply and without the risk of splattering Hg
everywhere. Matched glass syringes are relatively expensive, so be careful. The syringe plunger should fall by
gravity with the stopcock open, yet be tight enough to seal in the unknown gas when the stopcock is closed.
Scholander Operation
The initial starting point for the Scholander assumes that both sidearms are full of CO2 and O2 absorbers and that
there is sufficient Hg in the system to allow you to raise the Hg reservoir and fill the reaction chamber to the top of
the capillary with Hg. There also should be some acid rinse left in the top of the chamber above the capillary.
Proceed with the following steps.
a. Use the Hg reservoir and the Hg leveling bulb together to raise the Hg level in the reaction chamber to near the
capillary index mark.
b. Use the micrometer to set the top of the Hg in the capillary exactly to the very top of the capillary.
c. Connect the micrometer to the reservoir using the stopcock at the bottom of the Scholander (blue spot pointing
down) and set the micrometer to exactly zero.
d. Position the tip of a fully loaded transfer pipet (or transfer syringe) under the acid rinse, allow a bubble of gas to
escape, then place the bore of the rubber tip exactly on the top of the Hg column.
e. Using the micrometer, pull a sample of gas into the reaction chamber. If a very small sample is used, even small
errors will have a large affect on results, so try to pull in about 1500-1700 micrometer units of sample.
f. Remove the pipet, remove the rubber tip, and dry the pipet and rubber tips as described earlier.
g. Use the micrometer to draw down a small (about 2 mm long) indicator drop of acid rinse into the capillary. This
indicator drop will serve as the top seal of the gas sample.

44
h. Very CAREFULLY vacuum off all the acid rinse except the indicator drop. If you are practicing with room air,
and you accidentally vacuum away the indicator drop, you don’t have to start over, but you need to learn to do it
correctly so you won’t lose real samples.
i. Now move the indicator drop almost to the bottom of the capillary with the micrometer to clean the capillary
walls, then move it up so that the bottom meniscus of the indicator drop is exactly in line with the index mark at
the middle of the capillary. This is your starting gas volume, M1. Do it again to make sure it’s correct.
Carefully read and record the M1 value.
j. Once M1 is established, tilt the whole bath to the left to admit a small amount of CO2 absorber. If you are using
room air, the indicator droplet should barely move. Since dry ambient air should be .03% (0.0003) CO2, the
indicator should only fall about 0.5 micrometer units if M1 was 1500. If it falls considerably more, there is
probably a vapor pressure problem in the acid rinse.
k. Turn on the agitator motor to provide very gentle agitation of the system. If the motion is too vigorous, dampenit with your hand and rearrange the spring tension for the eccentric wheel. After the CO2 is fully absorbed,
move the indicator drop back to the exact point on the index mark that you used for MI. Full CO2 absorption is
crucial to the accuracy of high-CO2-concentration gases because the O2 absorber will take up any remaining
CO2, causing an erroneously high O2 reading.
l. Carefully read and record the change in volume, which represents the CO2 volume.
m. Repeat the process with the O2 side. The O2 absorption with room air takes about 90 seconds and the indicator
drop falls about 313 micrometer units for dry ambient air. If you don’t watch carefully, the O2 absorber will
draw up so much O2 that the indicator drop will fall out the bottom of the capillary and ruin the O2 part of the
procedure.
n. After the O2 absorption is complete, move the indicator drop back to the index mark and read and record M3.
Some operators feel they get better results with air samples drawn from outside the building.
o. Use a vacuum to remove all of the indicator drop and carefully run the micrometer back to nearly zero. If thetotal volume stayed constant throughout the procedure, the micrometer should reach zero when the O2-CO2
absorber mix reaches the exact top of the capillary. Remember, that is where you started. Any difference from
zero represents a unit of error which should be added to or subtracted from all the M values. In practice, an
error isn’t serious unless it is greater than 10 units. A volume error of 10 units on a 1500 unit room air samplerepresents no change in room air CO2 and 0.0014 percentage points error in O2 percentage.
p. Use the three-way valve at the bottom of the Scholander and the Hg reservoir and a vacuum to remove all the
old absorbers, being careful not to vacuum up too much Hg.
q. Now place about 5 mL of acid rinse in the upper chamber and use the Hg reservoir and three-way valve to admit
clean acid rinse from the top chamber into the capillary and reaction chamber. This will clean the Hg and the
chamber and prepare for the next run. Do not allow acid rinse or absorbers to be drawn into the bottom stopcock
by lowering the reservoir too far because this will cause leaks at the lower stopcock.

45
r. Check the system. If the Hg level falls from the top of the capillary after about 5 minutes, the bottom stopcock
is leaking. In this case, the Hg will have to be removed and the bottom stopcock cleaned and lubed with
stopcock grease, and replaced. If air is present in the system, you will be able to turn the bottom stopcock to a
fully closed mark (none of the bores aligned) and still screw in the micrometer slightly, thereby compressing the
air. The more easily the micrometer screws in, the more trapped air, which must be removed to maintain the
volumetric integrity in the face of internal pressure changes. Except for this error check, don’t turn the
micrometer with the bores closed off because you will either suck in air or blow out Hg. The system needs to be
checked only at the start and end of each measurement session or if an error is suspected.
s. After cleaning, leave a little acid rinse in the top and then do another sample.
While the O2 absorber is working, you can do your calculation of volume changes to get percentage composition
from the last run. The CO2 is calculated by subtracting M2 (volume after CO2 absorption) from M1 and dividing by
M1. If you had a substantial volume error, the M values should be adjusted plus or minus the error. O2 percentage
is calculated from M2 minus M3 (M3 is volume after O2 absorption) divided by M1 (or corrected M1 if necessary).
Don’t forget that moisture will be present in many gas samples, particularly biological gases. Always either dry the
gas, or account for the water vapor pressure.
If you are consistent in the amount of gas samples used, you will quickly be able to tell when you make a mistake.
After you are proficient at measuring unknown samples, it’s probably better not to anticipate micrometer readings,
because you may be biased.
Record all work in a lab notebook along with comments and observations. This record will usually prove invaluable
in catching errors and will help avoid loss of hours of work. It will also indicate when the Permount may have
expired.
If you shut down the Scholander for periods of more than a few minutes, fill the top half of the reaction chamber
with distilled water below the Permount point. If you are shutting down for a while, withdraw the absorbers from the
sidearms and clean the syringes because the absorbers and acid rinse will clog up small bores. Leave a cover of
water over the Hg in the reservoir to minimize Hg vapor.
With a little practice you should be able to produce amazingly consistent results and should be able to run 3 to 4 gas
samples in 10 minutes.
Selected Bibliography
Scholander, P.F. Analyzer for accurate estimation of respiratory gases in one-half cubic centimeter samples. J. Biol.
Chem. 167(1):235-250; 1947.
Piller, L.W. A manual of cardiopulmonary technology. Springfield, Ill: Charles C. Thomas; and London: Baylis
and Son, London; 1964: pp. 163-171.
Gadebout, C; Blayo, M.C. Assessment of Scholander micromethod for gas concentrations versus weighing method.
J Appl. Physiol. 38(3):546-549; 1975.

46
4.9 Environmental Measurements
by Phillip Bishop
Environmental readings should be taken and recorded before each session of laboratory measurements. This is
especially important if laboratory conditions are variable.
Wet Bulb Globe Temperature (WBGT)
WBGT measurement is an attempt to incorporate the influence of evaporative, convective, and radiant cooling and
heating into a single measure. The formula is
WBGT = 0.1 dry bulb + 0.7 natural wet bulb + 0.2 globe temperatures (outside use).
WBGT = .3 dry bulb +0.7 natural wet bulb (use with no radiant load).
Wet bulb temperature may be obtained two ways: 1) psychrometric wet bulb — a measure of the maximal
evaporative cooling of moving air, and 2) natural wet bulb — a measure of the evaporative cooling with the natural
movement of air unaided. WBGT uses the natural wet bulb temperature. (NIOSH, 1986; Kamon, 1975)
Globe temperature is a measure of radiant load taken with a thermometer located in the center of a flat-black metal
sphere (e.g. copper toilet tank float) about 5 inches in diameter.
WBGT values above 80°F (26.5°C) usually require caution in physical activity.
Hg Barometer Operation
The Hg barometer, when carefully used, is the criterion standard for pressure and can be used to calibrate aneroid
devices.
To operate, adjust the Hg reservoir knob at the bottom until the white plastic cone tip just touches the Hg surface.
Use the sliding vernier scale to match the bottom edge of the slide with the top meniscus of the Hg column. The
bottom of the slide gives hundreds, tens, and units. The last digit that exactly lines up gives you tenths.
Read and record the pressure in mm of Hg. The standard barometric pressure is 760 mm Hg, which normally does
not vary more than 30 mm each way at sea level. The higher the altitude, the lower the average pressure under
otherwise normal conditions.
Also record temperature, which will be needed if questions of gas volume arise or must be calculated. Additionally,
some metabolic analysis systems require multiple temperature values to be entered in order to calculate mm of water
vapor pressure in the atmosphere.

47
Selected Bibliography
Kamon, E. Ergonomics of heat and cold. Texas Reports on Biology and Medicine 33(1): 116-161;1975.
National Institutes of Safety and Health. Criteria for a recommended standard for occupational exposure to hot
environments. Revised criteria; 1986.

A-1
Appendix
Useful Common Conversions
Key sample conversions have been done to permit a rapid rough check of your own interconversions.
Weight
1 Kg = 2.205 lb
1 lb = 0.454 Kg
50 Kg = 110.2 lb
150 lb = 68.0 Kg
Distance
1 cm = 0.3937 inch
1 meter = 39.37 inch
1 inch = 2.54 cm
1 foot = 30.48 cm
Speed
1 mph = 0.44965 m/sec
1 mph = 1.60902 km/h
1 mph = 1.4666 ft/sec
1 ft/sec = 0.6868 mph
1 ft/min = 0.0113636 mph
6 mph = 9.65 km/h
7 mph = 11.2 km/h
3 mph = 1.341 m/sec
VO2 of 1.0 L/min = about 333 W
Power
Power is work per unit time. Since most of us do not often deal with power, interconversions among its units can be
tricky. For example, Kcal are work units, Kcal/min are power units, Watts (W) are power units, and Watt-hours
(Wh) are work units.
1 Watt = 0.01433 Kcal/min = 1 joule/sec
60 watts = .86 Kcal/min
1 Kcal/min = 69.767 W
100 Kcals = 116.3 Wh
1 Watt = 6.12 kgf m/min
1 kgf m/min = 0.1635 W
50 watts = about 300 kgf m/min

A-2
Work
1 Kwh = 859.85 Kcal
1 Kcal = 1.163 Wh
Temperature
C° = 5/9(F°-32)
F° = 9/5 (C°) + 32
21.1°C = 70°F
37°C = 98.6°F
at 21°C a wet bulb of 17° is about 70% Rh
at 70°F a wet bulb of 65.5°F is about 80% Rh
63.0°F is about 70% Rh
61.0°F is about 60% Rh
58.0°F is about 50% Rh