procedures by which the students were selected, can be
TRANSCRIPT

DOCUMENT RESUME
ED 022 706 SE 005 198
By- Suppes, PatrickACCELERATED PROGRAM IN ELEMENTARY-SCHOOL MATHEMATICS- -THE SECOND YEAR, SEPTEMBER 1, 1964TO AUGUST 31, 1965.
Stanford Unir, Calif. Inst. for Mathematical Studies in Social Science.Pub Date 22 Nov 65Note 26p.EDRS Price MF-$025 HC-$1.12Descriptors-*ACCELERATED PROGRAMS, COMPUTER ORIENTED PROGRAMS, COURSE DESCRIPTIONS,
CURRICULUM, *CURRICULUM DEVELOPMENT, *ELEMENTARY SCHOOL MATHEMATICS, MATHEMATICS,
PROGRAM DESCRIPTIONSIdentifiers-California, Stanford, Stanford University
This report describes the second year of the aCcelerated program in elementaryschool mathematics being conducted by the Institute for Mathematical Studies in theSocial Sciences. A description of the first year of the study, including details of theprocedures by which the students were selected, can be found in "AcceleratedProgram in Elementary-School Mathematics--The First Year," PSYCHOLOGY IN THESCHOOLS, Volume 2, (1965), pages 195-203. The second section of this reportdescribes the curriculum content of the second year, including both the work doneduring the academic year 1964-65 and the summer session of July 1965. The thirdand fourth sections give a brief 'description of the class composition and classprocedures. The fifth section on results describes the systematic behavioral datawhich have been collected and analyzed. (RP)

ACCELERATED PROGRAM IN ELEMENTARY-SCHOOL
MATHEMATICS--THE SECOND YEAR
September 1, 1964 to August 31, 1965
TECHNICAL REPORT NO. 86
November 22, 1965
PSYCHOLOGY SERIES
Project Director
Patrick Suppes
Staff: Miss ianaAXeisen.
Miss Phyllis Cole
Mrs. Eleanor Cooper
Mrs. Peggy Coulter
MXs. Muriel LaAnyne
Mr. Joseph Marchal
Reproduction in Whole or in Part is Permitted for
any Purpose of the United States Government
Institute for Mathematical Studies in the Social Sciences
Stanford University
Stanford, California
4.11101 cid .4= 1.1.1
CL.

ACCELERATED PROGRAM IN ELENENTARY-SCHOOL
MATHEMATICS--TBE SECOND YEAR*
1. Introduction
Tbis report describes the second year of the accelerated program in
elementary-school mathematics being conducted by the Institute for Mathe-
matical Studies in the Social Sciences. A description of the first year
of the study, including details of the procedures by which the students
were selected, will be found in "Accelerated program in elementary-school
mathematics--the first year," Psychology in the Schools, Vol. 2, (1965)
pages 195-203. The present report is written to be as homogeneous as
possible with the description of the first year of the study. The second
section of this report describes the curriculum content of the second
year, including both the work done during the academic year 1964-65 and
the summer session of July 1965. The third and fourth sections give a
brief description of the class composition and class procedures. The
fifth section on results describes the systematic behavioral data we
have collected and analyzed.
The tables and figures are similar to those presented in describing
the first year,s work. As has been the experience of most people working
in longitudinal curriculum studiee, it is impossible to describe all the
results in systematic form. For example, in the work with finite symmetry
groups in the summer of 1965, systematic behavioral data were not collected,
and consequently anecdotal descriptions of student reactions and progress
are contained in the section on curriculum content.
During the summer session the students were introduced to the Computer-
based Instruction Laboratory at Stanford and were given work in logic
and arithmetic drills. Description of this new phase is contained both
in the sections on curriculum content and on results.
*The work reported here has been supported by the NationalScience Foundation (Grant G-18709).

Finally, it should be remarked that the group for 1964-65 consisted
of 34 children who were bright second graders in the second year of an
accelerated program in elementary-school mathematics. This fact should
be borne in mind in reading the description of curriculum content.
2. Curriculum Content
A. Academic Year, 1964-65
To develop a basic background in mathematics the children continued
to wo. : individually in the Sets and Numbers text material. The same
concepts introduced in the material last year were now extended to pre-
sent more difficult concepts such as the use of the laws of arithmetic
to teach carrying in multiplication.
This year more stress was laid on enriching the basic material.
Some of this supplementary material was especially written for these
children. Each child worked through a programmed instruction booklet
written on the history of numbers by a member of the project. Babylonian,
Egyptian, and Roman systems of numeration were introduced. The material
showed the numerals for each system and gave the child simple problems
to work out. The number of pages and problems completed varied with
each child.
The topic of coordinate systems was introduced with the game of
tic-tac-toe played in the first quadrant. The terms 'origin!, 'horizontal
axis', 'vertical axis', 'coordinate', and 'ordered pait' were introduced.
The children quickly became familiar with the notion of an ordered pair, .
and the game was extended to all four quadrants. The children were
told to read "-5" as "negative five. They quickly found that in
quadrant 3, both coordinates were negative, that a point lying on the
vertical axis has 0 as the horizontal coordinate, etc. The mastery
of the strategy of the game was quite rapid by all the groups. After
the game, the children went on to plotting points, labeling them, and
drawing given line segments to form figures such as a box, a star, and
a pentagon. Given a linear equation in two variables, the children
were able to make a table of values, so long as positive values were
involved. These points were then plotted. Most of the children were
2

easily able to extrapolate to quadrants 2 and 3 when asked, "Where must
the next point be if all the points are to lie on the same line?"
The groups did two special geometry sections--axes of symmetry and
planes of symmetry. This material was written for the sixth-grade Sets
and Numbers book, but was an excellent follow-up to the work with lines
of symmetry which most of the children had had in the 1964 summer school.
Using familiar geometric figures as symbols, the children quickly
caught the idea of counting in base three. Later the children filled
in a dittoed sheet involving counting in base four (again, geometric
figures were used as symbols). To find simple sunm in the number bases
an addition table was used.
Two games were used to introduce addition of signed integers. The
games were taken from materials of the Madison Project, Discovery Li
Mathematics, by Robert B. Davis (published by Addison Wesley). The
"Postman" gann met with more success than the game "Pebbles in the Bag,"
although the latter game involved the children moving about, counting
dbjects, and'in general participating more actively than in the "Postman"
game.
The logic of identity was used to introduce the concept of proof.
The vocabulary introduced included 'theorem'; and 'axiom'', Many of the
children were already familiar with the concepts of commutativity and
associativity from Sets and Numbers, Book 3B. Some of the theorenm proved
included 3 = 1 + 2, 4 = 1 + (1 + 2), and 4 = 2 + 2. For example, the
proof that 4 = 2 + 2 depended on the associative law for addition, and
the definitions 2 = 1 +.1, 3 = 2 + 1, 4 = 3 + 1.
Proof: 4 = 3 + 1
= (2 + 1) + 1
= 2 + (1 + 1)
= 2 + 2
Definition of 4
Definition of 3
Associative Law
Definition of 2 .
Beginning in January, the children were gtven daily drills to pro-
vide appropriate maintenance of skills. The drills took several forms--
some as dittoed material, 10 to 18 problenm read by the teacher, and
games. The games included "Twenty Questions," "Find the Rule," and
carrying in mental addition.
3
B. Summer Session, July, 1965
Twenty-six children attended a four-;week summer session at the
Computer-based Laboratory on the Stanford University campus. The children
were divided into three groups, with each group coming for an hour.
Each child spent half the period working in the classroom on geometry;
the other half was spent at computer-based terminals wrking on logic
and arithmetic drills.
Classroom Program: Finite Symmetry Groups. During the summer
program the children studied finite symmetry groups. They worked in
small groups using specially prepared material, The children began
with a review and extension of last summer's wwk on lines of symmetry.
They then investigated geometric figures which can be put in several
positions without changing their appearaixe. Many objects can be put
into different positions without substantially altering their appearance--
turning a window pane upside-down in its frame does not change the
appearance of the window, a fan looks the same in several positions.
Any such object can serve as a model on which to base a symmetry group.
The symmetry groups are a particularly appropriate introduction to group
theory because of the large number of such readily-available models.
The figures used in the material include triangles, squares, pentagons,
pictures of pinwheels, propellors, etc. The children found that there
is a single efficient motion which will move a figure to any given
position; they learned how many of these motions (functions) there are
for a given figure, and how to syrdbolize the motions.
The close relationship between the group for a figure and the lines
of symmetry for the figure is stressed throughout the material. The
children soon learned, however, that a group is more than just a set
of motions. They found that there is a natural way of "adding" the
motions in a group. (The addition of two motions was explained quite
simply as the process of doing first one motion and then the other.)
After some practice adding motions, the children were shown that they
could equate the sum of two motions with a single more efficient motion
that produces the same result. The addition facts for groups were
summarized in group addition tables (Cayley Tables). Since all of the
L.

properties of the finite symmetry groups are present in the smaller
groups-- none of the groups used in the work have more than 12 elements
and most have less than 8--the addition tables are small, and tedious
computations can be avoided. Commutativity was reviewed and applied
to group addition. The children already had a good idea of what commuta-
tivity is. The material contains examples of both commutative and non-
commutative additions, and the children learned how to distinguish
commutative from non-commutative groups by inspection of the grcap
addition tables. Throughout the material the existence of a group iden-
tity (a "zero") is stressed and the addition properties of the identity
are investigated. Finally the children were shown that there are some
motions which are so versatile that they can do the wwk of all the
other motions in the group; the existence of such motions (generators)
is closely connected with commutativity in the symmetry groups.
The study of symmetry groups can serve the cLildren in two ways.
First, it can reinforce many concepts to which they have been previously
introduced. Second, it can provide them with a background for ideas yet
to come. Besides extending their knowledge of lines of symmetry, the
children saw many of the other symmetry properties of the regular
polygons--equality of sides and angles, positions of centroids, etc.
Up to this time the only sets the children had met were sets of physical
Objects or, occasionally sets of numbers; sets of functions (motions)
provide a valuable example for additional work with sets.
Work at the computer-based terminals. The work on the terminals
was of two types: first, logic; and second, computation, using simple
number facts. The daily computation drill usually consisted of 30
problems. The problem appeared on a cathode-ray tube, as 4 x 5 =
the child then had 20 seconds to type in the correct answer before
"time is up" appeared. If no response was made in 20 seconds, the child
was then given the same prdblem. If there was again no response within
20 seconds, "time is up" appeared and the child was given the correct
answer to type in. The problem was then repeated. If there was no
response, on this third trial, he was given the time-up signal and the
answer, and then sent to the next problem. Essentially the same procedure
5

was followed when the child made an error. Each child did at least one
drill every day.
For logic work the 26 children were divided into two groups,..-one
group working with English sentences only, and the other using syMboli-
zation after Lesson 5. Lessons 1 and 2 used a simple story to give an
intuitive understanding of simple single-step applications of modus ponens.
The visual problem format appearing on the cathode-ray tube (CRT) was
explained by the audio that went along with it. Each problem was answered
by typing the correct leter from multi-choice answers. Here is an
example of what appeared on the CRT,
1. If the gate is open, then Spot ran away.
20 If the little door is open, then Spot is under the
house.
3. The gate is open.
A. Spot is under the house.
B. Spot ran away.
C. Spot is sleeping under the tree.
The child had only to make the correct choice of A, B, or C, Lessons
2 - 6 followed the same format vith a gradual build-uy; of vocabulary,
and more difficult problems. Lesson 3, for example, introduced the
use of premise numbers, and LGsson 5 introduced two-step problems. Lesson
6 introduced the first explicit rule of inference, modus ponens. For the
students this was called the IF rule. At this point the student had to011111!..
type in the name of the rule used instead of A, B, or C. Each lesson
had a branch for the children who did not meet the criterion on the
main line. While most children at least met the criterion on the branch,
a teacher-call was set up for those who did not. The child then went
through the concepts of the lesson vith the teacher before trying the
branch lesson again at the terminal.
Each of the six lessons in logic is fairly long. Although additional
lessons had been prepared and programmed for the computer, there was not
time during the summer session to use them, but the work in logic is
continuing during 1965-66.
6

3. Group Composition
With the start of classes in September, 1964, there were 32 children
in the group--15 girls and 17 boys. The distribution among the four
schools these children attended was 6, 7, 8, and 11.
At the request of the school district, an exception was made and
two more children were taken into the group. One was the child who
had withdrawn in March, 1964. The other was a transfer in'co the district.
The transfer student bad shown exceptional potential when tested by the
school psychometrist. His I.Q. placed him above the top of the I.Q.
range of the group. A member of the project staff did the necessary
testing to verify the high mathematical potential of the child.
4. Class Procedures
The teaching staff continued individual work with the Sets and
Numbers texts, but group work was done for most of the i.v.Iplementary
material. Daily logs recording the problems attempted and errors
committed were maintained through Sets and Numbers, Book 3B. Starting
with Sets and Numbers, Book 4A, tests were given as each child finished
a section of the book.
During the academic year 1964-65, classes were held five days a
week with the time in some classes being increased to forty minutes.
Classes continued to meet separately with an individual instructor in
each of the four scnools from which the students are drawn, except
that during the summer session the students were brought to the Stanford
University campus in three groups with approximately nine students in
each group.
5. Results
The 1964-65 results again indicate a consistently high daily rate
of performance. Figures 1 - 4 depict the overall group performance for
the 36 weeks of work. On each figure, the number of students on which
each biweekly group mean is based is shown along the top, Figures 1
and 2 give a biweekly cumulative record of problems ana responses
Insert Figures 1 and 2 about here
7

NUMBER OF STUDENTS
32 32 32 32
32 32 32 31 31 31 28
27
27
25
24
21 20
19
6000
5000
4000
3000
2000
1000
pr
PERFORMANCE
TOPFOURSTUDENTS
bAll
Ir .
-
441-
,-
ME
AN
1111
111
e'
"17
BOTTOMFOURSTUDENTS
02
46
810 12
14 16 18 20
22 24 26 28 30
NUMBER OF WEEKS OF PARTICIPATION
Figt:Ire l
Curricllum :t'.7..quisition
curves in terms
of number of problems.
34 36

14,000
13,000
12,000
11,000
10,000
9,000.
8,000
7,000
6,000
5,000
4,000
3,000
2,000
1,000
NUMBER OF STUDENTS
32 32
32 32 32 32 32 31 31 31
28 27
27
25
24
21
20
19
.#
,
MEAN
PERFORMANCE
W47,__Irm!ill
ION
TOPFOUR
SUDENTS
r,
,,"r
e
PIP
F-
BOTTOMFOURSTUDENTS
_.,e
.dig
gg0
24
68
10 12
14
16
18
20 22 24
26
28 30 32 34
36
NUMBER OF WEEKS OF PARTICIPATION
Figure 2.
Curriculum acquisitioncurves in terms
of number of
responses.

completed. On Figure 1, a calibration of the nut:ber of problems in
terns of the Sets and Numbers text material is shown on tbe ordinate.
The mean number of problems completed for 36 weeks of work was 48 ).0.
(This figure is based on 36=week totals for the 32 students who were
in the group in Septenber, 196)-i-.) The ordinate of Figure 2 shows a cali-
bration of the nunber of responses. Tbe number of responses required
for the completion of a single problem varied throughout the books. For
example, in Books 2A and 3A, one problem often required only one or two
reswnses, whereas many problems in Book 3B had sevena steps and required
eight or nine responses. The mean acquisition rate was approximately
one and one-eighth years of the curriculum. It is to be emphasized that
this acquisition rate is for curriculum material written for students at
least one grade level higher than the students in this study.
Table 1 presents a non-cumulative biweekly record of problem acqui-
sition and error rates for the group. Figure 3 depicts the mean pen-
Insert Table 1, Figure 3 and 4 aout here
centage of problems in error for each two-week work period. The mean
biweekly error percentage for the year was 4.5, an increase of 1.7 over
last year. (The figure of ).i-.5 is based on biweekly mean error percen-
tages for all 32 students on the basis of their work in Sets and Numbers,
Book 3B.) Figure 4 shows the mean error percentages for responses.
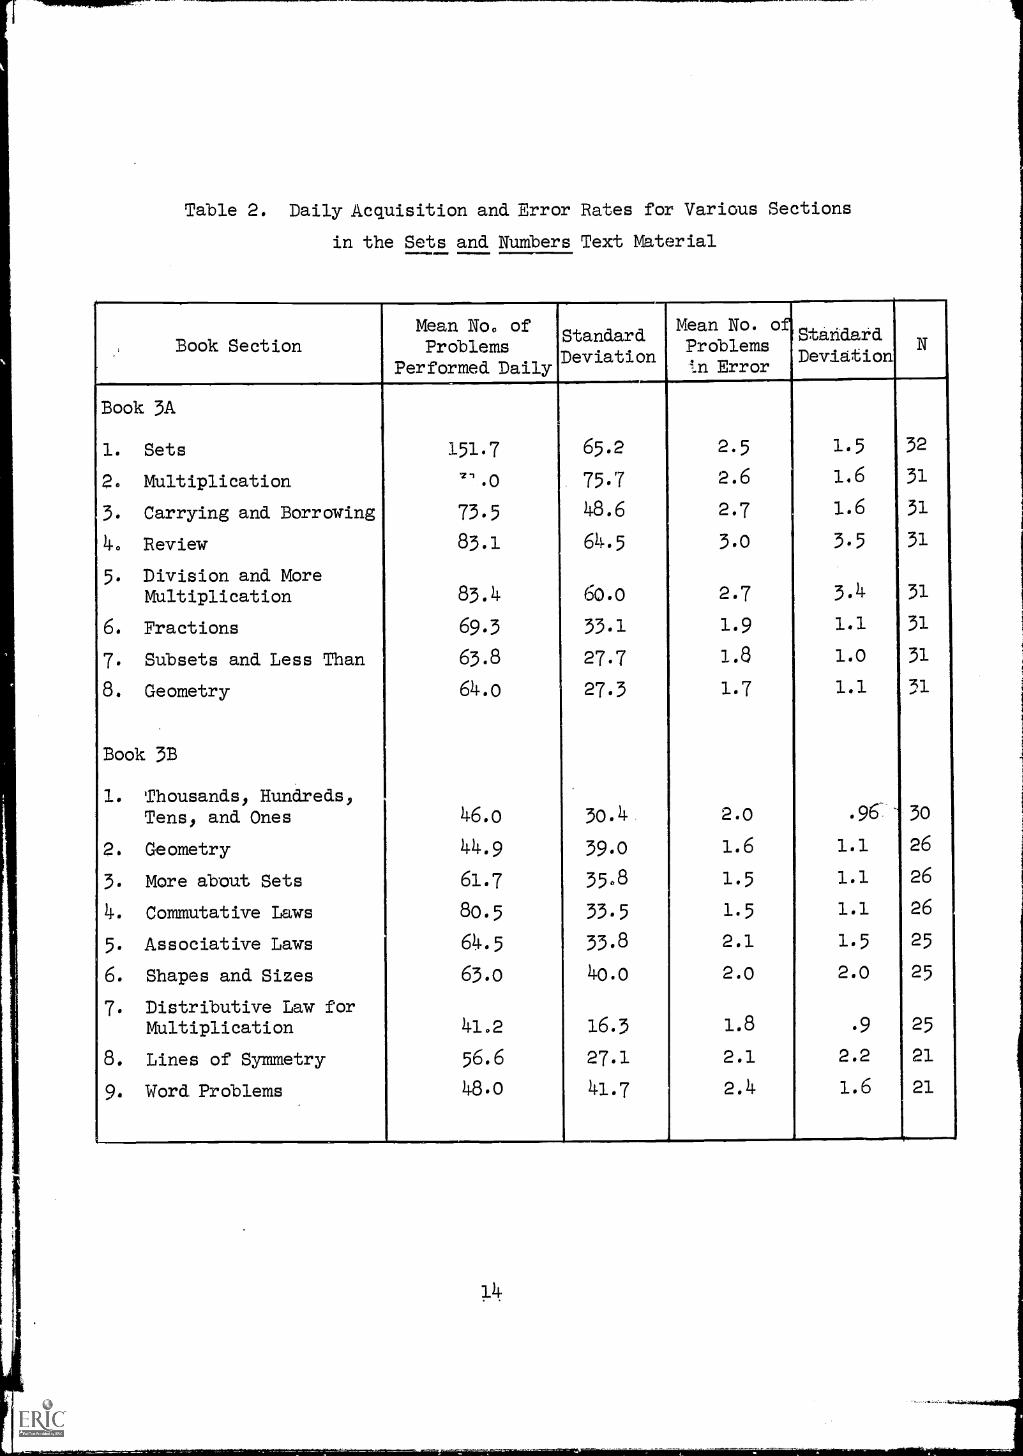
Group acquisition rates can also be computed according to sections
in the text materials. In Table 2, these results are presented for Books
Insert Table 2 about here
3A and 3B. Many of the students begah work in Book 2. Thus, not all
students completed Book 3, and one did not reach the second section of
3A. As the last column in Table 2 shows, the results for 3B reflect
decreasing numbers of students, since only the more proficient students
worked in this boolz.
Only half of the students began work in Book 4A, and only half of
these progressed beyond Section 3. No biweekly record of problems and
10
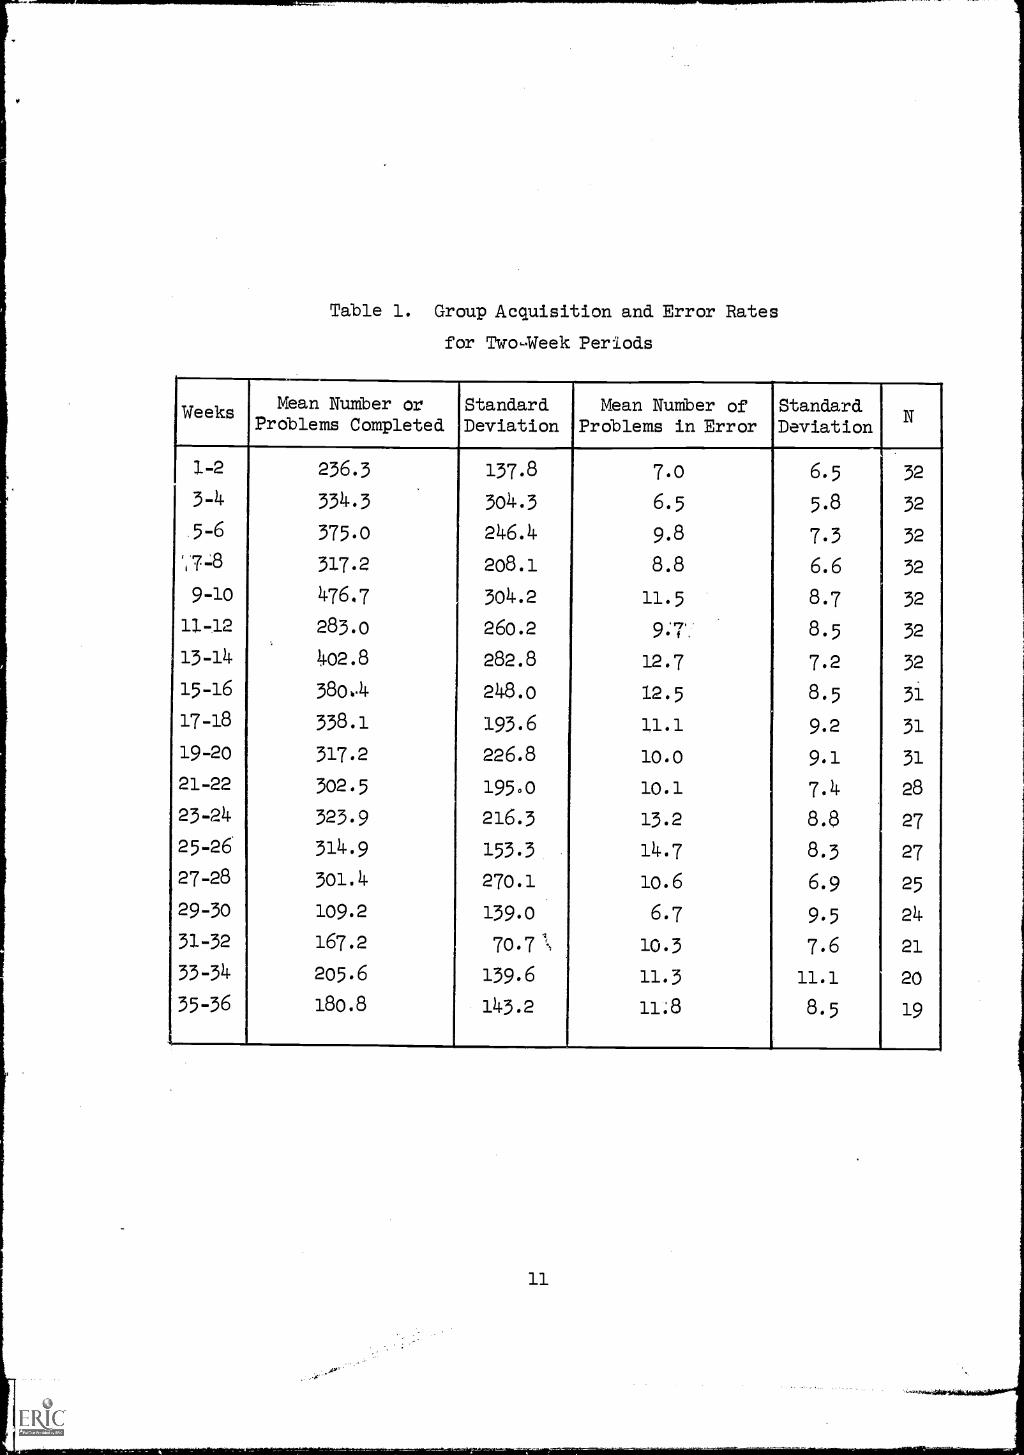
Table 1. Group Acquisition and Error Rates
for Two-Week Periods
Weeks Mean Number orProblems Completed
StandardDeviation
Mean NuMber ofProblems in Error
StandardDeviation
N
1-2 236.3 137.8 7.0 6.5 32
3-4 334.3 304.3 6.5 5.8 32
.5-6 375.0 246.4 9.8 7.3 32
%.7=8 317.2 208.1 8.8 6.6 32
9-10 476.7 304.2 11.5 8.7 32
11-12 283.0 260.2 9:7'; 8.5 32
13-14 402.8 282.8 12.7 7.2 32
15-16 380,4 248.0 12.5 8.5 31
17-18 338.1 193.6 11.1 9.2 31
19-20 317.2 226.8 10.0 9.1 31
21-22 302.5 195.0 10.1 7.4 28
23-24 323.9 216.3 13.2 8.8 27
25-26 314.9 153.3 14.7 8.3 27
27-28 301.4. 270.1 lo.6 6.9 25
29-30 109.2 139.0 6.7 9.5 24
31-32 167.2 7o.7 \ 10.3 7.6 21
33-34 205.6 139.6 11.3 11.1 20
35-36 180.8 143.2 11;8 8.5 19
11

.14
.13
.12 .11
.10 .09
.08
.07
.06 .05
.04 .03
.02
.01 .00
02
NU
MB
ER
OF
ST
UD
EN
TS
32 3
2 32
32
32 3
2 32
31
31 3
1 28
2727
2524
2120
19
,
BO
TT
OM
FO
UR
ST
UD
EN
TS
IFM
EA
NP
ER
FO
RM
AN
CE
111 1E
1111
1111
11E
MIW
AIIM
MIL
IR11
1M
EW
VIA
NE
NE
EN
NIM
ISM
IIII
Mi lil
a:.
1B
MW
...-
TO
PF
OU
RS
TU
DE
NT
S
11
11
46
10 1
2 14
1618
20
22 2
4 26
28
30 3
2 34
36
NU
MB
ER
OF
WE
EK
S O
F P
AR
TIC
IPA
TIO
N
Figure 3.
Mean percentage of problems completed
which were in error.
-

.17 .16
.15
.14 .13
.12
.11
.10
.09
.08
.07
.06
.05
.34 .03
.02
.01
.00
02
46
810
12 1
4 16
1820
22
2426
28 3
0 32
34
36N
UM
BE
R O
F W
EE
KS
OF
PA
RT
ICIP
AT
ION
NU
MB
ER
OF
ST
UD
EN
TS
32 3
2 32
32
32 3
2 32
31
3131
28
2727
25
2421
20
19
Elm
1 III
III
IEWIRI:
Ili
BO
TT
OM
FO
UR
ST
UD
EN
TS
grigroi
111161
TO
PF
OU
RS
TU
DE
NT
S,
IRO
IMO
1111
1111111111102011111111
III,
AIIIBIIMFIPIIIEIIEIIFMO
1 11111115141111051WW1111M
WAPHiliginEllIMI
Mr
IIIIII
.
11111111
OM
1111111
ME
1AN
PE
RF
OR
MIC
E.
Fig
ure
4.
Mean
perc
enta
ge o
f res
pons
es-c
ompl
eted
which
wer
ein error.
11111111MM.....11.1------.--m--
Table 2. Daily Acquisition and Error Rates for Various Sections
in the Sets and Numbers Text Material
[
Book SectionMean No. ofProblems
Performed Daily
StandardDeviation
Mean No. of'Standard
ProblemsIn Error
DeviationN
Book 3A
1. Sets 151.7 65.2 2.5 1.5 32
2. Multiplication 7'1.0 75.7 2.6 1.6 31
3. Carrying and Borrowing 73.5 48.6 2.7 1.6 31
4. Review 83.1 64.5 3.0 3.5 31
5. Division and MoreMultiplication 83.4 60.0 2.7 3.4 31
6. Fractions 69.3 33.1 1.9 1.1 31
7. Subsets and Less Than 63.8 27.7 1.8 1.0 31
8. Geometry 64.o 27.3 1.7 1.1 31
Book 3B
1. Thousands, Hundreds,Tens, and Ones 46.o 30.4 2.0 .96 30
2. Geometry 44.9 39.0 1.6 1.1 26
3. More about Sets 61.7 35.8 1.5 1.1 26
4. Commutative Laws 80.5 33.5 1.5 1.1 26
5. Associative Laws 64.5 33.8 2.1 1.5 25
6. Shapes and Sizes 63.0 40.0 2.0 2.0 25
7. Distributive Law forMultiplication 41.2 16.3 1.8 .9 25
8. Lines of Symmetry 56.6 27.1 2.1 2.2 21
9. Word Problems 48.0 41.7 2.4 1.6 21
responses completed was kept for work done in 4A. However) Table 3 shays
Insert Table 3 about here
the mean percentage of problems in error for these sections. The groups
on which the mean error percentages were based include students who did
not complete the last section in which they were working.
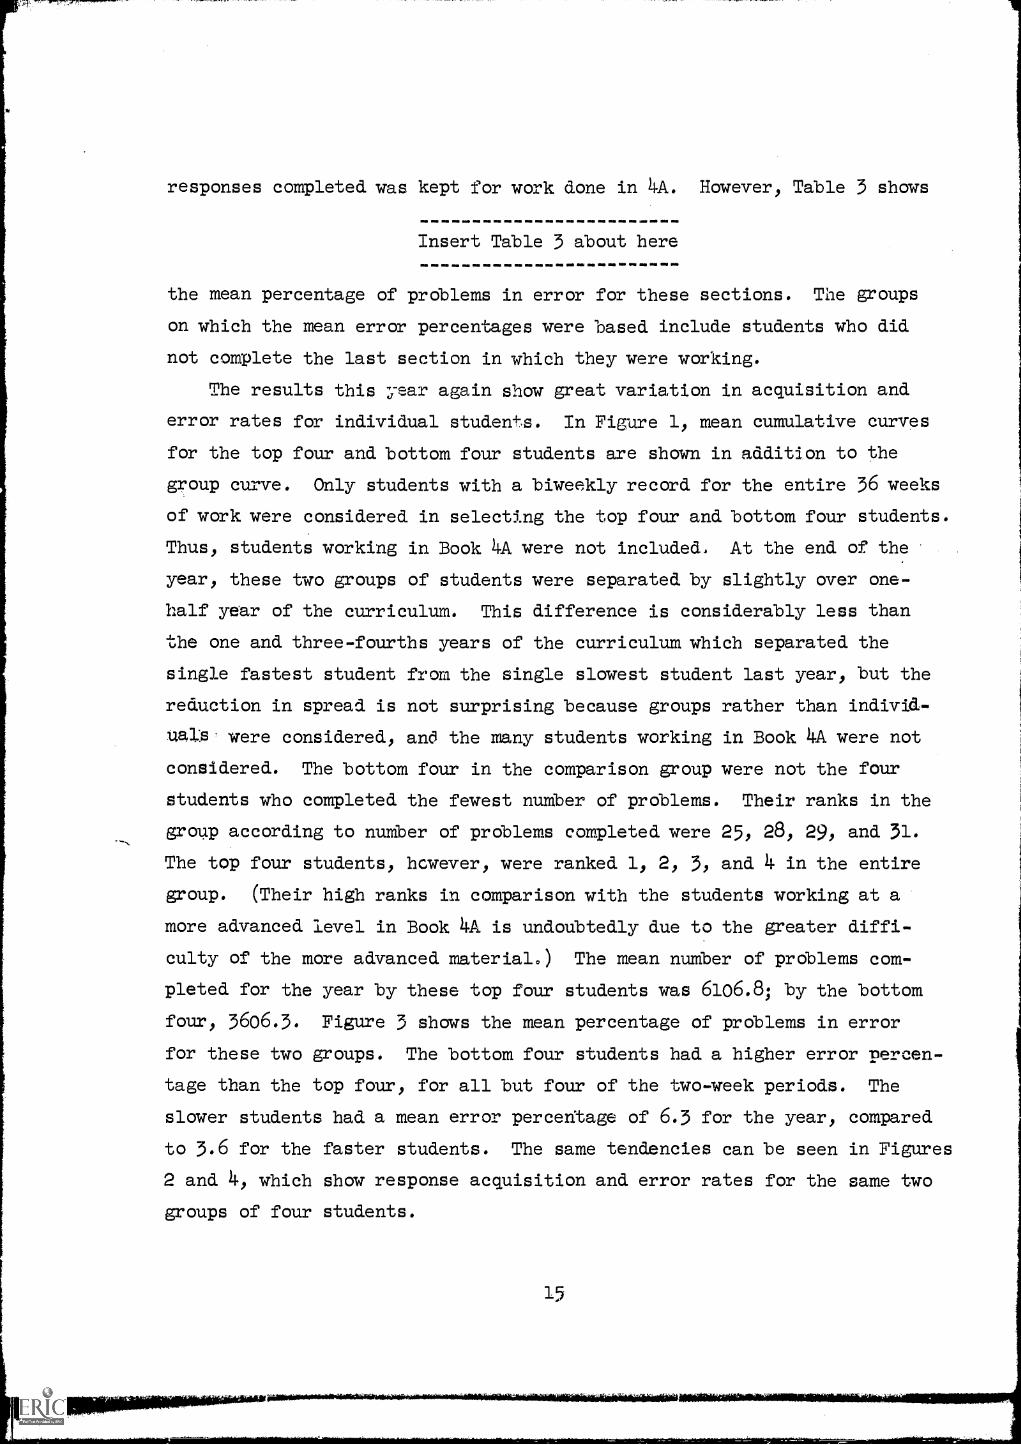
The results this year again show great variation in acquisition and
error rates for individual stude&s. In Figure 11 mean cumulative curves
for the top four and bottom four students are shown in addition to the
group curve. Only students with a biweekly record for the entire 36 weeks
of work were considered in selecting the top four and bottom four students.
Thus) students working in Book 4A were not included. At the end of the
year) these two groups of students were separated by slightly over one-
half year of the curriculum. This difference is considerably less than
the one and three-fourths years of the curriculum which separated the
single fastest student from the single slowest student last year) but the
reduction in spread is not surprising because groups rather than individ-
uals were considered) and the many students working in Book 4A were not
considered. The bottom four in the comparison group were not the four
students who completed the fewest number of problems. Their ranks in the
group according to number of problems completed were 25) 28) 29) and 31.
The top four students) hcwever, were ranked 1) 2) 3, and 4 in the entire
group. (Their high ranks in comparison with the students working at a
more advanced level in Book 11.A is undoubtedly due to the greater diffi-
culty of the more advanced material.) The mean number of problems com-
pleted for the year by these top four students was 6106.8; by the bottom
four) 3606.3. Figure 3 shows the mean percentage of problems in error
for these two groups. The bottom four students had a higher error percen-
tage than the top four) for all but four of the two-week periods. The
slaver students had a mean error percentage of 6.3 for the year) compared
to 3.6 for the faster students. The same tendencies can be seen in Figures
2 and 4, which show response acquisition and error rates for the same two
groups of four students.
15

Table 3. Error Rates by Section for Sets and Numbers Book 4A
Book Section
Mean Percentageof Problemsin Error
StandardDeviation
Book 4A
1. Review of Sets, Addition,and Subtraction 3.4 1.8 16
2. Review of Geometry 6.4 4.1 16
30 Addition and Subtraction 5.0 2.3 16
4. Geometry 11.0 4.6 8
5. Review of Multiplicationand Division 4.4 3.2 7
6. Laws of Arithmetic 2.4 1.5 6
7. Shapes and Sizes 5.6 504 6
8. Distributive Law forMultiplication 3.7 3.1 5
9. Applications 9.4 ___ 2
10. Distributive Law forDivision 2.5 ___ 1

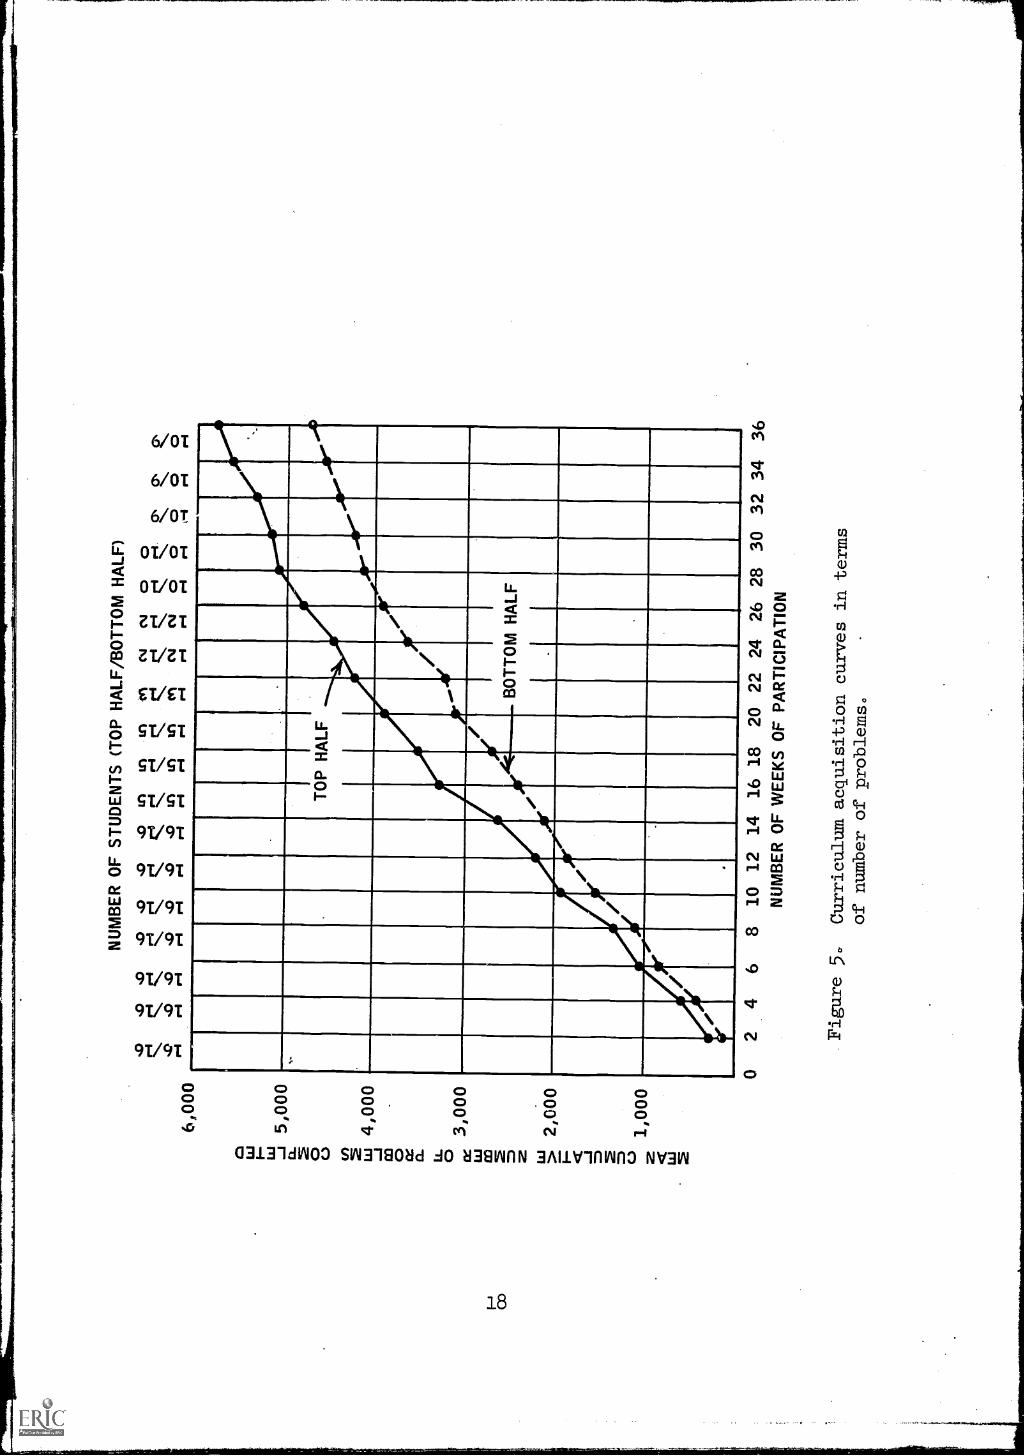
Individual differences can also be seen by comparing the performances
of the top half and bottom half of the students, but, as we would expect,
the spread here is not so striking. These two groups were separated by
slightly more than one-fourth year of the curriculum at the end of 36
weeks. These figures are based only on work done through Book 3B. How-
ever, there Were 16 students who worked beyond this book. These children
were initially included in the top and bottom groups, though they were
dropped out in pairs as they finished 3B, ( one from the top half and
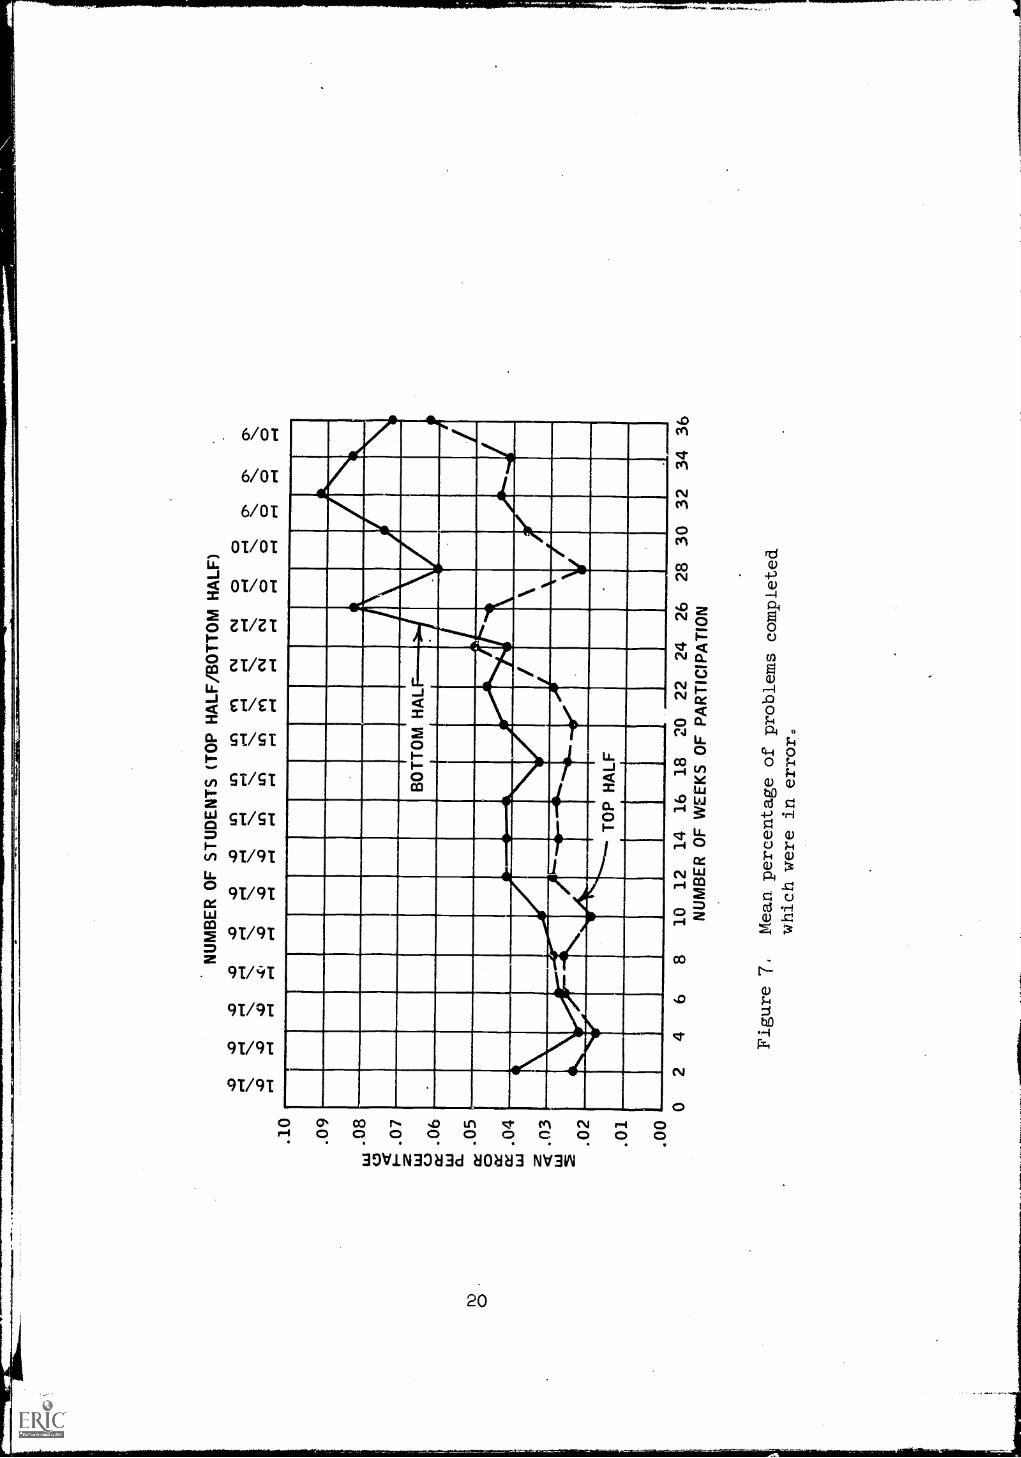
one from the bottom half). In Figures 5 - 8, the number of students in
Insert Figures 5 - 8 about here
each half on which the mean was based is shown along the top, for each
two-week period. Figures 5 and 6 give biweekly cumulative results for
mean number of problems and responses completed. The mean error percen-
tages are shown in Figures 7 and 8.
The standard daviations given in Tables 1 and 2 also reflect strikingly
large individual differences;the standard deviations represent over 60
per cent of the value of the mean except for a few sections in the text
material. Similar variation was seen in the results for last year. How-
ever, Table 2 does show a lower standard deviation for geometry in Book
31L, compared to the deviations for Book 3B and for all the work in geom-
etry last year. This section of Book 5A. deals with the concepts of tri-
angle, quadrilateral, pentagon, circle, concave and convex figures, and
being inside, outside and on a figure. The error rate was lower than
that for the geometry work last year, although it was slightly greater
than the rate for the geometry work in Book 3B.
When the entire group is considered, the curriculum separation between
the top and bottom student is approximately two years. The fact that the
difference Obtaining at the end of the first year has not continued to
increase substantially is significant. The probable explanation is the
definitely increased difficulty and "density" of problems at the fourth-
grade level where the more advanced students were working. The great
emphasis on the algorithms of multiplication and long division in the
upper elementary grades is not in all likelihood a desirable emphasis
17
6,00
0
5,00
0
4,00
0
3,00
0
2,00
0
1,0
0 0
NU
MB
ER
OF STUDENTS (TOP HALF/BOTTOM HALF)
4, r-I ., 4? 1-4
6-1
43 1-4
%.0
1-4
) 1-11 r-I
r-I
r-I
%,"
)
4.1
r-I
r-I
Ln r-I
111
6-1
in U 6-1
LnLN
L
<Lf
lC
41C
I6-
16-
1r-
Ir-
I
r-I.
0\N
.,0
0 0
06-
16-
16-
1 .,.
...
TOPHALF
,
..411
e'.''
4
//
re/
/ile
BOTTOMHALF
_
ii
i/fir-
te
Pr /
die ,
.
04
68
10 1
2 14
16 1
820
22
24 2
6 28
30
32 3
436
NU
MB
ER
OF
WE
EK
S O
F P
AR
TIC
IPA
TIO
N
Figu
re 5
0C
urri
culu
m a
cqui
sitio
n cu
rves
in te
rms
of n
umbe
r of
pro
blem
s.

15,0
00
14,0
00
13,0
00
12,0
00
11,0
00
10,0
00
9,00
0
8,00
0
7,00
0
6,00
0
5,00
0
4,00
0
3,00
0
2,00
0
M 1
,000
NU
MB
ER
OF
ST
UD
EN
TS
(T
OP
HA
LF/B
OT
TO
M H
ALF
),c
)O
4)4)
garl
s-I
s-I
s-I
s-I
r-4
s-I
s-I
s-I
.0O
.0O
.0.0
111
111
LAftl
s-I
s-I
s-I
s-I
s-I
s-I
s-I
s-I
CM
CM
00
CIN
% CM
CM
0 0
0C
Ds-
Is-
Is-
Is-
Is-
I
,
,
TO
PH
ALF
,
,, 4B
OT
TO
MH
ALF
_
_
,
_,
,Ar
.
02
46
810
12 1
416
1820
22
2426
28
30 3
2 34
36
NU
MB
ER
OF
WE
EK
S O
F P
AR
TIC
IPA
TIO
N
Figure 6.
Curriculum acquisition
curves in terms
of nuMber of
responses.
o
.10
.09
ui.0
8
.7
ce:2
.06
La a. ex.0
5
cc .0
4Li
i < .0
3Li
i
.02
.01
NU
MB
ER
OF
ST
UD
EN
TS
(T
OP
HA
LF/B
OT
TO
M H
ALF
)..c
)an
anan
ort
cv04
00
e-I
N-I
8- 1
e- I
r4i1
r-I
asO
NIS
.0#
anan
CI
00
0 0
0I-
I1-
1I-
Ii1
g1i1
i1r4
6-1
I-I
rl
TO
P H
ALF
.00
02
46
810
1214
1618
2022
2426
28 3
0 32
34 3
6N
UM
BE
R O
F W
EE
KS
OF
PA
RT
ICIP
AT
ION
Figure 7,
Mean percentage of
problems completed
which were in error.
ALA

NU
MB
ER
OF
ST
UD
EN
TS
(T
OP
HA
LF/B
OT
TO
M H
ALF
).0
0r-
Ir-
I.0
0r-
Ir-
Ir-
I
,c)
inin
Ln14
1C
VC
V0
0I-
II-
Iirg
g-1
g-1
OLn
inIn
cnC
VC
V0
0r-
II
I-1
0 0 0
1012
14
1618
20
22 2
426
28 3
0 32
34
36N
UM
BE
R O
F W
EE
KS
OF
PA
RT
ICIP
AT
ION
Figure 8.
Mean percentage of
responses completed
which were in error.
for bright second and third graders. This is one of the reasons we have
introduced an increasingly larger body of supplementary material as the
students become more deeply immersed in the mathematics curriculum of
the upper elementary grades.
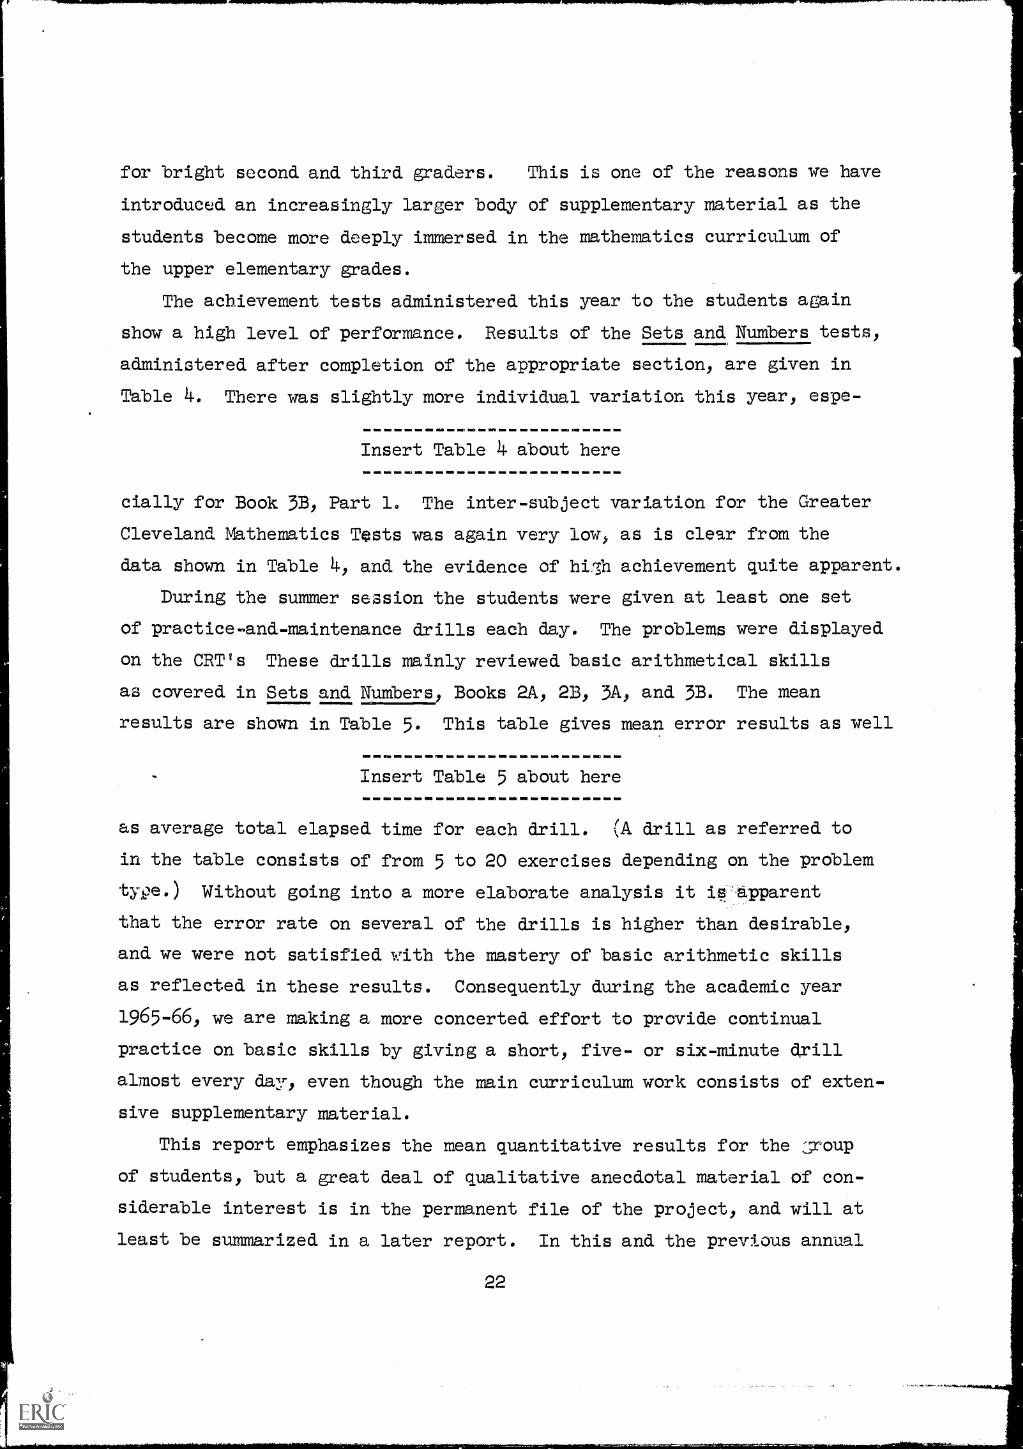
The achievement tests administered this year to the students again
show a high level of performance. Results of the Sets and Numbers tests,
administered after completion of the appropriate section, are given in
Table 4. There was slightly more individual variation this year, espe-
Insert Table 4 about here
cially for Book 3B, Part 1. The inter-subject variation for the Greater
Cleveland Mathematics Tests was again very low, as is cle.ar from the
data shown in Table 4, and the evidence of hio,i1 achievement quite apparent.
During the summer session the students were given at least one set
of practice-and-maintenance drills each day. The problems were displayed
on the CRT's These drills mainly reviewed basic arithmetical skills
as covered in Sets and Numbers, Books 2A, 2D, 3A, and 3B. The mean
results are shown in Table 5. This table gives mean error results as well
Insert Table 5 about here
as average total elapsed time for each drill. (A drill as referred to
in the table consists of from 5 to 20 exercises depending on the problem
type.) Without going into a more elaborate analysis it ip apparent
that the error rate on several of the drills is higher than desirable,
and we were not satisfied with the mastery of basic arithmetic skills
as reflected in these results. Consequently during the academic year
1965-66, we are making a more concerted effort to provide continual
practice on basic skills by giving a short, five- or six-minute drill
almost every day, even though the main curriculum work consists of exten-
sive supplementary material.
This report emphasizes the mean quantitative results for the .roup
of students, but a great deal of qualitative anecdotal material of con-
siderable interest is in the permanent file of the project, and will at
least be summarized in a later report. In this and the previous annual
22

Table 4. Mathematics Achievement Tests
TestGroupMean
StandardDeviation
TotalPossibleScore
N
Sets and Numbers
Book 2A--Part 1 37.9 1.7 4o 32
Book 2A--Part II 30.2 4.6 34 32
Book 2B--Part I 25.9 3.9 30 32
Book 2B--Part II 25.7 2.8 28 31
Book 3A--Part I 38.1 5.2 44 31
Book 3A--Part II 32.1 6.9 4o 28
Book 3B--Part I 31.9 15.1 39 17
Book 3B--Part II 36.5 3.4 4o 12
Book 4A--Part I 46.4 4.5 55 7
Book 4A--Part II 18.4 1.3 20 5
Book 4A--Part III 34.3 5.6 4o L.
Book 4A--Part IV 30.0 none 32 1
Book 4A--Part V 27.0 none 27 1
Book 4A--Part VI 30.0 none 30 1
Book 4A--Part VII 34.0 none 37 1
Greater ClevelandMathematics Tests
28.0 1.2 29 32
for Grade 2
1
2 28.8 2.0 31 32
3 26.1 3.7 31 32
L. 27.1 3.0 31 32
23

Table 5. Summer-Session Drill Results
DrillAverage Numberof Total Errors
Average ProbabilityWrong
Average ElapsedTime in Seconds
1 .7 .02 173
2 3.3 .11 273
3 2.4 . .o8 252
4 4.2 .14 290
5 3.2 .11 262
6 4.2 .14 262
7 8.9 .30 378
8 7.4 .25 382
9 6.9 .23 369
10 '.7.9 .26 335
11 5.5 .18 296
12 2.9 59 1711-
13 7.0 .23 429
14 5.7 .19 313
15 6.3 .21 307
16 5.3 .18 284
17 9.1 .30 396
18 8.6 .29 357
19 12.3 .41 426
20 6.1 .20 309
21 15.0 050 544
22 12.4. .41 490
23 6.6 .22 361
24 9.6 .32 389
25 11.6 .39 501
26 5.8 016 310
27 9.1 .30 382
24

repor
the a
bei
thL,
t an emphasis has been placed on quantitative results, because of
lmost total dbsence of such records in the published literature.
Study of the personality and social development of the students is
ng continued under the direction of Professor Pauline S. Sears, and
results will be published elsewhere.
25