draft – do not quote without authors’...
TRANSCRIPT
Draft – do not quote without authors’ permission
1
HOW TO DO (AND HOW NOT TO DO) FIELDWORK ON FAIR TRADE AND
RURAL POVERTY
CHRISTOPHER CRAMER
DEBORAH JOHNSTON
BERND MUELLER
CARLOS OYA
JOHN SENDER
ABSTRACT
Research for the Fair Trade, Employment and Poverty Reduction Project (FTEPR) in
Ethiopia and Uganda is gathering new evidence on the consequences of Fair Trade for
poor people engaged in wage labour for certified producers. This has broader
significance for understanding the mechanisms through which agricultural commodity
exports affect the welfare of poor people. This paper discusses the methodological
contribution of this research, contrasting the project with standard approaches to rural
development economics research and in particular with the shortcomings of the vast
majority of research on the impact of Fair Trade. The paper highlights four
methodological innovations. First, in marked contrast to virtually all previous
evaluations of fair trade schemes, FTEPR methods were designed specifically to
collect evidence on wage workers rather than producers. Second, the project adopted
a form of contrastive venue-based sampling, aided by the use of GPS devices and
handheld computers (PDAs). Third, within the selected research sites, stratified
random sampling procedures were based on clearly identifiable ‘residential units’ as
opposed to ill-defined ‘households’. And, fourth, when constructing a ‘household
roster’ the research used an economic definition rather than the more common and
often misleading residential rules.
Key Words: Fair Trade, Agricultural Exports, Labour Markets, Africa, Methodology
Draft – do not quote without authors’ permission
2
INTRODUCTION
This paper addresses three themes of growing interest in the development literature:
the mechanisms through which agricultural commodity exports may affect the welfare
of poor people; labour markets in low-income countries; and advances in
methodology in development research. It does so through a focus on a fourth issue
that has attracted increasing attention (and resources): fair trade and its role in poverty
reduction. Its focus is specifically on the methodology of rural research.
The paper discusses a methodological approach to assessing the consequences of fair
trade for poor people engaged in wage labour for ‘certified’ producers in Ethiopia and
Uganda. The methodological argument has broader implications for research on
poverty and agrarian change, contrasting the approach developed for the Fair Trade,
Employment, and Poverty Reduction Project (FTEPR) with standard approaches to
rural development economics research.1 The paper highlights four methodological
innovations. First, in marked contrast to virtually all previous evaluations of fair trade
schemes, FTEPR methods were designed specifically to collect evidence on wage
workers rather than producers. Second, the project adopted a form of contrastive
venue-based sampling, aided by the use of GPS devices and handheld computers
(PDAs). Third, within the selected research sites, stratified random sampling
procedures were based on clearly identifiable ‘residential units’ as opposed to ill-
defined ‘households’. And, fourth, when constructing a ‘household roster’ the
research used an economic definition, discussed below, rather than the more common
and often misleading residential rules.
The most recent review of research on Fair Trade and other ethical labels argues that
field studies ‘lack a convincing and consistent methodology’ (International Trade
Centre, 2011: 25). One issue common to previous Fair Trade research concerns the
criteria used in the selection of research sites. Certified or Fair Trade production takes
place in very different contexts, with certified schemes varying, among other factors,
in terms of the level of external subsidy/support they have received, the number of
producers participating, the number of years of operation, the degree of financial
1 Fair Trade, Employment and Poverty Reduction in Ethiopia and Uganda is a four year research project (2009-13) funded by the UK Department for International Development (DFID).
Draft – do not quote without authors’ permission
3
viability, distance from markets. The range of rural areas participating in Fair Trade
schemes (and therefore the range of possible research sites within a country) is very
wide, but the reasons for deciding to focus fieldwork in a particular rural area, or on
one particular group of certified producers, have rarely been explained in any detail.
For example, the only rationale for choosing producers in one methodologically
ambitious, ‘quasi-experimental’ study of the welfare impact of fair trade programmes
is briefly (and unsatisfactorily) stated as: ‘The selection of FT organizations for the
analysis has been conducted in coordination with Solidaridad’ (Ruben et al., n.d.:
17).2 A recent impact evaluation commissioned by the Fair Trade Foundation selected
three smallholder banana producer organizations in three countries, but provided little
discussion of the choice of smallholder organizations or the countries themselves
(Smith, 2010: 28). Nevertheless, this study did acknowledge that one very important
country producing fair trade bananas (Colombia) was for some unstated reason
excluded from this ‘Global Assessment of Impact’ and that the three banana
plantations selected were not at all representative of the majority of fair trade certified
plantations (ibid: 33). In particular, two of the case studies of smallholders involved
organizations that were ‘larger, more sophisticated and/or more supported by external
partners’ than other fair trade organizations. Further, all three banana case studies
were also unrepresentative of the majority of fair trade producers in that they sold
almost their entire output to the fair trade market (ibid: 138).3 Most Fair Trade research has concentrated on an ideal type of crop producer, i.e. the
small farm household using more family than hired labour to produce the certified
crop. One systematic review of the certification literature found that ‘most of the
studies reviewed deal with the producer as a self-employed individual and with
producer cooperatives’ (International Trade Centre, 2011: 19). The Fairtrade 2 A less sophisticated study comparing Fair Trade, Utz and Rain Forest Alliance smallholder tea and coffee production in Kenya, Uganda and Ethiopia offers a similarly brief and unsatisfactory rationale for the choice of case studies (Riisgaard et al., 2009: 11). A research report comparing South African wine producers following ethical ‘‘codes of practice’’ with producers not following these codes did explain the methods used to select producers and research sites in some detail, but did not take full account of the biases resulting from the need to ensure producers’ cooperation (Ewert et al., 2005). 3 Griffiths’s review of the Fair Trade literature suggests that: ‘These studies are concentrated on high profile cooperatives, and appear to be studies of cooperatives which sell more than the median proportion of their output to Fairtrade, to be more successful than the average in fact’ (Griffiths, 2010: 3).
Draft – do not quote without authors’ permission
4
Foundation commissioned a review of 33 case studies, which concluded that: ‘there
is limited evidence of the impact on workers of participation in Fairtrade, and more
research is required … ‘ (Nelson and Pound, 2009: 35). The study of Fair Trade
certified smallholder banana organizations referred to above failed to obtain any data
at all on workers hired by producers or their organizations in two of the three case
studies (Smith, 2010: 52). Other research on the impact of Fair Trade certification,
based on case studies of six rather successful and unrepresentative small producer
organizations, simply assumes that the landless, women and those with limited
education do not benefit from and are ‘outside the dynamics of’ Fair Trade labelling
(Laroche and Guittard, 2009: 34). The International Initiative for Impact Evaluation
highlights the problem that ‘many Fairtrade organizations … establish a minimum
price for producers but do not deal with the conditions of workers that the producers
may employ’ (International Initiative for Impact Evaluation, 2010: 2).4
Thus, the majority of these studies do not even attempt to construct samples of
seasonal and permanent wageworkers producing certified export commodities. On the
rare occasions when wageworkers are included in Fair Trade research, information on
these workers is often collected from lists of wageworkers provided, and sometimes
selected, by employers or by officially sanctioned worker representatives (Barrientos
and Smith, 2006: 4, Ruben et al., n.d.: 23, Omosa et al., 2006: 7). These lists may
well be censored and are certainly unlikely to contain all casual workers, let alone
recently dismissed or disgruntled workers. The other main source is focus groups,
with group membership guided by employers’ advice, or over-representing the leaders
of the permanent workforce, rather than large numbers of illiterate casual (female)
wageworkers. No convincing rationale for the selection of members of these focus
groups is provided (Pound and Phiri, 2009, Gonzalez, 2010).
The unrepresentative workers who appear on these lists or in these focus groups are,
all too frequently, interviewed on their employer’s premises (Ewert et al., 2005: 22-3,
Barrientos et al., 2009: 27). Such interviews are unlikely to solicit reliable
information; workers who are not interviewed in private and with firm assurances of
confidentiality may go to great lengths to avoid the risk of being seen to offend 4 An important exception to this neglect of wageworkers is research by Valkila and Nygren (2009), Leuchtford et al. (2008), Maertens and Swinnen (2011), and Maertens et al (2011).

Draft – do not quote without authors’ permission
5
dominant classes. In Nicaragua, for example, some workers for cooperative coffee
processing mills were interviewed at their workplace and some while waiting for
buses along the roads outside the mills. ‘Unsurprisingly, workers interviewed outside
the mills were more critical of their working place than those interviewed inside.
According to these workers, visitors often come to the mill to ask about their working
conditions, but they are afraid to say anything negative for fear of losing their job’
(Valkila and Nygren, 2009: 5).
The methodological and ideological shortcomings of much previous research on Fair
Trade are especially egregious examples of more widespread features of rural
development economics research. And Fair Trade is just one among many
institutional forms of the broader phenomenon of agricultural exports. It has been
acknowledged that too little is known about the transmission mechanisms linking
agricultural commodity trade and poverty reduction. Collecting more evidence,
specifically on complex rural labour markets linked to agricultural export production,
is therefore urgently required. The evidence needed is not available because almost all
socioeconomic surveys in developing countries fail to capture data on the most
vulnerable, poorly educated casual and seasonal workers, especially temporary
migrant workers (Sender et al., 2005, Sender and von Uexkull, 2009: 64-66, Pincus
and Sender, 2008).5 As we will argue below, one reason for this failure is the a priori
standardized, narrow and inappropriate definition of ‘the household’ and its
5 On the poor coverage of rural wage employment in commonly cited Ethiopian surveys
specifically, see Rizzo (2011). The more general point has been made that ‘in much of the
development literature on pro-poor growth nowadays, little or not attention is paid to the
underlying mechanisms that determine the dynamics of income…specifically, the dynamics
of employment growth and of how and to what extent productivity growth translates into the
growth in labour earnings is left out of the equation’ (Wuyts, 2010: 10). On the ‘jobs
dementia’ that affects development aid thinking and agencies more generally, see also
Amsden (2011), who points out, for example: ‘Despite championing the cause of poor people
around the world, and dramatizing the human condition, the United Nations’ Millennium
Development Goals make not the slightest mention of employment generation as a means to
battle poverty (2011: 57).
Draft – do not quote without authors’ permission
6
‘residents’, and the use of incomplete household lists that miss out migrant workers at
their workplace.
The methodology presented in this article is based on research techniques that differ
from the methods commonly used in both standard rural surveys in Africa and in the
evaluation of Fair Trade: the use of contrastive case-studies to understand causal
channels leading to differences in employment and poverty; the construction of up-to-
date household lists using GPS technology in order to remove some common but
damaging biases that emerge in the use of official household lists; and an innovative
approach based on a wider and more useful definition of household membership.
These techniques are designed to try to overcome both the technical challenges of
gathering evidence on elusive populations and the common analytical evasion of the
significance of wage employment to the lives and prospects of the poorest people.
The FTEPRP fieldwork methods focus on providing gendered information concerning
the relative importance for rural poverty reduction of both wage and self-employment
in a variety of carefully selected rural settings. While rural wage work may be
extensive in scale, the ideological and practical factors that tend to limit the coverage
of such workers suggests that rural casual wageworkers should be regarded as a
vulnerable, ‘hard-to-reach’ or ‘hidden’ population, excluded from many official
statistical surveys and rural development programmes. This is why rigorous
epidemiological research on similarly ‘hard-to-reach’ populations, such as illegal
migrants, refugees, commercial sex workers, injecting drug users and other groups at
high risk of HIV, offers valuable lessons for the design of surveys of rural labour
markets in Africa. Indeed, the method adopted in the FTEPRP shares many features
with Venue-based Sampling as developed by the US Centers for Disease Control and
Prevention (Muhib et al., 2001, Vermund et al., 2010). As Landry and Shen (2005: 1)
explain, excluded populations tend not to be missing at random, so that census or
survey data is usually biased, ‘particularly with respect to minorities, immigrant
groups, or the homeless’.
The success of this method depends on the ability of researchers to triangulate limited
quantitative data with ethnographic qualitative work to identify specific geographic
areas (or ‘Venues’) with a high density of the target population to be sampled. Section
Draft – do not quote without authors’ permission
7
2 (Selecting the Research Sites) of this article describes in some detail the rationale
for and the qualitative methods used to identify the Research Sites for the FTEPRP:
the main examples are drawn from fieldwork in Ethiopia, though some information is
given also on the work in Uganda. This follows criticisms of many other rural survey
approaches to the issue of research site selection.
The underlying research method developed for FTEPRP research and discussed in
this paper is based on a contrastive case study approach that highlights the rationale
for the purposive selection of different research sites and that generates comparisons
within as well as between sites. The purpose is to assess the strength of mechanisms
connecting agricultural commodity export production with the lives, and prospects for
poverty reduction, of poor rural people, particularly those involved in wage
employment.
Section 3 (Selecting the research sub-sites and sampling) discusses the additional
methods used by the FTEPRP to select Research Sub-sites, i.e. the ‘hotspots’
containing concentrated populations of wageworkers producing export crops. Section
3 also describes the innovative methods to obtain household lists that are more
accurate than those used in many other studies. This approach may be regarded as an
adaptation of techniques using hand-held computers and global positioning devices –
also pioneered by epidemiologists (Vanden Eng et al., 2007). Section 3 also highlights
our approach to household membership, where we eschew the misleading and narrow
criteria used by many other studies, in favour of an approach that allows the linkages
between geographically distant individuals to be better understood.
Besides describing some new (soft and hard) technology used in the research, the
paper advocates a very simple reform to the way that most rural research on poverty
reduction is reported, recommending and demonstrating a greater openness and clarity
on how and why particular research sites are chosen and sampling methods adopted.
SELECTING THE RESEARCH SITES
Although the evaluative research literature on Fair Trade organizations is especially
weak methodologically, the problems highlighted in the introduction are shared by
much economic research in poor rural areas. For example, the most influential rural
Draft – do not quote without authors’ permission
8
surveys conducted in Ethiopia in recent decades have made little effort to justify their
selection of sample sites. Debates on rural poverty in Ethiopia very often cite the
results of The Ethiopian Rural Household Surveys 1989-2004. These surveys selected
only 15 (out of more than 20,000) kebeles6 in Ethiopia as the sites for data collection.
The rationale provided for the selection of these kebeles is confusing: initially some
kebeles were chosen on the grounds that they were typical (in some undefined sense)
of areas affected by the 1984-5 famine; additional kebeles were later selected ‘to
account for the diversity of the farming systems in the country’ and it was then
claimed that that households in the survey are ‘broadly representative of households
in non-pastoralist farming systems as of 1994’ (Dercon and Hoddinott, 2009: 6-8).7
However, 18 agro-ecological zones have been defined for Ethiopia (CSA, 2006: 16)
and within each of these zones there are many hundreds of alternative kebeles that
could have been be selected as research sites. The reasons for selecting the 15
particular kebeles that continue to be the focus of so much research are not discussed.
There were plans to study exactly the same 15 kebeles in 2010, not on the old grounds
that they are representative of agro-ecological zones, but because they ‘fall into five
main livelihood categories of broad relevance for policy’ (Bevan, 2009: 14).
However, no less than 175 extremely diverse ‘livelihood zones’ have been identified
and mapped in Ethiopia (Livelihoods Integration Unit (LIU), 2011). The 15 kebeles
selected for the ERHS obviously provide a limited coverage of this wide range of
livelihood categories (The Livelihoods Integration Unit, 2010: 121). The claimed
policy relevance of the selected sites is also questionable; they will certainly not be
useful to illuminate some key economic policy debates - about floriculture, coffee or 6 In Ethiopia, the kebele is the smallest administrative unit. It is broadly comparable to a ward. 7 A similar claim was made concerning the choice of the 36 villages surveyed in an influential study of poverty in rural Uganda: ‘The selected villages represent quite well the considerable diversity that exists within the two selected regions’. However, the researchers make it clear that the actual choice of villages was heavily influenced by the wishes of District-level bureaucrats; the measures, or the relevance to issues of poverty, of the indicators of ‘diversity’ are not discussed (Krishna et al., 2006). Another study in four Districts of rural Uganda (of coffee producers) sampled only those producers appearing in the Uganda National Household Survey (UNHS). Unfortunately, the UNHS was not designed to be representative of coffee producers (or of households in each District), so that the sample cannot be considered representative of robusta producers in the Districts concerned, let alone of coffee producers in Uganda as a whole. This fundamental problem did not prevent the World Bank funded researcher from drawing conclusions about ‘the Ugandan coffee market’ and ‘the majority of coffee grown in Uganda’ from unrepresentative data (Hill, 2010: 455 and 438). The fact that the UNHS specifically excluded larger scale coffee farmers in Uganda from the survey is another important reason for caution in extrapolating its results to the coffee market as a whole (Ssekiboobo, 2008: 7).

Draft – do not quote without authors’ permission
9
foreign exchange availability, since they do not represent key areas characterized by
agricultural export production.8 A much more transparent discussion of the choice of
rural research sites for another longitudinal survey in Ethiopia notes that ‘budgeting
constraints and concerns regarding the long-term sustainability of the study meant that
the rural sites selected were located in relatively better accessible areas. This is likely
to have resulted in (surveyed) rural households being located in wealthier sites than
the typical Ethiopian rural household’ (Outes-Leon and Sanchez, 2008: 4).
The choice of fieldwork site may be expedient and more or less defensible. For
example, an authoritarian ruling political party or the Fair Trade certifying body or
manipulative Co-operative Union officials may have pre-selected the area for the
researchers, discouraging research in other areas; there may be insufficient research
funding to travel to more distant research sites; record keeping may be weak at other
sites, or production volumes erratic; local managers and state officials may welcome
(or refuse) visits from outsiders. These types of practical issue will always play a role,
but it is difficult to make a judgement about the meaning of research results if all the
reasons for the selection of research sites are not discussed in detail. It is necessary to
weigh up and balance complex information about potential sites, since sampling will
have little credibility if it appears to have been ad hoc or whimsical (Wilson et al.,
2006). There is, therefore, a strong case for an unusually thorough discussion of the
rationale for, and the methods of, site selection in the FTEPRP.
The FTEPRP carries out contrastive research on rural employment and poverty
dynamics in two very poor countries and is based on a theoretical case for the
importance of studying the impact of small- and large-scale export crop production,
certified and non-certified production, and the production of different commodities.
The point is to explore the factors responsible for differences between phenomena in
conditions with some common features: first, to establish whether there are contrasts,
and what they are, between Fair Trade and non-Fair Trade crop production, or
8 The broader political relevance of the sample is also questionable; the ERHS is not representative of the ethnic and religious composition of the rural Ethiopian population: e.g. Oromos are underrepresented (Kumar and Quisumbing, 2010: 2).
Draft – do not quote without authors’ permission
10
between Fair Trade production and labour in coffee versus flowers, for example;
second, to try to explain some of these differences (Lawson, 2003, Lawson, 2004).9
Given that FTEPRP research includes an assessment of the ‘impact’ of Fair Trade,
this approach may appear to have something in common with the randomized
controlled trial (RCT), ‘experimental’ method used to evaluate development
‘treatments’ (Banerjee and Duflo, 2011). This paper is not primarily intended to
provide a critique of RCT ‘randomista’ methods. However, it is worth briefly
contrasting these with the methods designed for FTEPRP research. The purposive
selection of sub-sites and the decisions to oversample certain groups (wageworkers)
were key elements of the FTEPRP’s effort to understand complex mechanisms and to
accumulate new knowledge about rural development processes through old-fashioned
theoretically motivated descriptive research. Such methods have been favourably
compared to more fashionable ‘quasi-experimental’ methods promoted by the RCT
advocates (Deaton, 2010). The argument is that it is far more important to achieve an
improved understanding of how (through what mechanisms), for whom (which
specific population groups), or why the production of export commodities might
influence rural poverty, rather than to answer the narrow question of whether or not
significant poverty reduction effects have been achieved on ‘average’ in the
‘treatment’ (e.g. the Fair Trade certified) group.10 Our research questions go beyond
the usually narrow scope of the parameters of interest to social experiments in RCTs
(Ravallion 2009, 2). Nor does the contrastive research strategy adopted for FTEPRP
fieldwork make over-ambitious claims to establish ‘control’ groups, emphasising
rather the complexity and flux within specific rural populations and research sites.
Further, the emphasis within FTEPRP research on the distributive implications of
different institutional arrangements for agricultural export production contrasts with
the typical RCT effort to isolate average ‘treatment’ effects. 9 See also George and Bennett (2005) on comparative case studies. 10 Besides, randomized experiment methods are most readily applicable in the case of discrete, homogenous interventions with clearly delineated target groups, rather than in the study of more complicated sets of interventions to improve rural welfare through promoting commodity exports. ‘A proper RE requires a high degree of homogeneity in intervention, target groups and context over time, conditions which are unlikely to hold in many cases’ (Vaessen, 2010: 15). Moreover, as Ravallion (2009: 2) notes, ‘randomization is only feasible for a non-random subset of the interventions and settings relevant to development… [and] better suited to relatively simple projects, with easily identified “participants” and “non-participants”’, not the case in our research project.
Draft – do not quote without authors’ permission
11
A decision was taken early on in consultation with the funding agency to select two
commodities in each country, allowing for further contrasts within – and in the case of
one commodity across – the two countries. Thus, the research team chose to study
labour markets in coffee and flower producing sites in Ethiopia and coffee and tea
producing sites in Uganda. The reasons for choosing coffee, tea and flower
production include: the macro-economic importance of at least two of these
commodities in Ethiopia and Uganda; the labour-intensity and contribution to
employment of all these commodities; the relatively long history of Fair Trade and
other certification schemes for these commodities; the dramatic contrast between the
dynamism of floriculture in Ethiopia and the relative stagnation in the production of
both coffee and tea in Uganda and in the production of coffee in Ethiopia; and the
opportunity to contrast techniques of arabica production with those of robusta
production.
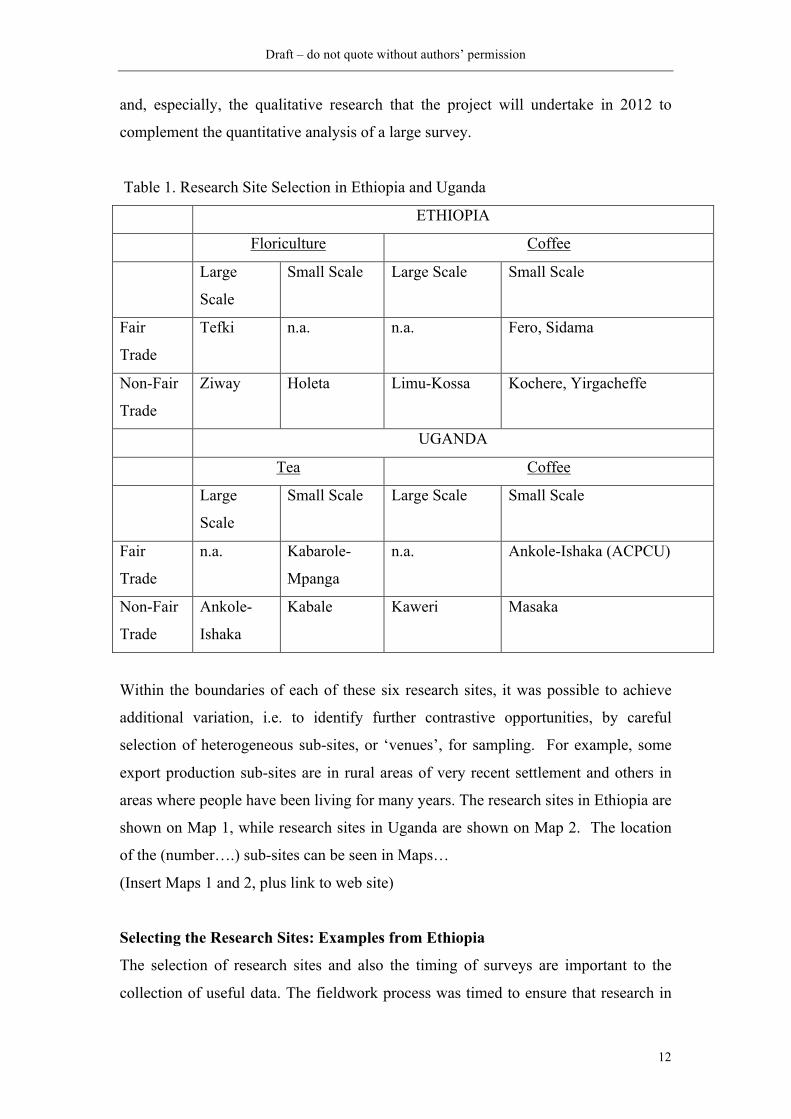
The contrastive objectives implied that it would be useful to identify several of the
most important agricultural commodity exporting research sites in each country.11
Table 1 indicates the degree to which the objective of studying certified and non-
certified production on large and small-scale farms could be combined in each
country.12 It can be seen that it was impossible to identify appropriate research sites to
complete all of the elements of the simple matrix in Table 1 because, for example,
there are no small-scale Fair Trade certified floricultural enterprises in Ethiopia and
no large-scale Fair Trade certified coffee estates in either country. This was one
reason for the selection of only 6 research sites in each country, although the
constraints imposed by the FTEPRP budget also limited the total number of research
sites that could be considered. There are clearly difficulties involved in this approach.
It may for example be difficult to attribute outcomes to certification as opposed to
scale. This will present challenges that may in part be addressed through the detail
11 An effort was particularly made to identify cases exemplifying the ‘best’ producing sites in terms of reputation for quality and dynamism in addition to other relatively ‘average’ sites, in order to achieve a more consistent contrastive exploration. 12 Large-scale farms are defined as enterprises employing at least 75 wageworkers; small-scale farms are defined as enterprises that are members of Fair Trade certified smallholder cooperatives, or as enterprises employing less than 75 workers.
Draft – do not quote without authors’ permission
12
and, especially, the qualitative research that the project will undertake in 2012 to
complement the quantitative analysis of a large survey.
Table 1. Research Site Selection in Ethiopia and Uganda
ETHIOPIA
Floriculture Coffee
Large
Scale
Small Scale Large Scale Small Scale
Fair
Trade
Tefki n.a. n.a. Fero, Sidama
Non-Fair
Trade
Ziway Holeta Limu-Kossa Kochere, Yirgacheffe
UGANDA
Tea Coffee
Large
Scale
Small Scale Large Scale Small Scale
Fair
Trade
n.a. Kabarole-
Mpanga
n.a. Ankole-Ishaka (ACPCU)
Non-Fair
Trade
Ankole-
Ishaka
Kabale Kaweri Masaka
Within the boundaries of each of these six research sites, it was possible to achieve
additional variation, i.e. to identify further contrastive opportunities, by careful
selection of heterogeneous sub-sites, or ‘venues’, for sampling. For example, some
export production sub-sites are in rural areas of very recent settlement and others in
areas where people have been living for many years. The research sites in Ethiopia are
shown on Map 1, while research sites in Uganda are shown on Map 2. The location
of the (number….) sub-sites can be seen in Maps…
(Insert Maps 1 and 2, plus link to web site)
Selecting the Research Sites: Examples from Ethiopia
The selection of research sites and also the timing of surveys are important to the
collection of useful data. The fieldwork process was timed to ensure that research in
Draft – do not quote without authors’ permission
13
coffee production sites coincided with the October-January peak in the Ethiopian
coffee harvest in 2010/11, and with periods of relatively strong labour demand for tea
and coffee production in Uganda.13 Venue-based sampling by epidemiologists
identifies days and times when the target population gathers at specific venues to
construct a sampling frame of venue, day-time units. However, the FTEPRP venues
(research sub-sites) are not strictly comparable to urban bars, for example.14 In rural
Africa, the target population of wageworkers may only work seasonally, but during
peak seasons many of the wageworkers actually live within the research site
continuously for several weeks, rather than visiting the ‘venue’ for a few hours on a
few days per month. Targeting during peak periods may also help capture ‘local’
casual labourers from neighbouring villages by scoping at the workplace and
identifying sub-sites within the broader ‘venue’ where daily casual workers come
from.
Provided that the schedule of fieldwork was planned to coincide with harvesting
periods of peak labour demand in coffee and the flush in tea, it was easy to create a
sampling frame by listing all the residential units (RUs) within selected research sub-
sites, as discussed in Section 3 below. The detail of selection of our sites in Ethiopia
is presented below, in order to illustrate some key themes.
Floriculture Research Sites
Only one of the 61 operational flower farms in Ethiopia (Golden Rose) is Fair Trade
certified. As Golden Rose has been described as ‘one of the most successful farms’ in
the floriculture sector (Gebreeyesus and Iizuka, 2010: 17), it was important to
investigate other farms that could provide contrasting evidence about non-Fair Trade
flower production. So it was decided to select a large-scale comparator that was also
widely regarded as extremely successful, but that aimed to achieve MPS15 rather than
13 Floricultural labour input demand is much less seasonal than the pattern of labour input demand for the other two crops, especially coffee. 14 The venue-based samples in the USA often attempt to reach stigmatized populations; it should be noted that female agricultural wage workers in Africa and elsewhere are also stigmatized – as sexually available to and promiscuous with male co-workers (Sender et al., 2006, Preibisch and Encalada Grez, 2010). 15 The MPS Socially Qualified certificate is awarded to growers whose products are cultivated under good working conditions. The MPS-GAP certificate can be obtained by growers that satisfy all the requirements of supermarket sales outlets (Flower Council of Holland, 2011).
Draft – do not quote without authors’ permission
14
Fair Trade certification. Sher-Ethiopia, located at Ziway, was selected as it is the
largest rose exporter from Ethiopia, employing more than 10,000 workers in the town
of Ziway alone.16 The third contrasting site would cover farms likely to be
representative of smaller-scale, non-certified flower producers. The area around
Holeta was chosen, including Menagesha Town and the nearby Ch’ri village. This
area is one of the three key floriculture agglomerations in Ethiopia (Mano et al.,
2010). Several farms in the immediate vicinity of this research site have had
difficulties servicing their debt;17 and repeated strikes by daily farm labour have also
been reported in this area (Assefa, 2009). Floricultural exports from the third site were
likely, therefore, to be having a different impact on wageworkers from the impact
found at Golden Rose or Sher-Ziway. Whether this contrast – if revealed to exist – is
influenced by the difference in certification or more by other factors would be one
question for the research.
Coffee Research Sites
Fair Trade certified arabica coffee, unlike flowers, is produced in very many areas of
Ethiopia, creating a much wider scope of potential research sites. Ethiopia has
trademarked three different coffees – Sidamo, Yirgacheffe and Harrar, produced in
different geographical zones (Rotstein and Christie, 2009, Arslan and Reicher, 2011),
while other areas of Ethiopia are recognized as producing distinctive and highly
priced specialty certified coffee, including Limu Coffee produced in Jimma Zone.
Among those involved in Fair Trade coffee production, the Oromia Coffee Farmers’
Cooperative Union (OCFCU) has grown particularly rapidly and in scoping for the
research OCFCU cooperatives were considered as potential research sites. OCFCU
was the first coffee producer to obtain Fair Trade certification – in 1999. A total of 28
of the Primary Cooperatives in OCFCU are now certified and they sell perhaps the
best-publicized Ethiopian Fair Trade coffee. The charismatic general manager of the
OCFCU (Tadesse Meskele) features prominently on the websites of the Fair Trade
Foundation and Oxfam America; he played a leading role in a frequently televised
and widely distributed film on Ethiopian coffee (Black Gold).
16 It is also a subsidiary of Sher Holland BV, the biggest rose producer in the world 17 The Development Bank of Ethiopia (DBE) has so far foreclosed on six out of the 42 flower farms to which it has made loans (Haddush, 2010).
Draft – do not quote without authors’ permission
15
Tadesse arranged visits in Yirgacheffe to the two most successful and well established
of the Fair Trade Certified Primary Cooperatives in the OCFCU. Both of these
cooperatives could have been selected as research sites for a study of the impact of
coffee exports on wage employment: it was immediately obvious that, in sharp
contrast to Fair Trade publicity, the certified ‘smallholder’ members used a great deal
of wage labour on their farms.18 However, these two sites had already been burdened
with visits from so many foreign celebrities, ethical coffee tourists and graduate
students that it would have been difficult to step outside the role of useful idiot to
conduct rigorous research.19
The Fero 1 Primary Cooperative Society, part of the Sidamo Coffee Farmers
Cooperative Union, was selected as the site to investigate Fair Trade certified
smallholder coffee production. It has been Fair Trade certified since 2003 and is
regarded by interview sources in Ethiopia as the best of the 39 certified Cooperative
Societies in the Union. There are several arguments in favour of this site: the
members of this Society (more than 700) include several relatively large farmers
(cultivating about 5 ha. of coffee) who generate a great deal of wage employment on
their farms and have received several prizes for the quality of the coffee they produce;
Starbucks has a direct relationship with this Society and purchases a significant
quantity of its output, providing researchers with an opportunity to study the
operations of one of the largest purchasers in the world market for coffee; the Fero 1
Cooperative operates its own processing factories and the site is near four large
private sector coffee processing plants, all generating substantial wage employment.
The site provides opportunities for research into the scale and employment impact of
cooperative members’ sales to the large-scale local private sector processing and
trading network, as well as to Fair Trade and Utz Kapeh certified cooperatives.
18 As it had been nearly ten years previously when one of the FTEPRP researchers visited one of the same cooperatives as part of a consultancy undertaken for the Ethiopian Ministry of Finance and Economic Development (MOFED). 19 The research team was taken to visit the same two flagship Primary Cooperatives (and to meet the same individual farmer) described on the web site of Cooperative Coffees, a Fair Trade Importing Cooperative (http://www.coopcoffees.com/what/trading-partners/oromia-ethiopia-1/oromia-ethiopia) and on several other websites promoting US-based ‘ethical’ coffee importers. On useful idiots and Potemkin Villages, see Doris Lessing, ‘I was taken around and shown things as a useful idiot’ (http://downloads.bbc.co.uk/podcasts/worldservice/docarchive/docarchive_20100804-0905a.mp3).
Draft – do not quote without authors’ permission
16
In choosing a site for non-Fair Trade certified smallholder coffee research site,
industry advice suggested the area of Kochere, where experts reported a smallholder
site consistently producing exceptionally high quality Yirgacheffe coffee. 20 Illycaffe
S.p.A. - perhaps the most important multinational company operating in ‘the quality-
intensive segment of the coffee value chain’ (Kaplinsky, 2007: 12) and supplying
over 50,000 public venues in 140 countries – is a consistent buyer of Ethiopian coffee
and has sourced over 80 per cent of its Ethiopian coffee from this area. Over a period
of about 15 years Illy has built up a relationship with a processor operating in the
Kochere area in an effort to ensure a supply of beans of consistent quality (Illycaffé,
2008). Illy claims to have improved the supply of precisely the type of beans they
need by encouraging this processor to pay a price directly to coffee farmers (not to
middlemen or to traders) that is up to 40 per cent higher than the prices offered by
other processors.21
A third research site, producing non-certified coffee on large-scale farms, could not
be found in the Yirgacheffe, Sidamo or Harrar areas, where there are no coffee
estates. However, industry experts helped the team to identify best-practice coffee
plantations22 (in both private and state ownership), producing very high quality coffee
in Limu Kossa woreda, near Jimma. The sites selected to examine the impact of large
scale and non-certified coffee production were in Limu-Kossa woreda, Northwest of
Jimma. Experts on coffee and representatives of coffee trading companies were able
to identify three contrasting types of high quality and large scale farms easily
accessible within this area. The Giday farm, which is Rainforest Alliance certified, is
one of the largest privately owned coffee farms in the country, producing on 400
relatively high yielding hectares and employing about 800 workers. Also in the area
are the Nigusie Lemma plantation (about 129 ha, of which 85 ha were in production
in 2009), where the first exports last year achieved accolades for high quality in
international competition (CoffeeShrub, 2010), and Kossa State Farm, which is not 20 This was the judgement of the President of the Ethiopian Coffee Exporters’ Association, the Head of the Green Coffee Department of Illycaffe, and the Ethiopia Country Director of the Neumann Kaffee Gruppe. 21 Interview with Alessio Colussi, Addis Ababa, February 2010. 22 Coffee is produced on a large scale by state-owned plantations and by a large and growing number of private estates in Ethiopia. Coffee estates are spread across 137 woredas, but the most well established estates are concentrated in the Oromia (Jimma) area.

Draft – do not quote without authors’ permission
17
only the largest of the 7 plantations owned by the Coffee Plantation Development
Enterprise (cultivating 1,451 ha, with about 2,700 workers), but achieves higher
coffee quality and yields per hectare than all the other farms in CPDE’s portfolio.
The selected plantations in the Limu-Kossa area employ very different amounts of
local, migrant, permanent and seasonal labour; they recruit and remunerate labour by
different methods and from a variety of locations, making this a very suitable area to
study the employment impact of coffee exporting. One of the producers selected,
Giday, is Rainforest Alliance certified, and this adds a level of variation and
comparison within this area.
In summary, the detailed selection of sites in Ethiopia is presented to show how a
contrastive exploration has been operationalized. The research strategy was always to
focus only on sites successfully producing high quality coffees that fetched
comparably high prices in export markets, while at the same time ensuring a mix of
Fair Trade certified, non-certified, and large farm production sites. As noted above,
the strategy was then to identify the ‘best’ within a given category to allow
comparisons with other ‘best’ cases, as well as with ‘average’ and/or smaller-scale in
the case of flowers. A similar strategy was followed in Uganda.23
SELECTING THE RESEARCH SUB-SITES AND SAMPLING
The FTEPRP aimed to interview individual respondents using a questionnaire to
collect data on many aspects of employment, living conditions and poverty. The
problem of how these respondents should be selected was solved through an
innovative approach to stratified random sampling within each of the research sites.
This approach succeeded in overcoming some of the obvious deficiencies of sampling
methods used in other research on Fair Trade and in many other rural surveys.
As argued above, almost all socioeconomic surveys in developing countries fail to
capture data on the most vulnerable, poorly educated casual and seasonal workers,
23 Details of site selection in Uganda, and an extended discussion of the FTEPRP methodology, can be found in ‘Methodological Issues’, FTEPRP Discussion Paper No.1 on the project website: www.ftepr.org
Draft – do not quote without authors’ permission
18
especially temporary migrant workers.24 One reason for this failure is that the most
influential of these surveys, the Living Standards Measurement–type household
surveys (LSMS) promoted and funded by the World Bank throughout the developing
world, rely on an a priori standardized, narrow and inappropriate definition of ‘the
household’ and its ‘residents’. So, in both Ethiopia and Uganda, the Rural Household
Surveys and the National Household Surveys fail to collect detailed information from
‘non-residents’ concerning migration episodes in search of wage employment.25
Important groups of vulnerable wageworkers, especially those engaged in seasonal,
casual and low-paid jobs outside major urban centres, are frequently not ‘resident’ in
‘households’. They live and work for long periods in hostels, labour camps, barracks,
construction sites and illegal squatter settlements, or they have been given some space
to sleep at their workplace during the harvest season, or while working as domestic
servants. These are the ‘nowhere people’, the uncounted flocks of footloose migrants
who ‘drift in and out of temporary worksites’ (Breman, 2010: 135). Such migrant
workers remit part of their wage earnings to other individuals and these remittances
are usually recorded in the LSMS Surveys covering the recipients’ households.
Unfortunately these wage earnings are not classified as wage income in the receiving
households, leading to a serious underestimate of the degree to which poor rural
households depend on income derived from wage employment.
Household surveys in Ethiopia and Uganda are based on samples drawn from lists of
rural households provided by village-level authorities. Officially maintained registers
of ‘households’ are often used as the basis for the distribution of scarce resources
such as food aid, or subsidized agricultural inputs and credit; rural elites are likely to
have good reasons for selective editing of the names appearing on lists of potential
24 At the other end of the scale, the largest and richest farmers in a rural area may also be excluded from lists of households or farm households, because their farms are not defined as being operated by ‘households’ (Choudhry, 2008: 11), or simply because surveys of households usually exclude the top end of the wealth/income distribution (Banerjee and Piketty, 2003: 4, Székely and Hilgert, 1999, Deaton, 2001). The domestic and farm servants living with and working for the rural rich are, therefore, also missing from rural household surveys. 25 Some implications of the failure to collect information on young, mobile rural people who are defined as ‘non-residents’ in conventional household surveys have been quantified using data from Burkina Faso – their exclusion has a major influence on assessments of rural living standards (Akresh and Edmonds, 2010). In Vietnam, assessments of rural and urban living standards have been shown to be unreliable for the same reasons (Pfau and Giang, 2008).
Draft – do not quote without authors’ permission
19
beneficiaries.26 Besides, fieldwork experience in these two countries, as well as
elsewhere in Africa, indicates that these lists are frequently unreliable because, apart
from excluding marginalized people who have encroached as squatters and all those
living in arrangements that do not correspond to standardized households, the lists are
not sufficiently up-to-date to include all newly arrived (or departed) residents.27 For
these reasons, the FTEPRP population frame was created on the basis of a new and
complete census of all types of housing structures discovered in the research sub-
sites, i.e. FTEPRP sampled from an up-to-date list of Residential Units rather than the
conventional list of arbitrarily defined ‘heads of households’. The process of listing
Residential Units is described in more detail below.
Sample Size, Stratification and Oversampling
The budget for fieldwork was one of the determinants of the overall sample size. It
was calculated that the first round quantitative survey could only afford to interview
approximately 750 individual respondents, equivalent to about 120 respondents per
site, in each country. Since comparisons between sites will be an extremely important
part of the FTEPRP analysis, there were good arguments for achieving a roughly
equal sample size in each site, also considering possible variation within sites
(Wilson et al., 2006: 357-8).
The random sample at each purposively chosen site was large enough to be
statistically representative of all adults (aged 14 years or older) resident in the
26 Ethnographic work in two villages in Northeast Ethiopia describes how local officials administering the Productive Safety Net Programme constructed lists of households so as to reserve the benefits of the programme for ‘the more affluent and economically potent households’, excluding ‘the poorest and chronically food-insecure households’, many of which depended on casual agricultural wage labour (Bishop and Hilhorst, 2010). 27 For example, fieldwork in Kabale District in Uganda compared the official list of households maintained by one LC1 Chairman with a careful FTEPRP village census. The Chairman’s list was found to be grossly inaccurate. There is evidence, insufficiently discussed in the relevant survey documentation, that lists of households at the kebelle level in Ethiopia, which are regularly used as rural sampling frames, are also unreliable. For example, a choice has to be made between alternative lists of households held by the kebelle Chairman, local Health Extension Workers or Development Agents; one or more of these lists may well have been amended by the survey team (IFPRI and EEPRI, n.d.). It has been admitted that not all villages sampled in the Ethiopian Rural Household Surveys had ‘good’ lists of registered households (Dercon and Hoddinott, 2009: 7). A quantitative survey in the Northeastern Highlands of Ethiopia, backed up by careful qualitative work, indicated that official kebelle lists usually excluded households that did not pay tax, as well as some single person households and people belonging to ‘socially marginalized groups’ (Sharp et al., 2003: 36).
Draft – do not quote without authors’ permission
20
research sub-site areas, as shown in Tables 2, 3, 4 and 5 and discussed below.
However, the total sample at each research site was also designed to over-sample
those adults whose experience has been neglected in previous surveys but was most
relevant to FTEPRP research, namely casual wageworkers producing the relevant
export crop. The design did not rely on an arbitrary definition of the ‘Household
Head’ in selecting the target respondents; and the lists from which the samples were
drawn were far more accurate and up-to-date than in most rural surveys.
In addition, the total sample at each research site was designed to ensure some
variation in the characteristics of respondents, mainly through the choice of sub-sites.
For example, in Ziway two distinctive sub-sites were selected, both of which contain
a large proportion of flower wageworkers. The first was an established part of Ziway
town, where most residents originated from Ziway or its immediate surroundings. The
other sub-site was a very new neighbourhood on the border of the rapidly growing
town. This is an area where most newly-arriving migrant workers settle, many of
them originating from the Southern Nations, Nationalities, and People’s Region
(SNNPR) of Ethiopia. Exclusively sampling in only one of the two would have
resulted in the virtual exclusion of either group of core respondents. By random
sampling in several contrasting, purposively selected sub-sites it was possible to
achieve much more heterogeneous samples – samples that included non-migrant and
food crop wageworkers, females, more highly paid and permanent wageworkers, etc.
The analysis could therefore be based on comparisons of data covering very different
types of local people, leading to a better understanding of the complexities of the
determinants of rural welfare.
During the fieldwork, sub-site selection and sampling proceeded in six distinct stages:
1. Several days of qualitative research and discussions with key informants
living in each research site provided sufficient information to identify sub-
sites (venues) where there was a relative concentration of Residential Units
(RUs) housing wageworkers.
2. A boundary was drawn around each research sub-site with the aid of
waypoints defined by the GPS Unit attached to a handheld computer (PDA).28
28 Epidemiologists have pioneered the use of these technologies for surveys in rural Africa; see for example Vanden Eng et al (2007). The FTEPRP benefited from advice and training in
Draft – do not quote without authors’ permission
21
In some cases the relevant boundaries were obvious, since a labour camp, for
instance, covered a small well-defined area, or a village containing
wageworkers as well as farmers was small and isolated from all other RUs. In
other cases, the size of the sub-site was determined by a rough estimate of the
total number of RUs required in that sub-site to achieve the target number of
randomly selected respondents. The research officer and a field supervisor
then made a complete enumeration (census) of all the RUs observed within the
sub-site boundaries defined in stage 2. An RU was defined as any structure in
which at least one person was sleeping. Special care was taken by these senior
and experienced members of the research team to record the precise GPS
location and to assign an identifier to all RUs, including non-conventional
RUs, e.g. temporary shacks and the doors of rented rooms where migrants
were sleeping. The complete census of a sub-site could be completed fairly
rapidly, since it involved walking up to the door of each RU and entering its
position on the PDA.29 Tables 2, 3, 4 and 5 show the number of RUs identified
in the census of each sub-site and the assumptions made to arrive at an
estimate of the total number of individual adults likely to be resident in the
sub-site. These assumptions were based on conversations with residents
during stage 1 and later, while undertaking the census.
3. Tables 2, 3, 4 and 5 also show the percentage of randomly selected RUs that
were subsequently revisited in order to compile an accurate and up-to-date list
(sampling frame) of adult potential respondents living in RUs in the research
sub-site. A high proportion of RUs - between 45 and 100 per cent of the total
number of RUs identified in the census - were randomly selected, using the
software installed on the PDA.30 Enumerators were then sent to each of the
the use of PDAs with GPS provided by Anja Terlouw and James Smedley of the Liverpool School of Tropical Medicine. 29 The census of RUs in rural Ethiopia and Uganda was much less problematic than similar exercises listing unregistered urban populations in China with the aid of PDAs; there it was necessary to take a great deal of time to enumerate thoroughly, ‘looking for doors behind doors’ (Treiman et al., 2005: 13). Depending on settlement density and topography, the FTERP research teams might enumerate between 80 and 150 RUs a day in rural settings, while in the more urban settlements of Ziway this could rise to more than 300 a day. 30 The software used for GPS navigation and the collection of GPS census data was CDC-GPS2, developed by a team of researchers at the Centre for Disease Control (freely available at http://ftp.cdc.gov/pub/gpscs/). The digital questionnaires were designed and programmed using ‘Syware Visual CE’ (http://www.syware.com/products/visual_ce.php). In some smallholder coffee research sub-sites in Uganda, all of the RUs identified in the census, as
Draft – do not quote without authors’ permission
22
randomly selected RUs (or to all of the RUs) to make contact with any willing
adult who had slept in the RU on the previous night. It was usually easy, with
the aid of the GPS device and the locations recorded in the census, for
enumerators to find these randomly selected RUs and a willing respondent.
The interviews were completed electronically, using a short questionnaire
installed on the PDA. On average, completing an interview and entering all
the basic data on the PDA required less than 15 minutes. Data on a very large
number of adults could then be uploaded onto spreadsheets by the research
officer, as the basis for the final random and stratified sample of respondents.
4. The research officer, in consultation with all the members of the research team
(by email or Skype), analysed on a spreadsheet the data uploaded to his laptop
computer from the electronic questionnaires. The key information used to
define strata for the final sample of adults concerned labour market
participation and migration. For example, adults could be classified into the
following strata: ‘never worked for wages’; ‘currently working for (a named
certified or non-certified export crop enterprise)’; ‘currently working for
wages for another farm’; ‘currently working for wages for an export crop
processing factory’; ‘recent migrant’.31 The size of the final stratified random
sample of adult respondents for each research sub-site is shown in Tables 2, 3,
4 and 5. It was easy to confirm that the final sample was representative of the
large population list of adults from which it was drawn – in the sense that the
gender, mean age and education of the sample respondents closely matched
the gender, mean age and education recorded in the population lists, as shown
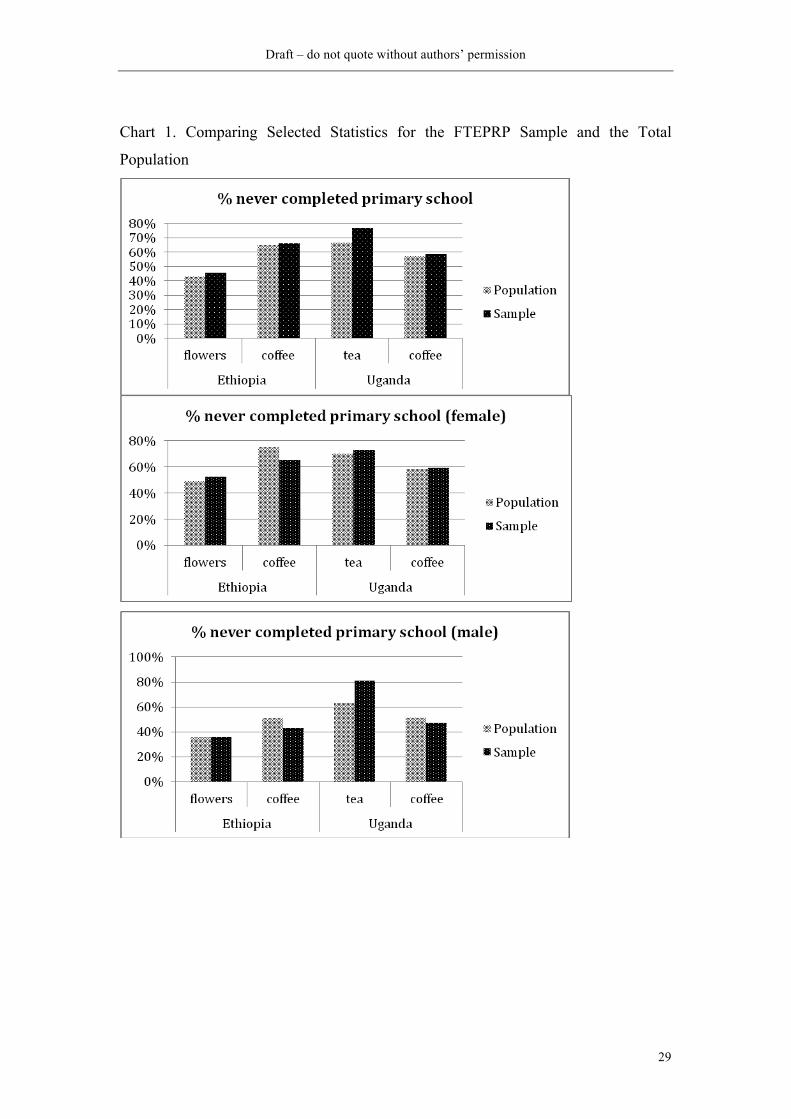
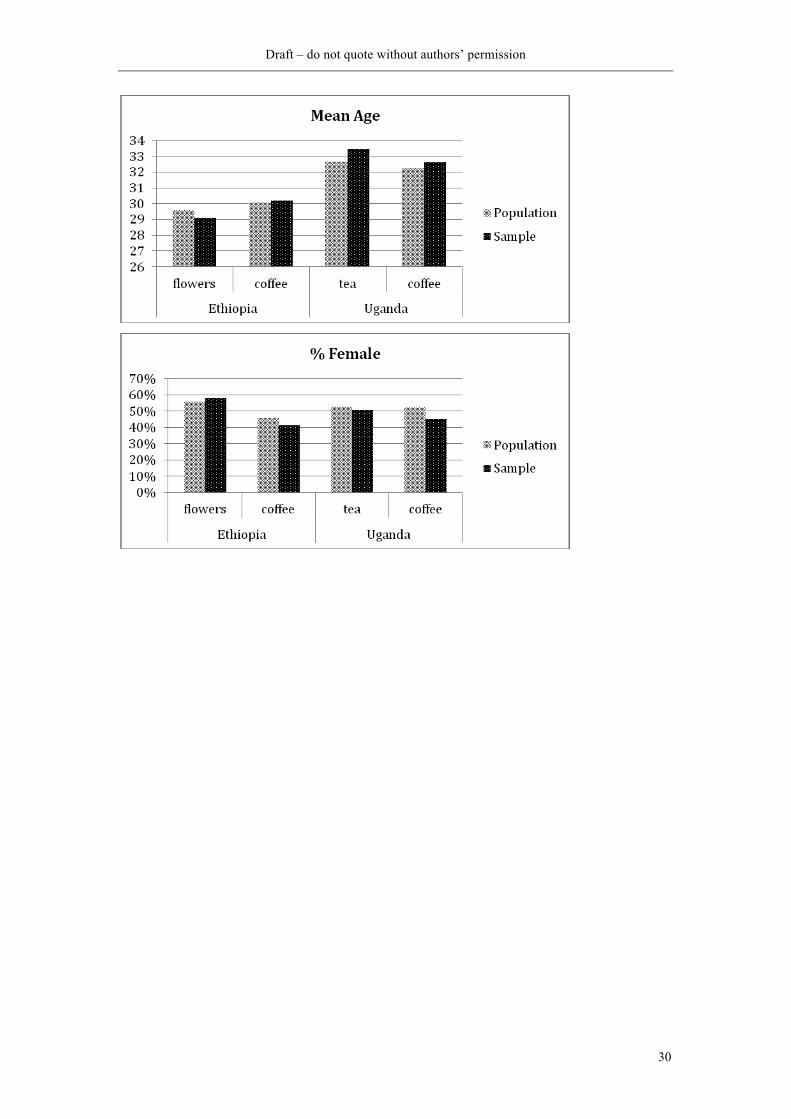
in Chart 1. This congruence was to be expected, since rather high percentages
of the individuals in all the strata on the population list were sampled; and an
even higher proportion (an oversample) of wageworkers had been drawn.
opposed to a random selection of RU’s, were re-visited to obtain the expanded sampling frame of individuals. This strategy was adopted in research sites where export crop wageworkers lived in scattered RUs interspersed with many other RUs containing no such workers. The aim was to ensure that the population list of individuals contained a sufficient number of the scattered wageworkers, so that a random sample drawn from the list of individuals was likely to capture both respondents with and without relevant labour market experience. 31 The list of possible classifications of respondents varied across research sites. The electronic questionnaire included additional questions for some research sites, reflecting the type of variation that FTEPRP hoped to achieve in the context of different crops and production contexts.
Draft – do not quote without authors’ permission
23
5. Enumerators were instructed to visit the respondents selected for the final
sample and they then completed a long, paper-based questionnaire that
provided information not only about the selected individual respondent, but
also about a large number of other individuals to whom the respondent was
‘economically linked’. The concept of a roster of ‘economically linked’
individuals replaces the more conventional concept of a ‘household roster’
(based on residential criteria), providing additional and extremely useful
information on labour market participation and the other characteristics of
individuals usually considered ‘absent’ and therefore irrelevant to an analysis
of the welfare of rural populations.32 The problems and associated ‘myths’
surrounding the use of conventional (residential) definitions of the ‘household’
in rural surveys in Africa have been subject to extensive debate and criticism
(Adato et al., 2007, Akresh and Edmonds, 2010, Guyer and Peters, 1987,
O'Laughlin, 1995). Despite widespread knowledge of the limitations of
traditional, simple residence coding rules for household membership, few
alternatives have been applied in large-scale surveys. There are challenges in
using a more realistic ‘economic household’ definition; but these are far
outweighed by the benefits of not missing relevant linked members and
therefore achieving a more solid basis for understanding individual and
household welfare.
6. Finally, GPS identifiers helped enumerators to locate the individuals selected
for the sample and to locate respondents randomly selected as substitutes by
the research officer in case the individual originally selected could not be
found or did not consent to the interview. On average the time gap between
compiling the sample frame and conducting the eventual interview was about
10-14 days. However, given the highly mobile nature of the target group, it
proved necessary to interview substitutes in 247 out of 1705 interviews (14.5
32 The definition was designed to include the four following categories of linked individuals: (1) those who live permanently with the principal respondent and who share income and expenditure; (2) those who, even if not sharing residence on a regular basis, make significant economic contributions (in cash or in kind) to the expenses of the household/respondent; (3) those who, even if not sharing residence, regularly depend on economic contributions in cash or in kind from the respondent or others in the RU; (4) those who, even if not resident at all in the same place as the respondent, either can be relied upon by the respondent, or receive contributions from the respondent.
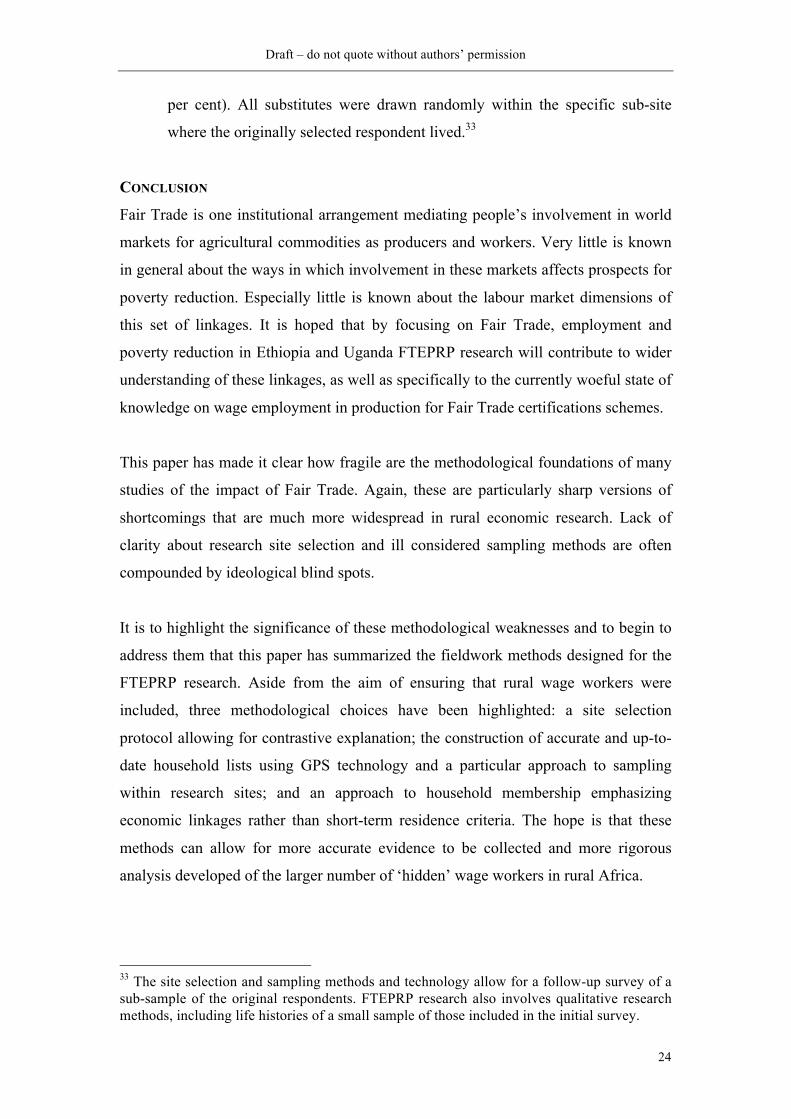
Draft – do not quote without authors’ permission
24
per cent). All substitutes were drawn randomly within the specific sub-site
where the originally selected respondent lived.33
CONCLUSION
Fair Trade is one institutional arrangement mediating people’s involvement in world
markets for agricultural commodities as producers and workers. Very little is known
in general about the ways in which involvement in these markets affects prospects for
poverty reduction. Especially little is known about the labour market dimensions of
this set of linkages. It is hoped that by focusing on Fair Trade, employment and
poverty reduction in Ethiopia and Uganda FTEPRP research will contribute to wider
understanding of these linkages, as well as specifically to the currently woeful state of
knowledge on wage employment in production for Fair Trade certifications schemes.
This paper has made it clear how fragile are the methodological foundations of many
studies of the impact of Fair Trade. Again, these are particularly sharp versions of
shortcomings that are much more widespread in rural economic research. Lack of
clarity about research site selection and ill considered sampling methods are often
compounded by ideological blind spots.
It is to highlight the significance of these methodological weaknesses and to begin to
address them that this paper has summarized the fieldwork methods designed for the
FTEPRP research. Aside from the aim of ensuring that rural wage workers were
included, three methodological choices have been highlighted: a site selection
protocol allowing for contrastive explanation; the construction of accurate and up-to-
date household lists using GPS technology and a particular approach to sampling
within research sites; and an approach to household membership emphasizing
economic linkages rather than short-term residence criteria. The hope is that these
methods can allow for more accurate evidence to be collected and more rigorous
analysis developed of the larger number of ‘hidden’ wage workers in rural Africa.
33 The site selection and sampling methods and technology allow for a follow-up survey of a sub-sample of the original respondents. FTEPRP research also involves qualitative research methods, including life histories of a small sample of those included in the initial survey.
Draft – do not quote without authors’ permission
25
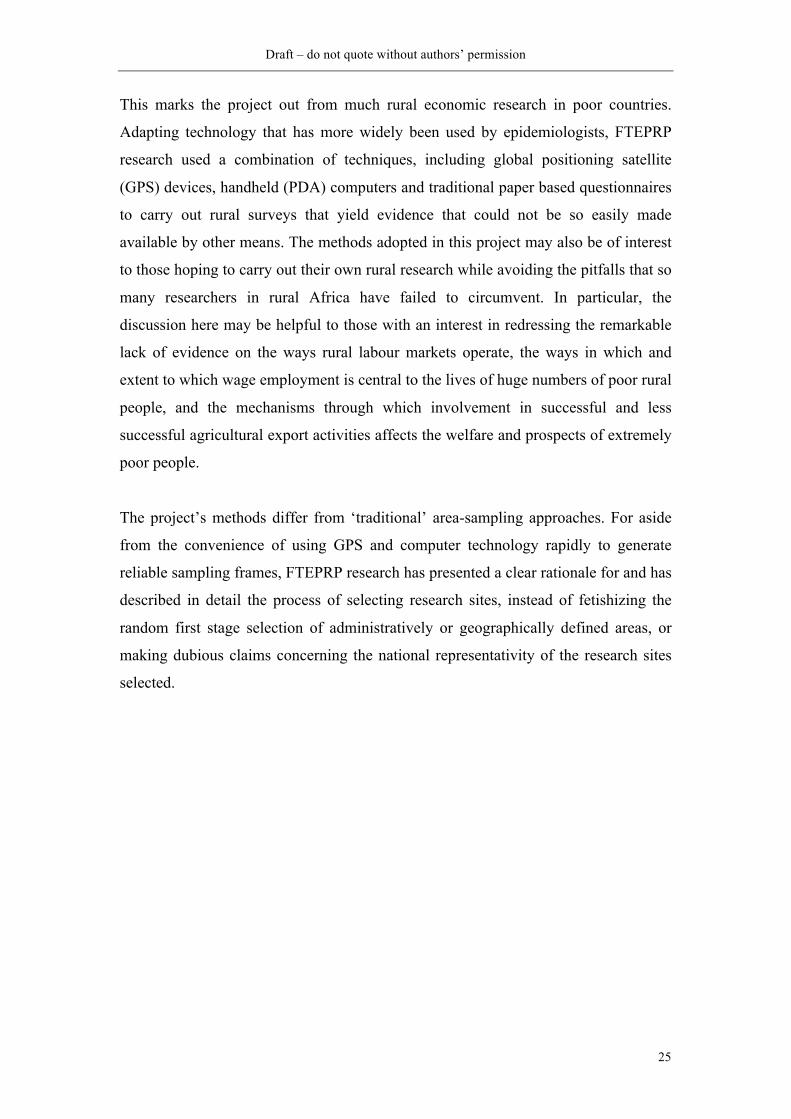
This marks the project out from much rural economic research in poor countries.
Adapting technology that has more widely been used by epidemiologists, FTEPRP
research used a combination of techniques, including global positioning satellite
(GPS) devices, handheld (PDA) computers and traditional paper based questionnaires
to carry out rural surveys that yield evidence that could not be so easily made
available by other means. The methods adopted in this project may also be of interest
to those hoping to carry out their own rural research while avoiding the pitfalls that so
many researchers in rural Africa have failed to circumvent. In particular, the
discussion here may be helpful to those with an interest in redressing the remarkable
lack of evidence on the ways rural labour markets operate, the ways in which and
extent to which wage employment is central to the lives of huge numbers of poor rural
people, and the mechanisms through which involvement in successful and less
successful agricultural export activities affects the welfare and prospects of extremely
poor people.
The project’s methods differ from ‘traditional’ area-sampling approaches. For aside
from the convenience of using GPS and computer technology rapidly to generate
reliable sampling frames, FTEPRP research has presented a clear rationale for and has
described in detail the process of selecting research sites, instead of fetishizing the
random first stage selection of administratively or geographically defined areas, or
making dubious claims concerning the national representativity of the research sites
selected.
Draft – do not quote without authors’ permission
26
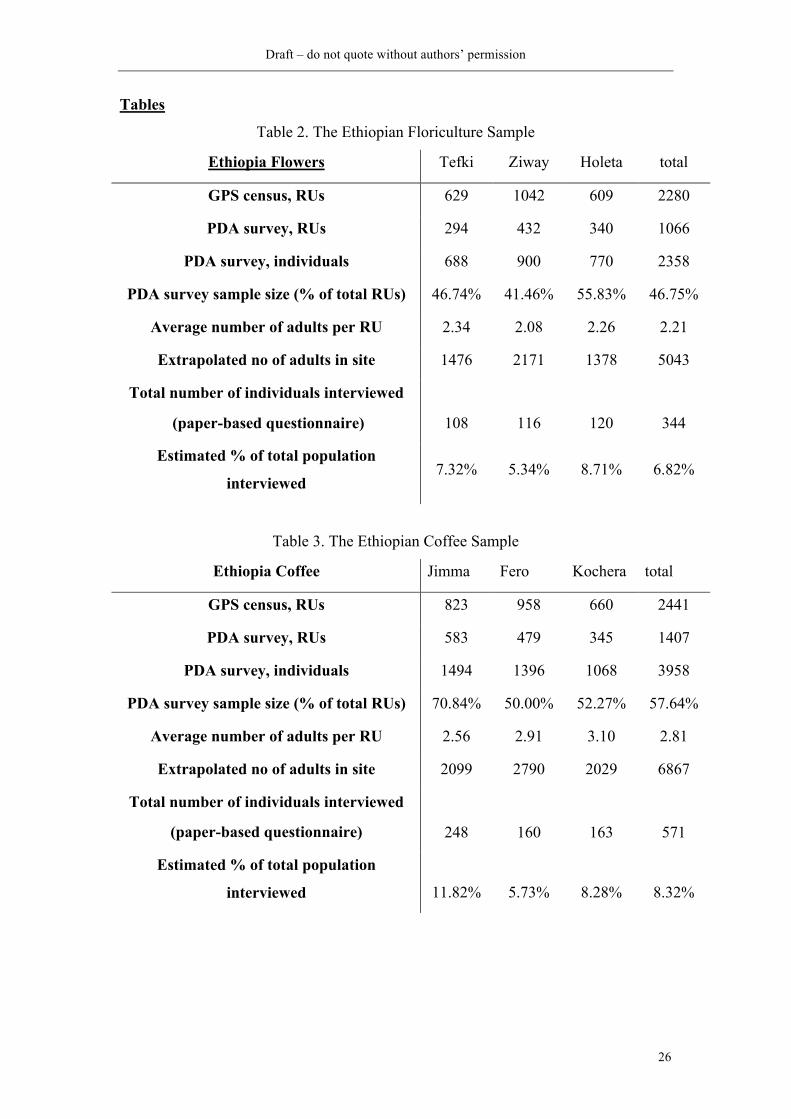
Tables
Table 2. The Ethiopian Floriculture Sample
Ethiopia Flowers Tefki Ziway Holeta total
GPS census, RUs 629 1042 609 2280
PDA survey, RUs 294 432 340 1066
PDA survey, individuals 688 900 770 2358
PDA survey sample size (% of total RUs) 46.74% 41.46% 55.83% 46.75%
Average number of adults per RU 2.34 2.08 2.26 2.21
Extrapolated no of adults in site 1476 2171 1378 5043
Total number of individuals interviewed
(paper-based questionnaire)
108
116
120
344
Estimated % of total population
interviewed 7.32% 5.34% 8.71% 6.82%
Table 3. The Ethiopian Coffee Sample
Ethiopia Coffee Jimma Fero Kochera total
GPS census, RUs 823 958 660 2441
PDA survey, RUs 583 479 345 1407
PDA survey, individuals 1494 1396 1068 3958
PDA survey sample size (% of total RUs) 70.84% 50.00% 52.27% 57.64%
Average number of adults per RU 2.56 2.91 3.10 2.81
Extrapolated no of adults in site 2099 2790 2029 6867
Total number of individuals interviewed
(paper-based questionnaire) 248 160 163 571
Estimated % of total population
interviewed 11.82% 5.73% 8.28% 8.32%
Draft – do not quote without authors’ permission
27
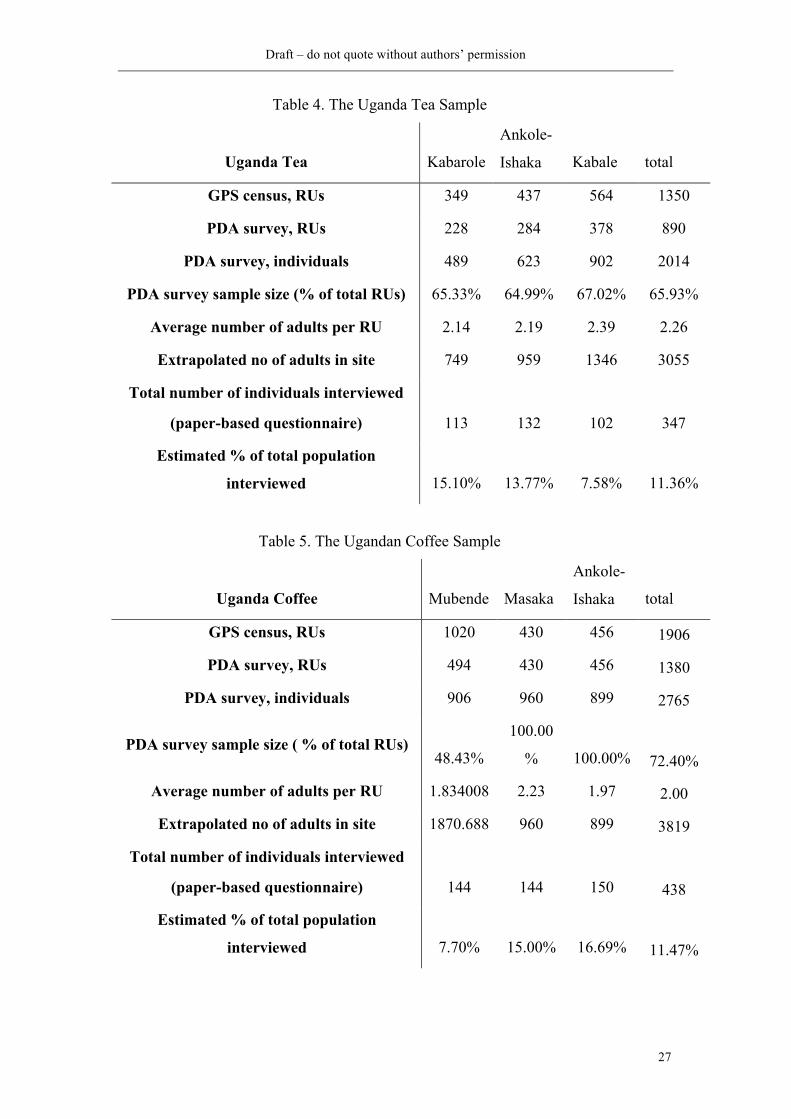
Table 4. The Uganda Tea Sample
Uganda Tea Kabarole
Ankole-
Ishaka Kabale total
GPS census, RUs 349 437 564 1350
PDA survey, RUs 228 284 378 890
PDA survey, individuals 489 623 902 2014
PDA survey sample size (% of total RUs) 65.33% 64.99% 67.02% 65.93%
Average number of adults per RU 2.14 2.19 2.39 2.26
Extrapolated no of adults in site 749 959 1346 3055
Total number of individuals interviewed
(paper-based questionnaire)
113
132
102
347
Estimated % of total population
interviewed 15.10% 13.77% 7.58% 11.36%
Table 5. The Ugandan Coffee Sample
Uganda Coffee Mubende Masaka
Ankole-
Ishaka total
GPS census, RUs 1020 430 456 1906
PDA survey, RUs 494 430 456 1380
PDA survey, individuals 906 960 899 2765
PDA survey sample size ( % of total RUs) 48.43%
100.00
% 100.00% 72.40%
Average number of adults per RU 1.834008 2.23 1.97 2.00
Extrapolated no of adults in site 1870.688 960 899 3819
Total number of individuals interviewed
(paper-based questionnaire) 144 144 150 438
Estimated % of total population
interviewed 7.70% 15.00% 16.69% 11.47%

Draft – do not quote without authors’ permission
28
Table 6. Summary of FTEPRP Sample Sizes
ET
flowers
ET
coffee UG tea
UG
coffee total
GPS census, RUs 2280 2441 1350 1906 7977
PDA survey, RUs 1066 1407 890 1380 4743
PDA survey, individuals 2358 3958 2014 2765 11095
PDA survey sample size (% of total
RUs) 46.75% 57.64% 65.93%
72.40% 59.46%
Average number of adults per RU 2.21 2.81 2.26 2.00 2.339237
Extrapolated no of adults in site 5043 6867 3055 3819 18660.09
Total number of individuals interviewed
(paper-based questionnaire)
335
571
347 438 1705
Estimated % of total population
interviewed 6.64% 8.32% 11.36%
11.47% 9.14%
Draft – do not quote without authors’ permission
29
Chart 1. Comparing Selected Statistics for the FTEPRP Sample and the Total
Population
Draft – do not quote without authors’ permission
30
Draft – do not quote without authors’ permission
31
References
Adato, M., F. Lund and P. Mhlongo (2007) 'Methodological Innovations in Research on the
Dynamics of Poverty: A Longitudinal Study in KwaZulu-Natal, South Africa', World
Development, 35(2): 247-263.
Akresh, R. and E. Edmonds (2010) 'The Analytical Returns to Measuring a Detailed
Household Roster'. The Institute for the Study of Labor (IZA), Discussion Paper No.
4759.
Amsden, A. (2011), ‘Say’s Law, Poverty Persistence, and Employment Neglect’, Journal of
Human Development and Capabilities, 11 (1): 57-66.
Arslan, A. and C. P. Reicher (2011) 'The Effects of the Coffee Trademarking Initiative and
Starbucks Publicity on Export Prices of Ethiopian Coffee', Journal of African
Economies, 20(5): 704-736.
Assefa, A. (2009) 'Ethiopia - Ten flower farms receive warnings', Washington, D.C.,
http://nazret.com/blog/index.php/2009/03/08/ethiopia_ten_flower_farms_receive_war
nin (accessed on 13 November 2011).
Banerjee, A. and T. Piketty (2003) Top Indian Incomes, 1956-2000, Cambridge, MA.
Banerjee, A. V. and E. Duflo (2011) Poor economics: a radical rethinking of the way to fight
global poverty, New York: PublicAffairs.
Barrientos, S., J. Anarfi, N. Lamhauge, A. Castaldo and A. Akua, N. Akua (2009) 'Social
Protection for Migrant Labour In the Ghanaian Pineapple Sector'. Development
Research Centre on Migration, Globalisation and Poverty.
Barrientos, S. and S. Smith (2006) The ETI Code of Labour Practice: Do Workers Really
Benefit?, Brighton.
Bevan, P. (2009) 'Methodological Approach and Fieldwork Plan'. Mokoro Limited, Oxford.
Bishop, C. and D. Hilhorst (2010) 'From food aid to food security: the case of the Safety Net
policy in Ethiopia', Journal of Modern African Studies, 48(2): 181-202.
Breman, J. (2010) 'A Poor Deal', Indian Journal of Human Development, 4(1): 133-142.
Choudhry, G. H. (2008) Consultancy Report on The World Bank Mission to Uganda For
Developing a Sample Design for the Uganda Agriculture Census and Surveys,
Washington, DC.
CoffeeShrub (2010) 'Ethiopia Dry Process Jimma - Nigusie Lemma',
http://www.coffeeshrub.com/shrub/coffee/ethiopia-dry-process-jimma-nigusie-lemma
(accessed on 13 November 2011).
Draft – do not quote without authors’ permission
32
CSA, C. S. A. (2006) 'Atlas of the Ethiopian Rural Economy'. Central Statistical Agency
(CSA), Addis Ababa with International Food Policy Research Institute, Washington,
DC, USA Ethiopia.
Deaton, A. (2001) 'Counting the world’s poor: problems and possible solutions', The World
Bank Research Observer 16(2): 125-147.
Deaton, A. (2010) 'Instruments, Randomization, and Learning about Development', Journal
of Economic Literature, 48(2): 424-455.
Dercon, S. and J. Hoddinott (2009) 'The Ethiopian Rural Household Surveys 1989-2004:
Introduction'. Department of Economics, University of Oxford and International Food
Policy Research Institute, Washington DC.
Ewert, J., A. Martin and V. Nelson (2005) 'Assessment of The Social Impact of Adoption of
Codes of Practice in The South African Wine Industry'. Natural Resources Institute
and DFID.
Flower Council of Holland (2011) 'MPS certification of sustainably cultivated flowers and
plants', Leiden, http://www2.flowercouncil.org/int/dynamic/news.asp?id=tcm:75-
159912 (accessed on 13 November 2011).
Gebreeyesus, M. and M. Iizuka (2010) 'Discovery of the flower industry in Ethiopia:
experimentation and coordination'. United Nations University - Maastricht Economic
and social Research and training centre on Innovation and Technology.
George, A. L. and A. Bennett (2005) Case studies and theory development in the social
sciences, Cambridge, Mass.; London: MIT Press.
Gonzalez, A. M. R. (2010) 'Estudio Sobre La Cadena De Valor Del Café Ugandés De
Comercio Justo: Análisis de la cadena de valor del café Robusta de Uganda de
Comercio Justo y su impacto en los Medios de Vida de los productores ugandeses'.
Intermón Oxfam.
Griffiths, P. (2010) Rejoinder: Misrepresentation and Distortion in Defending Fairtrade,
http://www.griffithsspeaker.com/Fairtrade/Rejoinder%2026%20Jun%202010%20fina
l.doc (accessed on 13 November 2011).
Guyer, J. I. and P. E. Peters (1987) 'Introduction', Development and Change, 18(2): 197-214.
Haddush, Z. (2010) 'Dev’t Bank Short on Bids for Flower Farms', Addis Fortune, 11(537),
http://www.addisfortune.com/Vol%2010%20No%20537%20Archive/Dev%E2%80%
99t%20Bank%20Short%20on%20Bids%20for%20Flower%20Farms.htm (accessed
on 14 November 2011).
Hill, R. V. (2010) 'Liberalisation and producer price risk: examining subjective expectations
in the Ugandan coffee market', Journal of African Economies, 19(4): 433.
Draft – do not quote without authors’ permission
33
IFPRI, I. F. P. R. I. and E. E. P. R. I. EEPRI (n.d.) Making Rural Services Work for the Poor
and Women: Local Public Investments in Agricultural and Water Services in
Ethiopia, Addis Abeba.
Illycaffé (2008) 'The Legesse Family', Trieste,
http://www.illy.com/wps/wcm/connect/us/illy/about-
illy/sustainability/testimonials/The-legesse-family/ (accessed on 13 November 2011).
International Initiative for Impact Evaluation (2010) Fair and square: better market share,
more benefits through Fairtrade, New Delhi.
International Trade Centre (2011) The impacts of private standards on producers in
developing countries, Geneva.
Kaplinsky, R. (2007) 'Capacity-Building in SSA: What Difference Do the Asian Drivers
Make?'. UNCTAD, Palais des Nations, Geneva, Meeting of Experts on, Technology
and Competitiveness.
Krishna, A., D. Lumonya, M. Markiewicz, F. Mugumya, A. Kafuko and J. Wegoye (2006)
'Escaping poverty and becoming poor in 36 villages of Central and Western Uganda',
The Journal of Development Studies, 42(2): 346-370.
Kumar, N. and A. R. Quisumbing (2010) 'Policy Reform towards Gender Equality in
Ethiopia: Little by Little the Egg Begins to Walk'. International Food Policy Research
Institute, Wasgington DC.
Landry, P. F. and M. Shen (2005) 'Reaching Migrants in Survey Research: The Use of the
Global Positioning System to Reduce Coverage Bias in China', Political Analysis,
13(1): 1-22.
Laroche, K. and B. Guittard (2009) 'The impact of Fairtrade labelling on small-scale
producers: Conclusions of the first studies'. Max Havelaar France.
Lawson, T. (2003) Reorienting economics: Economics as Social Theory, London: Routledge.
Lawson, T. (2004) 'Modern Economics: A Problem and a Solution', in Edward, F. (ed) A
guide to what's wrong with economics, pp. 21-32. London, Anthem Press.
Leuchtford, P., G. De Neve and D. Wood (2008) 'The hands that pick fair trade coffee:
Beyond the charms of the family farm', in Leuchtford, P., De Neve, G., Wood, D. and
Pratt, J. (eds) Hidden Hands in the Market: Ethnographies of Fair Trade, Ethical
Consumption, and Corporate Social Responsibility, pp. 143-169. Bingley, Emerald
Group Publishing Ltd. .
Livelihoods Integration Unit (LIU) (2011) 'Livelihoods analysis', Addis Abeba,
http://www.dppc.gov.et/Livelihoods/livelihoodhome.html (accessed on 13 November
2011).
Maertens, M., L. Colen and J. F. M. Swinnen (2011) 'Globalisation and poverty in Senegal: a
worst case scenario?', European Review of Agricultural Economics, 38(1): 31-54.
Draft – do not quote without authors’ permission
34
Maertens, M. and J. F. M. Swinnen (2011) 'Gender and Modern Supply Chains in Developing
Countries'. Katholieke Universiteit Leuven, Belgium (mimeo).
Mano, Y., T. Yamano, A. Suzuki and T. Matsumoto (2010) 'Local and Personal Networks in
Employment and the Development of Labor Markets: Evidence from the Cut Flower
Industry in Ethiopia'. National Graduate Institute for Policy Studies, Tokyo.
Muhib, F., B., L. Lin, S., A. N. Stueve, N., R. Miller, L., W. Ford, L., W. Johnson, D. and P.
Smith, J. G. (2001) 'A venue-based method for sampling hard-to-reach populations',
Public Health Report, 116 (Suppl 1): 216-222.
Nelson, V. and B. Pound (2009) 'The Last Ten Years: A Comprehensive Review of the
Literature on the Impact of Fairtrade'. Fairtrade Foundation.
O'Laughlin, B. (1995) 'The Myth of the African Family in the World of Development', in
Bryceson, D. F. (ed) Women Wielding the Hoe: Lesson from Rural Africa for
Feminist Theory and Development Practice. Oxford, Berg Publishers.
Omosa, M., M. Kimani and R. Njiru (2006) 'The Social Impact of Codes of Practice in the
Cut Flower Industry in Kenya'. Natural Resources Institute and DFID.
Outes-Leon, I. and A. Sanchez (2008) 'An Assessment of the Young Lives Sampling
Approach in Ethiopia'. Young Lives Technical Note No. 1.
Pfau, W. D. and L. T. Giang (2008) Groups Excluded from ‘Representative’Household
Surveys: An Analysis Based on Remittances Sent and Received in Vietnam, Tokyo.
Pincus, J. and J. Sender (2008) 'Quantifying Poverty in Viet Nam: Who Counts?', Journal of
Vietnamese Studies, 3(1): 108-150.
Pound, B. and A. Phiri (2009) 'Longitudinal Impact Assessment Study of Fairtrade Certified
Tea Producers and Workers in Malawi'. Natural Resources Institute and Fairtrade
Foundation.
Preibisch, K., L. and E. G. Encalada Grez (2010) 'The Other Side of el Otro Lado: Mexican
Migrant Women and Labor Flexibility in Canadian Agriculture', pp. 28. Chicago, IL,
USA, University of Chicago Press.
Riisgaard, L., G. Michuki, P. Gibbon, S. Bolwig, N. Warring and L. L. Rantz (2009) 'The
Performance of Voluntary Standard Schemes from the Perspective of Small
Producers in East Africa'. Danish Institute for International Studies for Traidcraft
(UK).
Rizzo, M. (2011) Rural wage employment in Rwanda and Ethiopia: A review of the current
policy neglect and a framework to begin addressing it, Geneva.
Rotstein, F. and A. F. Christie (2009) 'Sidamo: A Teaching Case for WIPO'. Intellectual
Property Research Institute, Melbourne Law School of Australia.
Ruben, R., R. Fort and G. Zuniga (n.d.) 'Fair Trade programme evaluation: Impact
Assessment of Fair Trade Programsfor Coffee and Bananas in Peru, Costa Rica and
Draft – do not quote without authors’ permission
35
Ghana'. Centre for International Development Issues Nijmegen, Radboud University
Nijmegen, The Netherlands.
Sender, J., C. Cramer and C. Oya (2005) 'Unequal Prospects: Disparities in the Quantity and
Quality of Labour Supply in sub-Saharan Africa'. World Bank.
Sender, J., C. Oya and C. Cramer (2006) 'Women Working for Wages: Putting Flesh on the
Bones of a Rural Labour Market Survey in Mozambique', Journal of Southern
African Studies, 32(2): 313-333.
Sender, J. and E. von Uexkull (2009) A Rapid Impact Assessment of the Global Economic
Crisis on Uganda: ILO, Geneva.
Sharp, K., S. Devereux and Y. Amare (2003) 'Destitution in Ethiopia’s Northeastern
Highlands (Amhara National Regional State), Final Report'. Institute of Development
Studies and SC-UK Ethiopia.
Smith, S. (2010) 'Fairtrade Bananas: A Global Assessment of Impact'. Institute of
Development Studies, University of Sussex, UK.
Ssekiboobo, A. M. (2008) 'Practical Problems in the Estimation of Performance Indicators for
the Agricultural Sector in Uganda'. Institute of Statistics and Applied Economics,
Department of Planning and Applied Statistics, Makerere University Kampala.
Székely, M. and M. Hilgert (1999) What’s behind the inequality we measure? An
investigation using Latin American data, Washington, DC.
The Livelihoods Integration Unit (2010) An Atlas of Ethiopian Livelihoods, Addis Abeba,
http://www.feg-consulting.com/what/services/early_warning/livelihood-integration-
unit-liu/liu-atlas/complete-atlas/Atlas%20Final%20Web%20Version%206_14.pdf
(accessed on 15 November 2011).
Treiman, D. J., W. M. Mason, Y. Lu, Y. Pan, Y. Qi and S. Song (2005) 'Observations on the
design and implementation of sample surveys in China', Los Angeles, CA: California
Center for Population Research Working Papers Series CCPR-006-05.
Vaessen, J. (2010) Challenges in impact evaluation of development interventions:
opportunities and limitations for randomized experiments, Antwerpen.
Valkila, J. and A. Nygren (2009) 'Impacts of Fair Trade certification on coffee farmers,
cooperatives, and laborers in Nicaragua', Agriculture and Human Values, 27(3): 321-
333.
Vanden Eng, J. L., A. Wolkon, A. S. Frolov, D. J. Terlouw, M. J. Eliades, K. Morgah, V.
Takpa, A. Dare, Y. K. Sodahlon, Y. Doumanou, W. A. Hawley and A. W. Hightower
(2007) 'Use of handheld computers with global positioning systems for probability
sampling and data entry in household surveys', The American Journal of Tropical
Medicine and Hygiene, 77(2): 393-399.
Draft – do not quote without authors’ permission
36
Vermund, S. H., S. L. Hodder, J. E. Justman, B. A. Koblin, T. D. Mastro, K. H. Mayer, D. P.
Wheeler and W. M. E. Sadr (2010) 'Addressing Research Priorities for Prevention of
HIV Infection in the United States', Clinical Infectious Diseases, 50(Supplement 3):
S149-S155.
Wilson, I., S. Huttly and B. Fenn (2006) 'A Case Study of Sample Design for Longitudinal
Research: Young Lives', International Journal of Social Research Methodology,
9(5): 351-365.
Wuyts, M. (2011), ‘Growth, Employment and the Productivity-Wage Gap: Revisiting the
Growth-Poverty Nexus’, Development and Change, 42 (1): 437-447.