probabilistic risk assessment & management
TRANSCRIPT
PROBABILISTIC RISK ASSESSMENT PROBABILISTIC RISK ASSESSMENT & MANAGEMENT & MANAGEMENT
TOOLS, TECHNIQUES AND TOOLS, TECHNIQUES AND APPLICATIONSAPPLICATIONS
Probabilistic Risk Assessment & Management © M. Modarres, M. Azarkhail, 20072
LECTURE OUTLINELECTURE OUTLINE
1. Basic Definitions2. Risk Assessment
Categories of Risk AnalysisTypes of Risk AssessmentElements of Risk AssessmentProbabilistic Risk AssessmentStrength of PRA
3. Risk managementCost-Benefit AnalysisDecision Making Techniques Using Risk Information
Probabilistic Risk Assessment & Management © M. Modarres, M. Azarkhail, 20073
Consequences of human or natural actions result in losses and gains.
Risk implies something unwanted or to be avoided.
One takes risk for possible gains.
Questions: "does the gain outweighs the risk"?
If we only associate risk with losses (not gains) then one can say that we are risk averse, i.e., we only control and reduce our risks (Note that actions taken to reduce a risk can be considered gain in the sense that possible losses are reduced.)
Risk has two components
(1) Unwanted consequence (or loss) expressed in magnitude
(2) Uncertainty in the occurrence of that loss (expressed in probability or frequency)
DEFINITION OF RISKDEFINITION OF RISK

Probabilistic Risk Assessment & Management © M. Modarres, M. Azarkhail, 20074
Risk is a measure of the • potential loss occurred due to natural or human activities. • Potential losses are the adverse consequences of such activities in form of
loss of human life, adverse health effects, loss of property, and damage to the natural environment.
Risk analysis is the process of • characterizing, • managing and • informing others about existence, nature, magnitude, prevalence,
contributing factors, and uncertainties of the potential losses.From an engineering point of view, the risk or potential loss is associated with exposure of the recipients to hazards, and can be expressed as a combination of the probability or frequency
• the loss may be external to the system, caused by the system to one or more recipients (e.g., human, organization, economic assets, and environment).
• Also the loss may be internal to the system, only damaging the system itself. An engineering system is defined as an entity composed of hardware, software and human organization.
DEFINITION OF RISKDEFINITION OF RISK
Probabilistic Risk Assessment & Management © M. Modarres, M. Azarkhail, 20075
DEMAND FOR RISK ANALYSISDEMAND FOR RISK ANALYSIS
Morgan argue that we worry more about risk today exactly because we have more to lose and we have more disposable income to spend on risk reduction.
A mechanism to control and avert risk has been to regulate manufacturing, operation and construction of complex systems.
The conventional view of safety risk regulation is that the existence of risks is undesirable and, with appropriate technological interventions, we can eliminate those risks. However, this perspective does not recognize the risk reduction costs involved; the fact that a no-risk society would be so costly and infeasible.
Risk analysis and especially Probabilistic Risk Assessment (PRA) can play pivotal roles in making design, manufacturing, operation, policy and regulatory decisions. Progress in the field of risk analysis and especially in PRA has been enormous.
Probabilistic Risk Assessment & Management © M. Modarres, M. Azarkhail, 20076
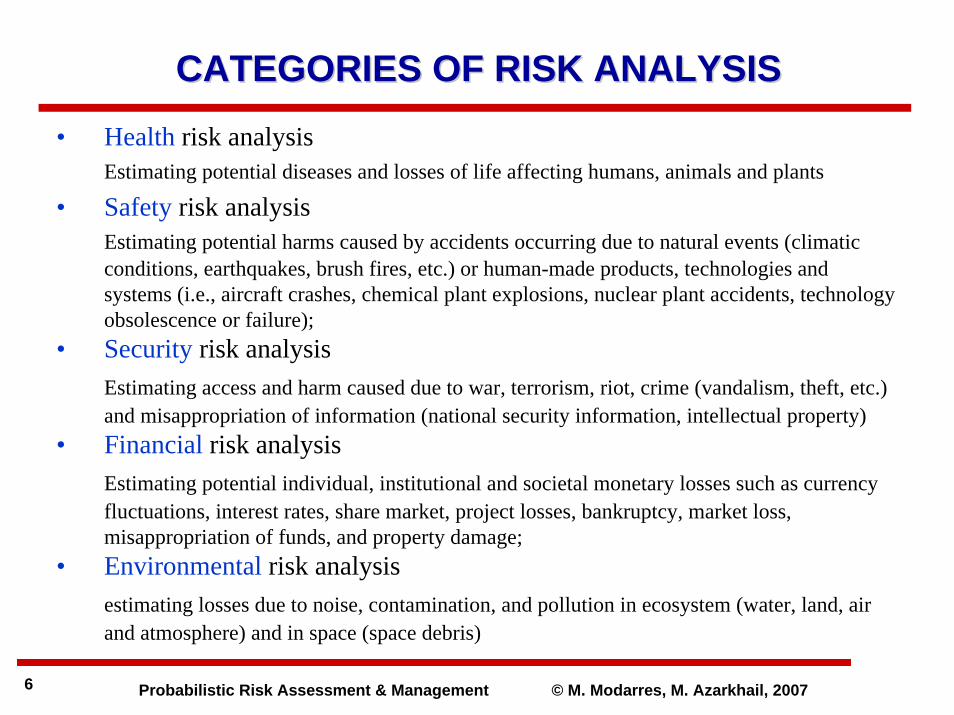
CATEGORIES OF RISK ANALYSISCATEGORIES OF RISK ANALYSIS• Health risk analysis
Estimating potential diseases and losses of life affecting humans, animals and plants
• Safety risk analysisEstimating potential harms caused by accidents occurring due to natural events (climatic conditions, earthquakes, brush fires, etc.) or human-made products, technologies and systems (i.e., aircraft crashes, chemical plant explosions, nuclear plant accidents, technology obsolescence or failure);
• Security risk analysisEstimating access and harm caused due to war, terrorism, riot, crime (vandalism, theft, etc.) and misappropriation of information (national security information, intellectual property)
• Financial risk analysisEstimating potential individual, institutional and societal monetary losses such as currency fluctuations, interest rates, share market, project losses, bankruptcy, market loss, misappropriation of funds, and property damage;
• Environmental risk analysisestimating losses due to noise, contamination, and pollution in ecosystem (water, land, air and atmosphere) and in space (space debris)
Probabilistic Risk Assessment & Management © M. Modarres, M. Azarkhail, 20077
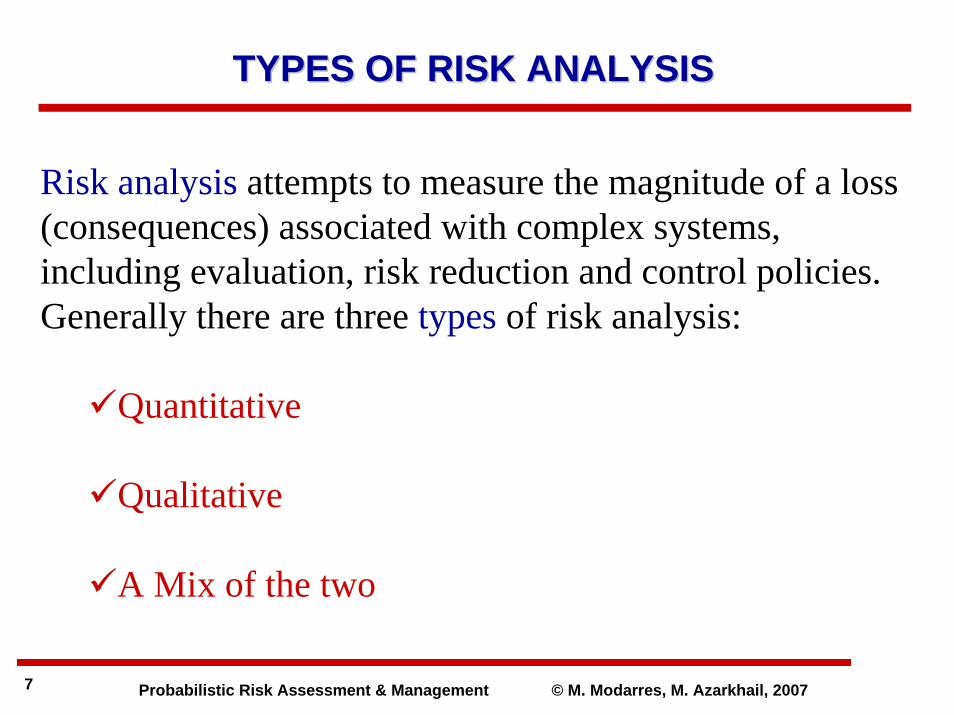
Risk analysis attempts to measure the magnitude of a loss (consequences) associated with complex systems, including evaluation, risk reduction and control policies. Generally there are three types of risk analysis:
Quantitative
Qualitative
A Mix of the two
TYPES OF RISK ANALYSISTYPES OF RISK ANALYSIS
Probabilistic Risk Assessment & Management © M. Modarres, M. Azarkhail, 20078
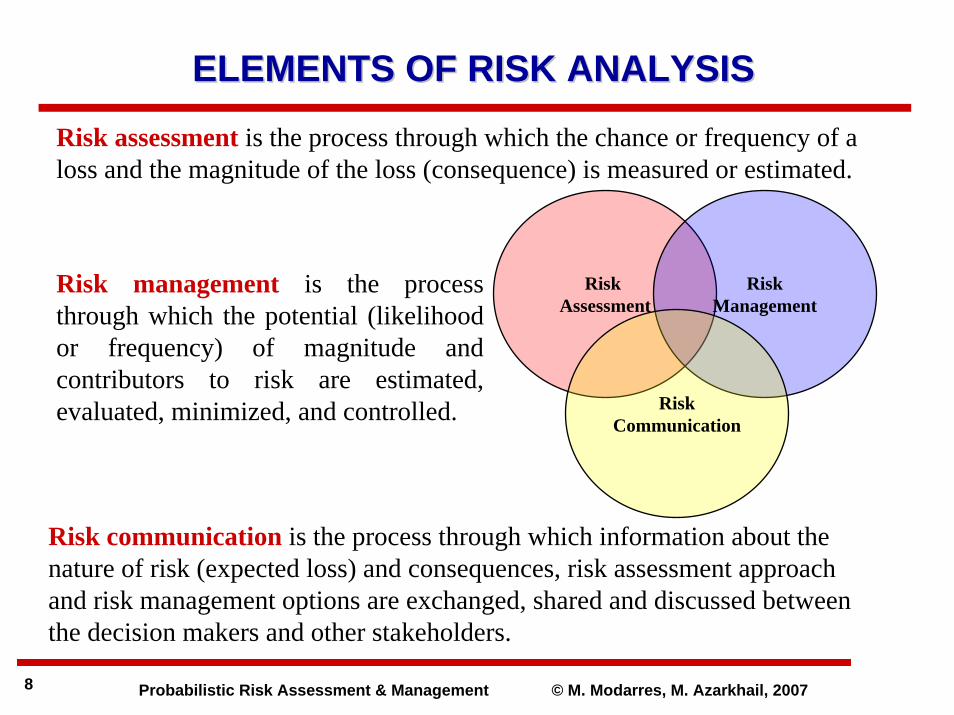
Risk management is the process through which the potential (likelihood or frequency) of magnitude and contributors to risk are estimated, evaluated, minimized, and controlled.
ELEMENTS OF RISK ANALYSISELEMENTS OF RISK ANALYSIS
Risk assessment is the process through which the chance or frequency of a loss and the magnitude of the loss (consequence) is measured or estimated.
Risk communication is the process through which information about the nature of risk (expected loss) and consequences, risk assessment approach and risk management options are exchanged, shared and discussed between the decision makers and other stakeholders.
Risk Assessment
RiskManagement
RiskCommunication

Probabilistic Risk Assessment & Management © M. Modarres, M. Azarkhail, 20079
Risk assessment is the process of providing answer to four basic questions:
1. What can go wrong?2. How likely is it?3. What are the losses (consequences)?
Answering these questions could be simple or require a significant amount of analysis and modeling.
RISK ASSESSMENTRISK ASSESSMENT

Probabilistic Risk Assessment & Management © M. Modarres, M. Azarkhail, 200710
R = RISK = {⟨ S1, l1, X1 ⟩}Risk "is" a set of triplets
Answers to:
(1) What can go wrong?(2) What is the likelihood?(3) What is the damage (loss or consequence)?
Scenario Likelihood Damage
S1S2S3...SN
l1l2l3...lN
X1X2X3...XN
QUANTITATIVE DEFINITION OF RISKQUANTITATIVE DEFINITION OF RISK
Probabilistic Risk Assessment & Management © M. Modarres, M. Azarkhail, 200711
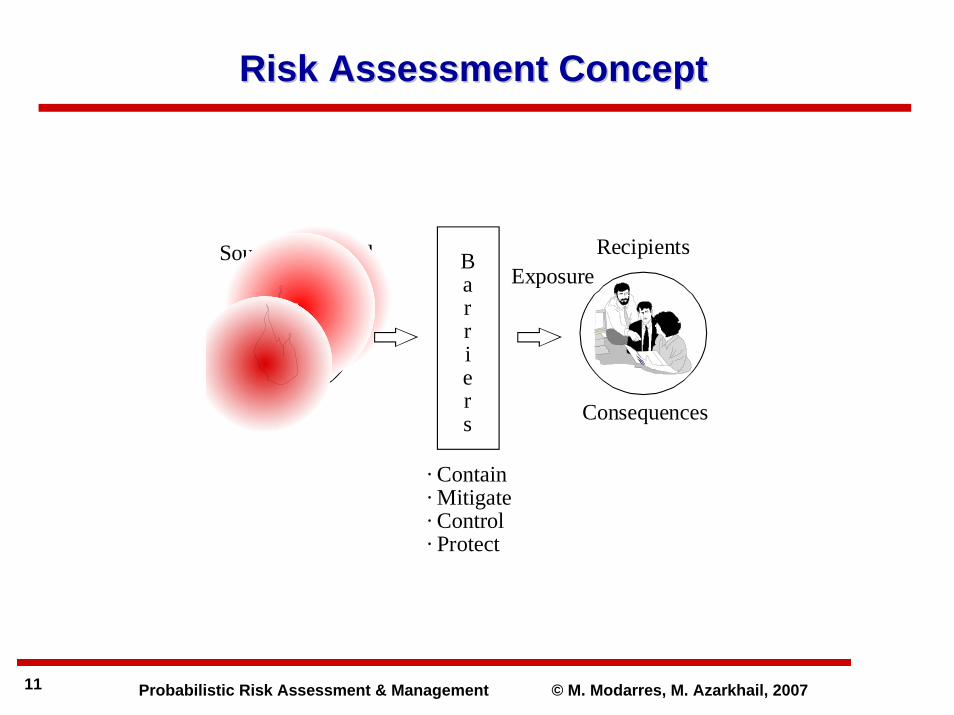
Recipients
Consequences
· Contain· Mitigate· Control· Protect
Source of Hazard Barriers
Exposure
Risk Assessment ConceptRisk Assessment Concept
Probabilistic Risk Assessment & Management © M. Modarres, M. Azarkhail, 200712
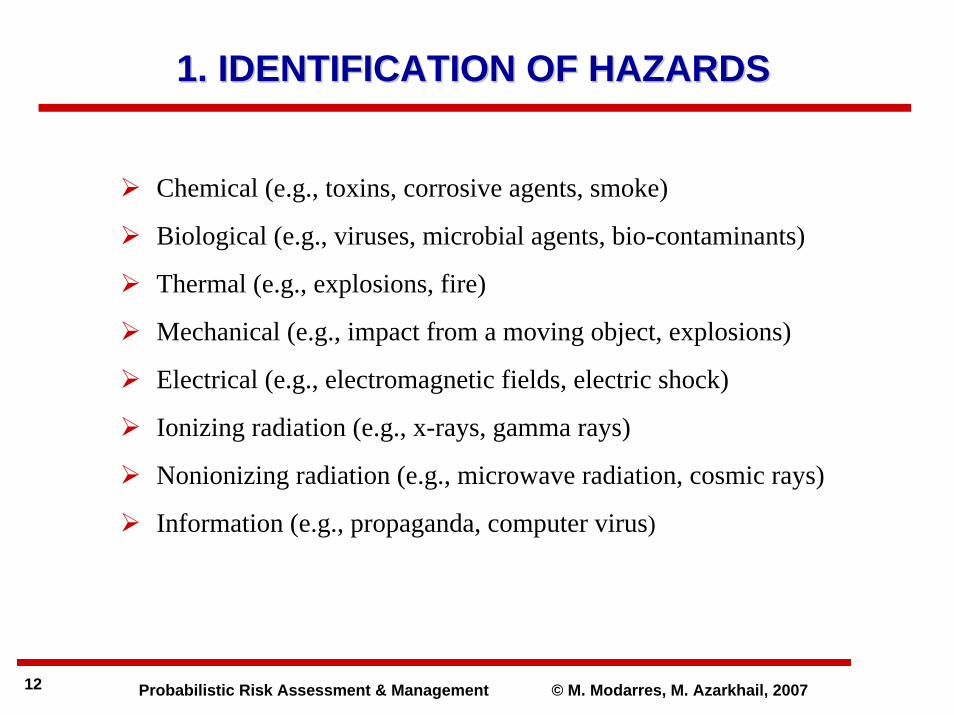
Chemical (e.g., toxins, corrosive agents, smoke)
Biological (e.g., viruses, microbial agents, bio-contaminants)
Thermal (e.g., explosions, fire)
Mechanical (e.g., impact from a moving object, explosions)
Electrical (e.g., electromagnetic fields, electric shock)
Ionizing radiation (e.g., x-rays, gamma rays)
Nonionizing radiation (e.g., microwave radiation, cosmic rays)
Information (e.g., propaganda, computer virus)
1. IDENTIFICATION OF HAZARDS1. IDENTIFICATION OF HAZARDS
Probabilistic Risk Assessment & Management © M. Modarres, M. Azarkhail, 200713
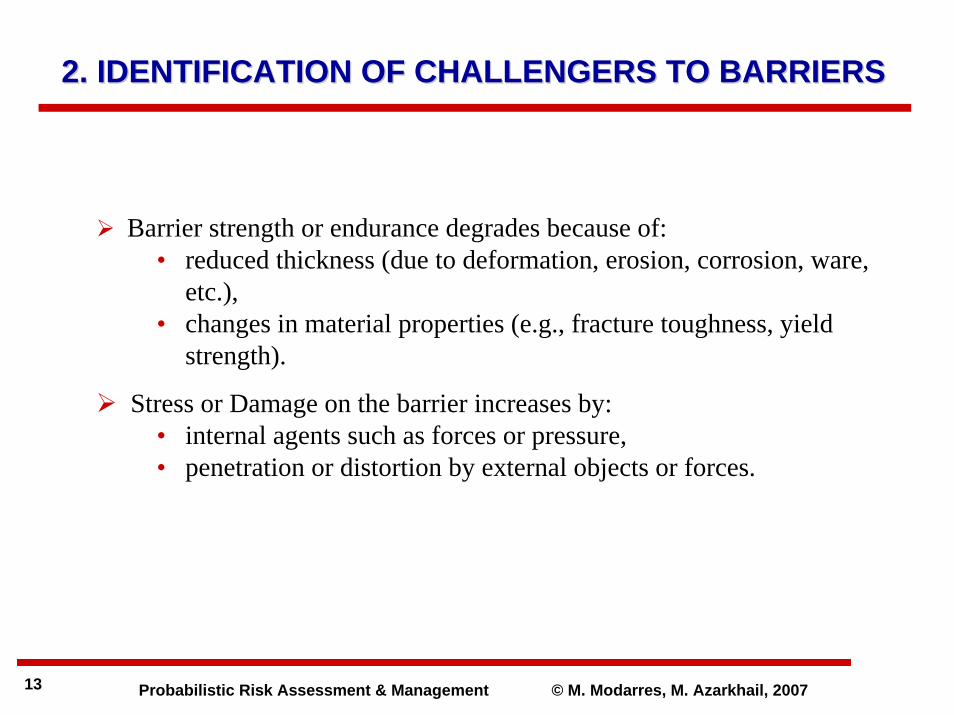
Barrier strength or endurance degrades because of:• reduced thickness (due to deformation, erosion, corrosion, ware,
etc.), • changes in material properties (e.g., fracture toughness, yield
strength).
Stress or Damage on the barrier increases by:• internal agents such as forces or pressure,• penetration or distortion by external objects or forces.
2. IDENTIFICATION OF CHALLENGERS TO BARRIERS2. IDENTIFICATION OF CHALLENGERS TO BARRIERS
Probabilistic Risk Assessment & Management © M. Modarres, M. Azarkhail, 200714
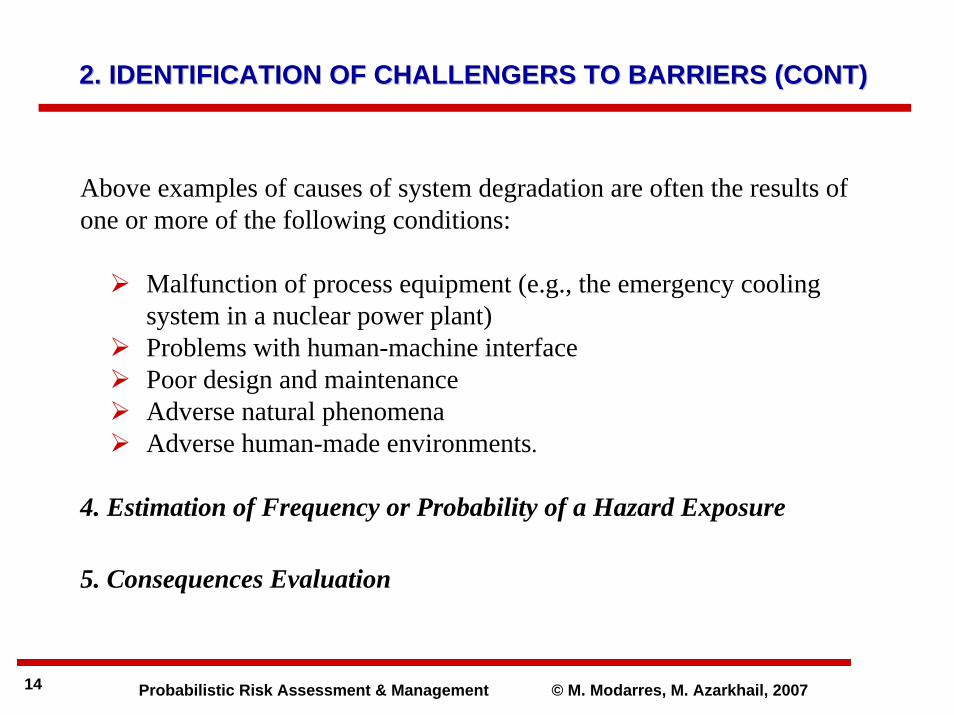
Above examples of causes of system degradation are often the results of one or more of the following conditions:
Malfunction of process equipment (e.g., the emergency cooling system in a nuclear power plant)Problems with human-machine interfacePoor design and maintenanceAdverse natural phenomenaAdverse human-made environments.
4. Estimation of Frequency or Probability of a Hazard Exposure
5. Consequences Evaluation
2. IDENTIFICATION OF CHALLENGERS TO BARRIERS (CONT)2. IDENTIFICATION OF CHALLENGERS TO BARRIERS (CONT)
Probabilistic Risk Assessment & Management © M. Modarres, M. Azarkhail, 200715
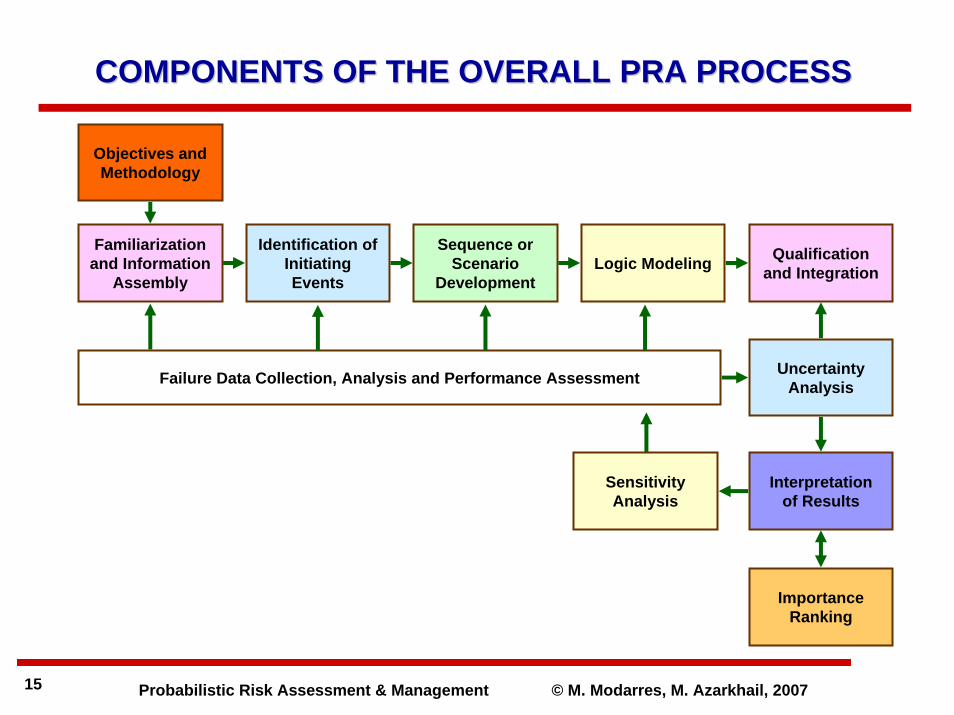
COMPONENTS OF THE OVERALL PRA PROCESSCOMPONENTS OF THE OVERALL PRA PROCESS
Objectives and Methodology
Familiarization and Information
Assembly
Identification of Initiating Events
Sequence or Scenario
DevelopmentLogic Modeling Qualification
and Integration
Uncertainty Analysis
Interpretation of Results
Importance Ranking
Sensitivity Analysis
Failure Data Collection, Analysis and Performance Assessment
Probabilistic Risk Assessment & Management © M. Modarres, M. Azarkhail, 200716
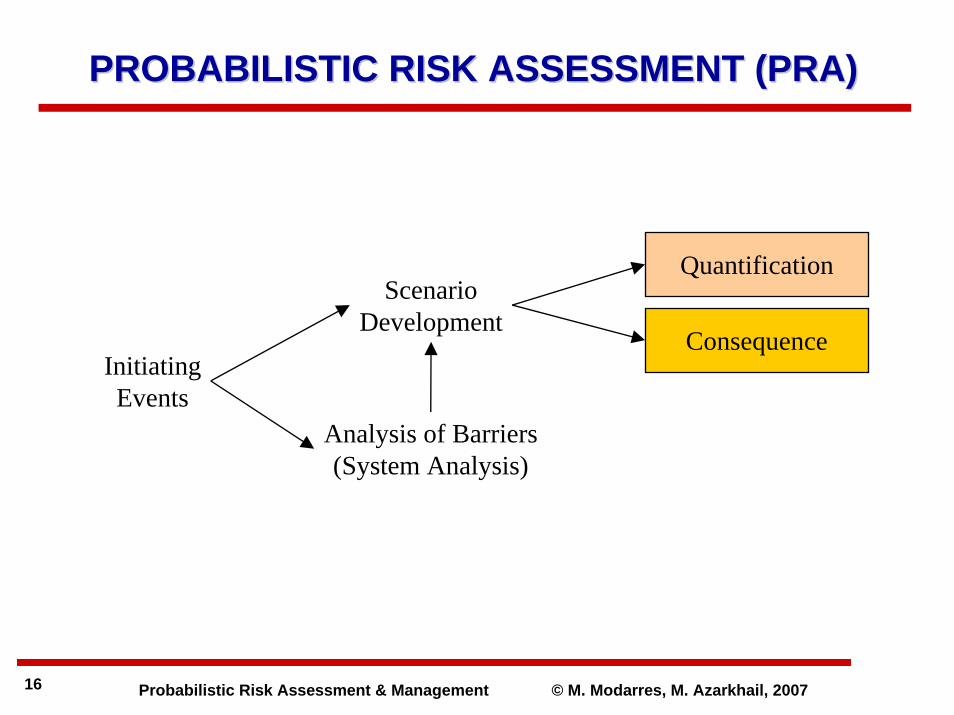
PROBABILISTIC RISK ASSESSMENT (PRA)PROBABILISTIC RISK ASSESSMENT (PRA)
InitiatingEvents
ScenarioDevelopment
Analysis of Barriers(System Analysis)
Quantification
Consequence
Probabilistic Risk Assessment & Management © M. Modarres, M. Azarkhail, 200717
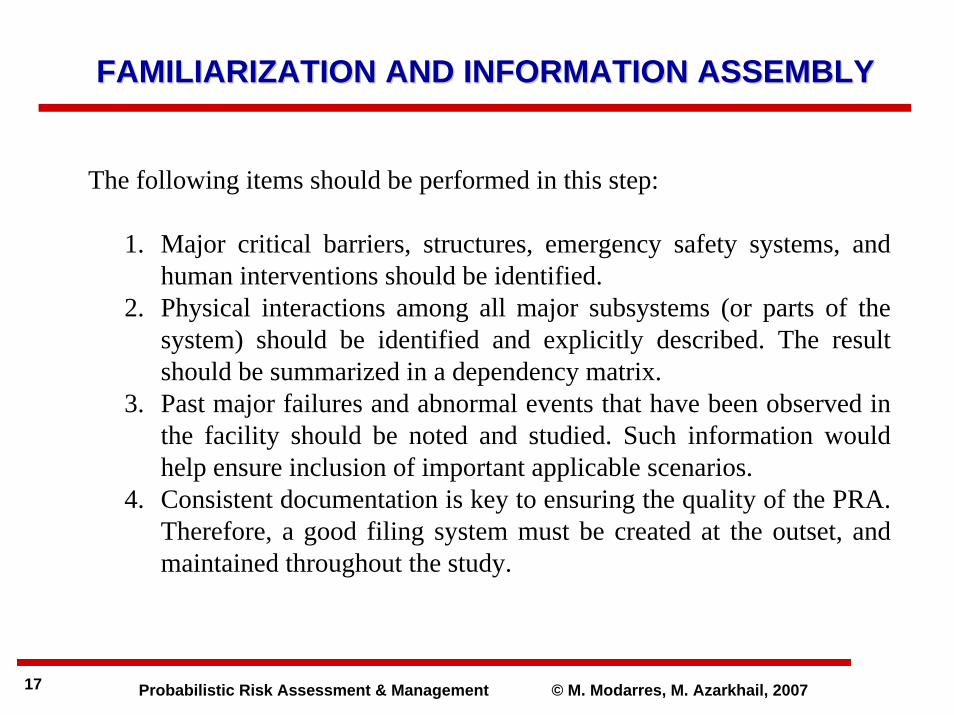
The following items should be performed in this step:
1. Major critical barriers, structures, emergency safety systems, and human interventions should be identified.
2. Physical interactions among all major subsystems (or parts of the system) should be identified and explicitly described. The result should be summarized in a dependency matrix.
3. Past major failures and abnormal events that have been observed in the facility should be noted and studied. Such information wouldhelp ensure inclusion of important applicable scenarios.
4. Consistent documentation is key to ensuring the quality of the PRA. Therefore, a good filing system must be created at the outset, and maintained throughout the study.
FAMILIARIZATION AND INFORMATION ASSEMBLYFAMILIARIZATION AND INFORMATION ASSEMBLY
Probabilistic Risk Assessment & Management © M. Modarres, M. Azarkhail, 200718
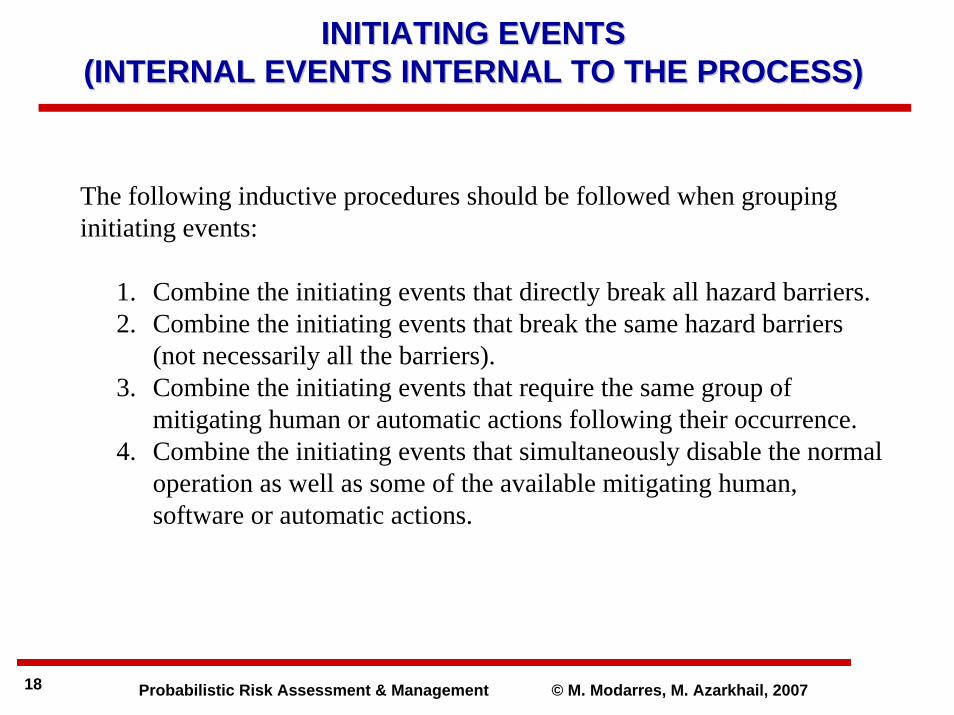
The following inductive procedures should be followed when grouping initiating events:
1. Combine the initiating events that directly break all hazard barriers.2. Combine the initiating events that break the same hazard barriers
(not necessarily all the barriers).3. Combine the initiating events that require the same group of
mitigating human or automatic actions following their occurrence.4. Combine the initiating events that simultaneously disable the normal
operation as well as some of the available mitigating human, software or automatic actions.
INITIATING EVENTS INITIATING EVENTS (INTERNAL EVENTS INTERNAL TO THE PROCESS)(INTERNAL EVENTS INTERNAL TO THE PROCESS)
Probabilistic Risk Assessment & Management © M. Modarres, M. Azarkhail, 200719
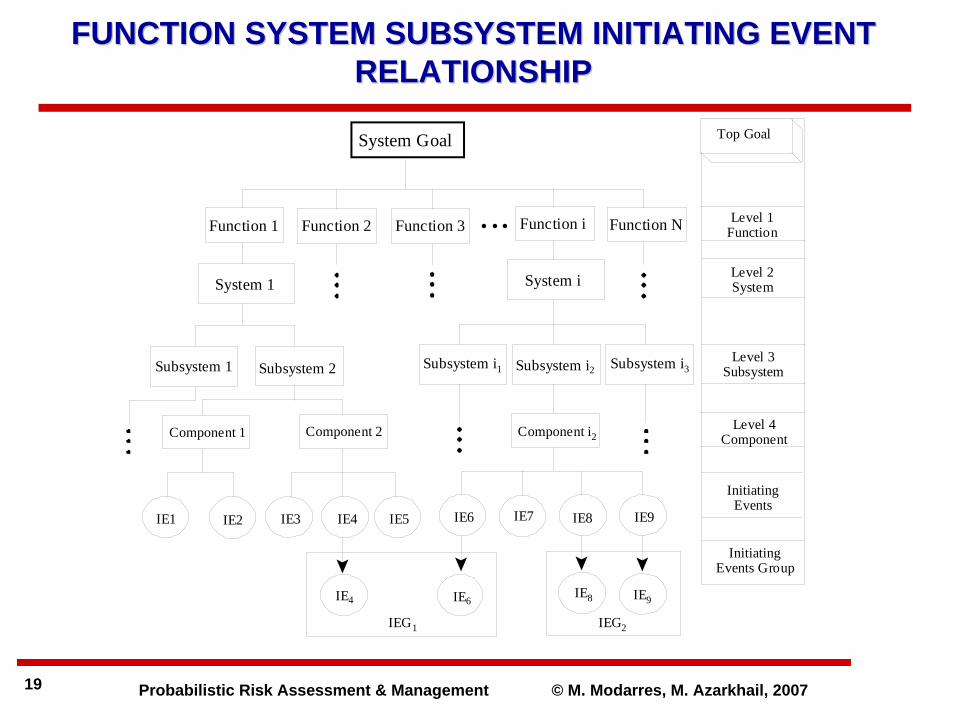
System Goal Top Goal
Function 1 Function 2 Function 3 C C C Function NFunction i
System 1 System i
Subsystem 1 Subsystem 2 Subsystem i1 Subsystem i3Subsystem i2
Component 1 Component 2 Component i2
IE2
IE8
IE3IE1 IE6IE5IE4 IE8 IE9
IE6IE4
IE7
IE9
IEG1 IEG2
Level 1Function
Level 2System
Level 3Subsystem
Level 4Component
InitiatingEvents
InitiatingEvents Group
FUNCTION SYSTEM SUBSYSTEM INITIATING EVENT FUNCTION SYSTEM SUBSYSTEM INITIATING EVENT RELATIONSHIPRELATIONSHIP

Probabilistic Risk Assessment & Management © M. Modarres, M. Azarkhail, 200720
The following procedures should be followed in this step of the PRA:
1. Select a method for identifying specific operational and non-operational initiating events. Two representative methods are functional hierarchy and FMEA. If a generic list of initiating events is available, it can be used as a supplement.
2. Using the method selected, identify a set of initiating events. 3. Group the initiating events having the same effect on the system, for
example those requiring the same mitigating functions to preventhazard exposure are grouped together
INITIATING EVENTSINITIATING EVENTS(INTERNAL EVENTS INTERNAL TO THE PROCESS)(INTERNAL EVENTS INTERNAL TO THE PROCESS)
Probabilistic Risk Assessment & Management © M. Modarres, M. Azarkhail, 200721
The following procedures should be followed in this step of the PRA:
1. Identify the mitigating functions for each initiating event (or group of events).
2. Identify the corresponding human actions, systems or hardware operations associated with each function, along with their necessary conditions for success.
3. Develop a functional event tree for each initiating event (or group of events).
4. Develop a systemic event tree for each initiating event, delineating the success conditions, initiating event progression phenomena, and end effect of each scenario.
SEQUENCE OR SCENARIO DEVELOPMENTSEQUENCE OR SCENARIO DEVELOPMENT
Probabilistic Risk Assessment & Management © M. Modarres, M. Azarkhail, 200722
The following procedures should be followed in this step of the PRA:
1. Develop a fault tree for each event in the event tree heading for which actual historical failure data does not exist.
2. Explicitly model dependencies of a subsystem on other subsystems and intercomponent dependencies (e.g., common cause failures that are described in Chapter 4).
3. Include all potential reasonable and probabilistically quantifiable causes of failure, such as hardware, software, test and maintenance, and human errors, in the fault tree.
LOGIC MODELINGLOGIC MODELING

Probabilistic Risk Assessment & Management © M. Modarres, M. Azarkhail, 200723
The following procedures should be followed in this step of the PRA:
1. Identify the hardware, software and human elements that are similar and could cause dependent or common cause failures. For example, similar pumps, motor-operated valves, air-operated valves, human actions, software routine, diesel generators, and batteries are major components in process plants, and are considered important sources of common cause failures.
2. Items that are potentially susceptible to common cause failure should be explicitly incorporated into the corresponding fault trees and event trees of the PRA where applicable.
3. Functional dependencies should be identified and explicitly modeled in the fault trees and event trees.
TREATMENT OF DEPENDENCIESTREATMENT OF DEPENDENCIES
Probabilistic Risk Assessment & Management © M. Modarres, M. Azarkhail, 200724
THE HUMAN ELEMENTTHE HUMAN ELEMENT
Nuclear (Maintenance Error, Control Room Crew Error)
Aviation (Maintenance Error, Flight Crew Error, Air Traffic Controller Error)
Chemical and Process (Maintenance Errors)
Land and Sea Transportation (Maintenance and Operator Errors)
Healthcare Industries (Procedural Error, Operator Error)
Telecommunication (Procedural Errors)
Probabilistic Risk Assessment & Management © M. Modarres, M. Azarkhail, 200725
The following procedures should be followed in this step of the PRA:
1. Determine generic values of material strength or endurance, load or damage agents, failure times, failure occurrence rate and failures on demand for each item (hardware, human action, or software) identified in the PRA models. This can be obtained either from facility-specific or system-specific experiences, from generic sources of data, or both (see Chapter 4 for more details on this subject)
2. Gather data on hazard barrier tests, repair, and maintenance data primarily from experience, if available. Otherwise use generic performance data.
3. Assess the frequency of initiating events and other probability of failure events from experience, expert judgment, or generic sources. (See Chapter 4).
4. Determine the dependent or common cause failure probability for similar items, primarily from generic values. However, when significant specific data are available, they should be primarily used (see Chapter 4.)
FAILURE DATA COLLECTION, FAILURE DATA COLLECTION, ANALYSIS, AND PERFORMANCE ASSESSMENTANALYSIS, AND PERFORMANCE ASSESSMENT
Probabilistic Risk Assessment & Management © M. Modarres, M. Azarkhail, 200726
The following procedures should be followed as part of the quantification and integration step in the PRA:
1. Merge corresponding fault trees associated with each failure or success event modeled in the event tree scenarios (i.e., combine them in a Boolean form). Develop a reduced Boolean function for each scenario (i.e., truncated minimal cut sets).
2. Calculate the total frequency of each sequence, using the frequency of initiating events, the probability of barrier failure including contributions from test and maintenance frequency (outage), common cause failure probability, and human error probability.
3. Use the minimal cut sets of each sequence for the quantification process. If needed, simplify the process by truncating based on the cut sets or probability.
4. Calculate the total frequency of each scenario.5. Calculate the total frequency of all scenarios of all event trees.
QUANTIFICATION AND INTEGRATIONQUANTIFICATION AND INTEGRATION
Probabilistic Risk Assessment & Management © M. Modarres, M. Azarkhail, 200727
Steps in uncertainty analysis include:
1. Identify models and parameters that are uncertain and the methodof uncertainty estimation to be used for each.
2. Describe the scope of the PRA and 3. Estimate and assign probability distributions depicting model and
parameter uncertainties in the PRA.4. Propagate uncertainties associated with the hazard barrier models
and parameters to find the uncertainty associated with the risk value.
5. Present the uncertainties associated with risks and contributors to risk in an easy way to understand and visually straightforward to grasp.
UNCERTAINTY ANALYSISUNCERTAINTY ANALYSIS
Probabilistic Risk Assessment & Management © M. Modarres, M. Azarkhail, 200728
Applications of importance measures may be categorized into the following areas:
1. (Re)Design: To support decisions of the system design or redesign by adding or removing elements (barriers, subsystems, human interactions, etc.)
2. Test and Maintenance: To Address questions related to the plantperformance by changing the test and maintenance strategy for a given design.
3. Configuration and Control: To measure the significance or the effect of failure of a component on risk or safety or temporarily taking a component out of service.
4. Reduce uncertainties in the input variables of the PRAs.
RISK RANKING AND IMPORTANCE ANALYSISRISK RANKING AND IMPORTANCE ANALYSIS
Probabilistic Risk Assessment & Management © M. Modarres, M. Azarkhail, 200729
The following are the major steps of importance ranking:
1. Determine the purpose of the ranking and select appropriate ranking importance measure that has consistent interpretation for the use of the ranked results.
2. Perform risk ranking and uncertainty ranking, as needed.3. Identify the most critical and important elements of the system
with respect to the total risk values and total uncertainty associated with the calculated risk values.
RISK RANKING AND IMPORTANCE ANALYSISRISK RANKING AND IMPORTANCE ANALYSIS
Probabilistic Risk Assessment & Management © M. Modarres, M. Azarkhail, 200730
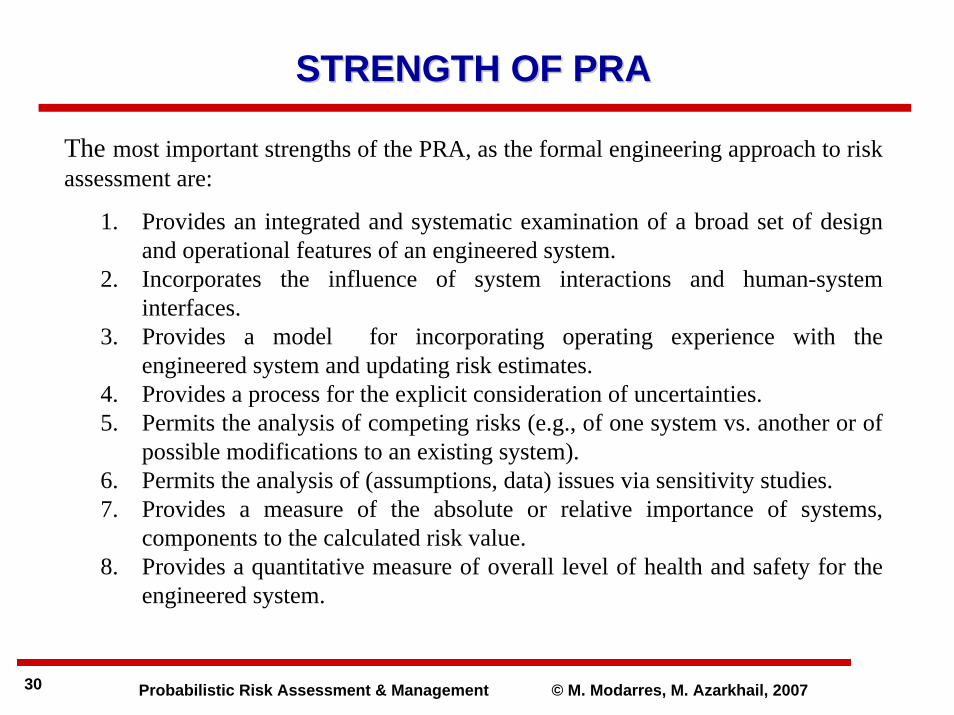
The most important strengths of the PRA, as the formal engineering approach to risk assessment are:
1. Provides an integrated and systematic examination of a broad set of design and operational features of an engineered system.
2. Incorporates the influence of system interactions and human-system interfaces.
3. Provides a model for incorporating operating experience with the engineered system and updating risk estimates.
4. Provides a process for the explicit consideration of uncertainties.5. Permits the analysis of competing risks (e.g., of one system vs. another or of
possible modifications to an existing system).6. Permits the analysis of (assumptions, data) issues via sensitivity studies.7. Provides a measure of the absolute or relative importance of systems,
components to the calculated risk value.8. Provides a quantitative measure of overall level of health and safety for the
engineered system.
STRENGTH OF PRASTRENGTH OF PRA
Probabilistic Risk Assessment & Management © M. Modarres, M. Azarkhail, 200731
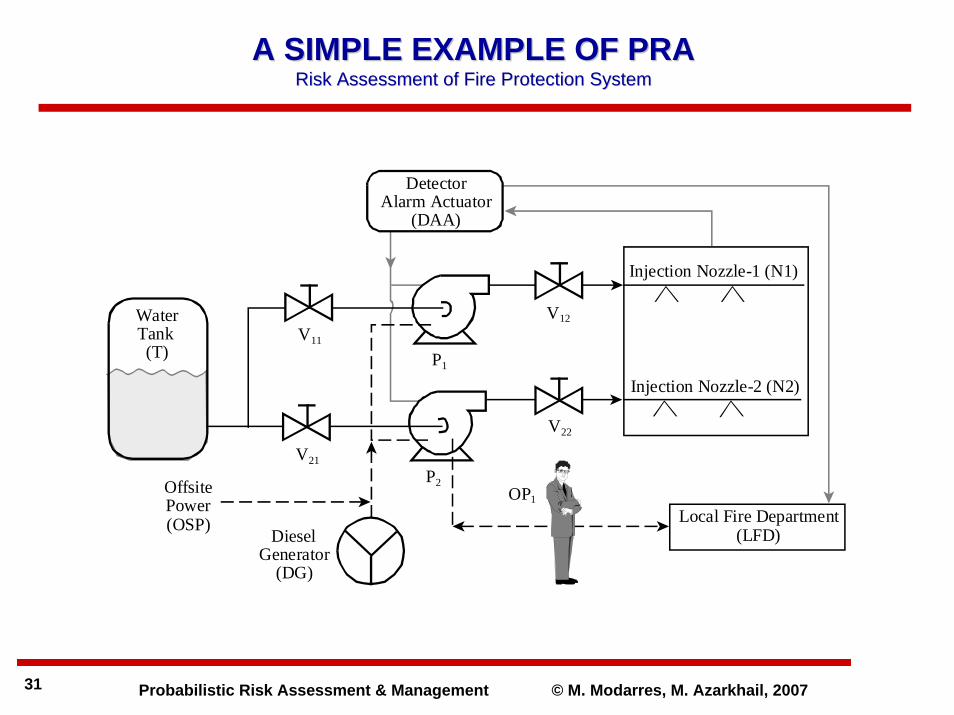
A SIMPLE EXAMPLE OF PRAA SIMPLE EXAMPLE OF PRARisk Assessment of Fire Protection SystemRisk Assessment of Fire Protection System
DieselGenerator
(DG)
WaterTank (T)
Local Fire Department(LFD)
OffsitePower(OSP)
Injection Nozzle-1 (N1)
Injection Nozzle-2 (N2)
V22
V12
P1
P2OP1
V11
V21
DetectorAlarm Actuator
(DAA)
Probabilistic Risk Assessment & Management © M. Modarres, M. Azarkhail, 200732
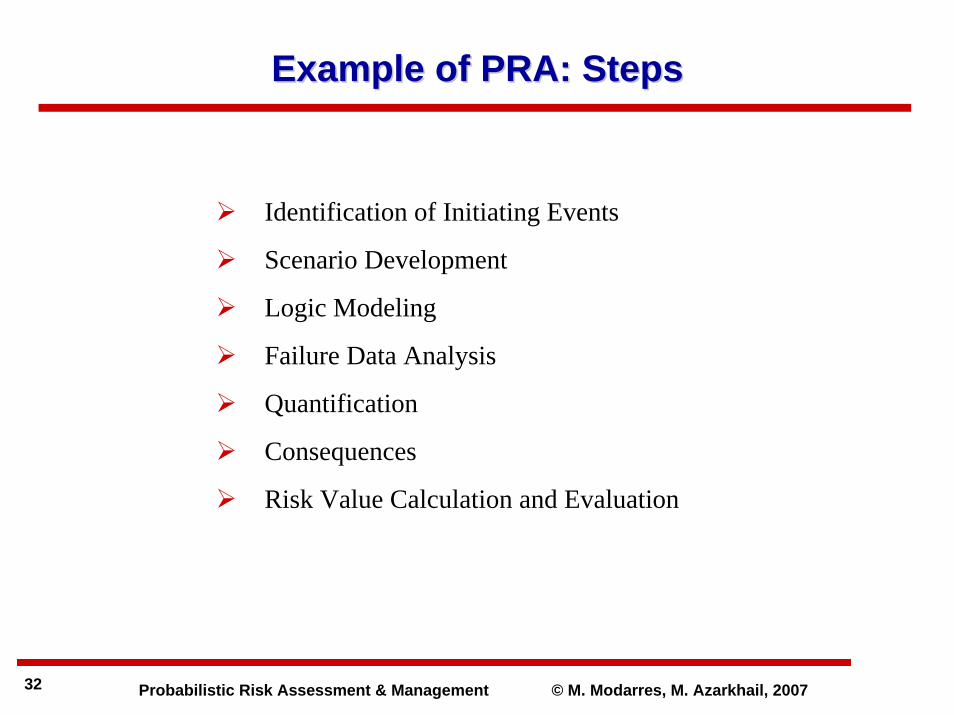
Example of PRA: StepsExample of PRA: Steps
Identification of Initiating Events
Scenario Development
Logic Modeling
Failure Data Analysis
Quantification
Consequences
Risk Value Calculation and Evaluation
Probabilistic Risk Assessment & Management © M. Modarres, M. Azarkhail, 200733
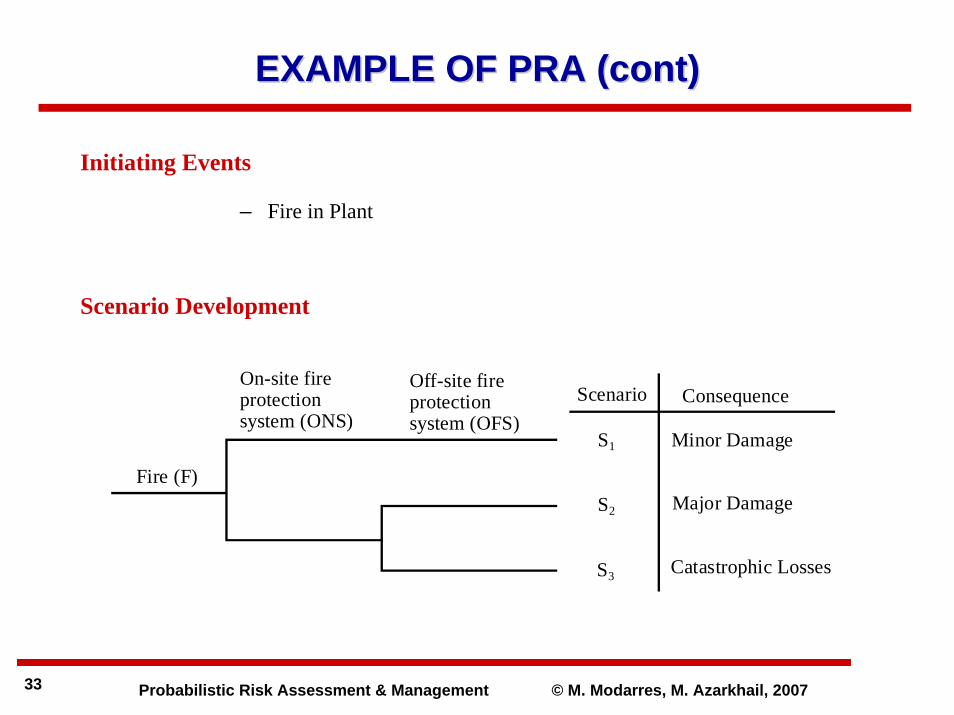
EXAMPLE OF PRA (cont)EXAMPLE OF PRA (cont)
Scenario Development
ConsequenceScenario
S1
Major Damage
Catastrophic LossesS3
Minor Damage
S2
Fire (F)
On-site fireprotectionsystem (ONS)
Off-site fireprotectionsystem (OFS)
Initiating Events
– Fire in Plant
Probabilistic Risk Assessment & Management © M. Modarres, M. Azarkhail, 200734
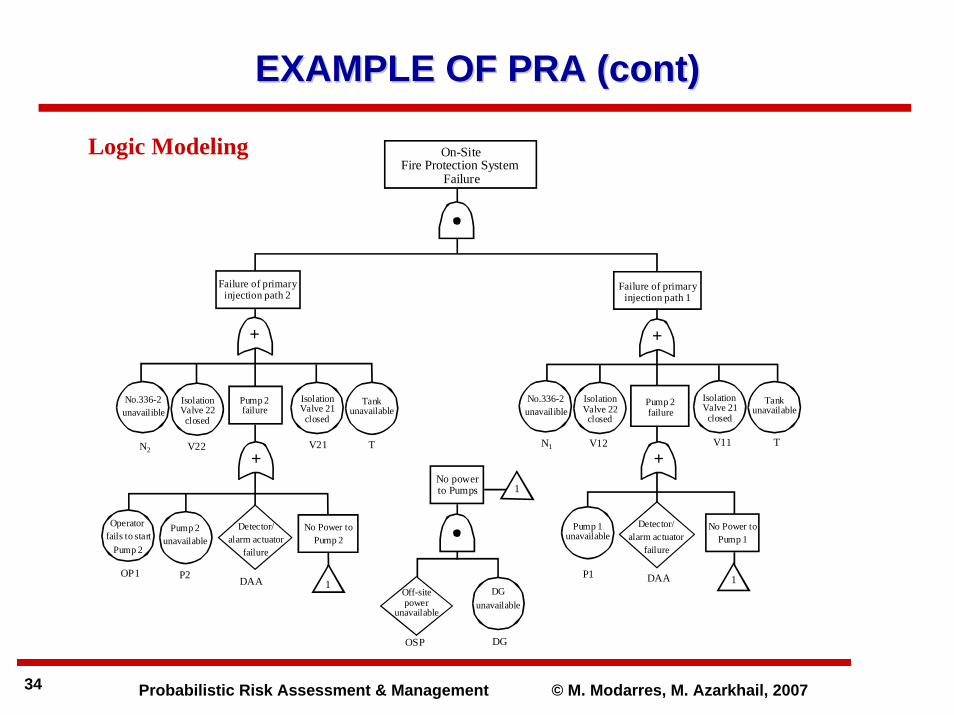
EXAMPLE OF PRA (cont)EXAMPLE OF PRA (cont)
Logic Modeling
No powerto Pumps 1
Off-sitepower
unavailable
OSP DG
DGunavailable
Failure of primaryinjection path 2
No.336-2unavailible
IsolationValve 22closed
Pump 2failure
IsolationValve 21closed
Tankunavailable
Pump 2unavailable
Detector/alarm actuator
failure
No Power toPump 2
1
N2 V21V22
OP1 P2 DAA
Failure of primaryinjection path 1
No Power toPump 1
Pump 1unavailable
Detector/alarm actuator
failure
N1 V11V12 T
P1 DAA
On-SiteFire Protection System
Failure
T
No.336-2unavailible
IsolationValve 22closed
Pump 2failure
IsolationValve 21
closed
Tankunavailable
Operator fails to start
Pump 2
1
+
+
+
+
Probabilistic Risk Assessment & Management © M. Modarres, M. Azarkhail, 200735
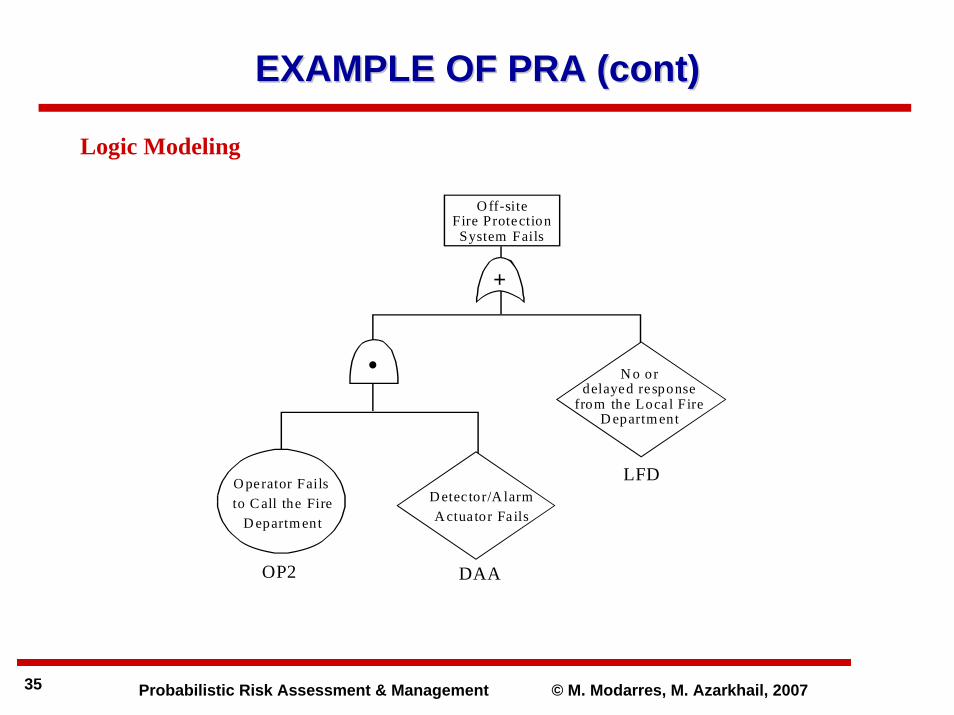
EXAMPLE OF PRA (cont)EXAMPLE OF PRA (cont)
Logic Modeling
O ff-siteFire Protection
System Fails
+
C N o ordelayed response
from the Loca l FireD epartm ent
D etec tor/A larmA ctua tor Fa ils
O perator Fails to C all the Fire
D epartm ent
LFD
DAAOP2
Probabilistic Risk Assessment & Management © M. Modarres, M. Azarkhail, 200736
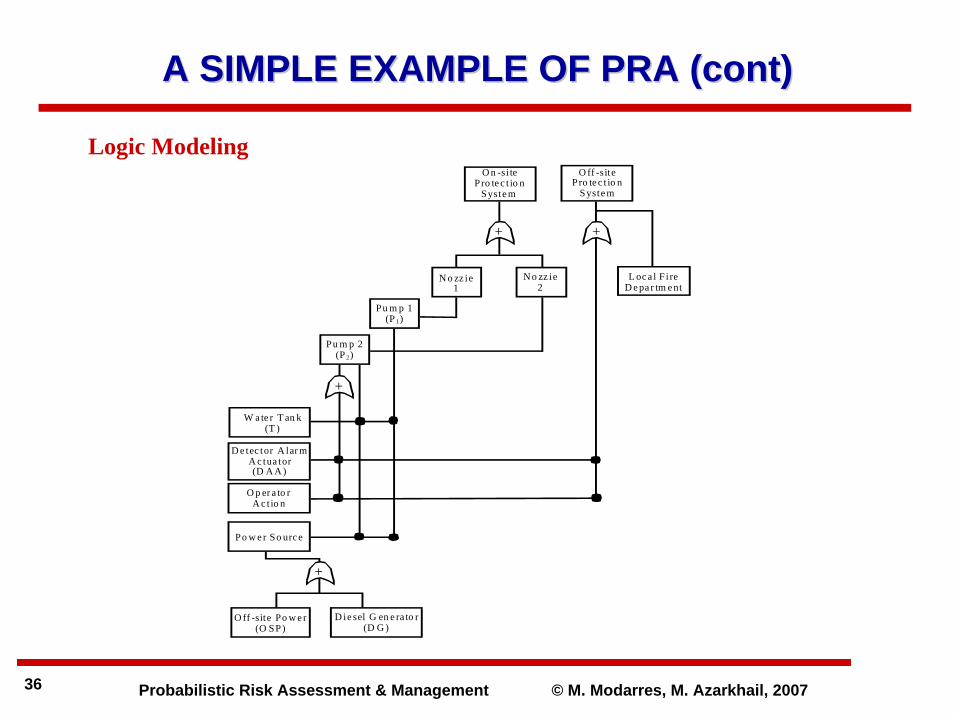
A SIMPLE EXAMPLE OF PRA (cont)A SIMPLE EXAMPLE OF PRA (cont)
Logic Modeling
+
O n -si tePro te c t io n
Syste m
+
O ff -sitePro te c t io n
Syste m
+
L oc a l F i reD e pa r tm e nt
+
W a te r T an k(T )
D e tec tor A lar mA c tua tor(D A A )
O p er a to rA c t io n
Po w e r So urc e
N o zz ie1
N o zz ie2
Pu m p 1(P 1)
O ff -site Po w e r(O SP)
D ie sel G en e ra to r(D G )
Pu m p 2(P 2)
Probabilistic Risk Assessment & Management © M. Modarres, M. Azarkhail, 200737
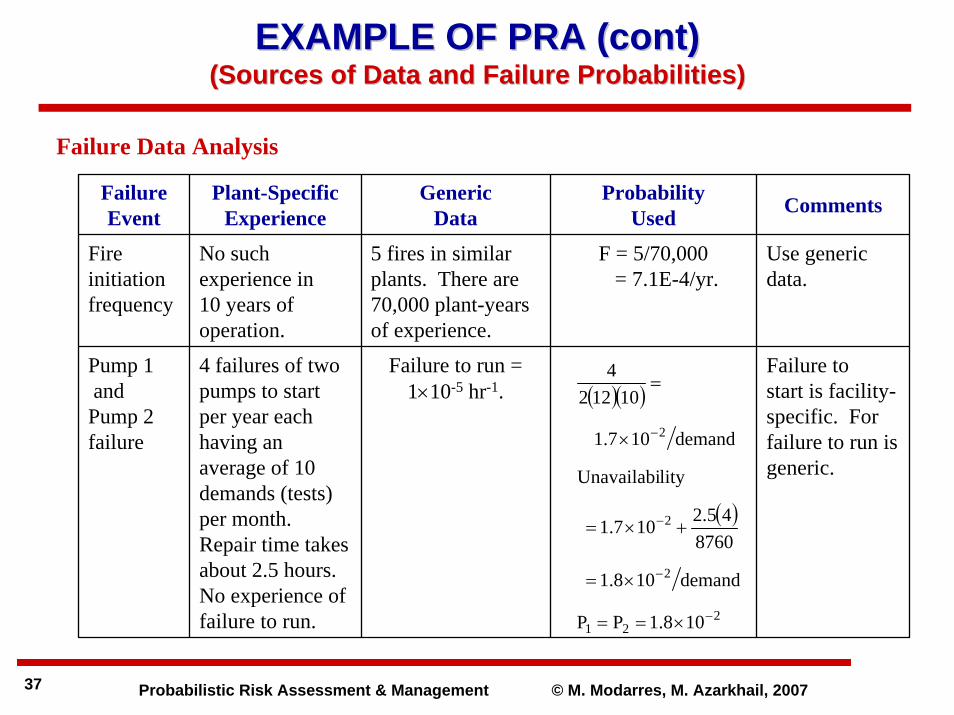
EXAMPLE OF PRA (cont) EXAMPLE OF PRA (cont) ((Sources of Data and Failure ProbabilitiesSources of Data and Failure Probabilities))
Failure Data Analysis
( )( )
( )
221
2
2
2
108.1PP
demand108.1
876045.2107.1
lityUnavailabi
demand107.1
101224
−
−
−
−
×==
×=
+×=
×
=
Failure Event
Plant-SpecificExperience
GenericData
ProbabilityUsed Comments
Fire initiation frequency
No such experience in 10 years of operation.
5 fires in similar plants. There are 70,000 plant-years of experience.
F = 5/70,000= 7.1E-4/yr.
Use generic data.
Pump 1and
Pump 2 failure
4 failures of two pumps to start per year each having an average of 10 demands (tests) per month. Repair time takes about 2.5 hours. No experience of failure to run.
Failure to run = 1×10⁻⁵ hr-1.
Failure tostart is facility-specific. For failure to run is generic.
Probabilistic Risk Assessment & Management © M. Modarres, M. Azarkhail, 200738
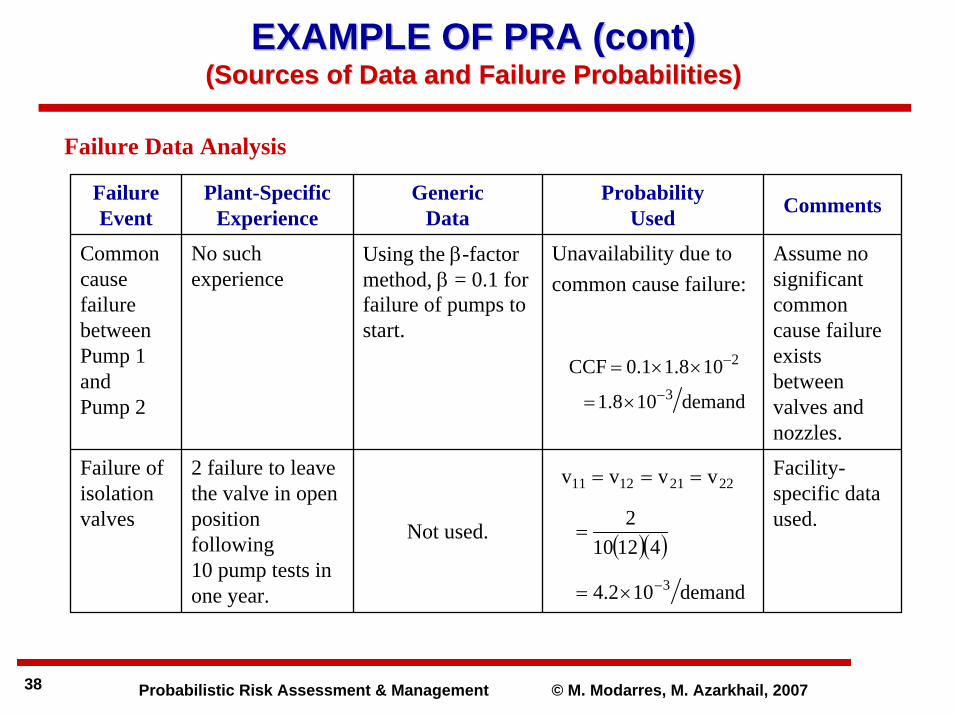
EXAMPLE OF PRA (cont) EXAMPLE OF PRA (cont) ((Sources of Data and Failure ProbabilitiesSources of Data and Failure Probabilities))
Failure Data Analysis
demand108.1
108.11.0CCF3
2
−
−
×=
××=
( )( )
demand102.4
412102
vvvv
3
22211211
−×=
=
===
Failure Event
Plant-SpecificExperience
GenericData
ProbabilityUsed Comments
Common cause failure between Pump 1 and Pump 2
No such experience
Using the β-factor method, β = 0.1 for failure of pumps to start.
Unavailability due tocommon cause failure:
Assume no significant common cause failure exists between valves and nozzles.
Failure of isolation valves
2 failure to leave the valve in open position following 10 pump tests in one year.
Not used.
Facility-specific data used.
Probabilistic Risk Assessment & Management © M. Modarres, M. Azarkhail, 200739
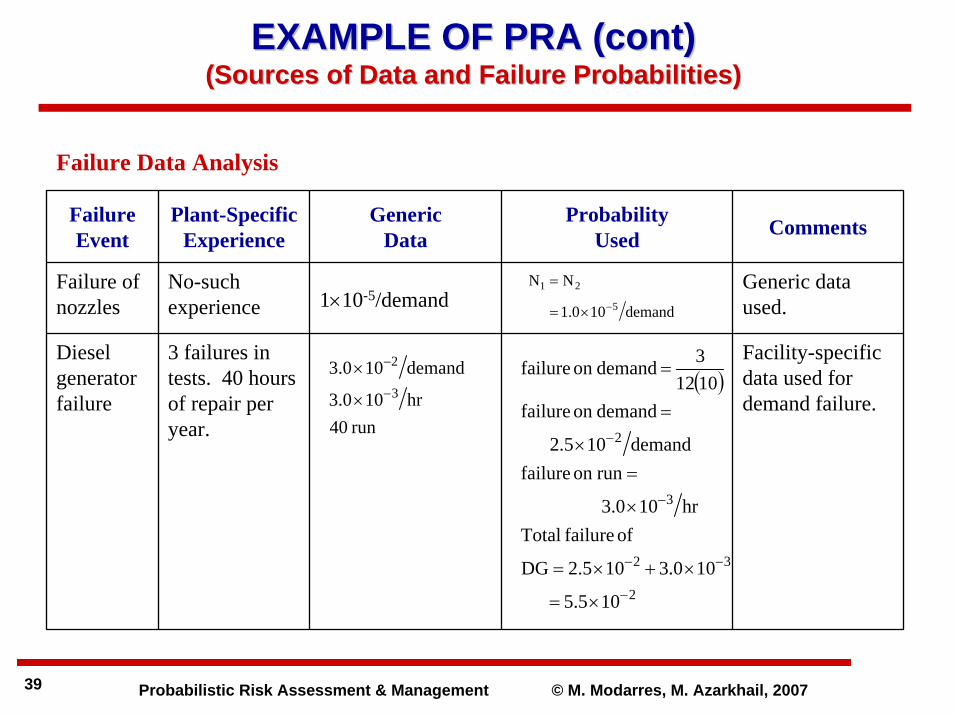
EXAMPLE OF PRA (cont) EXAMPLE OF PRA (cont) ((Sources of Data and Failure ProbabilitiesSources of Data and Failure Probabilities))
Failure Data Analysis
( )
2
32
3
2
105.5
100.3105.2DG
of failure Totalhr100.3
runon failuredemand105.2
demandon failure10123demandon failure
−
−−
−
−
×=
×+×=
×
=×
=
=
demand100.1
NN5
21
−×=
=
run 40hr100.3
demand100.33
2
−
−
×
×
Failure Event
Plant-SpecificExperience
GenericData
ProbabilityUsed Comments
Failure of nozzles
No-such experience 1×10⁻⁵/demand
Generic data used.
Diesel generator failure
3 failures in tests. 40 hours of repair per year.
Facility-specific data used for demand failure.
Probabilistic Risk Assessment & Management © M. Modarres, M. Azarkhail, 200740
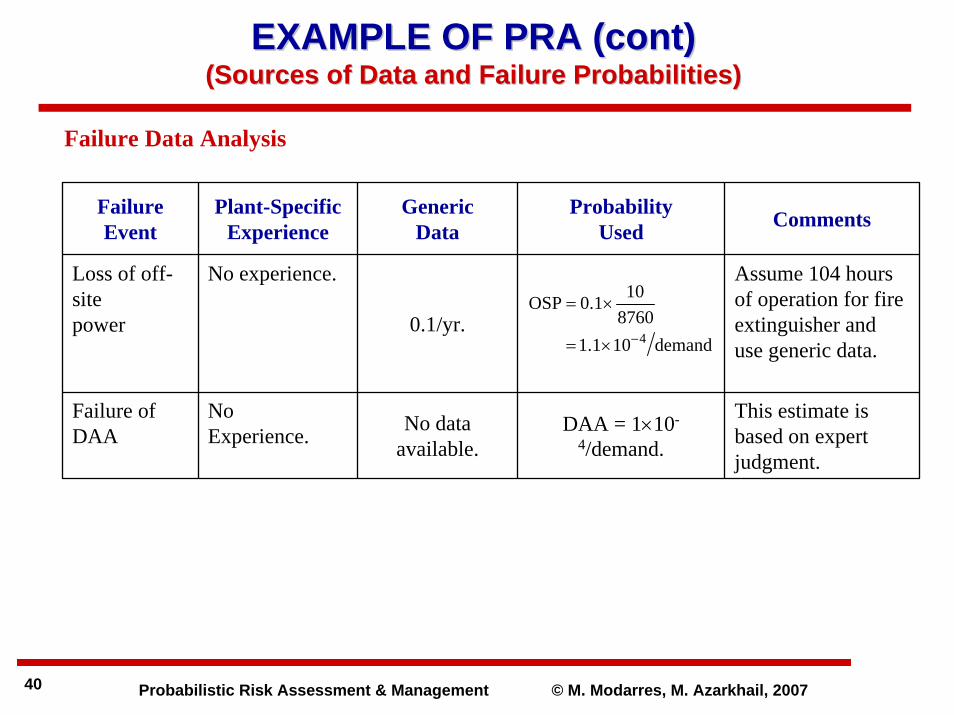
EXAMPLE OF PRA (cont) EXAMPLE OF PRA (cont) ((Sources of Data and Failure ProbabilitiesSources of Data and Failure Probabilities))
Failure Data Analysis
demand101.18760101.0OSP
4−×=
×=
Failure Event
Plant-SpecificExperience
GenericData
ProbabilityUsed Comments
Loss of off-sitepower
No experience.
0.1/yr.
Assume 104 hours of operation for fire extinguisher and use generic data.
Failure of DAA
NoExperience. No data
available.DAA = 1×10-
4/demand.
This estimate is based on expert judgment.
Probabilistic Risk Assessment & Management © M. Modarres, M. Azarkhail, 200741
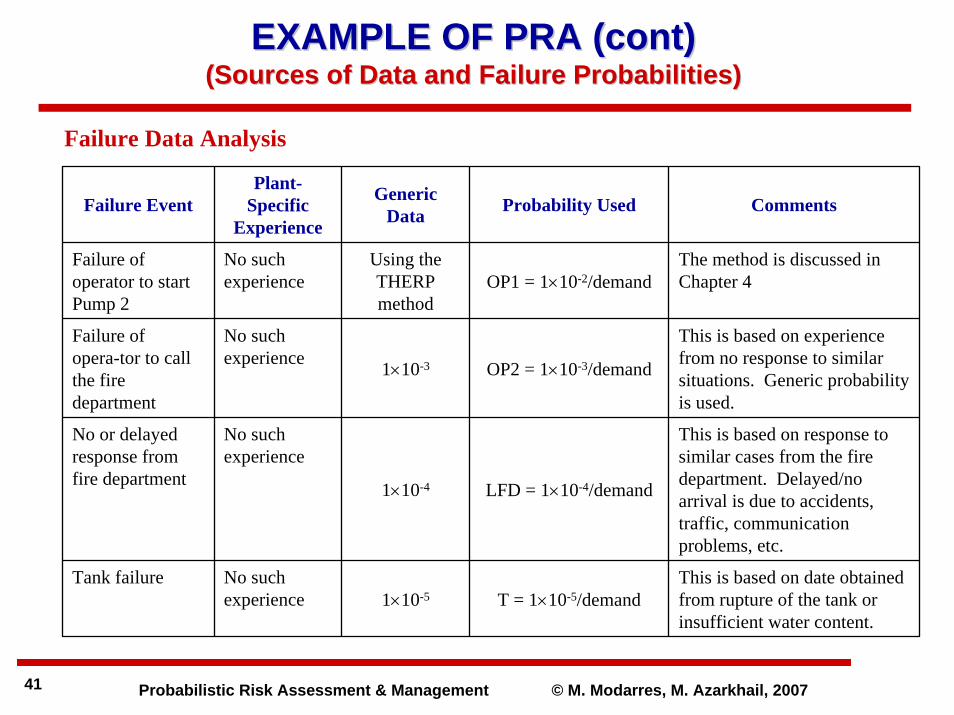
EXAMPLE OF PRA (cont) EXAMPLE OF PRA (cont) ((Sources of Data and Failure ProbabilitiesSources of Data and Failure Probabilities))
Failure Data Analysis
Failure EventPlant-
SpecificExperience
GenericData Probability Used Comments
Failure of operator to start Pump 2
No such experience
Using the THERP method
OP1 = 1×10⁻²/demandThe method is discussed in Chapter 4
Failure of opera-tor to call the fire department
No such experience 1×10⁻³ OP2 = 1×10⁻³/demand
This is based on experience from no response to similar situations. Generic probability is used.
No or delayed response from fire department
No such experience
1×10⁻⁴ LFD = 1×10⁻⁴/demand
This is based on response to similar cases from the fire department. Delayed/no arrival is due to accidents, traffic, communication problems, etc.
Tank failure No such experience 1×10⁻⁵ T = 1×10⁻⁵/demand
This is based on date obtained from rupture of the tank or insufficient water content.
Probabilistic Risk Assessment & Management © M. Modarres, M. Azarkhail, 200742
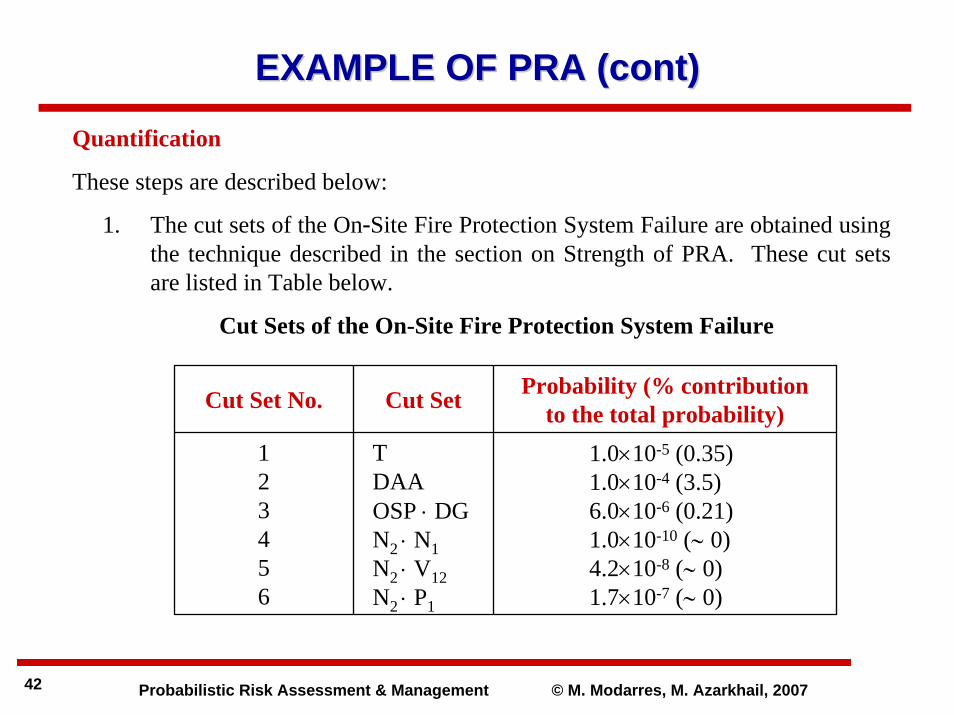
Quantification
These steps are described below:
1. The cut sets of the On-Site Fire Protection System Failure are obtained using the technique described in the section on Strength of PRA. These cut sets are listed in Table below.
Cut Sets of the On-Site Fire Protection System Failure
EXAMPLE OF PRA (cont)EXAMPLE OF PRA (cont)
Cut Set No. Cut Set Probability (% contribution to the total probability)
123456
TDAAOSP ⋅ DGN2 ⋅ N1N2 ⋅ V12N2 ⋅ P1
1.0×10⁻⁵ (0.35)1.0×10⁻⁴ (3.5)6.0×10⁻⁶ (0.21)1.0×10⁻¹⁰ (∼ 0)4.2×10⁻⁸ (∼ 0)1.7×10⁻⁷ (∼ 0)

Probabilistic Risk Assessment & Management © M. Modarres, M. Azarkhail, 200743
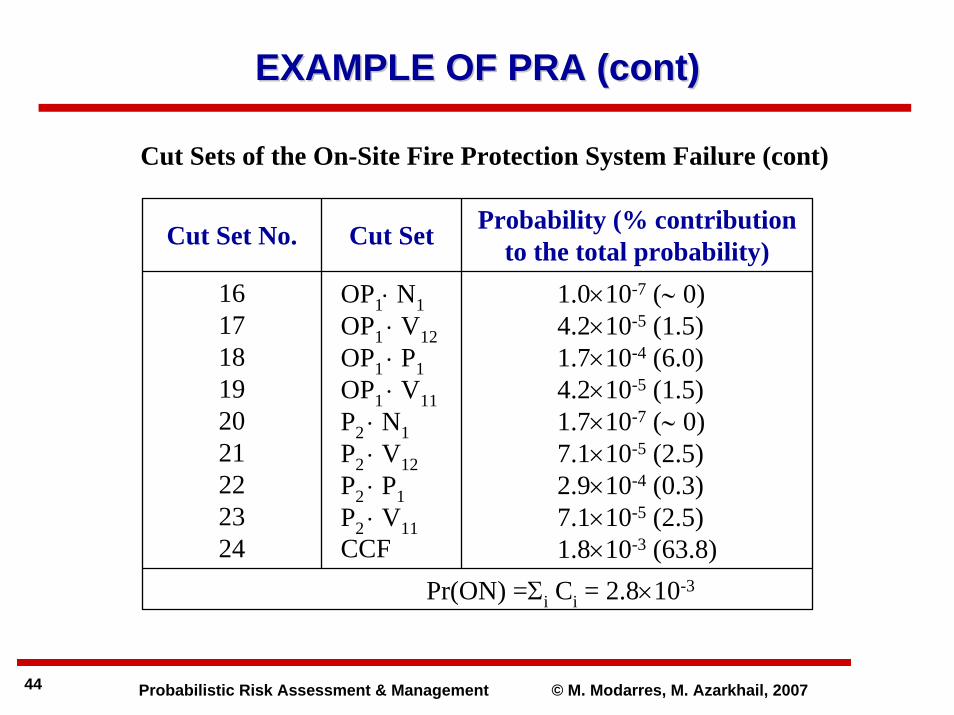
Cut Sets of the On-Site Fire Protection System Failure (cont)
EXAMPLE OF PRA (cont)EXAMPLE OF PRA (cont)
Cut Set No. Cut Set Probability (% contribution to the total probability)
789101112131415
N2 ⋅ V11V22 ⋅ N1V22 ⋅ V12V22 ⋅ P1V22 ⋅ V11V21 ⋅ N1V21 ⋅ V12V22 ⋅ P1V21 ⋅ V11
4.2×10⁻⁸ (∼ 0)4.2×10⁻⁸ (∼ 0)1.8×10⁻⁵ (0.64)7.1×10⁻⁵ (2.5)1.8×10⁻⁵ (0.64)4.2×10⁻⁸ (∼ 0)1.8×10⁻⁵ (0.35)7.1×10⁻⁵ (2.5)1.8×10⁻⁵ (0.64)
Probabilistic Risk Assessment & Management © M. Modarres, M. Azarkhail, 200744
Cut Sets of the On-Site Fire Protection System Failure (cont)
EXAMPLE OF PRA (cont)EXAMPLE OF PRA (cont)
Cut Set No. Cut Set Probability (% contribution to the total probability)
161718192021222324
OP1⋅ N1OP1 ⋅ V12OP1 ⋅ P1OP1 ⋅ V11P2 ⋅ N1P2 ⋅ V12P2 ⋅ P1P2 ⋅ V11CCF
1.0×10⁻⁷ (∼ 0)4.2×10⁻⁵ (1.5)1.7×10⁻⁴ (6.0)4.2×10⁻⁵ (1.5)1.7×10⁻⁷ (∼ 0)7.1×10⁻⁵ (2.5)2.9×10⁻⁴ (0.3)7.1×10⁻⁵ (2.5)1.8×10⁻³ (63.8)
Pr(ON) =Σi Ci = 2.8×10⁻³
Probabilistic Risk Assessment & Management © M. Modarres, M. Azarkhail, 200745
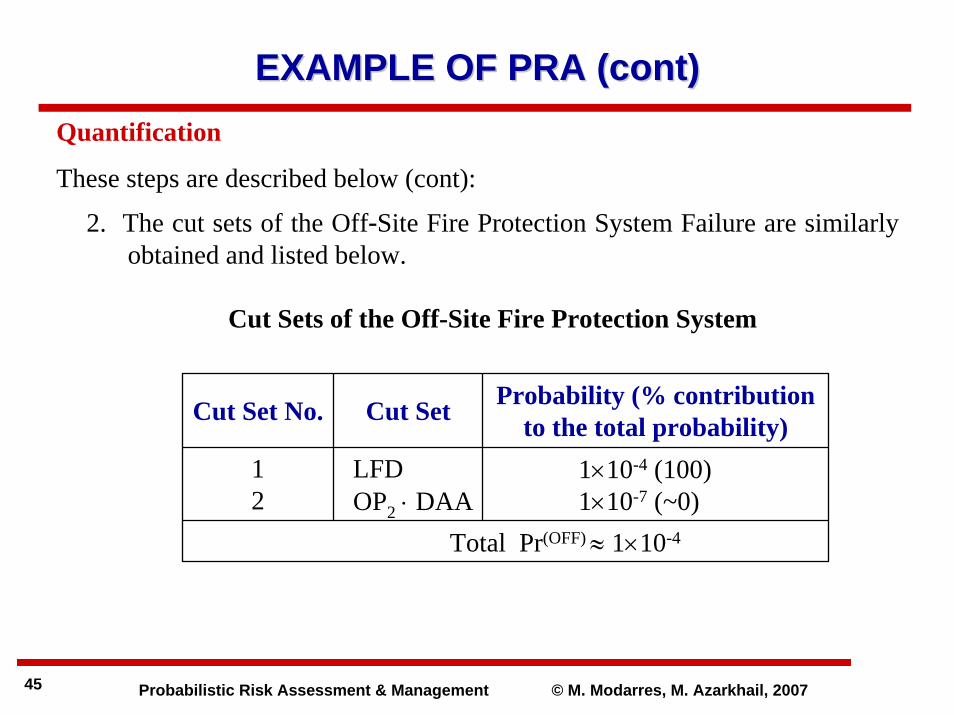
Quantification
These steps are described below (cont):
2. The cut sets of the Off-Site Fire Protection System Failure are similarly obtained and listed below.
Cut Sets of the Off-Site Fire Protection System
EXAMPLE OF PRA (cont)EXAMPLE OF PRA (cont)
Cut Set No. Cut Set Probability (% contribution to the total probability)
12
LFDOP2 ⋅ DAA
1×10⁻⁴ (100)1×10⁻⁷ (~0)
Total Pr(OFF) ≈ 1×10⁻⁴
Probabilistic Risk Assessment & Management © M. Modarres, M. Azarkhail, 200746
EXAMPLE OF PRA (cont)EXAMPLE OF PRA (cont)
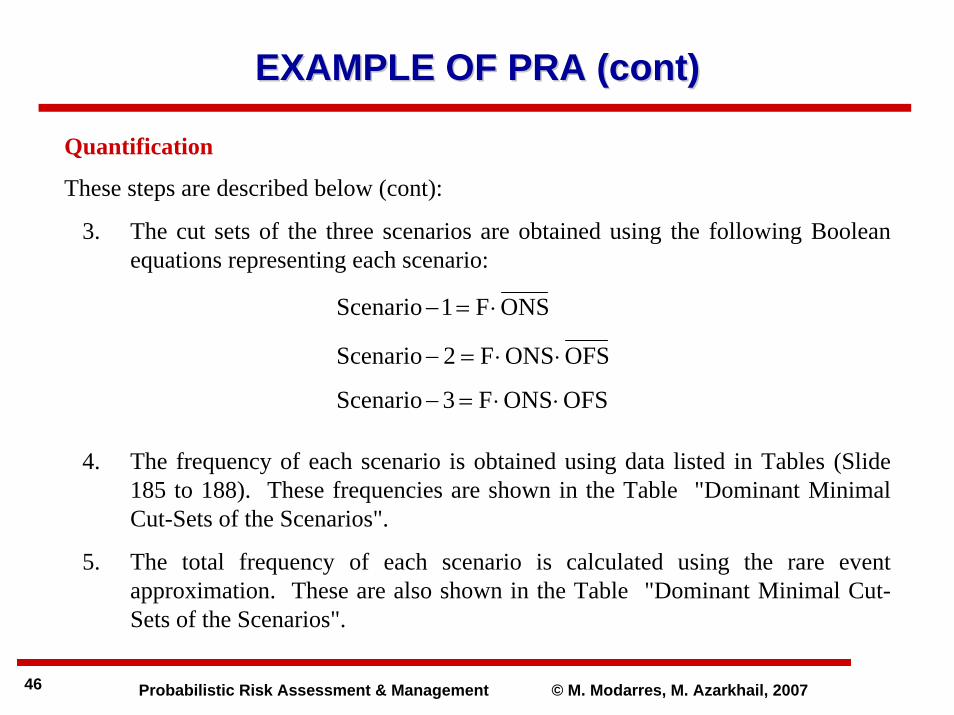
Quantification
These steps are described below (cont):
3. The cut sets of the three scenarios are obtained using the following Boolean equations representing each scenario:
4. The frequency of each scenario is obtained using data listed in Tables (Slide 185 to 188). These frequencies are shown in the Table "Dominant Minimal Cut-Sets of the Scenarios".
5. The total frequency of each scenario is calculated using the rare event approximation. These are also shown in the Table "Dominant Minimal Cut-Sets of the Scenarios".
OFSONSF3Scenario
OFSONSF2Scenario
ONSF1Scenario
⋅⋅=−
⋅⋅=−
⋅=−

Probabilistic Risk Assessment & Management © M. Modarres, M. Azarkhail, 200747
EXAMPLE OF PRA (cont)EXAMPLE OF PRA (cont)
Scenario Number Economic Consequence123
$ 1,000,000$ 92,000,000$ 210,000,000
Consequences
In the scenario development and quantification tasks, we identified three distinct scenarios of interest, each with different outcomes and frequencies. The consequences associated with each scenario should be specified in terms of both economic and/or human losses. This part of the analysis is one of the most difficult for several reasons:
• Each scenario poses different hazards and methods of hazard exposure.
• The consequence of the scenario can be measured in terms of human losses.
Economic Consequences of Fire Scenarios
Probabilistic Risk Assessment & Management © M. Modarres, M. Azarkhail, 200748
EXAMPLE OF PRA (cont)EXAMPLE OF PRA (cont)
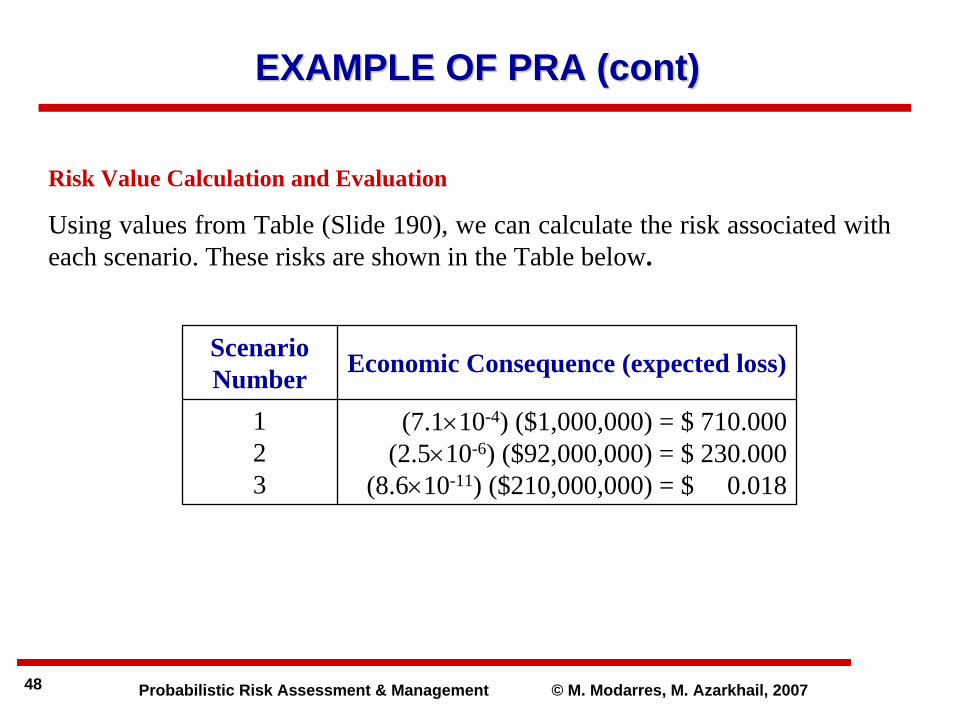
Risk Value Calculation and Evaluation
Using values from Table (Slide 190), we can calculate the risk associated with each scenario. These risks are shown in the Table below.
Scenario Number Economic Consequence (expected loss)
123
(7.1×10⁻⁴) ($1,000,000) = $ 710.000(2.5×10⁻⁶) ($92,000,000) = $ 230.000
(8.6×10⁻¹¹) ($210,000,000) = $ 0.018
Probabilistic Risk Assessment & Management © M. Modarres, M. Azarkhail, 200749
EXAMPLE OF PRA (cont)EXAMPLE OF PRA (cont)
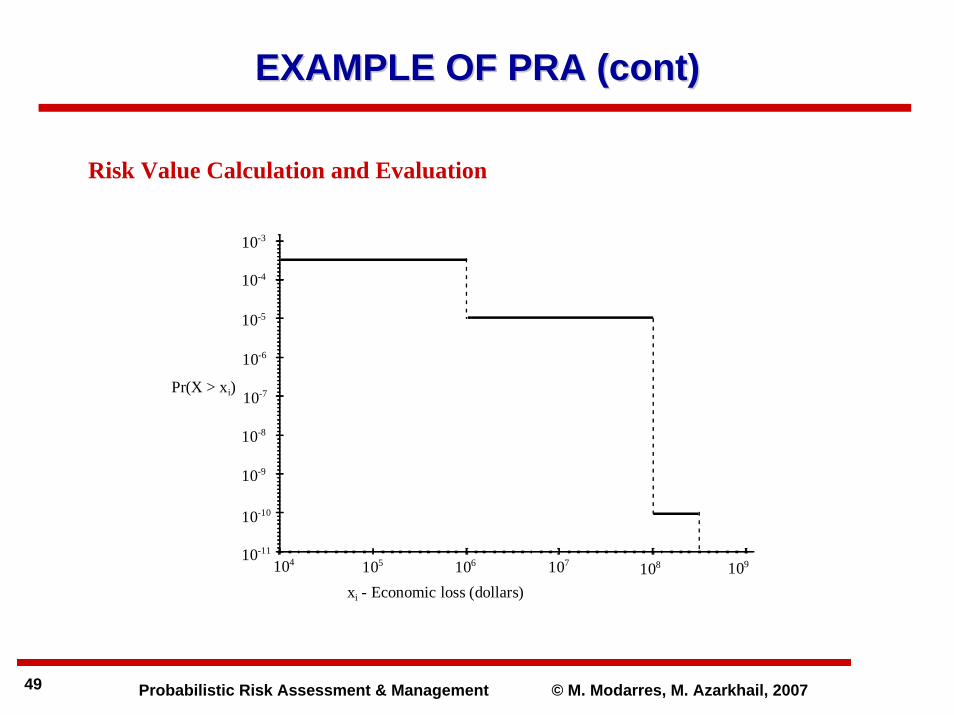
Risk Value Calculation and Evaluation
10810510-11
10-10
10-9
10-8
10-7
10-6
10-5
10-4
10-3
104 106 107
xi - Economic loss (dollars)
Pr(X > xi)
109
Probabilistic Risk Assessment & Management © M. Modarres, M. Azarkhail, 200750
RISK MANAGEMENTRISK MANAGEMENT
&&
DECISION MAKING TECHNIQUESDECISION MAKING TECHNIQUES
Probabilistic Risk Assessment & Management © M. Modarres, M. Azarkhail, 200751
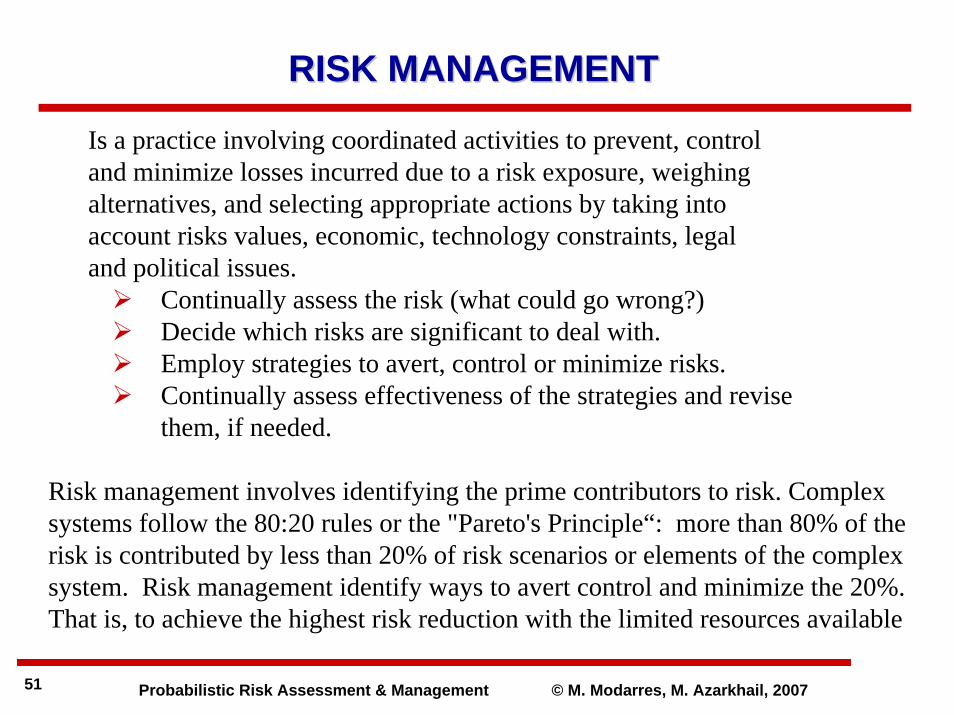
Continually assess the risk (what could go wrong?)Decide which risks are significant to deal with.Employ strategies to avert, control or minimize risks.Continually assess effectiveness of the strategies and revise them, if needed.
Is a practice involving coordinated activities to prevent, control and minimize losses incurred due to a risk exposure, weighing alternatives, and selecting appropriate actions by taking into account risks values, economic, technology constraints, legal and political issues.
RISK MANAGEMENTRISK MANAGEMENT
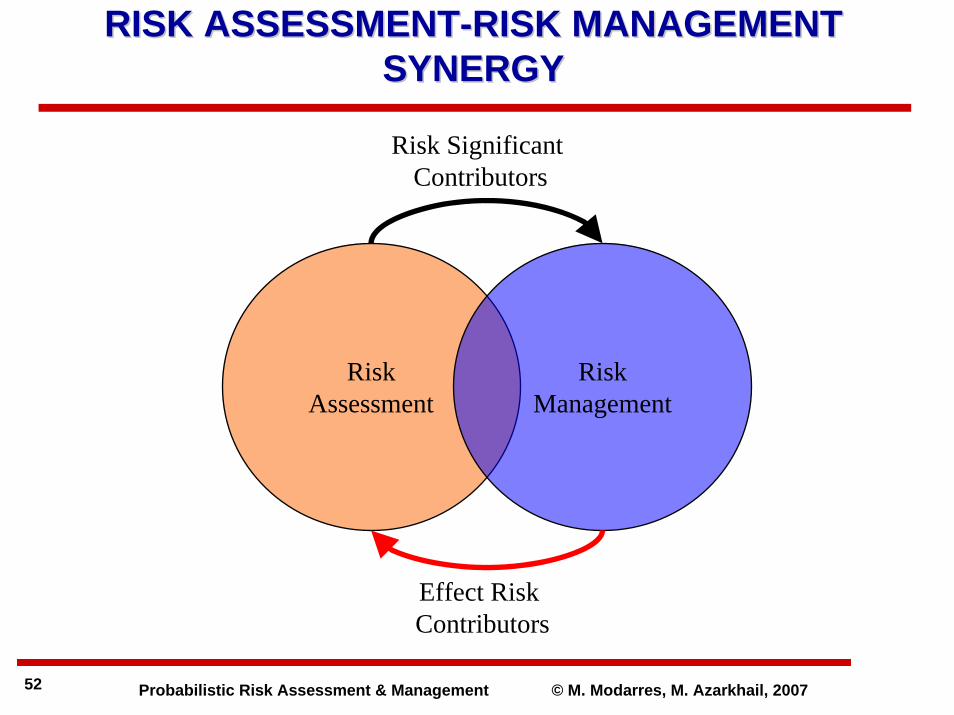
Risk management involves identifying the prime contributors to risk. Complex systems follow the 80:20 rules or the "Pareto's Principle“: more than 80% of the risk is contributed by less than 20% of risk scenarios or elements of the complex system. Risk management identify ways to avert control and minimize the 20%. That is, to achieve the highest risk reduction with the limited resources available
Probabilistic Risk Assessment & Management © M. Modarres, M. Azarkhail, 200752
RISK ASSESSMENTRISK ASSESSMENT--RISK MANAGEMENT RISK MANAGEMENT SYNERGYSYNERGY
RiskAssessment
RiskManagement
Risk SignificantContributors
Effect Risk Contributors
Probabilistic Risk Assessment & Management © M. Modarres, M. Azarkhail, 200753
Cost-Benefit
Cost-Effectiveness
Risk-Effectiveness Analysis
ECONOMIC METHODS IN RISK ANALYSISECONOMIC METHODS IN RISK ANALYSIS

Probabilistic Risk Assessment & Management © M. Modarres, M. Azarkhail, 200754
(As applied to Risk Management)
Risks are controlled (risk aversion) by reducing probability that a causative event will occurs or by minimizing exposure pathways.
Causative Control - quit smoking to avoid cancer, or use filtered cigarettes to hopefully reduce amount of cancer causing agent.
On the other hand smoking for example has both voluntary (smoker) and involuntary (premature death of the smoker or potential injuries to the passive smokers) risks.
Should risks and risk causing activities be regulated? When?
Cost-Benefit: (a measure of acceptability of risk)
Loss-Gain: So as to have one scale of measurement (for example $ or FLU)
COSTCOST--BENEFIT METHODBENEFIT METHOD
Probabilistic Risk Assessment & Management © M. Modarres, M. Azarkhail, 200755
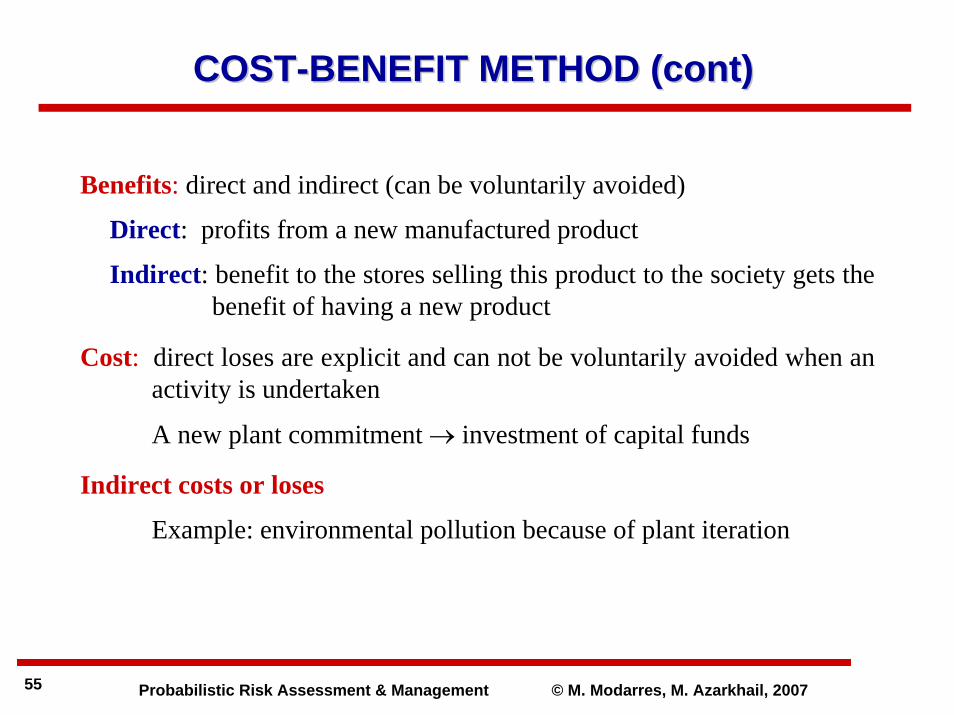
Benefits: direct and indirect (can be voluntarily avoided)
Direct: profits from a new manufactured product
Indirect: benefit to the stores selling this product to the society gets the benefit of having a new product
Cost: direct loses are explicit and can not be voluntarily avoided when an activity is undertaken
A new plant commitment → investment of capital funds
Indirect costs or loses
Example: environmental pollution because of plant iteration
COSTCOST--BENEFIT METHOD (cont)BENEFIT METHOD (cont)
Probabilistic Risk Assessment & Management © M. Modarres, M. Azarkhail, 200756
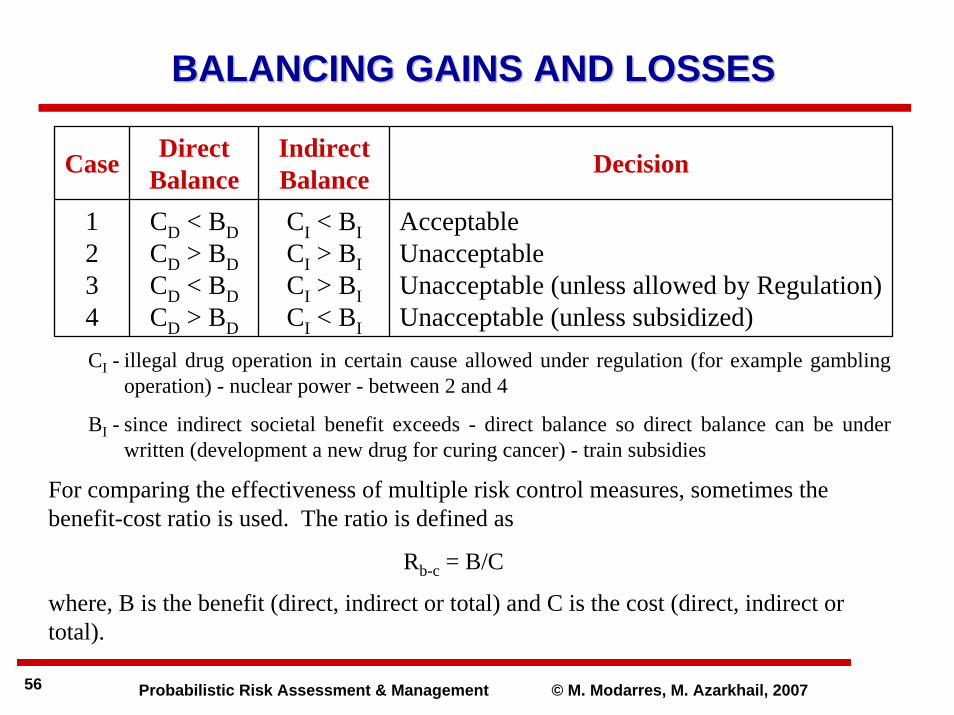
CI - illegal drug operation in certain cause allowed under regulation (for example gambling operation) - nuclear power - between 2 and 4
BI - since indirect societal benefit exceeds - direct balance so direct balance can be under written (development a new drug for curing cancer) - train subsidies
Case DirectBalance
IndirectBalance Decision
1234
CD < BDCD > BDCD < BDCD > BD
CI < BICI > BICI > BICI < BI
AcceptableUnacceptableUnacceptable (unless allowed by Regulation)Unacceptable (unless subsidized)
For comparing the effectiveness of multiple risk control measures, sometimes the benefit-cost ratio is used. The ratio is defined as
Rb-c = B/C
where, B is the benefit (direct, indirect or total) and C is the cost (direct, indirect or total).
BALANCING GAINS AND LOSSESBALANCING GAINS AND LOSSES
Probabilistic Risk Assessment & Management © M. Modarres, M. Azarkhail, 200757
Problem arises when using only analytical balance instead of subjective balance combination of both would be desirables
Example: Benefits are not always transferred to those receiving risk. So involuntary risk exist. For example, people near airport bear ahigh level of noise but they usually use airport least.
Therefore groups receiving risk and benefit must be clearly identified.
– short term benefits and long terms loses. Difficult to consider not good techniques exist for discounting future risk. On the other hand the reverse (short term risk and long term benefits) are more recognized to the society and more favorably accepted.
COSTCOST--BENEFIT METHOD (cont)BENEFIT METHOD (cont)

Probabilistic Risk Assessment & Management © M. Modarres, M. Azarkhail, 200758
The case in question involves a scenario involving fuel tank side impacts in traffic accidents involving a particular design of pickup truck that may lead to explosions and fire-related injuries. The manufacturer is considering three risk reduction options. Determine the benefit-to-cost ratios for each design option. The data apply to reduction or prevention. The following risk reduction options are considered:
Option 1: Install a protective steel plate. Cost $14. This will effectively prevent all explosions.
Option 2: Install a Lexan plastic plate. Cost $4. This will prevent 95% of explosions.
Option 3: Install a plastic lining inside the fuel tank. Cost $2. This will prevent 85% of explosions.
EXAMPLE 1: COSTEXAMPLE 1: COST--BENEFIT METHODBENEFIT METHOD
Probabilistic Risk Assessment & Management © M. Modarres, M. Azarkhail, 200759
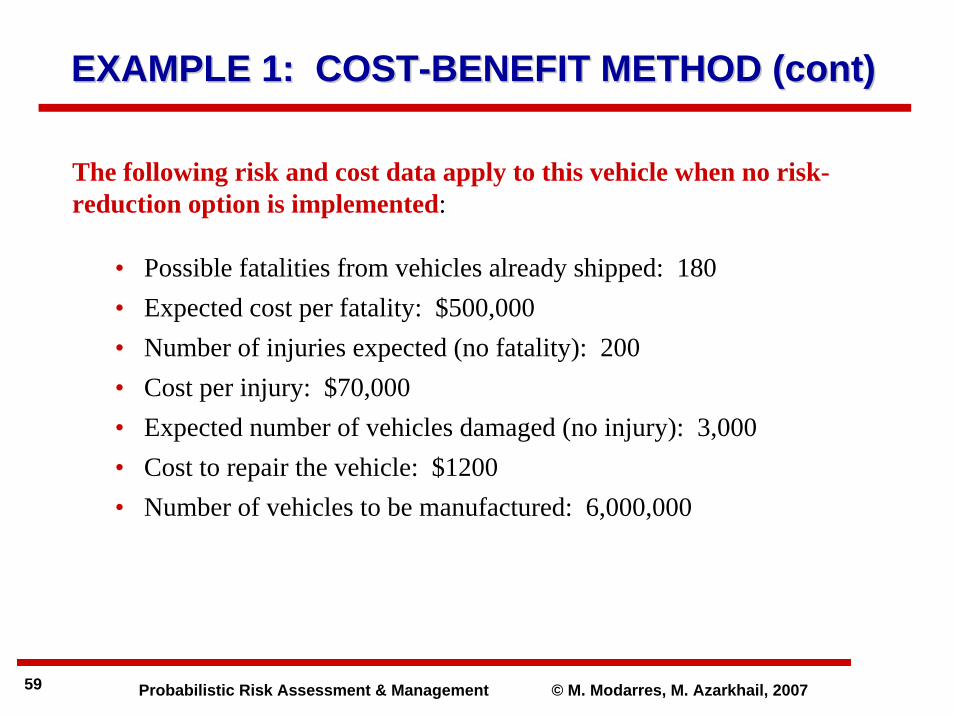
The following risk and cost data apply to this vehicle when no risk-reduction option is implemented:
• Possible fatalities from vehicles already shipped: 180• Expected cost per fatality: $500,000• Number of injuries expected (no fatality): 200• Cost per injury: $70,000• Expected number of vehicles damaged (no injury): 3,000• Cost to repair the vehicle: $1200• Number of vehicles to be manufactured: 6,000,000
EXAMPLE 1: COSTEXAMPLE 1: COST--BENEFIT METHOD (cont)BENEFIT METHOD (cont)

Probabilistic Risk Assessment & Management © M. Modarres, M. Azarkhail, 200760
Solution:
The cost for each option is the cost of implementing the change. The benefits are in terms of lives saved and avoidance of injury and damage.
Option 1:
Cost = $14 x 6,000,000 vehicles = $84,000,000
Benefits = (180 lives saved)($500,000) + (200 injuries prevented)
x ($70,000) + (3000 damaged vehicles prevented)($1200)
= $107,600,000
R = $107,600,000/ $84,000,000 = 1.28
EXAMPLE 1: COSTEXAMPLE 1: COST--BENEFIT METHOD (cont)BENEFIT METHOD (cont)
Probabilistic Risk Assessment & Management © M. Modarres, M. Azarkhail, 200761
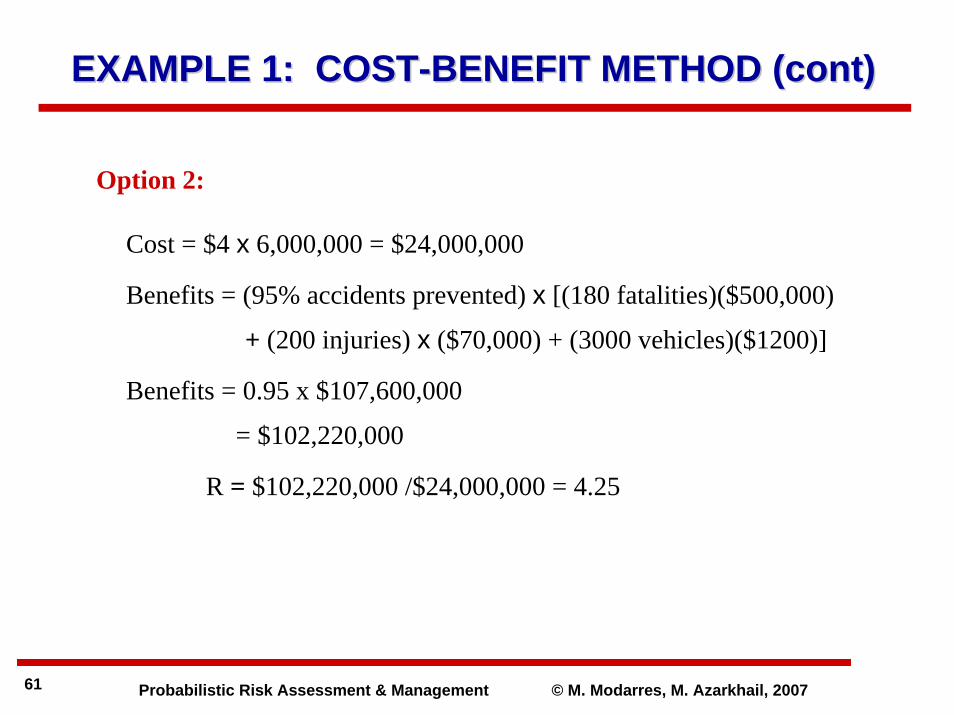
Option 2:
Cost = $4 x 6,000,000 = $24,000,000
Benefits = (95% accidents prevented) x [(180 fatalities)($500,000)
+ (200 injuries) x ($70,000) + (3000 vehicles)($1200)]
Benefits = 0.95 x $107,600,000
= $102,220,000
R = $102,220,000 /$24,000,000 = 4.25
EXAMPLE 1: COSTEXAMPLE 1: COST--BENEFIT METHOD (cont)BENEFIT METHOD (cont)
Probabilistic Risk Assessment & Management © M. Modarres, M. Azarkhail, 200762
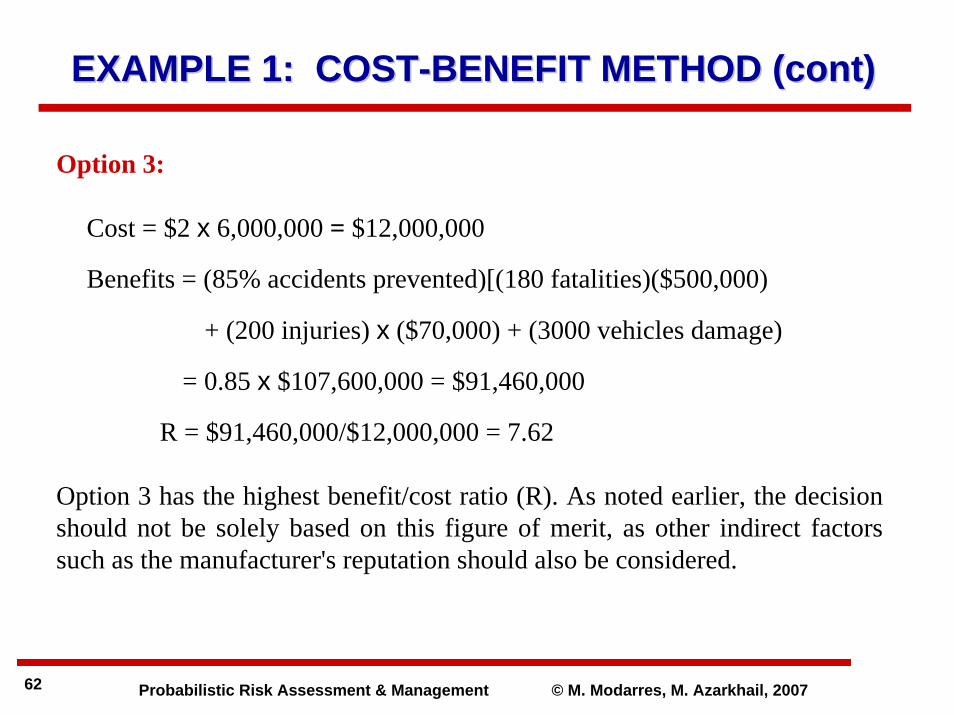
Option 3:
Cost = $2 x 6,000,000 = $12,000,000
Benefits = (85% accidents prevented)[(180 fatalities)($500,000)
+ (200 injuries) x ($70,000) + (3000 vehicles damage)
= 0.85 x $107,600,000 = $91,460,000
R = $91,460,000/$12,000,000 = 7.62
Option 3 has the highest benefit/cost ratio (R). As noted earlier, the decision should not be solely based on this figure of merit, as other indirect factors such as the manufacturer's reputation should also be considered.
EXAMPLE 1: COSTEXAMPLE 1: COST--BENEFIT METHOD (cont)BENEFIT METHOD (cont)

Probabilistic Risk Assessment & Management © M. Modarres, M. Azarkhail, 200763
Decision Trees are good for helping a risk manager to choose between several courses of risk control actions. They are highly effective structures within which one can lay out risk control solutions and investigate the possible outcomes of choosing such solutions
Set of possibledecisions
Decisions node
Set of possibleoutcomes
Chance node
DECISION TREE ANALYSISDECISION TREE ANALYSIS
Probabilistic Risk Assessment & Management © M. Modarres, M. Azarkhail, 200764
3
5
No Develop
Developpolyester
Superiorto Nylon
Inferiorto Nylon
0.8
0.2
0.8
Do not Launch
-5.0
Launch-5.9
Competing
0.3
0.7
No Competing
Not Launch
Launch24
24 0.3
0.7
No Competing
Competing10
30
-5
-15
-2
-5
0
0.91
1
0.52
0
0.63
0.52
0.69
6
2
41
Outcome
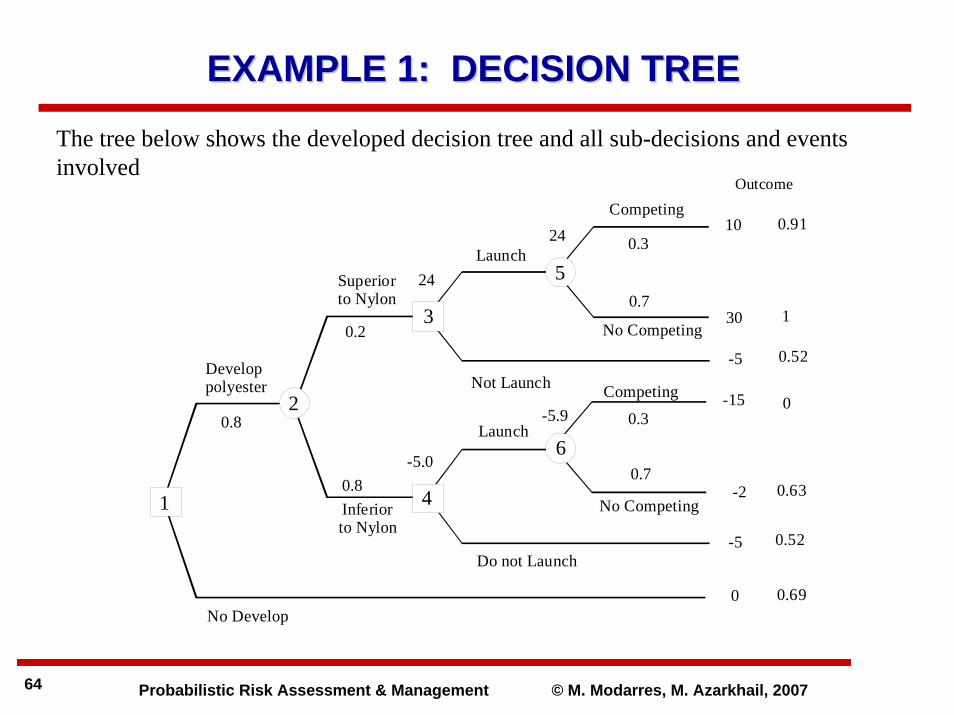
The tree below shows the developed decision tree and all sub-decisions and events involved
EXAMPLE 1: DECISION TREEEXAMPLE 1: DECISION TREE
Probabilistic Risk Assessment & Management © M. Modarres, M. Azarkhail, 200765
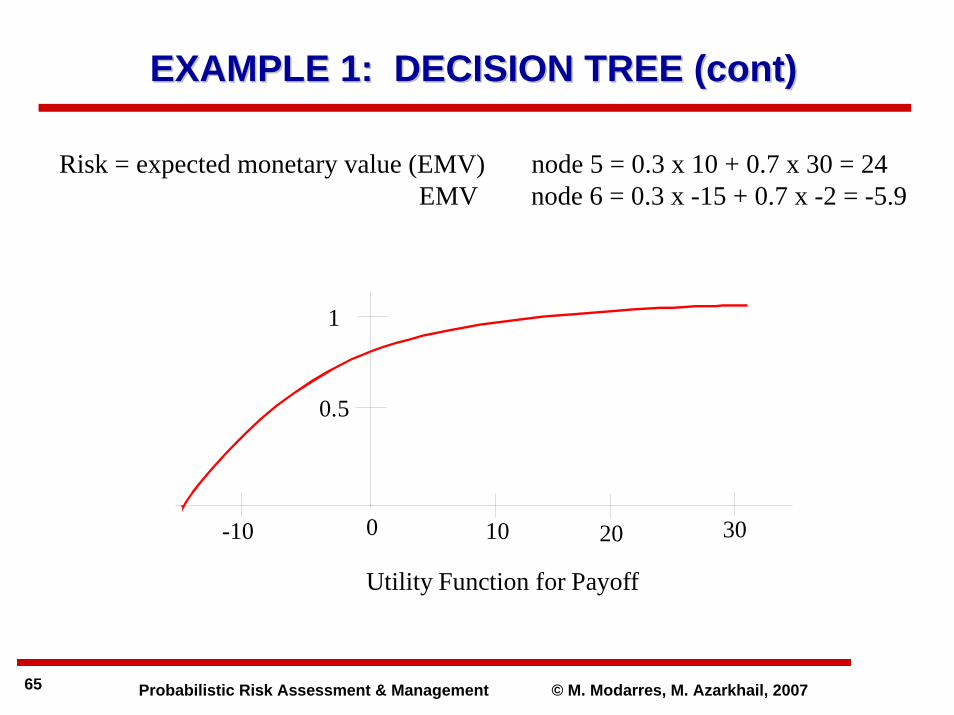
Risk = expected monetary value (EMV) node 5 = 0.3 x 10 + 0.7 x 30 = 24EMV node 6 = 0.3 x -15 + 0.7 x -2 = -5.9
EXAMPLE 1: DECISION TREE (cont)EXAMPLE 1: DECISION TREE (cont)
-10
1
10
0.5
0 20 30
Utility Function for Payoff
Probabilistic Risk Assessment & Management © M. Modarres, M. Azarkhail, 200766
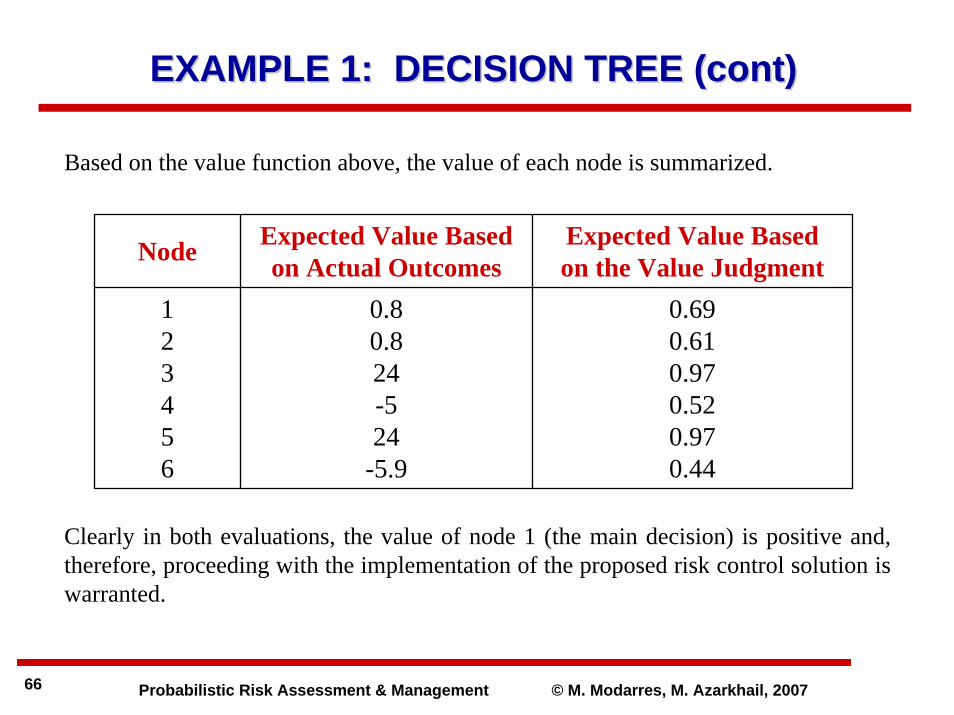
Based on the value function above, the value of each node is summarized.
Clearly in both evaluations, the value of node 1 (the main decision) is positive and, therefore, proceeding with the implementation of the proposed risk control solution is warranted.
Node Expected Value Basedon Actual Outcomes
Expected Value Basedon the Value Judgment
123456
0.80.824-524
-5.9
0.690.610.970.520.970.44
EXAMPLE 1: DECISION TREE (cont)EXAMPLE 1: DECISION TREE (cont)
Probabilistic Risk Assessment & Management © M. Modarres, M. Azarkhail, 200767
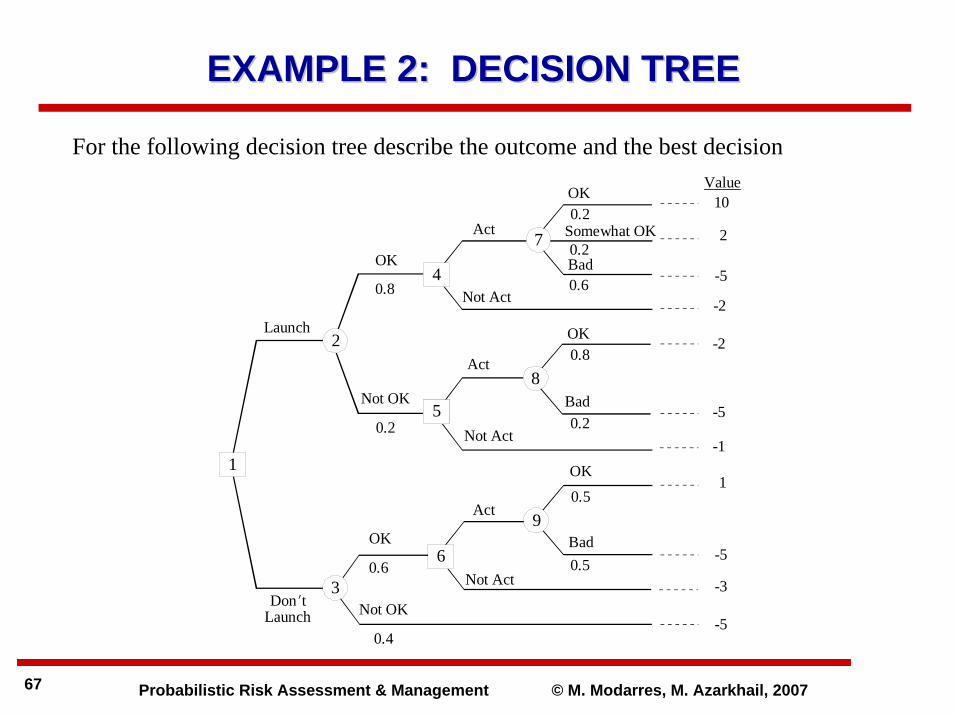
For the following decision tree describe the outcome and the best decision
DonNtLaunch
Launch
OK 0.8
Not OK
0.2
Act
Bad
Somewhat OK
Not Act
Act
Not Act
OK
OK
Bad
Bad
OK 0.6
Not OK
0.4
Not Act
OK 10
1
-5
-2
-2
-5
-1
-5
-3
-5
20.2
0.2
0.6
0.8
0.2
0.5
0.5
1
2
3
4
5
1
6
7
9
8
Value
Act
EXAMPLE 2: DECISION TREEEXAMPLE 2: DECISION TREE
Probabilistic Risk Assessment & Management © M. Modarres, M. Azarkhail, 200768
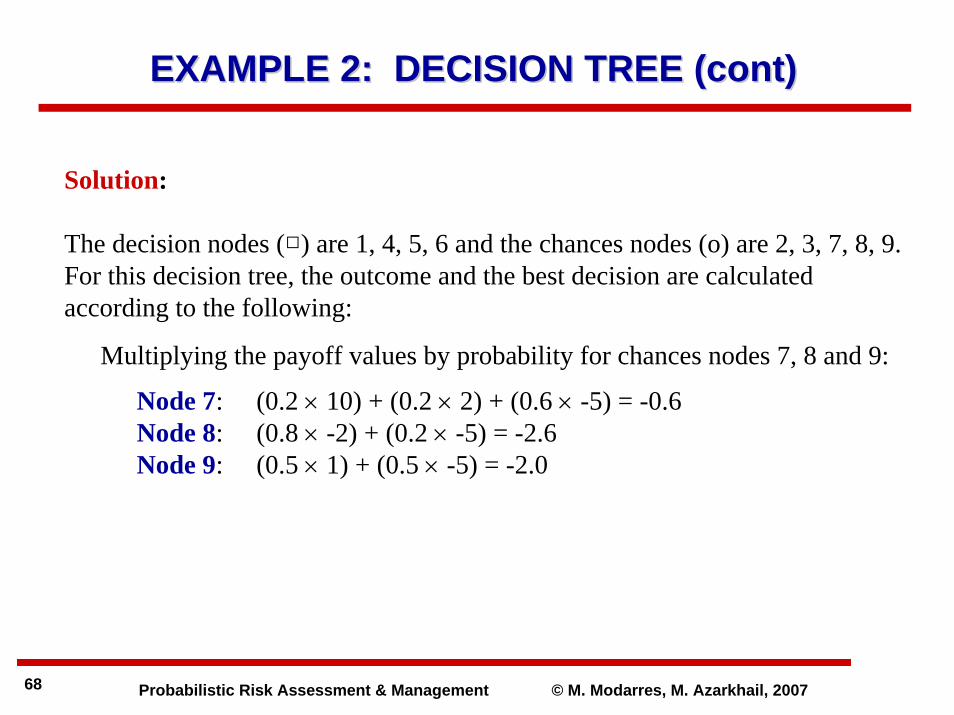
Solution:
The decision nodes (□) are 1, 4, 5, 6 and the chances nodes (o) are 2, 3, 7, 8, 9. For this decision tree, the outcome and the best decision are calculated according to the following:
Multiplying the payoff values by probability for chances nodes 7, 8 and 9:
Node 7: (0.2 × 10) + (0.2 × 2) + (0.6 × -5) = -0.6Node 8: (0.8 × -2) + (0.2 × -5) = -2.6Node 9: (0.5 × 1) + (0.5 × -5) = -2.0
EXAMPLE 2: DECISION TREE (cont)EXAMPLE 2: DECISION TREE (cont)
Probabilistic Risk Assessment & Management © M. Modarres, M. Azarkhail, 200769
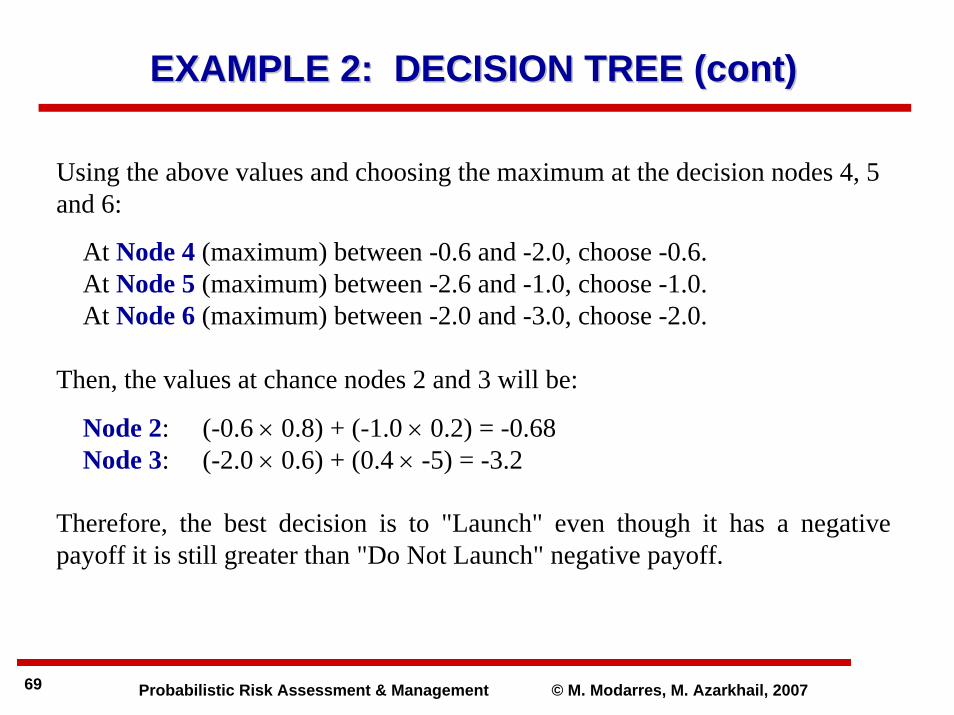
Using the above values and choosing the maximum at the decision nodes 4, 5 and 6:
At Node 4 (maximum) between -0.6 and -2.0, choose -0.6.At Node 5 (maximum) between -2.6 and -1.0, choose -1.0.At Node 6 (maximum) between -2.0 and -3.0, choose -2.0.
Then, the values at chance nodes 2 and 3 will be:
Node 2: (-0.6 × 0.8) + (-1.0 × 0.2) = -0.68Node 3: (-2.0 × 0.6) + (0.4 × -5) = -3.2
Therefore, the best decision is to "Launch" even though it has a negative payoff it is still greater than "Do Not Launch" negative payoff.
EXAMPLE 2: DECISION TREE (cont)EXAMPLE 2: DECISION TREE (cont)
Probabilistic Risk Assessment & Management © M. Modarres, M. Azarkhail, 200770
Decision trees provide an effective method for policy and other decision making problems because they:
• clearly lay out the problem so that all options can be evaluated, • analyze fully the possible consequences of a decision, • provide a framework to quantify the values of outcomes and the
probabilities of achieving them, and • help to make the best decisions on the basis of existing information and
best guesses.
As with all decision making methods, decision tree analysis should be used in combination with common sense, as decision trees are just one part of the actual risk management and control decision.
REMARKS ON DECISION TREES REMARKS ON DECISION TREES

END OF LECTUREEND OF LECTURE