pro-poor growth in senegal...
TRANSCRIPT
8/11/2004 1
Pro-Poor Growth in Senegal
by
Jean-Paul Azama,b and Magueye Diaa.
a: University of Toulouse (ARQADE)
b: Institut Universitaire de France and IDEI.
1. Introduction
Senegal is a typical example of a slow-growth/high stability economy, like many
others in the CFA Zone. This economy shares some of the features of the Sahelian countries,
like its agriculture dominated by groundnut exports, and frequent droughts. Nevertheless,
its coastal position gives it a definite advantage for industrial development. It is the closest
Sub-Saharan African economy to the main European markets by sea. This has also given rise
to a long tradition of out-migration, with a resulting large inflow of remittances (Manchuelle,
1997). Hence, many non agricultural sources of income have allowed this country to be one
of the most urbanized one in Africa, with almost 50 % of its population living in the urban
sector. Its capital city, Dakar, was the capital city of the French AOF (Afrique Occidentale
Française), in the colonial days, and still plays a prominent role in the UEMOA (West African
Economic and Monetary Union). It hosts in particular the headquarters of the BCEAO
(Central Bank of West African States). Being a medium-sized country, by the standards of
West Africa, Senegal reflects quite accurately the evolutions of the UEMOA economies, as far
as its macroeconomic experience is concerned, without affecting them much in return.
Nevertheless, its relatively high level of industrial development and of urbanization give this
country some relevant idiosyncratic features. In particular, in contrast to many neighboring
countries, agriculture plays here a secondary role in determining growth, while
manufacturing and services are playing a central part.
8/11/2004 2
Moreover, it is by far the most democratic country of the region, with competitive
elections taking place on schedule with very limited violence (Ka and Van de Walle, 1994,
Azam, Dia and N’Guessan, 2002). The first two presidents after independence, Leopold
Senghor and Abdou Diouf were members of the socialist party. However, the latter was a
more technocratic “modernizer” than the poet-president Senghor, whose development
strategy was more focused on cementing national unity through a clientelist regime than on
the development of an efficient economy. Until 1993, the ballot was not really secret, and a
lot of social pressure were exerted on the voters, especially in the groundnut basin (Schaffer,
1998). There, the Mouride brotherhood was controlling the votes, and benefited from a long-
lasting clientelistic relationship with the government (Boone, 2003). The re-introduction of
the secret ballot in 1993 improved the working of the democratic institutions. The last
presidential elections saw the replacement of the socialist Abdou Diouf by the liberal
Abdoulaye Wade, who took over in April 2000.
The only serious stain on the democratic reputation of the Senegalese government
since independence has been the problem of lower Casamance (Boone, 2003). This region is
predominantly peopled by an ethnic minority, the Diola, whose social system is very
different from the hierarchical Sahelian social organization characteristic of the other ethnic
groups. The latter is based on a typical caste system, with a well-defined ruling elite. The
numerically dominant Wolof group is already marginally different from the typical Sahelian
type. Their religious leaders have overthrown the traditional aristocracy in the course of the
18th century, giving rise to the current domination by the Sufi brotherhoods. But the Diola,
like the smaller groups also present in the area, are radically different. They have no
traditional hierarchy, and are resisting any type of authority. The Muslim brotherhoods,
which play a crucial role in the political control of the rest of the country, are powerless in
this region. There is thus no basis on which the typical African system of political
management, relying on the co-optation of the traditional elite into the government-
sponsored clientelistic system, can be grafted onto such an ethnic group (Boone, 2003). The
attempts made by the different governments in Dakar to control administratively this area,
with an increasing military presence, ended up in a low-intensity civil war. Many civilians
8/11/2004 3
were killed by both sides in the 1980s and 1990s. Hence, this potentially rich region, fit for
export agriculture as well as for tourism and fishery, has remained relatively under-
developed. A peace agreement has been signed in March 2001, but lower Casamance is the
region of Senegal with the highest incidence of poverty (République du Sénégal, 2004).
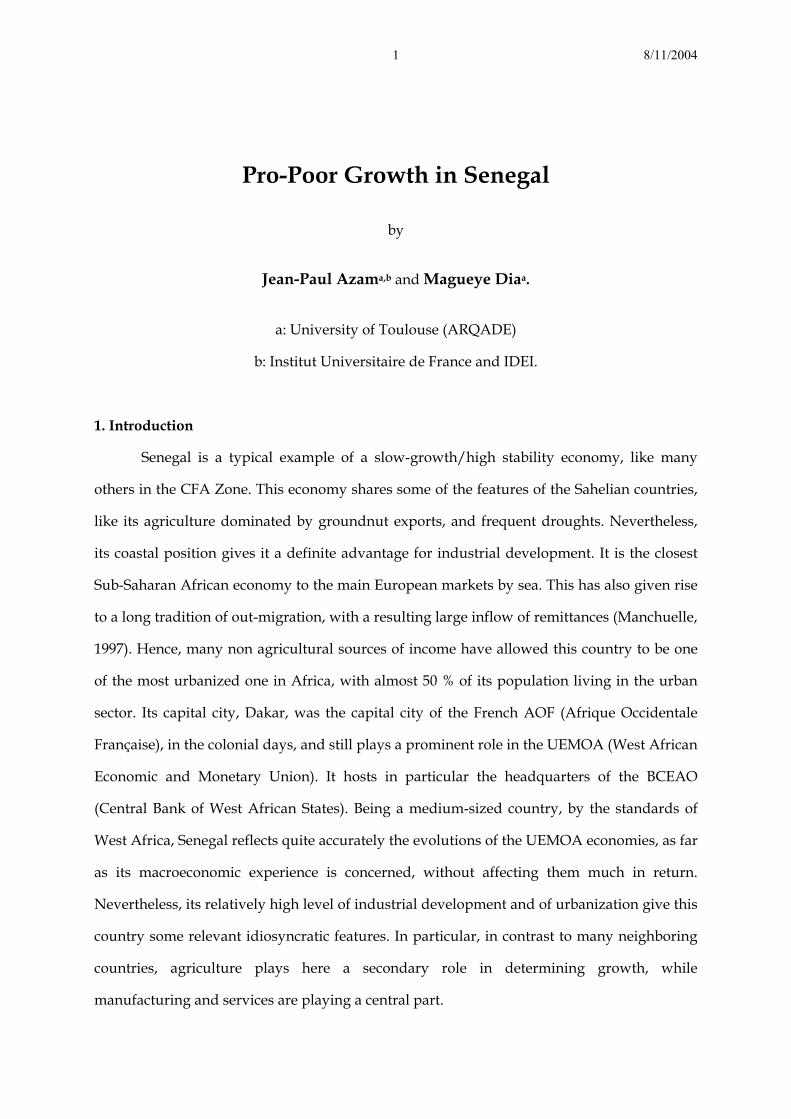
The present paper aims at analyzing Senegal’s growth experience over the last two
decades, with a focus on its impact on the poor. This experience reflects very largely that of
the UEMOA, beside some idiosyncrasy mentioned above. Therefore, the major
macroeconomic event that took place over this period is the 1994 devaluation of the CFA
franc. In many respects, this draws a clear dividing line between a “before” and an “after”,
i.e. two periods characterized by a very different macroeconomic adjustment strategy. -
-0.10
0.05
0.00
0.05
0.10
0.15
75 80 85 90 95 00
Post-DevaluationBoom
- - - - - - - - - - - - - - - - - - - - - - - - - - - - - - - - - - - - - - - - - - - - -
Dro
ught
Dro
ught
StructuralAdjustment
Figure 1: Senegal’s Growth Experience 1974-2002
(% per annum)
Figure 1 depicts the growth experience of Senegal over the last three decades or so.
Three phases can clearly be identified: (i) the instability phase, until 1984, (ii) the “real-side”
structural adjustment phase, 1985-93, and (iii) the post-devaluation boom. Hence, the
devaluation was a clear success, from a macroeconomic viewpoint, as it entailed a significant
turnaround from low and unstable growth to a sustained boom. The instability phase is
marked by a series of external shocks, including the groundnuts and phosphates boom, in
8/11/2004 4
the wake of the 1974 oil shock (Azam and Chambas, 1999). The subsequent downturn is
punctuated by two severe drought periods, in 1978 and in 1983-84, as well as by the world
recession of 1980-81. Although Senegal implemented a first stabilization plan as early as
1979, with some support from the Bretton Woods institutions, it is not until 1985 that the
government got seriously involved in the adjustment effort (Rouis, 1994, Ka and Van de
Walle, 1994). Moreover, a serious banking crisis occurred all across the UEMOA in 1987 and
1988, which seems to have given a “wake-up call” to the political elite of the Zone, entailing
the emergence of a genuine “ownership of reforms” in some of these countries (Azam, Biais
and Dia, 2004). As a result, structural adjustment really got started in Senegal in the late
1980s, and included among other reforms the privatization of several parastatals (Azam, Dia
and N’Guessan, 2002).
However, in most countries of the CFA Zone, the main problem of the “real-side”
adjustment policy (i.e. without changing the exchange rate) was the inability of the
governments to cut significantly their wage bills. The wages and salaries of the civil servants
and the public sector employees have been cut only in some countries, during that period,
and only by a marginal percentage. The high level of these wages was correctly perceived as
the main adjustment problem by many analysts (e.g. van de Walle, 1991, Azam, 1995, Rama,
1997). This problem had two important dimensions. One was that the government wage bill
was then consuming an excessive share of fiscal resources, while these wages were also
exerting a strong influence on those of the formal sector. Rama (1997) has shown how the
wage rates in the civil service and the public sector play a leading role in the determination
of the cost of labor for the whole formal sector, and are thus affecting significantly its
competitiveness.
Unfortunately, while reforms were seriously starting in some of the countries of the
Zone, the terms of trade of the most important CFA economies deteriorated markedly, and
so for several years, from 1987 on (Azam, 1997). In particular, the terms of trade of Côte
d’Ivoire deteriorated severely, with a depressing influence on the whole UEMOA area (then
UMOA). The early 1990s thus witnessed a relatively disappointing growth experience, which
ended up in a serious recession in 1993, affecting more or less the whole UEMOA zone.
8/11/2004 5
Together with some uninspired policy decisions, which are spelt out in Azam (1997), this
made the 1994 devaluation unavoidable. The latter had been postponed for a long period,
and was largely anticipated by the relevant agents in the area.
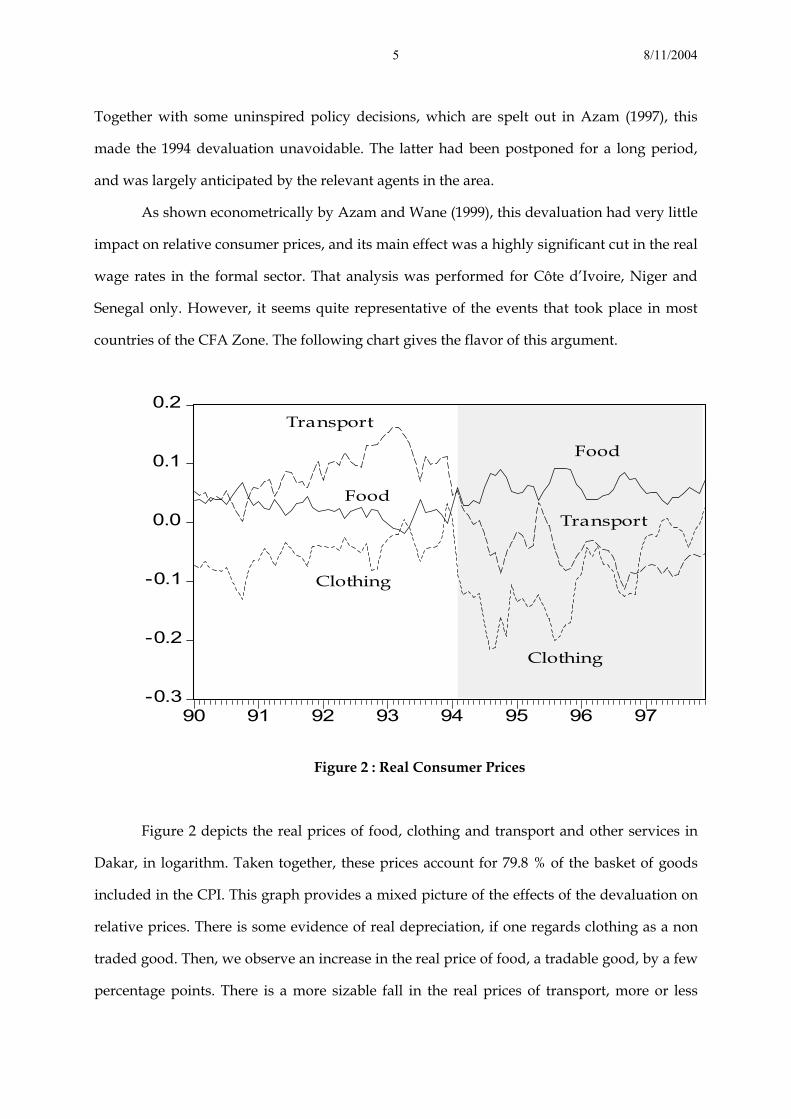
As shown econometrically by Azam and Wane (1999), this devaluation had very little
impact on relative consumer prices, and its main effect was a highly significant cut in the real
wage rates in the formal sector. That analysis was performed for Côte d’Ivoire, Niger and
Senegal only. However, it seems quite representative of the events that took place in most
countries of the CFA Zone. The following chart gives the flavor of this argument.
-0.3
-0.2
-0.1
0.0
0.1
0.2
90 91 92 93 94 95 96 97
Food
Clothing
Transport
Transport
Food
Clothing
Figure 2 : Real Consumer Prices
Figure 2 depicts the real prices of food, clothing and transport and other services in
Dakar, in logarithm. Taken together, these prices account for 79.8 % of the basket of goods
included in the CPI. This graph provides a mixed picture of the effects of the devaluation on
relative prices. There is some evidence of real depreciation, if one regards clothing as a non
traded good. Then, we observe an increase in the real price of food, a tradable good, by a few
percentage points. There is a more sizable fall in the real prices of transport, more or less
8/11/2004 6
representative of the non tradable service sector, by about 10 %. A similar fall had taken
place just before the devaluation. However, the real price of clothing goes even further
down, by more than 10 %, while it is hard to believe that this is really a non traded good.
May be the trading margins are the dominant component of the price of clothing, explaining
this real fall. However, the clothes “made in Sandaga”, the Dakar clothes-producing informal
sector, can be found all over West Africa. Moreover, the transport index is in fact mainly
comprised of public transports, which account for 40 % of this item. The data show that this
is the price that mainly lagged behind inflation, because it was fully controlled. Lastly, one
observes a convergence of the food and transportation indexes at the end of the period,
suggesting that the change in relative consumer prices was over at the end of the fourth year
after the devaluation. Hence, the careful examination of these real prices suggests that too
much confidence on a story emphasizing real exchange rate adjustment would be
unwarranted. Moreover, the relative consumer price changes are at best of short duration,
and cannot explain the longer stretch of growth during the post-devaluation boom. Much
more significant is the change in real wages and salaries in the formal sector.
The formal-sector wage cut entailed unexpectedly a very profound deterioration in
the poverty situation. Azam (2004) spells out the mechanism by which this devaluation
entailed a deep increase in poverty in the urban sector, together with a milder one in the
rural sector, at least for Côte d’Ivoire and Niger.
Figure 3 helps understanding the mechanism involved. There is some evidence that
the sharp cut in real wages in the formal sector entailed by the devaluation was anticipated
to a large extent by the people concerned. The formal sector workers had accumulated some
savings out of their pre-devaluation high wages, with a view to buttress their living
standards after the shock. They had invested this money in the informal sector, and also
directly in some formal-sector firms, as they do not use the banking sector. The banking crisis
of the late 1980s shows that they were right not to trust the banks. Azam et al. (2001) have
shown that most firms in Côte d’Ivoire get credit “from friends and relatives”, rather than
from formal financial institutions, using the RPED enterprise survey performed in 1995 and
1996. This supports, from the side of the users of loanable funds, the view that the saving-

8/11/2004 7
investment process in these countries is not much intermediated by banks. This increased
investment in the informal sector had entailed an increase in the demand for labor and in the
incomes in that sector, where the number of firms, their size, and the work force had
increased significantly (Azam, 2004). Urban poverty had thus fallen in response to the
anticipated fall in the purchasing power of the formal sector wages, at least during the 1980s.
Pre-Devaluation Phase
Dis-saving
Formal-Sector Real Wages
Consumption
Saving
Time
Figure 3: Stylized Response of Saving to Anticipated Devaluation
The downturn came after the devaluation, as the latter entailed a serious cut in formal
sector incomes, as the real wages were cut significantly. Formal sector workers started to run
down their assets for consumption-smoothing purposes, with a negative impact on the
demand for labor in the informal sector, and hence on the wages prevailing there. Moreover,
some of the assets accumulated during the pre-devaluation phase were imported durable
goods, and yielded a significant capital gain as a response to the devaluation. The formal
sector workers had to run down these assets for smoothing out their consumption, thus
amplifying the negative effect on informal sector incomes. Some of this capital stock was
probably exported outside the CFA Zone, by cross-border trade. Then, as the capital stock
invested in the informal sector fell, so did the wages paid there, and then the living
standards of the workers concerned and their families.
8/11/2004 8
0.8
0.9
1.0
1.1
1.2
1.3
1.4
89 90 91 92 93 94 95 96 97 98 99 00 01
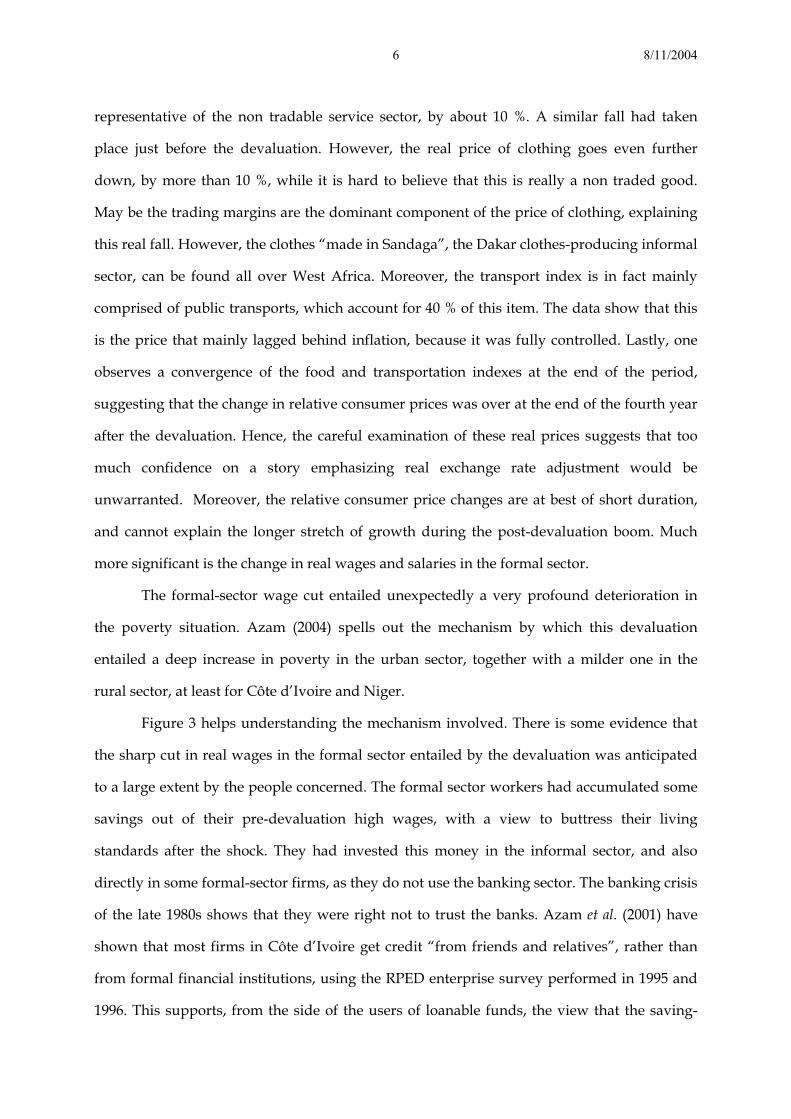
Figure 4: Real Average Wage of Civil Servants (in log)
Hence, the experience of these CFA Zone countries provides a striking example of a
short-run disconnection between growth and poverty, as poverty increased markedly, while
growth resumed at a fast pace. The analysis performed in the present paper suggests that the
validity of this effect is not confined to the cases of Côte d’Ivoire and Niger, described by
Azam (2004), and can also be observed to some extent in Senegal. Figure 4 shows the time
profile of the real average wage of civil servants in Senegal. The sharp fall entailed by the
devaluation comes out clearly, as well as the subsequent stagnation at a level close to 40 %
below its peak 1992 value. The 1994-1997 period is marked by a continuous decline, as the
devaluation was progressively affecting consumer prices, while nominal wages were fixed.
A slight recovery, by about 10 %, occurred subsequently until the year 2000. Therefore,
beside its obvious macroeconomic dimension, the 1994 devaluation is a remarkable shock
affecting the distribution of income, particularly in the urban sector. In the late 1980s, the
public sector wages were about 10 times higher than average GDP per capita, in Senegal, and
in several other UEMOA countries (Azam, 1995). It was even higher in some of them (e.g. 15
times so in Burkina Faso). This ratio fell drastically in the wake of the devaluation, as the

8/11/2004 9
public sector wages fell by about 40 %, in real terms, while GDP per capita increased
continuously by more than 2.5 % per annum.
The survey data for Senegal do not allow as thorough an analysis of the dynamics of
poverty over the relevant period as that performed on Côte d’Ivoire and Niger in the paper
described above. There are two high-quality surveys, performed in 1994/95 (ESAM 1) and in
2001 (ESAM 2), which allow for a correct poverty analysis in this country. Both of them took
place unfortunately after the devaluation had taken place. An additional survey can be used
to describe the evolution of poverty during this period, which has been performed in 1996,
and only concerns the households in Dakar. This was a survey performed simultaneously in
all the UEMOA countries, in order to harmonize the price indices. There was another survey
performed in 1991, but it does not allow for a rigorous analysis of poverty for that year,
because the questions relating to home-produced food and other consumption stuff have
been removed from the questionnaire at the last minute. This decision was unfortunately
imposed on the local authorities. Nevertheless, a poverty profile was sketched on the basis of
this deficient data set (World Bank, 1993). The main author of the present paper was
involved in this exercise, which involved quite a lot of guess work, as a consultant for the
World Bank. We cautiously use this information below, keeping in mind that its reliability is
far from secure. Hence, our analysis of the dynamics of poverty over the 1990s has to start
from a fairly insecure base. Nevertheless, we know that the estimated incomes in this 1991
survey are likely to be underestimated, and due account can be taken of this fact.
By and large, these data sets allow to vindicate in the case of Senegal most of the
analysis sketched above, concerning Côte d’Ivoire and Niger. The only uncertain phase is the
pre-devaluation one, where the data imperfection is clouding the message to some extent.
This does not concern the post-devaluation phase, which provides a very clear time profile of
poverty dynamics. The next section shows that the response of poverty to the fast recovery of
growth was significantly positive over the medium run. However, as suggested by the
analysis sketched above, this response was substantially delayed. At least three years of
poverty deepening followed the devaluation, before the sustained GDP growth started to
pull massively people out of poverty. This delay, and its consequences for the changes in
8/11/2004 10
poverty, as perceived by households, and thus by voters, is discussed at length in section 4.
The next two sections focus on the medium-term dynamics, where growth and poverty
reduction work in the expected direction.
As shown above at figure 1, the post-devaluation boom was remarkably long lasting.
In particular, together with Benin, another democratic regime among the UEMOA countries,
Senegal did not experience the recession of the year 2000 that plagued the economies of the
zone. Section 3 shows that a public investment boom, made possible by the improved
budgetary situation entailed by the devaluation, played a crucial part in boosting growth
and keeping it going after 1997. It is only after this additional impulse was given by the
government that private investment picked up significantly, turning the post-devaluation
boom into a lasting growth episode. Hence, the expected competitive effect of the
devaluation did not materialize entirely, as export agriculture did not respond as expected,
as its share in GDP shrunk. In the meantime, its fiscal effect played the central part, through
the fall in the real value of the government wage bill, which in turn freed the resources that
financed the increased public investment. Section 4 discusses the main trade off between
growth and poverty identified above, namely the inter-temporal issue of increased poverty
now versus reduced poverty later, and the lack of response of perceived poverty, while
section 5 concludes.
2. The Response of Poverty to Sustained Growth
Over the last two decades or so, poverty has most certainly decreased significantly in
Senegal. It is not possible to support this view by using household survey data before 1991.
That year, the first large-scale household survey was performed by the statistical
department, with some support by the World Bank. A so-called priority survey was then
performed, within the framework of the “Social Dimension of Adjustment” program.
Unfortunately, home-produced consumption was not correctly estimated at the time, as
mentioned above, which makes the resulting data set less than fully satisfactory as a basis for
poverty analysis. Quite a lot of guesswork was involved at that time in producing a poverty
profile from this source (World Bank, 1993). Nevertheless, we use this survey as the starting
8/11/2004 11
point of our analysis in the following. One should, however, keep in mind that consumption,
and hence income, is most probably underestimated for that year, especially for some of the
poorest households. This is particularly true for agricultural households, who produce and
consume at home quite a large share of their income. This is also true of a large number of
other households, even in urban area, for whom a large share of their consumption is not
purchased in the market.
Keeping this caveat in mind, it seems nevertheless that poverty went down over that
decade. This comes out very clearly from the following three charts. These curves represent
the average growth rate of income for each percentile of the population, in real terms. As
usual in poverty studies, income is here measured by consumption per equivalent adult, and
growth is computed at constant prices. Here, the year 1996 has been chosen as the base year
for the price index. These growth incidence curves are derived from the theoretical
framework established by Ravallion and Chen (2003). The y axis measures the cumulated
growth in income over that period for each percentile, the latter being measured along the x
axis. The cumulative growth represented on the y axis can easily be turned into a per annum
average by dividing by the corresponding number of years. However, the cumulative
percentage is more relevant when comparing time periods of different duration. Then, the
change in poverty can be read off this diagram directly, given the poverty line. The added
advantage of these growth incidence curves is that the diagnosis about the change in poverty
can be made most of the time even without reference to any precise poverty line, because of
stochastic dominance.
Pro-Poor Growth over the 1991-2001 Decade
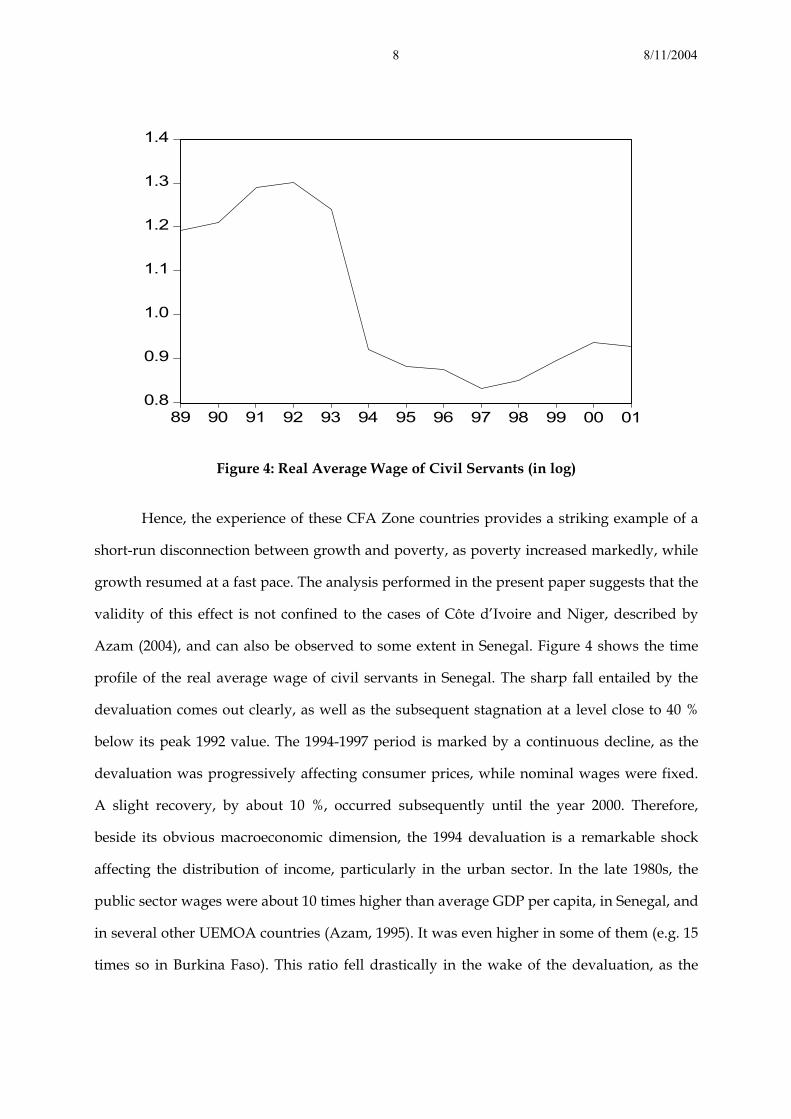
Figure 5 represents the growth incidence curve for Dakar, over the period 1991-2001.
This is probably the place where home-produced consumption plays the smallest part, as
transactions are very largely effected in monetary terms in the capital city. The curve
suggests that income growth has been positive for about 85 % of the population. Hence,
whatever the chosen poverty line, within a reasonable range, we can conclude that poverty
has most probably fallen, as the upper 15 to 20 % of the population, the only ones for whom
income has fallen, are not concerned by poverty. This curve also suggests that growth has

8/11/2004 12
been equalizing, as the very high percentiles witnessed a fall in income, while the growth
incidence curve is downwards sloping over the whole range. This reflects to some extent the
effect of the devaluation on the real incomes of the formal sector workers, whose purchasing
power has been eroded as described above. Nevertheless, one should bear in mind the caveat
spelt out above, as the underestimation of initial income described above should be larger for
the poorest households, and hence their income growth might be more significantly
overestimated than that of the other households.
Growth incidence curve for Dakar, 1991-2001
-80
-60
-40
-20
0
20
40
60
80
5,9
11,8
17,7
23,6
29,5
35,4
41,3
47,2
53,1 59
64,9
70,8
76,7
82,6
88,5
94,4
The poorest p% of population ranked by per capita income
Gro
wth
in c
onsu
mpt
ion
per p
erso
n (%
)
Figure 5

8/11/2004 13
Growth incidence curve for other urban areas, 1991-2001
0
10
20
30
40
50
60pr
cnt
5,4
10,8
16,2
21,6 27
32,4
37,8
43,2
48,6 54
59,4
64,8
70,2
75,6 81
86,4
91,8
97,2
The poorest p% of population ranked by per capita income
Gro
wth
in c
onsu
mpt
ion
per p
erso
n (%
)
Figure 6
Figure 6 represents the growth incidence curve for the households in the other urban
areas. A similar picture emerges from this chart, namely that income growth has probably
been positive for most households, but here this is even true at the upper end of the
distribution. Compared to the curve for Dakar, this suggests that the type of formal sector
workers with a rigid nominal wage that suffered most from the devaluation is less present
outside Dakar than in the capital city. Moreover, this chart suggests that income has grown
by roughly the same percentage for about 2/3 of the population in these urban areas. For
these households, the estimated growth rate is about 4 % per annum, while it is lower at the
upper end of the distribution.
8/11/2004 14
Growth incidence curve for rural areas,1991-2001
0
10
20
30
40
50
60
70
80
90pr
cnt
4,5 9
13,5 18
22,5 27
31,5 36
40,5 45
49,5 54
58,5 63
67,5 72
76,5 81
85,5 90
94,5 99
The porest p % of population ranked by per capita income
Gro
wth
in c
onsu
mpt
ion
per p
erso
n (%
)
Figure 7
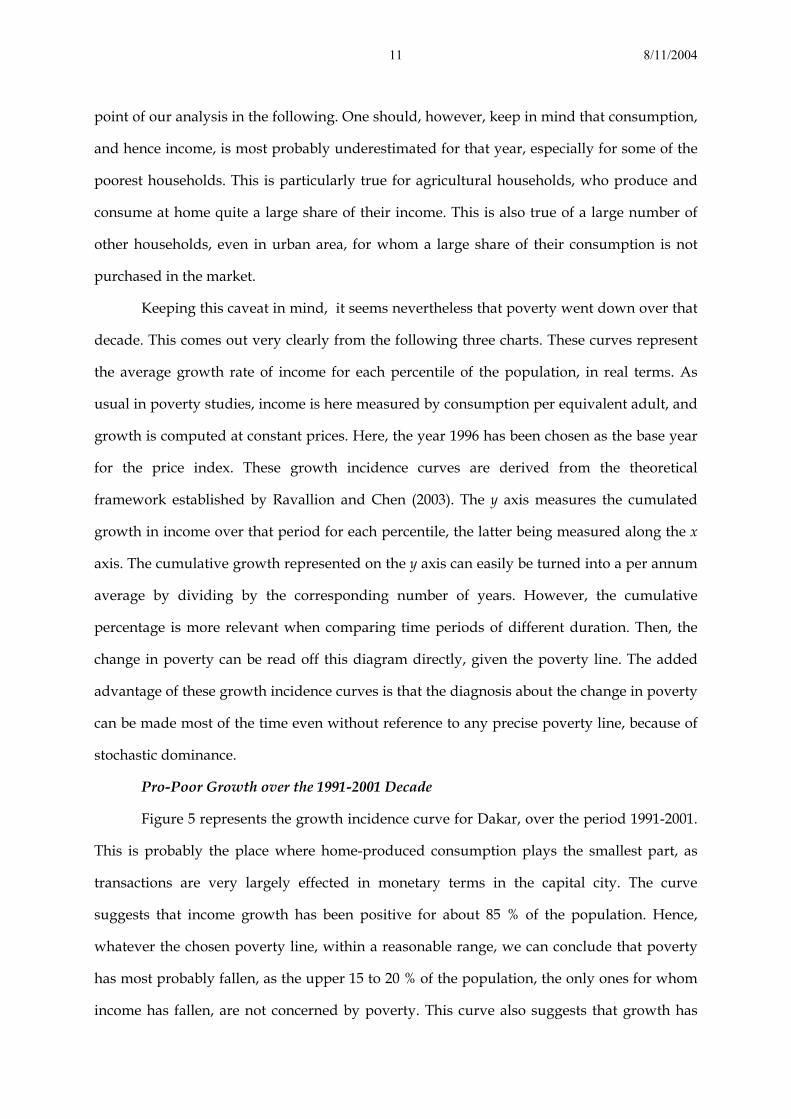
The last chart of this series represents the growth incidence curve for the rural areas.
It is remarkable that a similar set of comments seems to be warranted for this curve as for the
preceding two ones. However, one should bear in mind that it is most probably for this type
of households that the initial level of consumption is the most underestimated, because the
poorest rural people are certainly the ones who rely the most on home-produced
consumption. With this caveat in mind, it seems nevertheless that these households
benefited from a positive growth of their income over that decade. Notice however that the
estimated growth rate, about 3.5 % for most of them, falls slightly below the one estimated
for the urban areas outside Dakar.
Therefore, the preceding analysis suggests that the last decade of the 20th century has
witnessed a positive income growth for most poor people in Senegal, while the poor
households from Dakar benefited the least from this growth. Those in other urban areas
8/11/2004 15
benefited the most. Moreover, income inequality has also been reduced, as the highest
percentiles benefited less than the lowest ones, and even experienced some negative growth
in Dakar. The remainder of this section aims at analyzing in greater detail how this income
growth occurred over time.
In fact, the latter took place in two very contrasting episodes, which contain some
useful lessons about the working of this economy. This contrast provides some support to
the view that macroeconomic policy, including in particular exchange rate policy, and the
response of the economy, is the dominant determinant of the dynamics of poverty. However,
this analysis also brings out a significant lag between the resumption of growth and the
reduction in poverty, which was not expected at the time when the decision to devalue was
made, and whose impact on the well-being of the poor is sizable. The discussion of this
phenomenon is postponed until section 4 below.
There is a slight increase in poverty occurring during the “real-side” structural
adjustment phase before the 1994 devaluation, which affected mainly the rural poor. This
reflected in fact a cyclical effect, in particular because of the 1993 recession. Additionally, the
Senegalese government was able to impose a 7.2 % cut in the average wages of the central
government in the course of that same year, which triggered the mechanism described above
slightly before the devaluation. However, this trend deepened abruptly after the
devaluation. The latter gave rise to a genuine boom, which reduced poverty over time, after
an initial and significant dip. This diagnosis is supported below by a detailed study of the
dynamics of poverty before and after the devaluation, which affected urban and rural people
differently. The Pre-Devaluation Phase
As emphasized above, the pre-devaluation phase is not as securely documented as
the post-devaluation one. However, It is nevertheless useful to look into the data, with a
view to get an order of magnitude regarding income growth over the 1991-1994 period, and
its distribution across households. One should however bear in mind that the 1994 survey
was performed while the effects of the devaluation were already being felt, so that a mixed
picture is bound to emerge from these data. Moreover, the preceding year had already
8/11/2004 16
witnessed two serious shocks that can be expected to have increased poverty, namely the
recession, and the relatively small cut in the nominal wages of the public sector workers
depicted at figure 4.
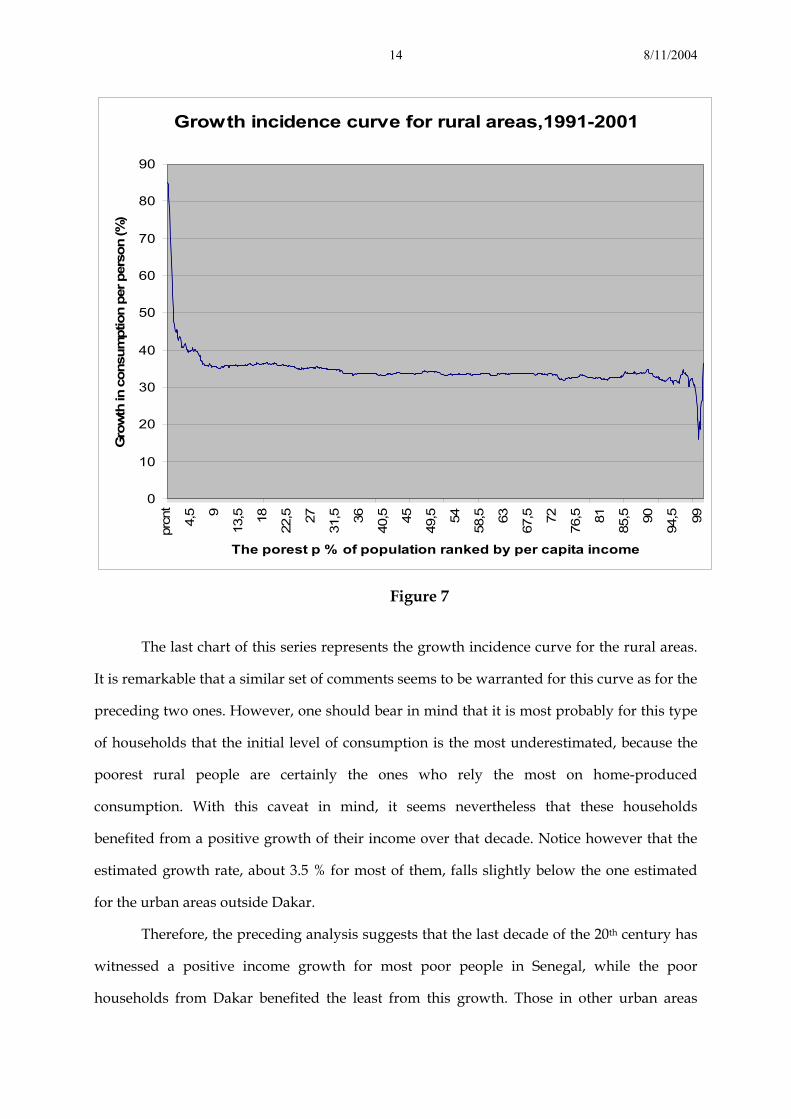
Growth incidence curve for Dakar, 1991-1994
-80
-60
-40
-20
0
20
40
60
80
100
prcn
t
4,7
9,4
14,1
18,8
23,5
28,2
32,9
37,6
42,3 47
51,7
56,4
61,1
65,8
70,5
75,2
79,9
84,6
89,3 94
98,7
The poorest p% of population ranked by per capita consumption
Gro
wth
in c
onsu
mpi
on p
er p
erso
n (%
)
Figure 8
Figure 8 concerns the households from Dakar only, and suggests that income growth
was negative for the poorest households, and increasing with the level of income. Hence, it
was dis-equalizing, leading to a wider dispersion. Because the base year, 1991, is most likely
to underestimate the level of income, we can infer that the deterioration of the standards of
living of the poorest was probably even deeper than figure 8 suggests. This result is at
variance with the prediction of the Azam (2004) model, in which poverty is falling during the
pre-devaluation phase, mainly in the urban sector. However, in the latter model, the trigger
for the downturn in the informal sector incomes is the fall in the real wages of the formal-
sector workers, triggered by the devaluation. In the case of Senegal, in fact, the fall in formal-
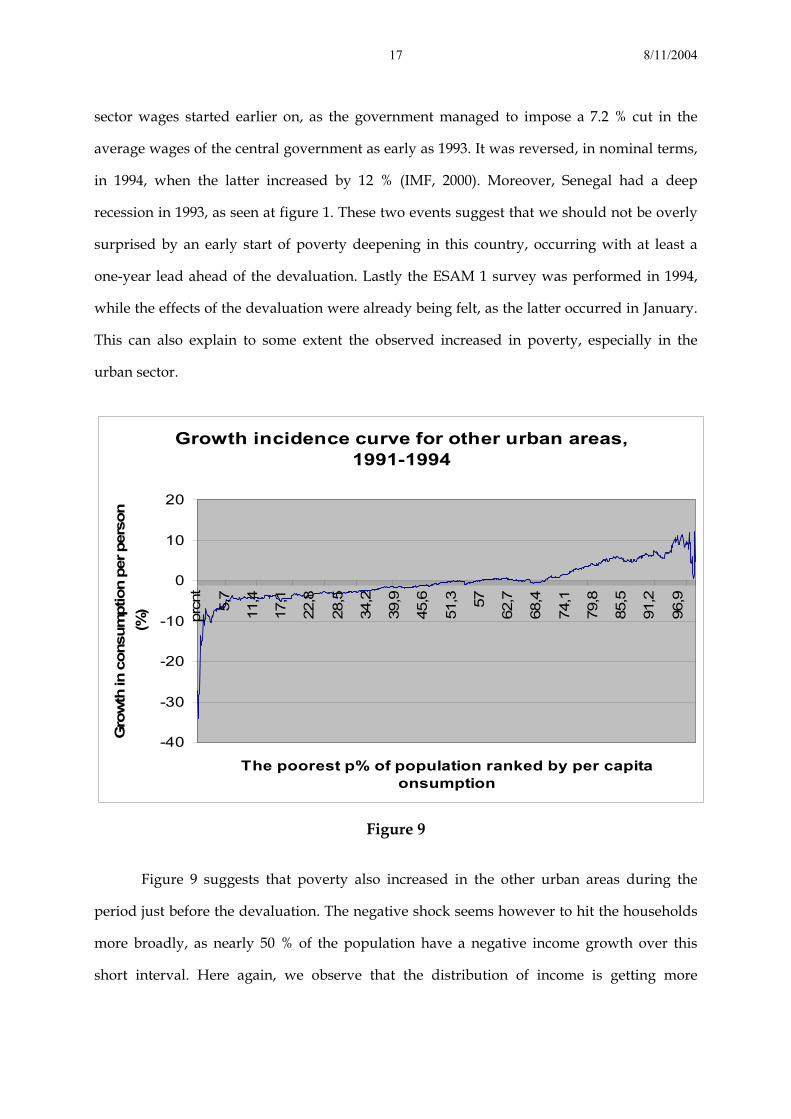
8/11/2004 17
sector wages started earlier on, as the government managed to impose a 7.2 % cut in the
average wages of the central government as early as 1993. It was reversed, in nominal terms,
in 1994, when the latter increased by 12 % (IMF, 2000). Moreover, Senegal had a deep
recession in 1993, as seen at figure 1. These two events suggest that we should not be overly
surprised by an early start of poverty deepening in this country, occurring with at least a
one-year lead ahead of the devaluation. Lastly the ESAM 1 survey was performed in 1994,
while the effects of the devaluation were already being felt, as the latter occurred in January.
This can also explain to some extent the observed increased in poverty, especially in the
urban sector.
Growth incidence curve for other urban areas, 1991-1994
-40
-30
-20
-10
0
10
20
prcn
t
5,7
11,4
17,1
22,8
28,5
34,2
39,9
45,6
51,3 57
62,7
68,4
74,1
79,8
85,5
91,2
96,9
The poorest p% of population ranked by per capita onsumption
Gro
wth
in c
onsu
mpt
ion
per p
erso
n (%
)
Figure 9
Figure 9 suggests that poverty also increased in the other urban areas during the
period just before the devaluation. The negative shock seems however to hit the households
more broadly, as nearly 50 % of the population have a negative income growth over this
short interval. Here again, we observe that the distribution of income is getting more

8/11/2004 18
dispersed, as the higher income percentiles get a positive growth, the more so, the higher
their income level. Therefore, poverty was not only deepening absolutely, but relatively also.
The data concerning the rural area show roughly the same pattern, depicted in figure
10, with nearly half of the population experiencing a negative income growth, at the lower
end, while the upper half of the distribution experiences a positive income growth.
Growth incidence curve for rural areas, 1991-1994
-80
-60
-40
-20
0
20
40
60
prcn
t
4,7
9,4
14,1
18,8
23,5
28,2
32,9
37,6
42,3 47
51,7
56,4
61,1
65,8
70,5
75,2
79,9
84,6
89,3 94
98,7
The poorest p% of population ranked by per capita consumption
Gro
wth
in c
onsu
mpt
ion
per p
erso
n (%
)
Figure 10
Hence, over the pre-devaluation phase, we observe an increase in poverty, whatever
the poverty line, within a reasonable range, especially in the urban areas other than Dakar,
and in the rural areas. This is true both in absolute terms and in relative terms, as the growth
incidence curve is upward-sloping. Hence, this analysis provides some arguments against
the so-called “real-side” adjustment strategy. While it did not achieve much in terms of
adjustment, it was accompanied by an increase in poverty and inequality. The upward-
sloping growth incidence curves presented above suggest that income was somehow
redistributed from the poor to the richer strata of the Senegalese society. Most probably, the
8/11/2004 19
ability of the civil servants and the other public sector employees to shield their incomes
from the expenditure cuts played a major role in this outcome. One must however bear in
mind that the data used are far from ideal for performing such an analysis. As emphasized
above, the 1991 survey is very imperfect, and the date of the second survey, performed in
1994 and 1995, is inappropriate for estimating really the impact of the real-side structural
adjustment policy on poverty, as the effects of the devaluation were already well under way
at that time. Moreover, in the case of Senegal, some of its effects must have been observed
before that, because the government had already imposed some wage cuts in the public
sector in 1993.
Poverty Dynamics during the Post-Devaluation Boom
The data used for the next set of comparisons are of much better quality. The ESAM 1
and ESAM 2 surveys have been performed respectively in 1994-95 and 2001. Nevertheless,
several arguments can be used for suggesting that the reduction in poverty that can be
observed over that period should be interpreted with care. The positive impact of the post-
devaluation boom might be a bit overestimated, in particular because some poverty
deepening had already occurred in 1993 and 1994. Even though, the data show that the
dynamics of poverty was not monotone over that period: there was a temporary
deterioration followed by a sustained improvement, as discussed in section 4 below.
However, the short-run deterioration of poverty in Dakar that took place in the wake
of the devaluation was very largely compensated afterwards by the very fast recovery at the
end of the century. In other words, the turn of the century witnessed an even faster fall in
poverty than the one shown by the data discussed in the present section. Figure 11 shows
that the end result was a remarkable reduction in poverty during the period 1994-2001.
Moreover, it shows that over that seven year period, income distribution almost did not
change, as income growth occurred almost at the same rate over the whole distribution. Only
the poorest and the richest percentiles had a slower growth.

8/11/2004 20
Growth incidence curve for Dakar, 1994-2001
0
5
10
15
20
25
30
5,6
11,2
16,8
22,4 28
33,6
39,2
44,8
50,4 56
61,6
67,2
72,8
78,4 84
89,6
95,2
The poorest p% of population ranked by per capita income
Gro
wth
in in
com
e pe
r per
son
(%)
Figure 11
Figure 12 shows the growth incidence curve for the urban centers outside Dakar. A
sizable growth, of the same order of magnitude as in Dakar, affected most households over
that period. Figure 13 shows the corresponding data for the rural sector. If anything, it shows
that the impact of the post-devaluation boom was even more favorable to the rural poor, as
their income growth rate is consistently above those observed in the previous two charts.

8/11/2004 21
Growth incidence curve for other urban areas, 1994-2001
-5
0
5
10
15
20
25
5,6
11,2
16,8
22,4 28
33,6
39,2
44,8
50,4 56
61,6
67,2
72,8
78,4 84
89,6
95,2
The poorest p% of population ranked by per capita income
Gro
wth
in c
onsu
mpt
ion
per
pers
on (%
)
Figure 12
Growth incidence curve for rural areas, 1994-2001
-20
-10
0
10
20
30
40
50
5,9
11,8
17,7
23,6
29,5
35,4
41,3
47,2
53,1 59
64,9
70,8
76,7
82,6
88,5
94,4
The poorest p% of population ranked by per capita consumption
Gro
wth
in c
onsu
mpt
ion
per
pers
on (%
)
Figure 13
8/11/2004 22
Change in Measured Poverty
A finer picture of the change in poverty over the relevant period can be obtained by
using the standard poverty measures that can be found in the literature. We restrict here our
attention to the family of decomposable measures, which allow the partitioning of the
population according to various criteria, while providing a consistent set of poverty
measures for each group in such partitions. This approach provides some deeper insights
into the changes in poverty, by bringing out the change in poverty occurring within some
selected groups, deemed relevant because of the criteria used for partitioning (socio-
economic categories, gender, etc.).
Two main measures have emerged from the literature devoted to the measurement of
poverty, among the decomposable ones. The most widely used is the so-called FGT measure,
due to Foster et al. (1984). Denote iy individual i’s level of income, usually measured by his
(her) consumption level, assuming that the individuals are ordered by increasing income,
and denote by z the poverty line. Then, individual i’s consumption gap may be defined as
the percentage shortfall of his (her) consumption level below the poverty line:
. The FGT measure is then given by: ( ) zyzG ii /−=
∑=
−
=
q
i
i
zyz
nP
1
1 α
α ,
where n is the size of the population, q the index of the individual whose consumption level
lies just on the poverty line, and α is a parameter capturing the analyst’s concern for the
depth of poverty. If 0=α is chosen, then this index is just the head-count index . If nqH /=
1=α is chosen instead, the poverty measure that we get is the product of the headcount
index by the average consumption gap among the poor GH , where ∑ ==
q
i i qG1
/G . This
index thus takes into account not only the incidence of poverty, but its average depth also.
More emphasis can be put on the depth of poverty by weighing each individual’s
consumption shortfall by itself, i.e. by choosing 2=α . These three measures are computed
for Senegal in table 1 for 1994 and 2001, and are respectively presented under the headings
FGT0 (head-count), FGT1 (consumption gap) and FGT2 (distribution sensitive).
8/11/2004 23
Another decomposable poverty measure has been re-discovered recently, originally
created by Watts (1968). This Watts measure is:
∑=
=
q
i icz
nW
1log1 .
By using a Taylor expansion of about z, up to the third order, one can show
that , suggesting that the Watts measure is in fact
highly sensitive to the distribution of income among the poor.
iclog
3)6/1(2)2/1(1 FGTFGTFGTW ++≅
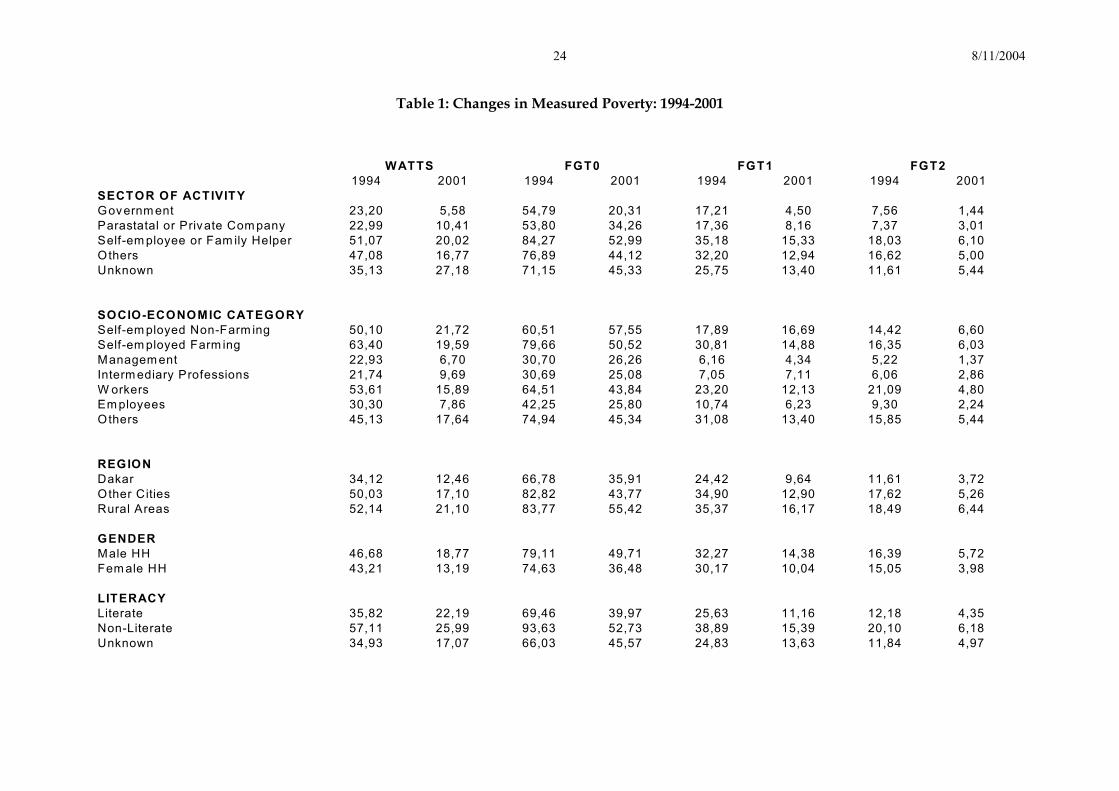
Table 1 presents the results of the computations of these different poverty measures
for Senegal over the period 1994-2001. The poverty lines used are the official ones computed
by the Direction de la Prévision et de la Statistique (République du Sénégal, 2004). They are
defined according to the “cost of basic needs” approach, i.e. using a fixed basket of goods,
the same one in 1994 and 2001. Three different poverty lines have been defined in order to
take due account of the differential cost of living in Dakar, the other urban areas, and the
rural sector, respectively. In all the decompositions presented in table 1, each individual’s
consumption shortfall has been computed using the relevant poverty line, depending on his
(her) location.
Several partitions of the population are presented, defining the relevant groups
according to their sector of activity, their socio-economic category (type of occupation),
location, gender of the household head, and literacy level. It is remarkable, but not surprising
given the results presented above, that poverty has fallen in all the groupings so defined
over this period. In nearly all cases, the fall in poverty is quite massive. The only exception
concerns the non-farming self-employed, for whom the fall in poverty is relatively small,
according to FGT0 and FGT1. This could be expected, in view of the theoretical framework
sketched in the introduction, as this category mainly includes people working in the urban
informal sector. Notice however that the fall in poverty concerning this category becomes
relatively more important, the more distribution-sensitive is the measure used, as shown by
the Watts and FGT2 indices. This suggests that the fate of the poorest of the poor within this
socio-economic category has improved significantly.
8/11/2004 24
Table 1: Changes in Measured Poverty: 1994-2001
1994 2001 1994 2001 1994 2001 1994 2001SECTOR OF ACTIVITYGovernm ent 23,20 5,58 54,79 20,31 17,21 4,50 7,56 1,44Parastatal or Private Com pany 22,99 10,41 53,80 34,26 17,36 8,16 7,37 3,01Self-em ployee or Fam ily Helper 51,07 20,02 84,27 52,99 35,18 15,33 18,03 6,10Others 47,08 16,77 76,89 44,12 32,20 12,94 16,62 5,00Unknown 35,13 27,18 71,15 45,33 25,75 13,40 11,61 5,44
SOCIO-ECONOMIC CATEGORYSelf-em ployed Non-Farm ing 50,10 21,72 60,51 57,55 17,89 16,69 14,42 6,60Self-em ployed Farm ing 63,40 19,59 79,66 50,52 30,81 14,88 16,35 6,03
22,93 6,70 30,70 26,26 6,16 4,34 5,22 1,37Interm ediary Professions 21,74 9,69 30,69 25,08 7,05 7,11 6,06 2,86
53,61 15,89 64,51 43,84 23,20 12,13 21,09 4,80Em ployees 30,30 7,86 42,25 25,80 10,74 6,23 9,30 2,24Others 45,13 17,64 74,94 45,34 31,08 13,40 15,85 5,44
REGIONDakar 34,12 12,46 66,78 35,91 24,42 9,64 11,61 3,72Other Cities 50,03 17,10 82,82 43,77 34,90 12,90 17,62 5,26Rural Areas 52,14 21,10 83,77 55,42 35,37 16,17 18,49 6,44
GENDERMale HH 46,68 18,77 79,11 49,71 32,27 14,38 16,39 5,72Fem ale HH 43,21 13,19 74,63 36,48 30,17 10,04 15,05 3,98
Literate 35,82 22,19 69,46 39,97 25,63 11,16 12,18 4,35Non-Literate 57,11 25,99 93,63 52,73 38,89 15,39 20,10 6,18Unknown 34,93 17,07 66,03 45,57 24,83 13,63 11,84 4,97
LITERACY
FGT1 FGT2
W orkers
Managem ent
WATTS FGT0
8/11/2004 25
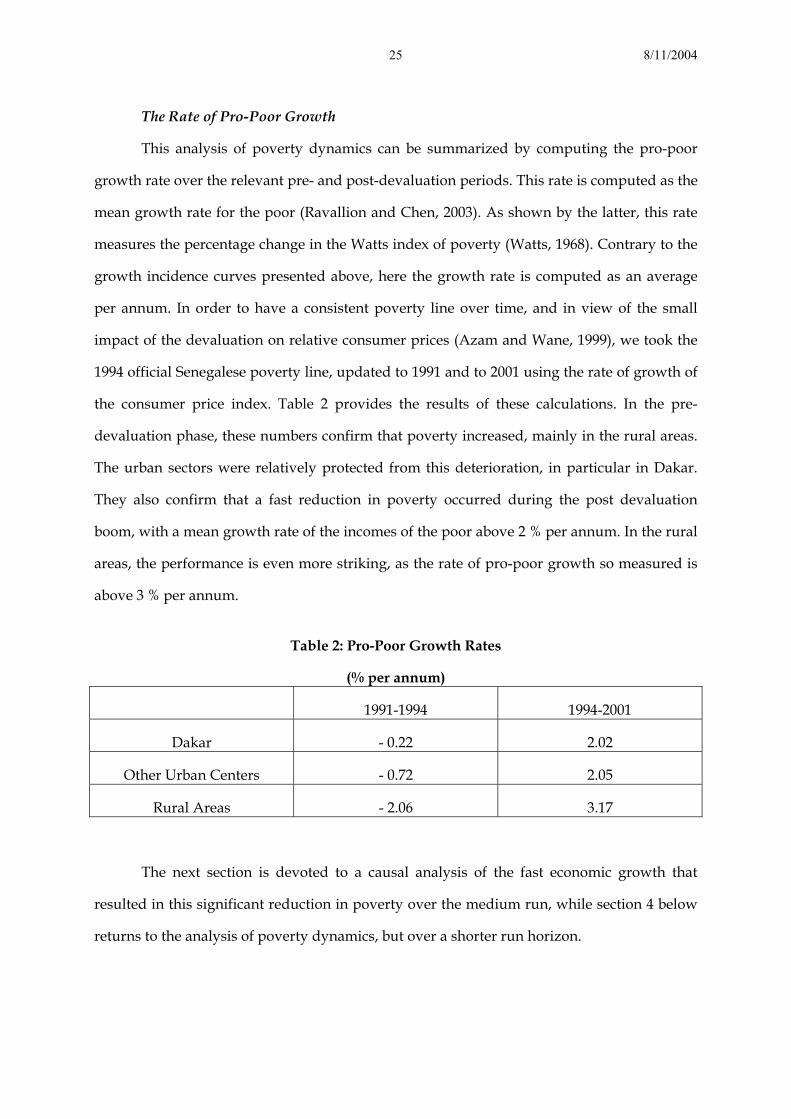
The Rate of Pro-Poor Growth
This analysis of poverty dynamics can be summarized by computing the pro-poor
growth rate over the relevant pre- and post-devaluation periods. This rate is computed as the
mean growth rate for the poor (Ravallion and Chen, 2003). As shown by the latter, this rate
measures the percentage change in the Watts index of poverty (Watts, 1968). Contrary to the
growth incidence curves presented above, here the growth rate is computed as an average
per annum. In order to have a consistent poverty line over time, and in view of the small
impact of the devaluation on relative consumer prices (Azam and Wane, 1999), we took the
1994 official Senegalese poverty line, updated to 1991 and to 2001 using the rate of growth of
the consumer price index. Table 2 provides the results of these calculations. In the pre-
devaluation phase, these numbers confirm that poverty increased, mainly in the rural areas.
The urban sectors were relatively protected from this deterioration, in particular in Dakar.
They also confirm that a fast reduction in poverty occurred during the post devaluation
boom, with a mean growth rate of the incomes of the poor above 2 % per annum. In the rural
areas, the performance is even more striking, as the rate of pro-poor growth so measured is
above 3 % per annum.
Table 2: Pro-Poor Growth Rates
(% per annum)
1991-1994 1994-2001
Dakar - 0.22 2.02
Other Urban Centers - 0.72 2.05
Rural Areas - 2.06 3.17
The next section is devoted to a causal analysis of the fast economic growth that
resulted in this significant reduction in poverty over the medium run, while section 4 below
returns to the analysis of poverty dynamics, but over a shorter run horizon.
8/11/2004 26
3. The Determinants of Pro-Poor Growth
The post-devaluation boom sketched above presents a striking example where a
sustained economic recovery ends up pulling a lot of people out of poverty, despite an initial
worsening of their well being. The present section aims at identifying the main determinants
of this overall fall in poverty, over the 1994-2001 period. The introductory section has
provided an explanation for the initial negative response of poverty to the growth recovery,
based on the fall in the real wages in the formal sector, and its impact on those in the
informal sector. This is discussed further in section 4 below. The current section focuses
instead on the determinants of the strong pro-poor growth that dominated the end of the
century. It begins by a sectoral decomposition of GDP growth, which brings out some
significant structural change. Berthélemy et al. (1996) have shown that the change in the
allocation of labor among the different production sectors is the key determinant of
aggregate growth in Senegal. The following analysis provides some support to this view.
Production Sector Effects
The particularly good performance of the rural areas in terms of poverty reduction
identified above occurred despite a fairly irregular growth path of the agricultural and
livestock sector. The latter experienced a serious depression in 1997 and 1998, followed by a
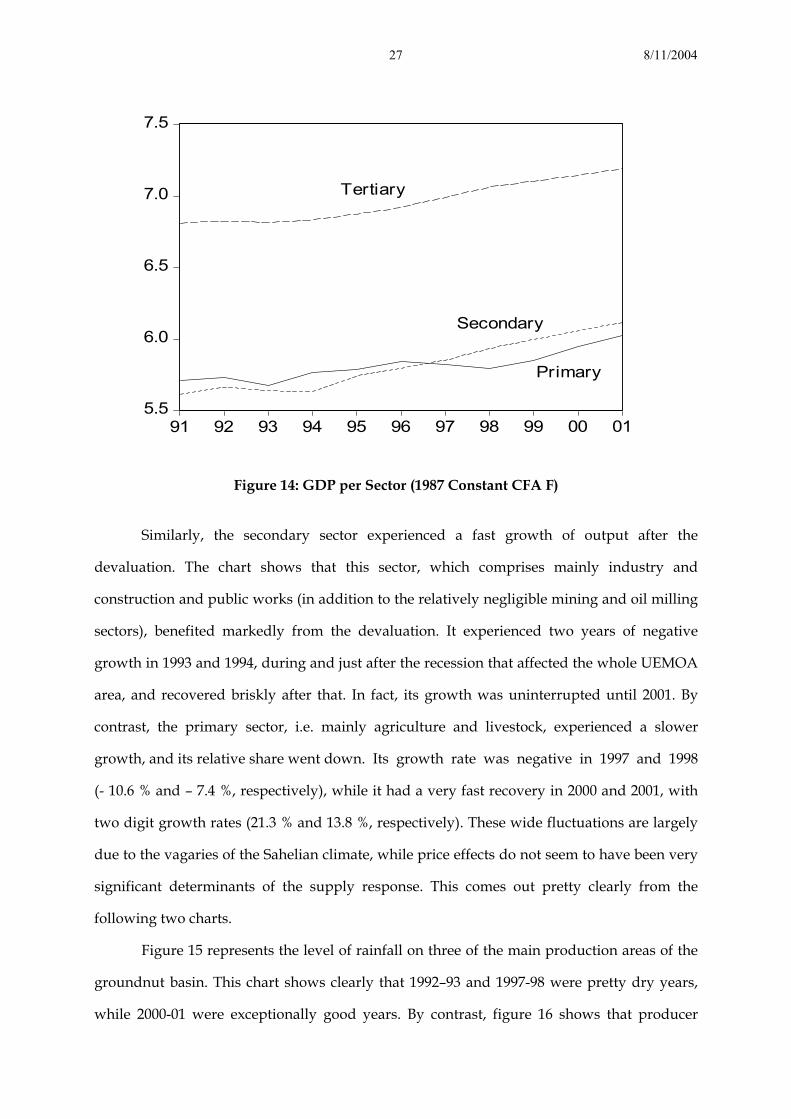
brisk recovery in 2000 and 2001. Figure 14 shows a decomposition of GDP (at constant 1987
prices, in log) over the 1991-2001 decade. It shows that the tertiary sector, which comprises
mainly transportation, commerce and other services, experienced a pretty fast growth since
the devaluation. In real terms, several of its component sectors experienced some very fast
growth episodes during this period, like transportation for example, which grew by 8.1 %
per annum on average over 1997-2001. This tertiary sector claims more than half of total GDP
in this country (nearly 60 % in fact). It includes also the telecommunication sector, which was
profoundly reformed during that period in Senegal, and grew quite fast subsequently
(Azam, Dia, and N’Guessan, 2002).
8/11/2004 27
5.5
6.0
6.5
7.0
7.5
91 92 93 94 95 96 97 98 99 00 01
Tertiary
Secondary
Primary
Figure 14: GDP per Sector (1987 Constant CFA F)
Similarly, the secondary sector experienced a fast growth of output after the
devaluation. The chart shows that this sector, which comprises mainly industry and
construction and public works (in addition to the relatively negligible mining and oil milling
sectors), benefited markedly from the devaluation. It experienced two years of negative
growth in 1993 and 1994, during and just after the recession that affected the whole UEMOA
area, and recovered briskly after that. In fact, its growth was uninterrupted until 2001. By
contrast, the primary sector, i.e. mainly agriculture and livestock, experienced a slower
growth, and its relative share went down. Its growth rate was negative in 1997 and 1998
(- 10.6 % and – 7.4 %, respectively), while it had a very fast recovery in 2000 and 2001, with
two digit growth rates (21.3 % and 13.8 %, respectively). These wide fluctuations are largely
due to the vagaries of the Sahelian climate, while price effects do not seem to have been very
significant determinants of the supply response. This comes out pretty clearly from the
following two charts.
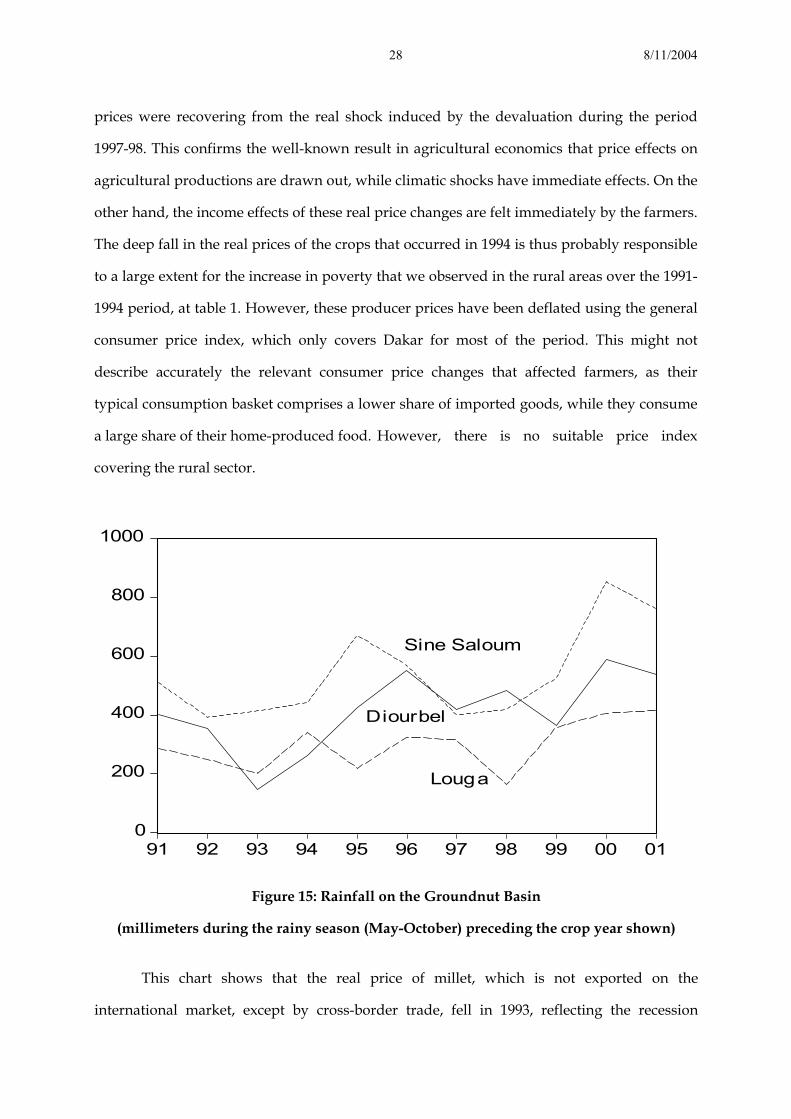
Figure 15 represents the level of rainfall on three of the main production areas of the
groundnut basin. This chart shows clearly that 1992–93 and 1997-98 were pretty dry years,
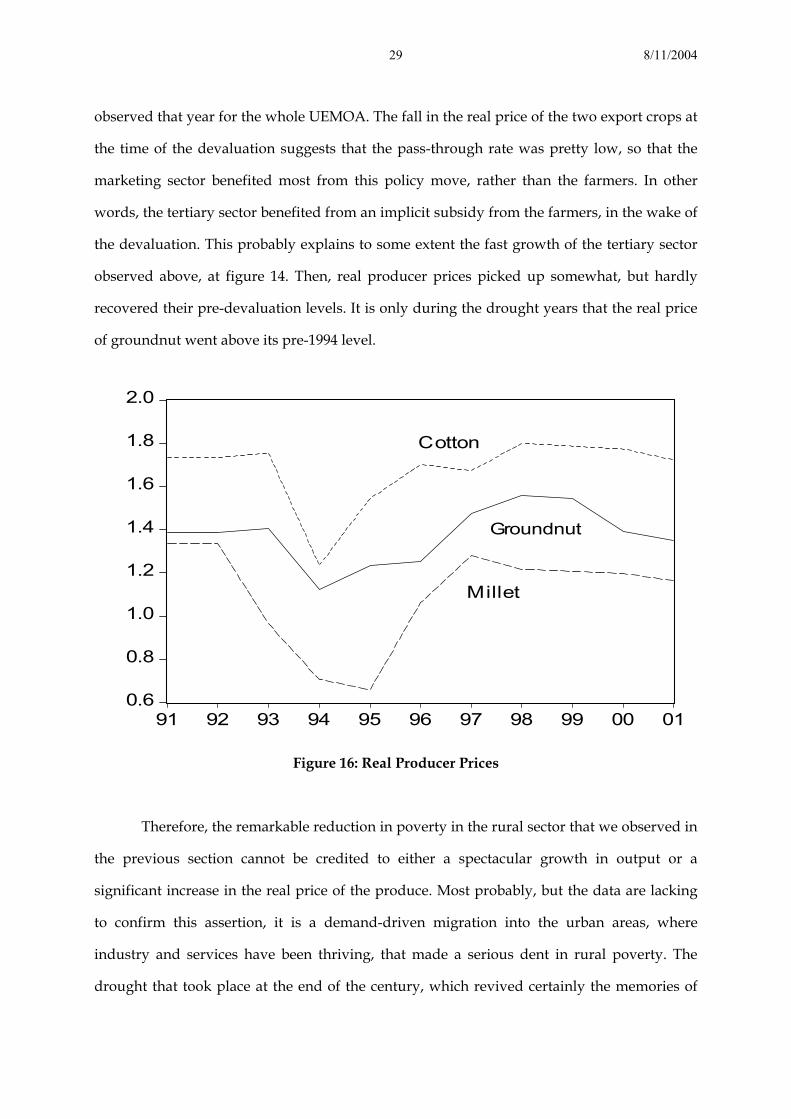
while 2000-01 were exceptionally good years. By contrast, figure 16 shows that producer
8/11/2004 28
prices were recovering from the real shock induced by the devaluation during the period
1997-98. This confirms the well-known result in agricultural economics that price effects on
agricultural productions are drawn out, while climatic shocks have immediate effects. On the
other hand, the income effects of these real price changes are felt immediately by the farmers.
The deep fall in the real prices of the crops that occurred in 1994 is thus probably responsible
to a large extent for the increase in poverty that we observed in the rural areas over the 1991-
1994 period, at table 1. However, these producer prices have been deflated using the general
consumer price index, which only covers Dakar for most of the period. This might not
describe accurately the relevant consumer price changes that affected farmers, as their
typical consumption basket comprises a lower share of imported goods, while they consume
a large share of their home-produced food. However, there is no suitable price index
covering the rural sector.
0
200
400
600
800
1000
91 92 93 94 95 96 97 98 99 00 01
Louga
Sine Saloum
Diourbel
Figure 15: Rainfall on the Groundnut Basin
(millimeters during the rainy season (May-October) preceding the crop year shown)
This chart shows that the real price of millet, which is not exported on the
international market, except by cross-border trade, fell in 1993, reflecting the recession
8/11/2004 29
observed that year for the whole UEMOA. The fall in the real price of the two export crops at
the time of the devaluation suggests that the pass-through rate was pretty low, so that the
marketing sector benefited most from this policy move, rather than the farmers. In other
words, the tertiary sector benefited from an implicit subsidy from the farmers, in the wake of
the devaluation. This probably explains to some extent the fast growth of the tertiary sector
observed above, at figure 14. Then, real producer prices picked up somewhat, but hardly
recovered their pre-devaluation levels. It is only during the drought years that the real price
of groundnut went above its pre-1994 level.
0.6
0.8
1.0
1.2
1.4
1.6
1.8
2.0
91 92 93 94 95 96 97 98 99 00 01
Cotton
Groundnut
Millet
Figure 16: Real Producer Prices
Therefore, the remarkable reduction in poverty in the rural sector that we observed in
the previous section cannot be credited to either a spectacular growth in output or a
significant increase in the real price of the produce. Most probably, but the data are lacking
to confirm this assertion, it is a demand-driven migration into the urban areas, where
industry and services have been thriving, that made a serious dent in rural poverty. The
drought that took place at the end of the century, which revived certainly the memories of

8/11/2004 30
the 1970s and 1980s, also provided some incentive for labor to migrate to the more
progressive sectors.
These results are consistent with those of Berthélemy et al. (1996) showing that over
the period 1961-1990, the increase in total factor productivity, which can be estimated using
an aggregate production function, is in fact entirely due to the reallocation of labor from the
low productivity primary sector to the higher productivity secondary and tertiary sectors.
Poverty thus probably fell in the rural sector because the least productive farmers migrated
to the cities, where they found higher productivity jobs. Hence, in the case of Senegal, it
seems that the rural sector can be viewed as a fairly stagnant reserve of labor, somehow in
the spirit of the seminal Lewis model (Lewis, 1954). The difference with the latter is that such
a diagnosis is true despite the fact that the primary sector is not just a “subsistence sector”,
but is also exporting a large share of its output. Azam (1993) presents an extension of the
Lewis model, motivated by an analysis of Côte d’Ivoire, which brings out the importance for
growth of the taxation of the high wages, assumed to accrue to skilled labor, and the
productive use of the resulting tax proceeds by the government. The following analysis
suggests that the experience of Senegal provides some support to this view, interpreting the
outcome of the devaluation as a massive increase in the taxation of the high wages, as
suggested above.
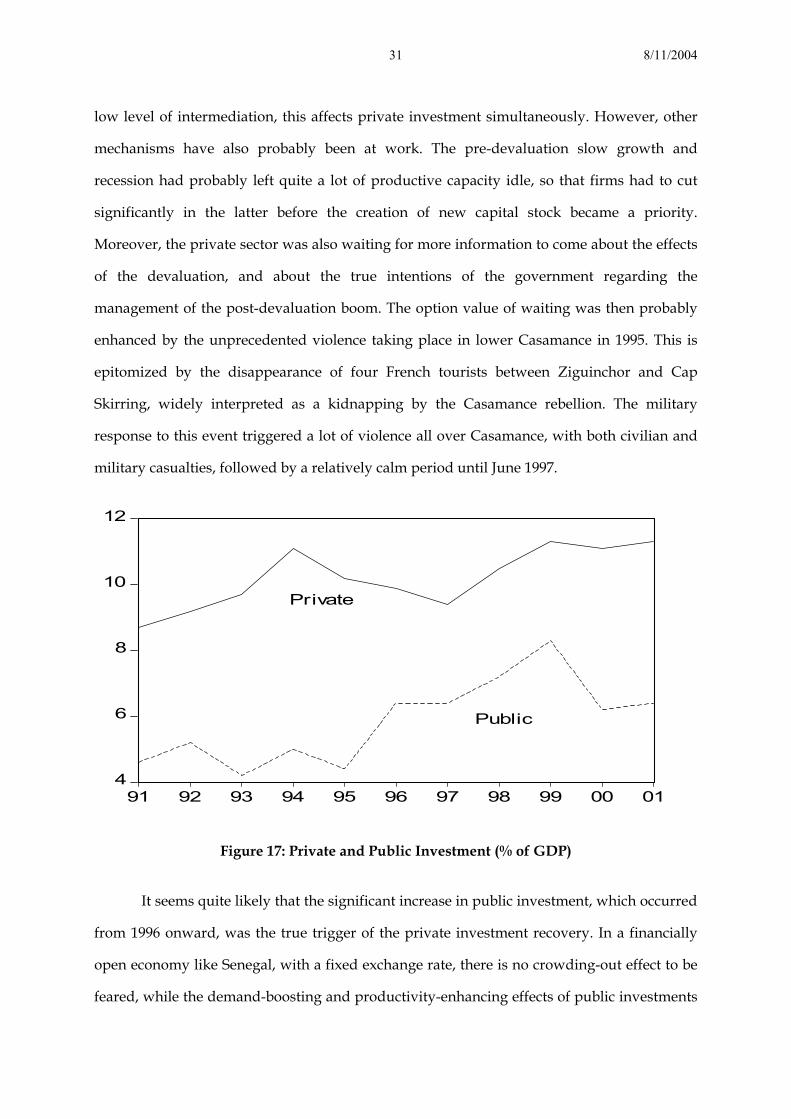
The Investment Boom
Figure 17 shows that the post-devaluation recovery was boosted by a major effort
concerning public investment. As a percentage of GDP, it went up from an average share of
4.6 % of GDP in 1991-93 to an average share of 6.8 % of GDP over 1996-2001. The resumption
of private investment is also quite remarkable, although its time profile is less smooth. It
increased from an average share of 8.9 % of GDP in 1991-93, to an average of 10.6 % of GDP
in 1996-2001. It is highly probable that the former played a part in creating the appropriate
climate for the latter. The time profile of the private investment share suggests that the
devaluation took some time before it elicited a positive response from private investors. This
is clearly one of the predictions of the theoretical framework sketched in the introduction,
after Azam (2004). Private saving declines in the wake of the devaluation, and because of the
8/11/2004 31
low level of intermediation, this affects private investment simultaneously. However, other
mechanisms have also probably been at work. The pre-devaluation slow growth and
recession had probably left quite a lot of productive capacity idle, so that firms had to cut
significantly in the latter before the creation of new capital stock became a priority.
Moreover, the private sector was also waiting for more information to come about the effects
of the devaluation, and about the true intentions of the government regarding the
management of the post-devaluation boom. The option value of waiting was then probably
enhanced by the unprecedented violence taking place in lower Casamance in 1995. This is
epitomized by the disappearance of four French tourists between Ziguinchor and Cap
Skirring, widely interpreted as a kidnapping by the Casamance rebellion. The military
response to this event triggered a lot of violence all over Casamance, with both civilian and
military casualties, followed by a relatively calm period until June 1997.
4
6
8
10
12
91 92 93 94 95 96 97 98 99 00 01
Public
Private
Figure 17: Private and Public Investment (% of GDP)
It seems quite likely that the significant increase in public investment, which occurred
from 1996 onward, was the true trigger of the private investment recovery. In a financially
open economy like Senegal, with a fixed exchange rate, there is no crowding-out effect to be
feared, while the demand-boosting and productivity-enhancing effects of public investments
8/11/2004 32
are dominant. This central role of public investment, marking the end of a period of falling
private investment, does not mean that the devaluation had no useful effect. It means instead
that the positive impact took a more roundabout channel than usually expected. The
improved situation of the government budget, and in particular the fall in the real wages of
the civil servants and other government employees, triggered by the devaluation, freed some
fiscal resources that the government was able to use for investing. This is the main cause of
the investment boom described above. The real wage effect was reinforced by a slight fall in
the number of civil servants, which fell from 66,696 in 1994 to 65,259 in 2001, so that the civil
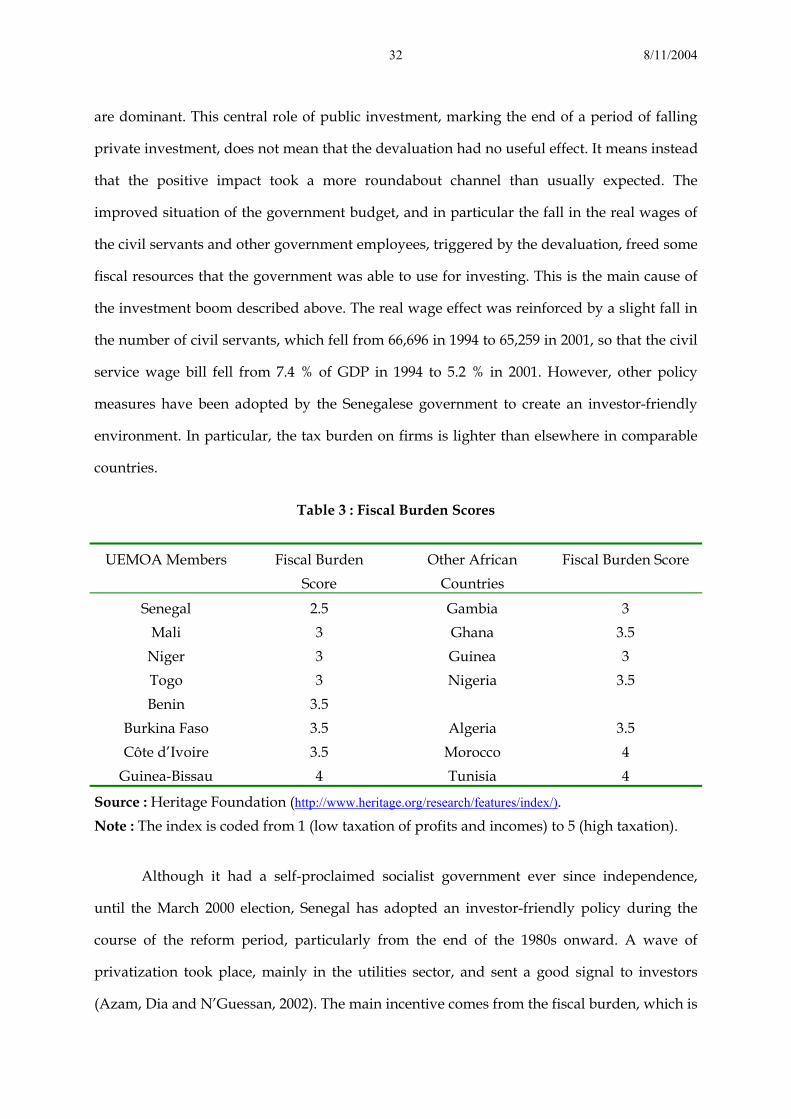
service wage bill fell from 7.4 % of GDP in 1994 to 5.2 % in 2001. However, other policy
measures have been adopted by the Senegalese government to create an investor-friendly
environment. In particular, the tax burden on firms is lighter than elsewhere in comparable
countries.
Table 3 : Fiscal Burden Scores
UEMOA Members Fiscal Burden Score
Other African Countries
Fiscal Burden Score
Senegal 2.5 Gambia 3 Mali 3 Ghana 3.5
Niger 3 Guinea 3 Togo 3 Nigeria 3.5 Benin 3.5
Burkina Faso 3.5 Algeria 3.5 Côte d’Ivoire 3.5 Morocco 4
Guinea-Bissau 4 Tunisia 4
Source : Heritage Foundation (http://www.heritage.org/research/features/index/). Note : The index is coded from 1 (low taxation of profits and incomes) to 5 (high taxation).
Although it had a self-proclaimed socialist government ever since independence,
until the March 2000 election, Senegal has adopted an investor-friendly policy during the
course of the reform period, particularly from the end of the 1980s onward. A wave of
privatization took place, mainly in the utilities sector, and sent a good signal to investors
(Azam, Dia and N’Guessan, 2002). The main incentive comes from the fiscal burden, which is
8/11/2004 33
low by African standards. Table 3 represents the scores given to various countries in the
UEMOA and its neighborhood by the experts of the Heritage Foundation. This is a
composite index that takes into account the highest rate of income tax, as well as the average
one, and the most relevant marginal income tax rate for the average tax payer. Additionally,
as a check on the credibility of these tax rates, the share of public expenditures in GDP is also
taken into account.
Table 3 shows that in general, the UEMOA countries have a slightly more favorable
score than the comparison countries, which are taken both from North Africa and from non-
UEMOA West Africa. Out of these 15 countries, Senegal has by far the best performance,
even among the UEMOA countries. Hence, the boosting effect of the public investment boom
described above was supported by a highly favorable tax framework. As a result of the
investor-friendly climate that the Senegalese government has created over the last few years
of the century, its rating has improved significantly. Since 2001, Senegal is rated B+ by
Standard & Poors, a score that only South Africa and Botswana are also getting in Sub-
Saharan Africa.
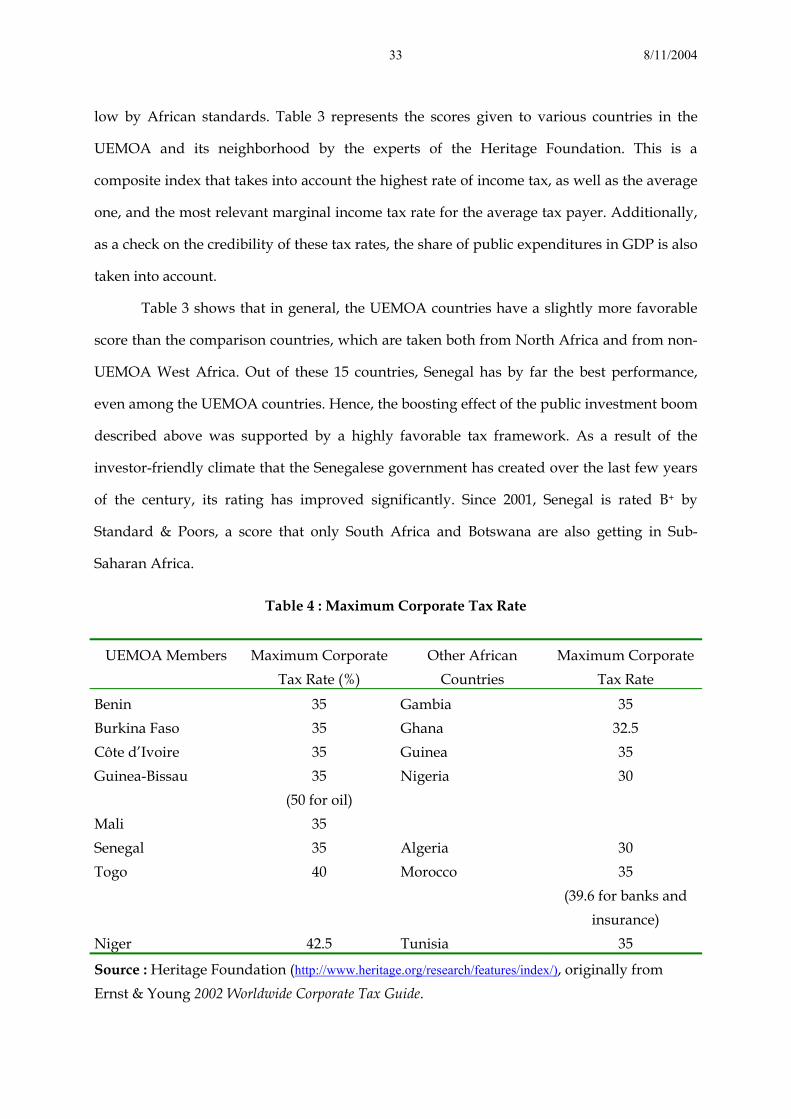
Table 4 : Maximum Corporate Tax Rate
UEMOA Members Maximum Corporate Tax Rate (%)
Other African Countries
Maximum Corporate Tax Rate
Benin 35 Gambia 35 Burkina Faso 35 Ghana 32.5 Côte d’Ivoire 35 Guinea 35 Guinea-Bissau 35
(50 for oil) Nigeria 30
Mali 35 Senegal 35 Algeria 30 Togo 40 Morocco 35
(39.6 for banks and insurance)
Niger 42.5 Tunisia 35
Source : Heritage Foundation (http://www.heritage.org/research/features/index/), originally from Ernst & Young 2002 Worldwide Corporate Tax Guide.
8/11/2004 34
Table 4 shows the maximum corporate tax rate among the same group of countries.
Most of them have a maximum rate of 35 %, with the exception of Niger and Togo, within
the UEMOA, which have a slightly higher rate, and the oil producing Algeria and Nigeria,
which have a lower rate aimed at compensating for the “Dutch Disease” effect due to oil
exports, as well as Ghana. The latter is also a coastal country with a potential comparative
advantage in non traditional exports, like Senegal, which pursues quite an aggressive policy
aimed at attracting foreign investors.
65
70
75
80
85
90
94 95 96 97 98 99 00 01
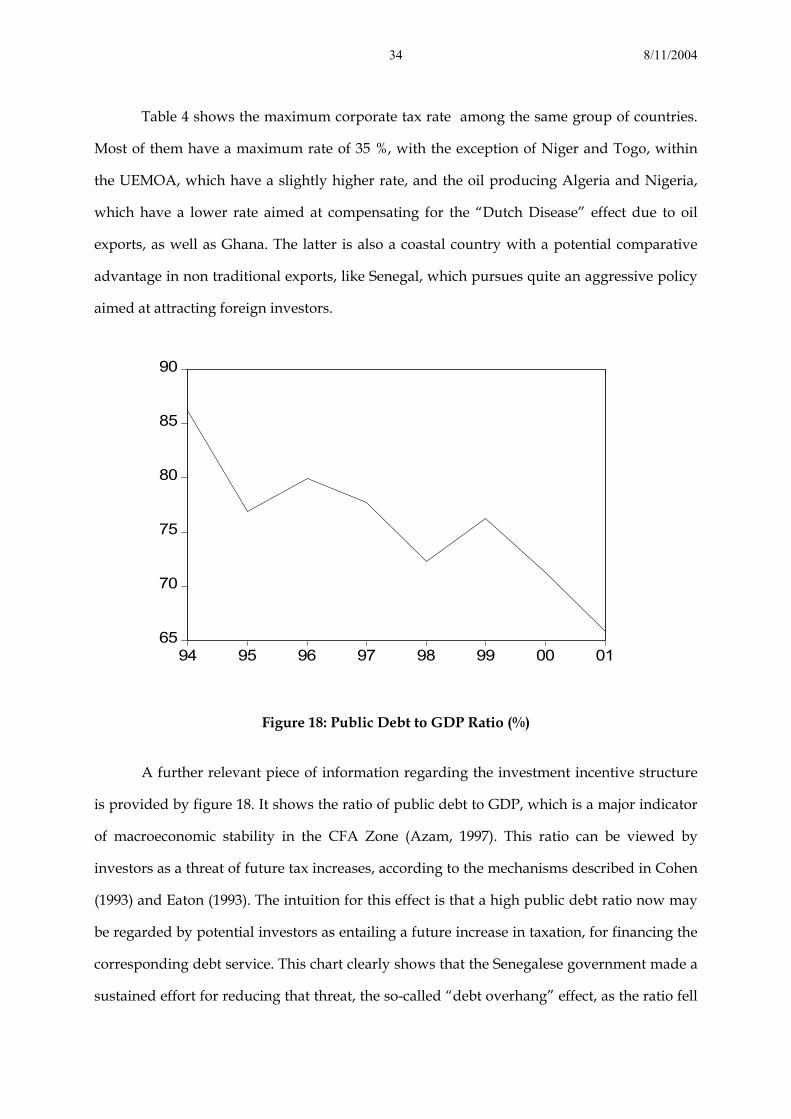
Figure 18: Public Debt to GDP Ratio (%)
A further relevant piece of information regarding the investment incentive structure
is provided by figure 18. It shows the ratio of public debt to GDP, which is a major indicator
of macroeconomic stability in the CFA Zone (Azam, 1997). This ratio can be viewed by
investors as a threat of future tax increases, according to the mechanisms described in Cohen
(1993) and Eaton (1993). The intuition for this effect is that a high public debt ratio now may
be regarded by potential investors as entailing a future increase in taxation, for financing the
corresponding debt service. This chart clearly shows that the Senegalese government made a
sustained effort for reducing that threat, the so-called “debt overhang” effect, as the ratio fell
8/11/2004 35
from 86.2 in 1994 to 65.8 in 2001. A major dent in this series shows up in 1998, when Senegal
reached a Paris Club agreement worth about CFAF 23 billion. Moreover, Senegal will benefit
from some debt reduction within the HIPC initiative, as decided in June 2000. The latter will
be effective only outside the period under analysis, but has probably a positive effect on
expectations. All these developments are taking place against a background of sustained
reduction of the debt-to-GDP ratio.
Senegal thus comes out as a particularly attractive investment destination among the
countries from North and West Africa. It does not seem that the few breaches of
privatization contracts, imposed paradoxically by the liberal president Abdoulaye Wade,
have much damaged this country’s good reputation. An example is provided by the re-
negotiation of the licenses for the mobile telephone operators Alizée and Sentel (see Azam,
Dia and N’Guessan, 2002), which ended up in a surcharge being imposed on them. Its
attractiveness is also supported unwittingly by Côte d’Ivoire, whose political instability (the
1999 coup d’etat, the 2000 uprising, and the civil war started in 2002 …) has destroyed its
own attractiveness. In many ways, Senegal is left as the unique investment opportunity
among Francophone countries.
It is remarkable that the sustained growth of the post-devaluation boom was not
hampered by a shortage of human capital. Berthélemy et al. (1996) have a fairly negative
diagnosis about the education policy pursued by Senegal between independence and the
early 1990s. They acknowledge that the enrollment rate has increased massively. Between
1960 and 1990, it went from 22 %to 57 % in 1990, as far as primary education is concerned,
from 2 % to 16 %, in secondary education. However they estimate that the quality of
education is poor and deteriorating, and not fitted for sustaining economic development.
They criticize in particular the Senegalese education policy for putting too much emphasis
on classical education. By contrast, Diagne et al. (2002) estimate that human capital was not a
brake on the resumption of growth after the devaluation. They find a positive and nearly
significant impact of enrolment in primary education on growth, with a nine-year lag. This
effort has not been reduced during the post-devaluation boom, and the gross rate of
enrolment went from 54.3 % in 1993 to 69 % in 2000 (Loum, 2001).
8/11/2004 36
4. Trade-offs between Growth and Pro-Poor Growth
Two trade-offs can be identified between growth and pro-poor growth in the case of
Senegal. The first one has been mentioned above, and concerns the inter-temporal trade-off
between increased poverty now and reduced poverty later. This is the inter-temporal trade-
off, which raises deep issues of aggregation of poverty over time. The second one, which is
not unrelated to the above-mentioned, involves the political benefit that the governments can
obtain from an active pro-poor policy, while the subjective perception seems to lag
significantly behind its objective changes. It seems that households perceive a sense of lasting
“crisis”, whenever they have experienced poverty. This entails a trade off between pro-poor
growth, with the initial sacrifice that it requires, and political support.
The Inter-Temporal Trade-off
As mentioned above, the positive response of poverty to the post-devaluation growth
recovery was significantly delayed. There is not a high frequency observation process for
enabling us to describe quite precisely the time profile of such a non-linear relationship,
because of the small number of appropriate surveys. However, an additional survey can be
used for providing a more detailed view of the short-run dynamics of the post-devaluation
poverty reduction, at least for the city of Dakar. This survey was performed all over the
UEMOA in 1996, in order to improve and harmonize the consumer price indexes used in the
region. Its sample is restricted to households from Dakar, and is focused on monetary
expenditures. Nevertheless, it allows to show quite confidently that poverty increased
further after the 1994 survey was performed.

8/11/2004 37
Growth incidence curve for Dakar, 1994-1996
-25
-20
-15
-10
-5
0
5
10
15
20
25pr
cnt
0,05
5
0,11
0,16
5
0,22
0,27
5
0,33
0,38
5
0,44
0,49
5
0,55
0,60
5
0,66
0,71
5
0,77
0,82
5
0,88
0,93
5
0,99
The poorest p% of population ranked by per capita consumption
Gro
wth
in c
onsu
mpt
ion
per
pers
on(%
)
Figure 19
Figure 19 illustrates this point, for the case of Dakar. It depicts the growth incidence
curve for the households of the capital city between 1994 and 1996. Notice that the 1996 data
are not directly comparable to the ones used above, and in particular they do not include
home-produced consumption. However, it was straightforward to correct the 1994 data set
in order to make it directly comparable to the 1996 data. This has been done for constructing
figure 19. Moreover, home-produced consumption is almost negligible for most households
in Dakar. This growth incidence curve shows undoubtedly that poverty increased markedly
in the capital city in the wake of the devaluation, as the 2/3 of the population belonging to
the lower part of the income distribution have seen their income fall. This fall would
probably have been deeper had the initial year of observation been taken before the
devaluation, rather than just after it. Nevertheless, this piece of observation confirms the
diagnosis presented above, namely that the 1994 devaluation had probably the same impact
on poverty in Senegal as it had elsewhere in the CFA zone, i.e. a largely unfavorable one in
the short- to medium run.
8/11/2004 38
Growth incidence curve for Dakar, 1996-2001
-5
0
5
10
15
20
25
30
35
40
prcn
t
0,05
4
0,10
8
0,16
2
0,21
6
0,27
0,32
4
0,37
8
0,43
2
0,48
6
0,54
0,59
4
0,64
8
0,70
2
0,75
6
0,81
0,86
4
0,91
8
0,97
2
The poorest p% of population ranked by per capita income
Gro
wth
in c
onsu
mpt
ion
per p
erso
n (%
)
Figure 20
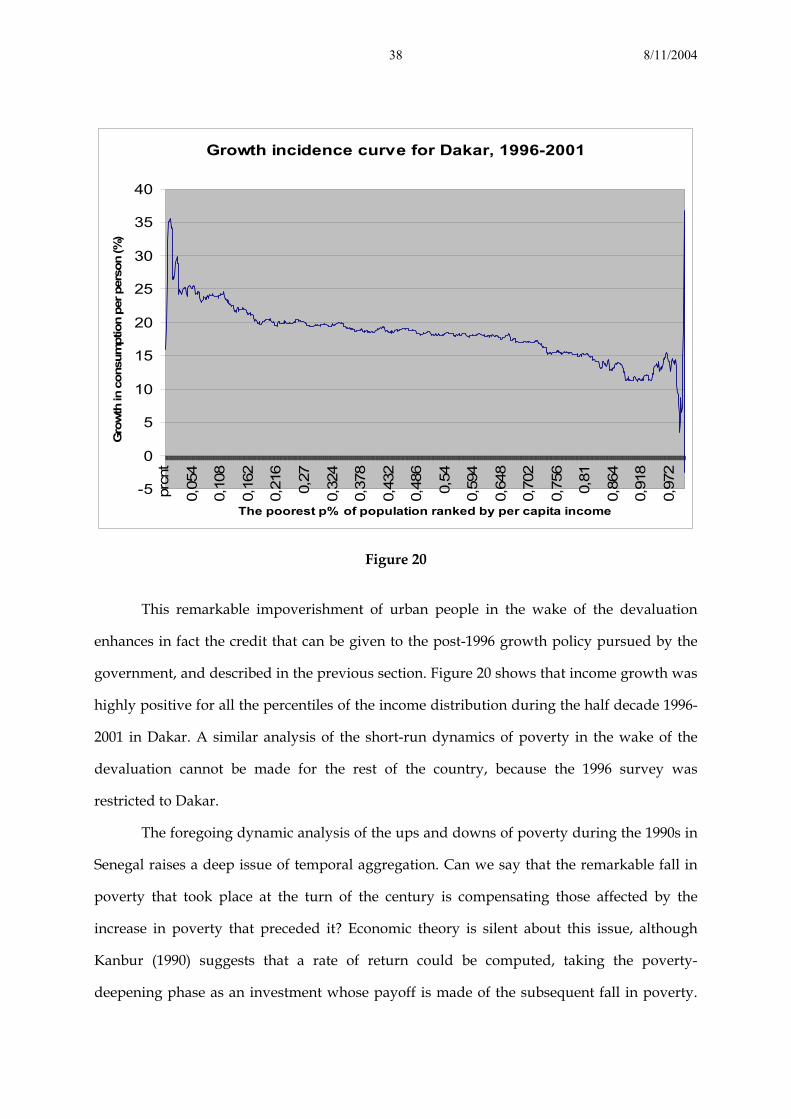
This remarkable impoverishment of urban people in the wake of the devaluation
enhances in fact the credit that can be given to the post-1996 growth policy pursued by the
government, and described in the previous section. Figure 20 shows that income growth was
highly positive for all the percentiles of the income distribution during the half decade 1996-
2001 in Dakar. A similar analysis of the short-run dynamics of poverty in the wake of the
devaluation cannot be made for the rest of the country, because the 1996 survey was
restricted to Dakar.
The foregoing dynamic analysis of the ups and downs of poverty during the 1990s in
Senegal raises a deep issue of temporal aggregation. Can we say that the remarkable fall in
poverty that took place at the turn of the century is compensating those affected by the
increase in poverty that preceded it? Economic theory is silent about this issue, although
Kanbur (1990) suggests that a rate of return could be computed, taking the poverty-
deepening phase as an investment whose payoff is made of the subsequent fall in poverty.
8/11/2004 39
However, he does not provide the required formula for computing such a rate of return.
Nevertheless, using the Watts index as an indicator of well being, we can guess that the
income fall that took place for the poor in 1994-96, about 5 % in the course of two years, is
probably offset by the income growth by 20 % in the course of the subsequent half decade.
However, it is far from certain that this captures correctly the change in the poverty
status of the poor, as they perceive it themselves. In fact, the data from the survey on the
subjective perception of poverty, discussed briefly below, suggest that the experience of
poverty leaves a lasting trauma to the person affected, such that an increase in income does
not make a former poor a non-poor person overnight.
The Persistence of Perceived Poverty
Despite the remarkable fall in poverty documented above, based on the change in
consumption experienced by Senegalese households over 1994-2001, perceived poverty has
increased significantly in this country. This comes out of the EPPS 2001 survey (Enquête sur
la perception de la pauvreté au Sénégal). This is a survey on the subjective perception of
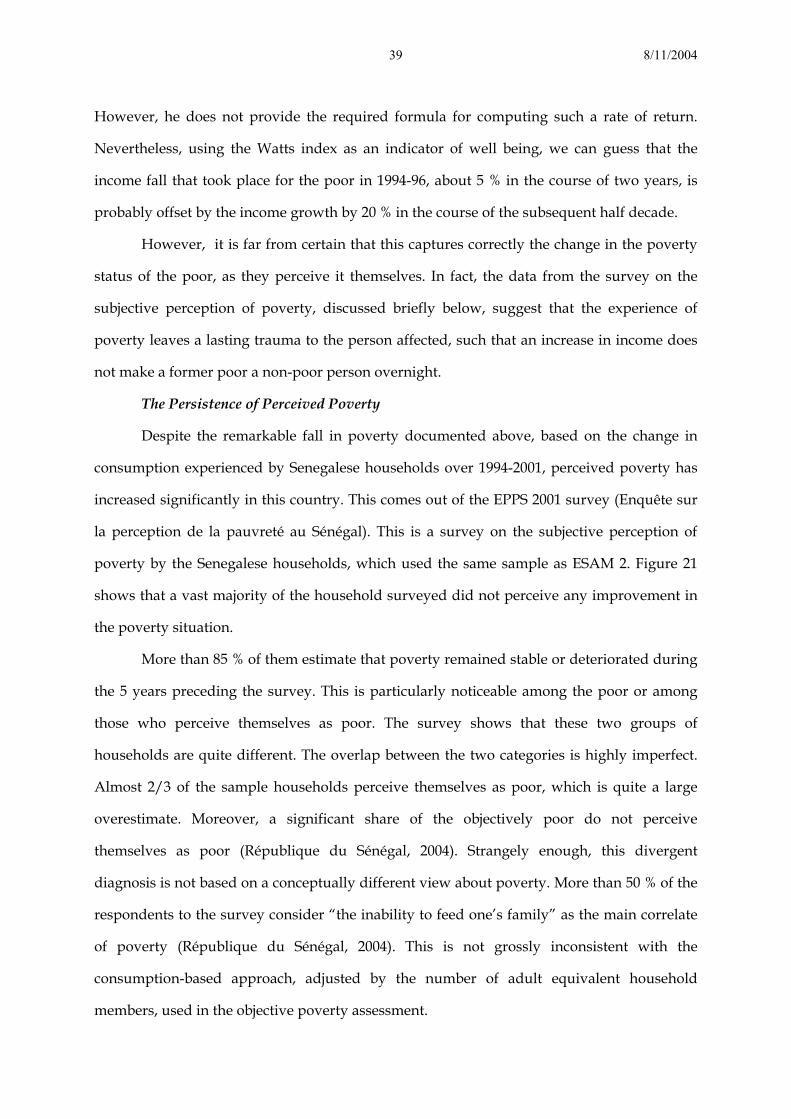
poverty by the Senegalese households, which used the same sample as ESAM 2. Figure 21
shows that a vast majority of the household surveyed did not perceive any improvement in
the poverty situation.
More than 85 % of them estimate that poverty remained stable or deteriorated during
the 5 years preceding the survey. This is particularly noticeable among the poor or among
those who perceive themselves as poor. The survey shows that these two groups of
households are quite different. The overlap between the two categories is highly imperfect.
Almost 2/3 of the sample households perceive themselves as poor, which is quite a large
overestimate. Moreover, a significant share of the objectively poor do not perceive
themselves as poor (République du Sénégal, 2004). Strangely enough, this divergent
diagnosis is not based on a conceptually different view about poverty. More than 50 % of the
respondents to the survey consider “the inability to feed one’s family” as the main correlate
of poverty (République du Sénégal, 2004). This is not grossly inconsistent with the
consumption-based approach, adjusted by the number of adult equivalent household
members, used in the objective poverty assessment.
8/11/2004 40
Improved Improved Remained Deteriorated Deteriorated Don’t Know a lot a little stable a little a lot Note: For each type of response, the households are ranked from left to right as: non poor, poor, not feeling poor, and feeling poor.
Figure 21: Perceived Change in Poverty (2001 Survey)
Hence, this suggests that there is a strong persistence in the perception of poverty,
such that investing in increased poverty now with a view to improve significantly poverty
later might be a risky choice from an electoral point of view. This disconnection between the
subjective and the objective changes in poverty raises an important political problem. In a
democratic country like Senegal, this reduces the incentive faced by the government to
actively fight poverty, as the resulting improvement is not correctly perceived as such by the
voters. President Diouf, who presided over the implementation of the growth-boosting
policy in the late 1990s, was beaten at the March 2000 elections, while a sense of “crisis” was
widespread in the electorate. However, nothing proves that the perception by the voters of
the change in poverty played any part in determining this outcome.

8/11/2004 41
5. The Lessons from the Senegal Case Study
The Senegal case study shows that poverty is affected by wide swings, occurring over
short periods of time, so that assessing its true evolution always involves some guesswork,
unless high-frequency data are available. Nevertheless, it seems quite ascertained that
poverty went down significantly during the last decade of the 20th century, from 1991 to
2001, both absolutely and relatively. However, this process was far from linear, and went
through three distinct phases. During the “real-side” adjustment period up to January 1994,
when the exchange rate remained fixed and the governments were unable to cut down their
wage bills all over the UEMOA, poverty and inequality went up. Moreover, this process
mainly affected the rural sector, while the urbanites were much less affected. The model
sketched in the introduction suggests that the increased saving made in anticipation of the
devaluation, with the entailed increase in private investment illustrated at figure 16, played a
large part in protecting the urban incomes. This period witnessed a deep recession in 1993,
which affected the whole region, at the end of a low growth period. Its origin should not be
sought in Senegal, but in Côte d’Ivoire instead (see Azam, 1997).
The devaluation of the CFA franc that occurred in January 1994 changed this
drastically. It entailed both a major macroeconomic shock, and a major reshuffling of the
distribution of income, mainly among the urbanites. The latter got the main blow of the
devaluation, as the fall in the real wages of the civil servants and other public sector
employees spilled over onto the incomes of the urban informal sector. The stratification of
the urban labor market, whereby the savings of the high-wage formal sector workers are
fueling the creation of low-wage jobs in the informal sector, is the transmission channel.
Poverty continued to increase, and at a higher rate, at least in Dakar, until 1996. It is not
possible to document the evolution of poverty over the same period for the rest of the
country. However, the change in the real producer prices in agriculture, which was
documented at figure 15, suggests that poverty also went up in that sector in the wake of the
devaluation, before it improved significantly later on. This fall in the real price of their
output, together with the low level of rainfall, probably created a fall in the peasants’

8/11/2004 42
incomes, which helped provide the incentives to migrate to the cities, where the other sectors
experienced quite a high rate of growth, after 1996.
Therefore, the long delayed devaluation of the CFA franc which occurred in 1994
teaches us a major lesson regarding the poverty impact of macroeconomic policy. While the
devaluation engineered a massive fall in the formal sector wages, this did not reduce poverty
and inequality in the short run. The root of this surprising result lies in the fact that this
policy shock was largely anticipated, while the usual theory assumes that private agents are
surprised by the devaluation. The big difference that this makes is that agents adjust their
consumption and saving decisions when they anticipate a large income shock like the one
which occurred in January 1994. This gives them the means to smooth out their consumption
path, and thus to buffer their income shock. However, in so doing, they reduced massively
their saving and investment flows after the devaluation, triggering a major fall in the
demand for labor in the informal urban sector. This in turn entailed a sizable increase in
urban poverty. In other words, in an economy with a stratified labor market, a common
feature of most poor countries, there is a significant pecuniary externality linking the
incomes of the rich and those of the poor. An anticipated cut in the former leads in due
course to a cut in the latter. The policy lesson is thus that decision makers should not apply
mechanically the lessons of textbook economics, but should instead tailor their policy
packages to the specific cases that they have to deal with. In the case of Senegal, and
probably of most CFA Zone countries, some specific safety nets should have been devised
for protecting the urban poor in the wake of the devaluation.
During the three years following the devaluation, despite the fast recovery of GDP
growth, and the fall in the real wage rates in the urban sector, private investment did not
pick up. It is only after 1996, when the government used the fiscal resources freed by the
reduction in the real value of its wage bill for financing a major increase in public
investment, that the former picked up. The resulting investment boom stretched out the
post-devaluation boom in time, and managed to tide the Senegalese economy over the
regional recession of the year 2000. During this third phase, from 1996 to 2001, the poverty
effect of the accelerated growth seems spectacular. The sustained half-decade growth
8/11/2004 43
succeeded in offsetting the deterioration of poverty and inequality that occurred over the
preceding five years, and brought poverty down well below its 1991 level.
This summary description of the growth and poverty process during the last decade
of the 20th century, until 2001, suggests that macroeconomic policy is playing a major role in
determining the dynamics of poverty. However, when it involves a huge change in relative
incomes, like the 1994 devaluation did, such a policy can also be viewed as a redistribution
policy. The real wages of the formal sector workers were drastically cut, falling by about 40
% until the end of the period. Its impact was thus akin to that of a major increase in income
tax for these people. Nevertheless, the analysis of the time profile of investment suggests that
Senegal could only reap the full benefit of the devaluation when its government chose to use
this fiscal windfall for financing a boom in public investment. The latter was in turn
transmitted to private investment, which boomed also at the end of the century. In other
words, the fiscal effect of the devaluation seems to have played a more important part in
launching and sustaining the post-devaluation boom than the redistribution effect.
Conversely, the success of the pro-poor growth episode of the end of the century, over the
half-decade 1996-2001, is due to the combination of two effects: first, the devaluation reduced
drastically the government’s wage bill, acting in fact like a major increase in the income tax
affecting these people, and second, the resources thus freed were wisely used by the
government for boosting the economy by an appropriate mix of increased public investment
and public debt reduction. The latter combined with various fiscal measures for creating an
“investor-friendly” environment, which invited private investment to follow in the steps of
public investment.
In Senegal thus, the road which leads from a cut in the incomes of the rich to an
increase in the incomes of the poor is quite a complex one. This is probably true also in most
countries of the world. The direct impact, which was dominant in the short run, entailed a
transmission in the same direction of the income shock affecting the rich onto the poor,
leading to a simultaneous fall in the incomes of these two groups, at least in Dakar. By
contrast, the indirect effect through public and private investment reduced poverty and
inequality. The latter effect is by no means mechanical, and many other governments would
8/11/2004 44
have wasted the fiscal windfall so created by the devaluation. The bottom line is that pro-
poor growth occurred at the end of the century because the government engineered a
sustainable change in the functional distribution of income, from wages to profits, and not
just a transfer of income from the rich to the poor. This change was obtained by an increase
in public investment and the creation of an “investor-friendly” environment, based on low
corporate taxation and low public debt.
This is the core lesson of Senegal’s pro-poor growth experience: profitability fuels
private investment, and the latter is the engine of sustained growth. This simple message has
been emphasized time and again in the literature (e.g. Malinvaud, 1980). As the former
chancellor of West Germany Helmut Schmit used to say: “The profits of today are the
investments of to morrow and the investments of to morrow make the employment of the
day after to morrow” (cited in Malinvaud, 1980, p.4). Therefore, as poverty is liable to lag
significantly behind growth, it takes a sustained effort in favor of profitability to pull a
significant number of people out of poverty. The Senegalese experience described above
shows that devaluation is only one of the possible means that can be used for that purpose,
acting like a tax on formal sector wages. It suggests that timely and efficient public
investment is also quite important, as is important to cut the public debt overhang. These are
probably not the only ways that profitability can be supported, and other means to the same
end should be sought in different institutional and political settings. The unprecedented
stretch of fast economic growth that resulted from this strategy managed to pull a large share
of the Senegalese population out of poverty. Unfortunately, from the point of view of the
incumbent government, the objective reduction in poverty was not correctly perceived by
the voters. This was shown by the survey performed in 2001 on the subjective perception of
poverty. It might also have played a part in determining the election results of the year 2000,
where the incumbent government was ousted. Although it is not certain that the
misperception of the change in poverty played a significant part in this outcome, it might
have had some impact. May be, in a democratic polity like Senegal, the true political
challenge is to find a strategy for reducing the subjective perception of poverty. The latter
8/11/2004 45
probably affects electoral outcomes, and no genuine “ownership” of pro-poor growth policy
will emerge without it in democratic countries.
References
Azam, Jean-Paul (1993): “The ‘Côte d’Ivoire’ Model of Economic Growth”, European Economic
Review, 37, 566-576.
Azam, Jean-Paul (1995): “L’Etat auto-géré en Afrique”, Revue d’économie du développement, 1-
19, 1995/4.
Azam, Jean-Paul (1997): “Public Debt and the Exchange rate in the CFA Franc Zone”, Journal
of African Economies, 6 (1), 54-84.
Azam, Jean-Paul (2003): “A Theory of Poverty Aversion and Civil Society Development”,
Economics and Politics 15 (1), 61-84, March 2003.
Azam, Jean-Paul (2004): “Poverty and Growth in the WAEMU after the 1994 Devaluation”,
Journal of African Economies (forthcoming).
Azam, Jean-Paul, Bruno Biais, Magueye Dia and Christine Maurel (2001): “Informal and
Formal Credit Markets and Credit Rationing in Côte d’Ivoire”, Oxford Review of
Economic Policy, 17 (4), 520-534, Winter 2001.
Azam, Jean-Paul, Bruno Biais and Magueye Dia (2004): “Privatization versus Regulation in
Developing Economies : The Case of West African Banks”, Journal of African
Economies, 13 (3), 361-394.
Azam, Jean-Paul and Gérard Chambas (1999): “The Groundnuts and Phosphates Boom in
Sénégal (1974-1977)”, in Paul Collier and Jan Willem Gunning (eds.): Temporary Trade
Shocks in Developing Countries, Vol. 1, 226-258, Oxford University Press: Oxford.
Azam, Jean-Paul, Magueye Dia and Tchétché N’Guessan (2002): Telecom Sector Reform in
Senegal, World Bank Working Paper, WPS 2894 : Washington, D.C.
(http ://www.worldbank.org/html/dec/ Publications/Workpapers/home.html)
(Reproduced in: International Training Program on Utility Regulation and Strategy, CD-
ROM, Public Utility Research Center, University of Florida, 2003).

8/11/2004 46
Azam, Jean-Paul, and Waly Wane (1999): The Impact of the Devaluation of the CFA Franc on
Poverty in the WAEMU, unpublished, World Bank : Washington, D.C.
Berthélemy, Jean-Claude, Abdoulaye Seck and Ann Vourc’h (1996): La croissance au Sénégal:
un pari perdu?, Etudes du centre de développement de l’OCDE: Paris.
Boone, Catherine (2003): Political Topographies of the African State, Cambridge University
Press: Cambridge.
Cohen, Daniel (1993): “Low Investment and Large LDC Debt in the 1980s”, American
Economic Review, 83, 437-449.
Diagne, Abdoulaye, and Gaye Daffé (eds.) (2002): Le Sénégal en quête d’une croissance durable,
CREA – Karthala: Paris.
Eaton, Jonathan (1993): “Sovereign Debt: A Primer”, World Bank Economic Review, 7, 137-172.
Foster, James, Joel Greer and Erik Thorbecke (1984) : “A Class of Decomposable Poverty
Measures”, Econometrica, 52, 761-66.
Ka, Samba, and Nicolas Van de Walle (1994): “Senegal: Stalled Reform in a Dominant Party
System”, in Stephan Haggard and Steven B. Webb (eds.): Voting for Reform.
Democracy, Political Liberalization, and Economic Adjustment, 290-359, Oxford University
Press: Oxford.
Kanbur, Ravi (1991): “Projects versus Policy Reform”, Annual Conference on Development
Economics 1990, 397-413, World Bank : Washington, D.C.
Lewis, W. Arthur (1954): “Economic Development with Unlimited Supplies of Labour”,
Manchester School, 22, 139-191.
Loum, Mamadou Lamine (2001): La Sénégal au 1er avril 2000, EXCAF Editions : Dakar.
Malinvaud, Edmond (1980): Profitability and Unemployment, Cambridge University Press:
Cambridge.
Manchuelle, François (1997): Willing Migrants. Soninke Labor Diasporas, 1848-1960, Ohio
University Press: Athens.
Rama, Martin (2000) : “Wage Misalignment in CFA Countries : Were Labour Market Policies
to Blame ?”, Journal of African Economies, 9 (4), 475-511.
8/11/2004 47
Ravallion, Martin, and Shaohua Chen (2003): “Measuring Pro-Poor Growth”, Economics
Letters, 78, 93-99.
République du Sénégal (2004): La pauvreté au Sénégal: de la dévaluation de 1994 à 2001-2002,
Ministère de l’économie et des finances, Direction de la prévision et de la statistique,
version préliminaire, Dakar: janvier 2004.
Rouis, Mustapha (1994): “Senegal: Stabilization, Partial Adjustment, and Stagnation”, in
Ishrat Husain and Rashid Faruqee (eds.): Adjustment in Africa: Lessons from case
Studies, 286-351, The World Bank: Washington, D.C.
Schaffer, Frederic C. (1998): Democracy in Translation, Cornell University Press: Ithaca.
Van de Walle, Nicolas (1991) : “The Decline of the Franc Zone : Monetary Politics in
Francophone Africa”, African Affairs, 90, 383-405.
Watts, H. W. (1968): “An Economic Definition of Poverty”, in D. P. Moynihan (Ed.): On
Understanding Poverty, Basic Books: New York.
World Bank (1993): Sénégal: An Assessment of Living Conditions, Report No.12517 SE, The
World Bank, Washington D.C., May 1993.