prioritising the enablers for the successful ...eprints.hud.ac.uk/id/eprint/33885/1/ma et al -...
TRANSCRIPT

21
Prioritising the enablers for the successful implementation of Kaizen in
China: a Fuzzy AHP study
Jie Ma1, Zhibin Lin1*, Chi Keung Lau1
1Newcastle Business School,
Northumbria University,
Newcastle upon Tyne NE1 8ST
United Kingdom
*corresponding author: [email protected]
Please cite:
Ma, J. Lin, Z. and Lau, C.K. (forthcoming) Prioritising the enablers for the successful
implementation of Kaizen in China: a Fuzzy AHP study, International Journal of Quality &
Reliability Management. In Press. doi: 10.1108/IJQRM-12-2015-0173.
Abstract
Purpose – The main purpose of this study is to develop a better understanding of how Sino-
Japanese joint ventures implemented the three Japanese improvement methods, i.e. Kaizen,
Kaikaku and Kaizen Blitz. The specific objectives of this study are: (a) to identify the key
enablers for the three improvement methods; and (b) to identify the most selected
improvement method.
Design/methodology/approach – This study employs fuzzy analytic hierarchy process to
pairwise-compare the three improvement methods. The data are collected from 28 industry
experts from Sino-Japanese joint ventures. The study then adopts extent analysis approach for
pairwise comparisons and extent analysis to obtain synthetic extent values for priority
weights.
Findings – The results of the study indicate that Personnel (humanware) factor enablers are

21
the most important factor for Kaizen, whilst Software factor enablers (essential rules, policies
and institutional arrangements) weight second and Hardware factor enablers (physical,
measurable hard facts or resources) weight last. The study also reviews that Kaizen is the
most selected improvement method among the three.
Research limitations/limitations – The sample of this study is limited to Sino-Japanese
ventures in Guangzhou, China. This study only identifies the key improvement enablers
based on interviews with shop floor managers and improvement experts.
Practical implications –Practical implications are also threefold: (a) the improvement
implementations should be based on factors such as regular training, incentives for
motivations and shop-floor management; (b) improvement methods are transferable and
standard operations may only have small effects on collecting improvement ideas; and (c)
Kaizen is the appropriate method to support long-term and process-oriented improvements.
Originality/value –This study is the first to specifically pairwise-compare the three Japanese
improvement methods and to identify priorities of their key enablers in Sino-Japanese joint
ventures.
Keywords: Kaizen; AHP; Fuzzy; Decision support; China.
Paper type: Research paper
21
1. Introduction
Kaizen (Imai, 1986) is one of its foundations to support other lean tools and processes
(Womack, Jones, & Roos, 1990). However, like other Japanese production management
systems, Kaizen is complex, inter-related and context-dependent (García, Maldonado,
Alvarado, & Rivera, 2014; Taylor & Taylor, 2008). Many existing studies have agreed that
adopting and implementing Kaizen is not always straightforward (Aoki, 2008; Brunet &
New, 2003; Caffyn, 1999) and particularly hard to sustain in the long term (Bessant, Caffyn,
Gilbert, Harding, & Webb, 1994). In addition, Kaizen is thought to be underpinned by the
unique Japanese culture (Hong, Snell, & Easterby-Smith, 2006; Liker & Hoseus, 2008; Recht
& Wilderom, 1998), and thus companies outside Japan could face difficulties when selecting
the appropriate supporting tools and techniques (Bessant et al., 1994) and would need more
time to adopt and implement this improvement method (Hines, Holweg, & Rich, 2004). In
addition, two other improvement methods are recently becoming more popular, Kaizen blitz
(or Kaizen events) and Kaikaku (Radical changes) (Bicheno, 2001; Browning & Heath, 2009;
Done, Voss, & Rytter, 2011; Wiljeana J. Glover, Jennifer A. Farris, & Eileen M. Van Aken,
2014; Glover, Liu, Farris, & Van Aken, 2013; Radnor, Holweg, & Waring, 2012; Santos,
Wysk, & Torres, 2014). These methods differ in terms of the time scale for implementation
and whether the improvement is continuous or one-off, and have different enablers for their
implementation (Fryer, Antony, & Douglas, 2007; García et al., 2014).
Both lean production and these improvement methods were introduced into China in
the early 1980s by foreign manufacturing companies (Huang & Liu, 2005; Taj, 2008),
particularly those from Japan (Aoki, 2008; Hong, Easterby‐Smith, & Snell, 2006; Lee, 1996).
Over the following two decades, many Sino-international automotive joint ventures were
established. Since the 2000s, China has been the world’s leading automotive producer in term
of volume and one of the world’s most popular automotive outsourcing destinations. Many

21
major Japanese car assemblers and their parts suppliers have established joint ventures in
China (Calantone & Zhao, 2001) and many of them have successfully transferred the
advanced production technology, management knowledge and improvement skills to the
Chinese ventures (Aoki, 2008; Shang & Pheng, 2013; Suárez-Barraza & Smith, 2014).
Nevertheless, the direct transfer of Japanese Kaizen practice to China may encounter
difficulties (Hong, Snell, et al., 2006). The Sino-Japan joint ventures may be affected by the
Chinese cultural and constitutional settings (see Zhang & Goffin, 1999) and might have some
different priorities for the key enablers of Kaizen or localised enablers to adopt and
implement improvements (Aoki, 2008). As stated by Aoki (2008), there is still a large gap in
the literature in terms of how Kaizen activities are organised in countries outside Japan.
This study thus aimed to develop a better understanding of how Sino-Japan joint
ventures have adopted and implemented the three types of improvement methods, i.e. Kaizen,
Kaikaku and Kaizen blitz. The specific objectives of this study are:
a) to identify priorities of the key enablers for successful implementation of the three
improvement methods based on the proposed model; and
b) to identify the most selected improvement method.
The study was conducted based upon a series interview of 28 industry experts from four
Sino-Japanese automotive joint ventures. The data were collected based on a nine-point
pairwise-comparison scale. The priorities of the key enablers were decided by a fuzzy
Analytic Hierarchy Process using triangular fuzzy numbers. This study has three theoretical
contributions: a) developing a generic hierarchy model for prioritising the key enablers for
improvement implementations; b) revealing a set of key enablers unique to Chinese context;
and c) indicating that Kaizen is the most selected method among the three improvement
alternatives. The findings should fulfil the needs of both academics and practitioners in the

21
existing body of knowledge. They should provide some useful guidelines and methods that
can be used by companies based outside of Japan to adopt and implement Kaizen.
The paper is organised as follows: section 2 reviews the literature on the three
improvement methods and the key enablers of improvement. Sections 3 presents the research
methodologies. Section 4 explains the steps involved in data collection, analysis and results.
Finally, in Section 5 the conclusions and recommendations for future research are presented.

21
2. Literature review
2.1 The three improvement methods: Kaizen, Kaikaku and Kaizen blitz
In recent years, adopting and implementing improvements for long-term and sustainable
outcomes have received considerable attention in the literature (Done et al., 2011; Radnor et
al., 2012; Shang & Pheng, 2013; Singh & Singh, 2015; Van Aken, Farris, Glover, & Letens,
2010). Improvement method selection is a multi-criteria problem, as there are many different
enablers (Fryer et al., 2007; Fryer, Ogden, & Anthony, 2013; García, Rivera, & Iniesta,
2013), enablers (Bateman, 2005; Bessant, Caffyn, & Gallagher, 2001; Caffyn, 1999) or
essential criteria (Kaye & Anderson, 1999) to support improvement implementations.
Depending on different time scape for implementation and whether the improvement is
continuous or one-off, the improvement methods can be categorised into three types: Kaizen,
Kaikaku and Kaizen blitz.
Kaizen is a process-oriented improvement method. It focuses on the course of the
implementation and aims to produce cumulative results from an incremental change process.
It is a “never ending” (Bond, 1999, p320) “on-going improvement” (Imai, 1986, p3) “of a
cumulative character” (Marin-Garcia, del Val, & Martin, 2008, p57) and with a “top-
down…and…bottom-up” framework (Bessant & Francis, 1999, p1109). It instils in everyone
within the organisation (Terziovski & Sohal, 2000) a sense of responsibility for implementing
improvements on a continuous basis (Monden, 1983), such as habitually providing both
personal suggestions (Imai, 1986) and implementing group-based improvement activities
(Handyside, 1997). Therefore, Kaizen is “not of the breakthrough variety, but incremental in
nature” (Bessant & Caffyn, 1997, p10). It is “an organisational-wide process of focused and
sustained incremental innovation” (Bessant & Francis, 1999, p1106); or “a habitual way of
life in the organisation” (Handyside, 1997, p14) to develop and implement all sorts of
improvement ideas in a constant manner (Chartered Quality Institute, 2011). Management
21
approval is only needed for large improvement ideas, whilst small changes can be
implemented without the prior approval of management (Crocker, Chiu, & Charney, 1984).
Intrinsic psychological rewards (e.g., self-motivation) are commonly used to boost
participation (Brunet & New, 2003; Máire Kerrin, 1999).
The discontinuous improvement, on the other hand, is called innovation or Kaikaku in
Japanese. It is a results-oriented method and characterised by its ‘one-off’ but innovative
results. The implementation of the Kaikaku is different from Kaizen (Imai, 1986). The
Kaikaku methods (Bodek, 2004) generally emphasise breakthrough improvement ideas for
dramatic alterations (Hines et al., 2004) and radical changes (Bhuiyan & Baghel, 2005). It
requires significant investment in capital (Terziovski & Sohal, 2000), new technologies or
equipment (Nihon HR Kyōkai, 1995, pp., p8) and can take a long time (Sayer & Williams,
2012) to generate “a large and fundamental change of policy, practice, or awareness” (Bodek,
2004, pix). Handyside (1997, p16) indicated that Kaikaku is “usually characterised by
revolutionary new processes, advanced technologies and high capital investment”. These
non-gradual methods do not necessarily sustain long-term improvements and achieve long-
term targets (Imai, 1986).
Kaizen blitz (Laraia, Moody, & Hall, 1999), Kaizen event (Doolen, Worley, Van Aken,
& Farris, 2003), or Kaizen burst (Liker & Meier, 2006) are short-term (e.g., 3-5 days)
improvement methods (Graban & Swartz, 2012; Natale, Uppal, & Wang, 2014). They are
generally based on the ideas or proposals of managers, technicians or consultants (Bodek,
2002; Marin-Garcia et al., 2008) rather than involving all staff members of a company
(Terziovski & Sohal, 2000). This cross-functional team usually focuses on large
improvements on few targeted areas (Bessant et al., 2001; Farris, Van Aken, Doolen, &
Worley, 2009). Most of this types of improvement ideas are not implemented by the
proposers (Nihon HR Kyōkai, 1995). Thus, extrinsic rewards (e.g., financial incentives) are

21
necessary to stimulate participation (Yasuda, 1989), but they are commonly associated with
the final improvement outcomes (Imai, 1986). Thus, this type of improvement methods could
suffer from low participation and low acceptance rates (Hull, Azumi, & Wharton, 1988).
2.2 Key enablers for implementing continuous improvement
Various versions of key enablers or critical successful factors (CSFs) for continuous
improvement have been identified (e.g. Fryer et al., 2007; García et al., 2014; Handyside,
1997; Kaye & Anderson, 1999). For instance, Handyside (1997) highlighted the importance
of shop floor management, employee involvement, and teamwork. Fryer et al. (2007)
identified six key enablers for adopting Kaizen in manufacturing organisations: strong and
committed leadership from senior management team; communication; learning and training;
quality culture; customer management; and quality data.
According to Lillrank and Kano (1989), the critical factors for improvement
implementations can be grouped into three categories: Hardware, Software, and Personnel
(Humanware).
2.2.1 The hardware factors
The Hardware factors provide improvement implementations with appropriate and enough
measureable hard facts (Lillrank & Kano, 1989). These involve all the physical support (i.e.,
technology and machinery), extra labour (i.e., Kaizen experts) and financial budgets (i.e.,
monetary investment). Installing high technology is always accepted in the workplace to
create radical changes in Kaizen event (Brunet & New, 2003; Doolen, Van Aken, Farris,
Worley, & Huwe, 2008). This is associated with the use of new machinery to offer better
production facilities in order to meet higher requirements (Wiljeana J. Glover, Jennifer A
Farris, & Eileen M Van Aken, 2014). In addition, hiring project-based improvement experts
and outside lean consultants to coach and intervene the improvement implementations are

21
sometimes promoted at the beginning of the Kaizen journey (Alstrup, 2000; Bateman & Rich,
2003). Monetary investment therefore, is needed to provide financial support and use as an
important form of extrinsic rewards to motivate and facilitate improvement participations
(Maire Kerrin & Oliver, 2002; Ma, 2014).
2.2.2 The software factors
The Software factors embraces a wide range of shop floor rules, routines, procedures, policies
and institutional arrangements for improvement implementations (Lillrank & Kano, 1989).
Ma (2014) advocates that the shop floor is considered one of the most important areas within
an organisation. On the shop floor, Standard operation procedure is a key activity for
creating effective work flow and improving product quality (Liker, 2004). It also supports
many shop floor management tools and techniques (e.g.,5S, visual management, waste
removal, etc.) to form the foundation of continuous improvement (Bateman, 2005). These
tools and techniques are commonly used together to search for shop floor problems, identify
the root causes of variations (Hines, Found, Griffiths, & Harrison, 2008) and increase shop
floor performance (Letmathe, Schweitzer, & Zielinski, 2012). Once the root causes of the
problems are accurately detected, an effective improvement system is needed to collect all
scales (i.e., either in a group based or individually) improvement suggestions/ideas (Marin-
Garcia & Poveda, 2010). The environment to collect group based improvement
suggestions/ideas is strengthened by an open communication network (Dorfman et al., 1997).
This network can benefit the two-way (top-down and bottom-up) information sharing (Choi
& Liker, 1995) and promote freedom and originality for suggestions dissemination (Phan,
Abdallah, & Matsui, 2011; Takeuchi, Osono, & Shimizu, 2008). In addition, organisations
concentrating on training and learning (Fryer et al., 2007), such as the regular on-/off-the-job
training and job rotation/relocation schemes can benefit the development of individual
suggestions/ideas (Kumar, Kumar, de Grosbois, & Choisne, 2009; Vinodh & Chintha, 2011).

21
Employees can constantly acquire new skills and raise awareness of making improvement
suggestions (Ariga, Kurosawa, Ohtake, Sasaki, & Yamane, 2013). Incentive rewards can also
be used to motivate employees to regularly participate in improvement and develop both
large and small suggestions (Govindarajulu & Daily, 2004). Review and feedback should be
given to the suggestions in a timely manner (Chin, Pun, Xu, & Chan, 2002). It is argued that
an effective benchmarking/feedback system is a thrust of long-term improvement
implementations (Bond, 1999; Çiçek, Köksal, & Özdemirel, 2005). Furthermore, the
improvement culture is also an essential factor (Marin-Garcia & Poveda, 2010; Shortell et al.,
1995; Singh & Singh, 2015). As Fryer et al. (2007) stress, a quality culture with an ambition
to accumulate habitual changes can create support for continuous improvement.
2.2.3 The personnel factors
The personnel factors include all human resources (Lillrank & Kano, 1989), as continuous
improvement requires a high value on of humanware’s involvement and participation
(Bessant et al., 1994). Top managers have the senior strategic roles of leadership, direction
setting and provide appropriate commitments to support improvement implementations
(Kaye & Anderson, 1999). Middle managers are in a key position in relation to the line
managers and shop floor personnel to act as an intermediary for maturation of ‘strong worker
mentality’ and to repopularise and resimplify the quality theory for improvement after the
initial contribution made by the top management (Savolainen, 1999). Line managers are the
auxiliary personnel who play an important role in supervising large improvement processes.
They also motivate, collect, review, and small implement ideas (Montabon, 2005). Shop floor
personnel is responsible for work-related improvement ideas (Aoki, 2008). As suggested by
Marin-Garcia et al. (2008), those ideas should be developed based on their hands-on
knowledge to resolve local problems within their immediate working area. The participation
of the rest of the humanware (i.e., non-production personnel) is also critical to support
21
improvement implementations. It is argued that non-production personnel can also provide
valuable suggestions if they actively involve in improvement activities (Terziovski & Sohal,
2000).
The key enablers for improvement implementations may change over time (e.g. Farris et
al., 2009; Fryer et al., 2007; García et al., 2014; Handyside, 1997; Kaye & Anderson, 1999)
and may vary for different organisations, countries or cultures (Brotherton & Shaw, 1996). In
particular, although some factors (e.g. management commitment and regular training for
employees) were universally cited as being critical (Aoki, 2008; García et al., 2014), whilst
some other key factors were rather neglected or. For instance, shop floor management has
been described as the beginning of Kaizen journey to contain many practices (e.g. 5S
practice, visual management, standard operations and waste removal) for improvement
(Bateman & Brander, 2000; Handyside, 1997; Hirano, 1996), but less attention has been paid
in some studies (Bessant et al., 1994; Caffyn, 1999; Fryer et al., 2007). Moreover, in Japan,
there is a strong emphasis on teamwork or groupism for Kaizen, but this building block has
not been considered in the studies by Fryer et al. (2007) and Kaye and Anderson (1999).
21
3. Methodology
3.1 The fuzzy analytical hierarch process
Improvement method selection is complicated and it is multi-criteria decision problem. The
fuzzy analytical hierarchy process (FAHP) is an effective procedure to solve complex
decision making problems (Buckley, 1985), using experts’ experience and tacit knowledge
(Saaty, 1994). It is based on Saaty’s (1980) original analytical hierarchy process (AHP), but
offers better abilities to decompose and evaluate multiple criteria when handling uncertainty
due to imprecision or vagueness in decision making process. The FAHP uses fuzzy ratios
(Zadeh, 1965), rather than the AHP’s crisp nine-point scale (Buckley, 1985), to make
pairwise comparisons and reduce bias (Van Laarhoven & Pedrycz, 1983). The fuzzy ratios
consist of a set of objects with a continuum of grades of values to represent vague data.
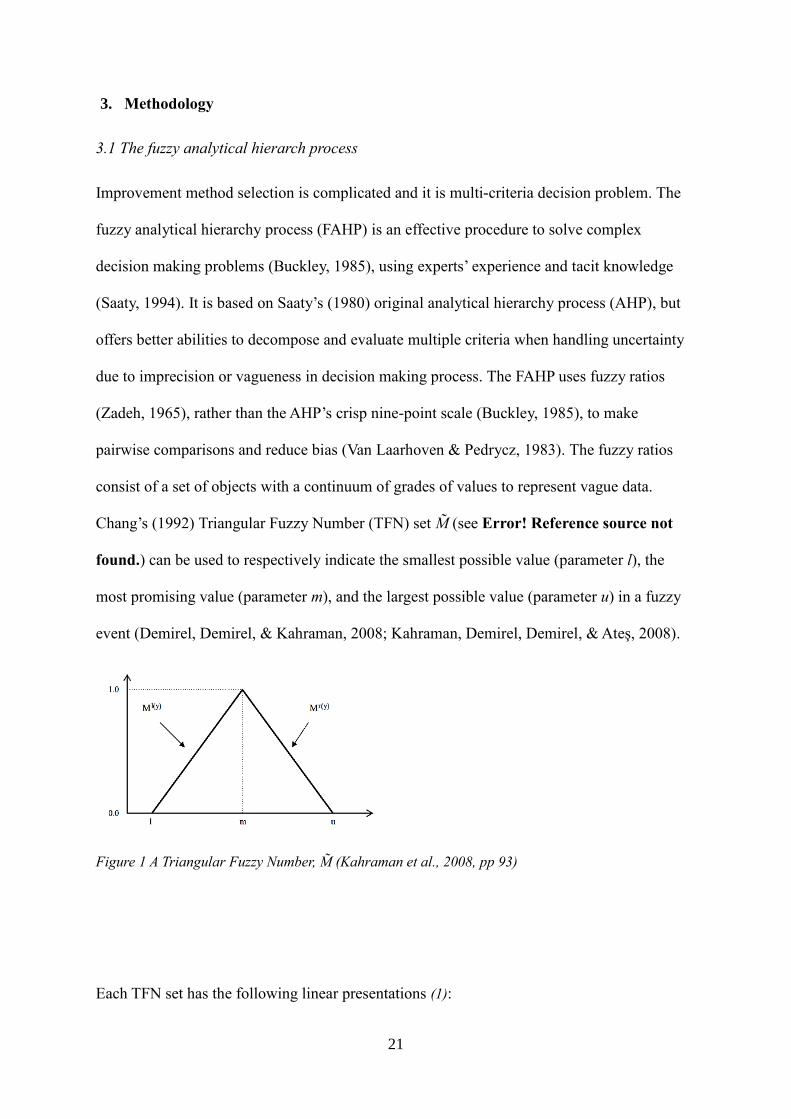
Chang’s (1992) Triangular Fuzzy Number (TFN) set M̃ (see Error! Reference source not
found.) can be used to respectively indicate the smallest possible value (parameter l), the
most promising value (parameter m), and the largest possible value (parameter u) in a fuzzy
event (Demirel, Demirel, & Kahraman, 2008; Kahraman, Demirel, Demirel, & Ateş, 2008).
Figure 1 A Triangular Fuzzy Number, M̃ (Kahraman et al., 2008, pp 93)
Each TFN set has the following linear presentations (1):

21
𝜇 (𝑥
�̃�) = {
0, 𝑥 < 1 (𝑥 − 𝑙)/ (𝑚 − 𝑙), 1 < 𝑥 < 𝑚(𝑢 − 𝑥)/(𝑢 − 𝑚), 𝑥 > 1
}
(1)
Each TFN set can be given by its corresponding left 𝑙(𝑦) and right 𝑟(𝑦) representation of
each degree of membership as (2):
�̃� = (𝑀𝑙(𝑦), 𝑀𝑟(𝑦) = (𝑙 + (𝑚 − 𝑙)𝑦, 𝑢 + (𝑚 − 𝑢)𝑦) 𝑦 ∈ [0,1] (2)
3.2 The extent analysis method of fuzzy analytical hierarch
This study adopts Chang’s (1992) extent analysis approach. This approach uses TFN for
pairwise comparisons and extent analysis method to obtain synthetic extent values for priority
weights. It is one of the most commonly used approaches for FAHP solutions and relatively
easier than many other FAHP approaches (e.g., Buckley, 1985; Cheng, 1997; Stam, Sun, &
Haines, 1996; Weck, Klocke, Schell, & Rüenauver, 1997). Following Chang (1992, 1996), let
𝑋 = {𝑥1, 𝑥2, … , 𝑥𝑛} be an object set and 𝑈 = {𝑢1, 𝑢2, … , 𝑢𝑚} be a goal set. Each object is then
taken and extent analysis can be used for each goal respectively. Therefore, the above TFN set
�̃� would be obtained as (3) where all 𝑀g𝑖𝑗
(𝑗 = 1, 2, … , 𝑚) are TFNs:
𝑀g𝑖1 , 𝑀g𝑖
2 , … , 𝑀g𝑖𝑚 𝑖 = 1, 2, … 𝑛; (3)
Chang’s (1992, 1996) extend analysis approach has 4 steps:
21
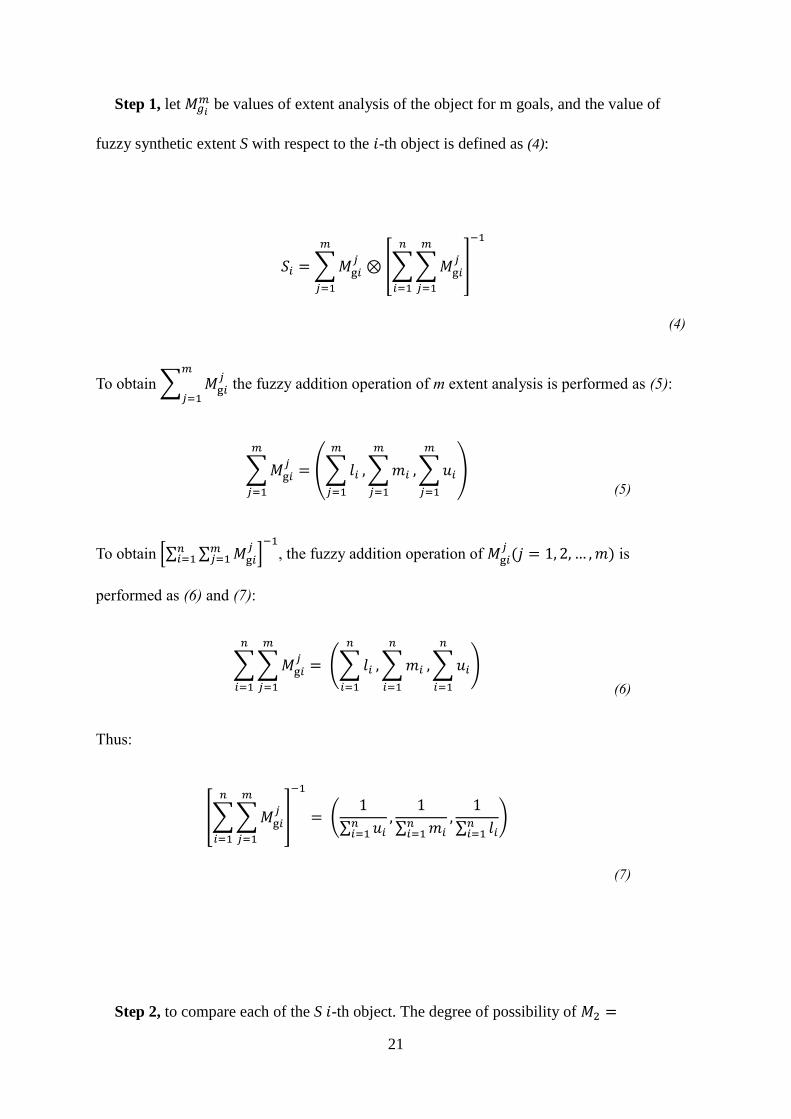
Step 1, let 𝑀𝑔𝑖
𝑚 be values of extent analysis of the object for m goals, and the value of
fuzzy synthetic extent S with respect to the 𝑖-th object is defined as (4):
𝑆𝑖 = ∑ 𝑀g𝑖𝑗
⊗ [∑ ∑ 𝑀g𝑖𝑗
𝑚
𝑗=1
𝑛
𝑖=1
]
−1𝑚
𝑗=1
(4)
To obtain ∑ 𝑀g𝑖𝑗
𝑚
𝑗=1 the fuzzy addition operation of m extent analysis is performed as (5):
∑ 𝑀g𝑖𝑗
𝑚
𝑗=1
= (∑ 𝑙𝑖
𝑚
𝑗=1
, ∑ 𝑚𝑖
𝑚
𝑗=1
, ∑ 𝑢𝑖
𝑚
𝑗=1
)
(5)
To obtain [∑ ∑ 𝑀g𝑖𝑗𝑚
𝑗=1𝑛𝑖=1 ]
−1
, the fuzzy addition operation of 𝑀g𝑖𝑗
(𝑗 = 1, 2, … , 𝑚) is
performed as (6) and (7):
∑ ∑ 𝑀g𝑖
𝑗
𝑚
𝑗=1
𝑛
𝑖=1
= (∑ 𝑙𝑖
𝑛
𝑖=1
, ∑ 𝑚𝑖
𝑛
𝑖=1
, ∑ 𝑢𝑖
𝑛
𝑖=1
)
(6)
Thus:
[∑ ∑ 𝑀g𝑖𝑗
𝑚
𝑗=1
𝑛
𝑖=1
]
−1
= (1
∑ 𝑢𝑖𝑛𝑖=1
,1
∑ 𝑚𝑖𝑛𝑖=1
,1
∑ 𝑙𝑖𝑛𝑖=1
)
(7)
Step 2, to compare each of the S 𝑖-th object. The degree of possibility of 𝑀2 =

21
(𝑙2, 𝑚2, 𝑢2) ≥ 𝑀1 = (𝑙1, 𝑚1, 𝑢1) is defined as (8).
𝑉(𝑀2 ≥ 𝑀1) = 𝑠𝑢𝑝𝑦≥𝑥 ⌊min (𝜇𝑀1(𝑥), 𝜇𝑀2
(𝑦))⌋ (8)
It can be equivalently expressed as (9):
𝑉(𝑀2 ≥ 𝑀1) = ℎ𝑔𝑡(𝑀1 ∩ 𝑀2) = 𝜇𝑀2(𝑑)
= {
1, if 𝑚2 ≥ 𝑚1
0, if 𝑙1 ≥ 𝑢2
(𝑙1 − 𝑢2) (𝑚2 − 𝑢2) − (𝑚1 − 𝑙1), otherwise ⁄ }
(9)
Where d is the ordinate of the highest intersection point between 𝑀1 and 𝑀2 (see Figure 2).
𝑀1 and 𝑀2 is compared based on the values of 𝑉(𝑀1 ≥ 𝑀2) and 𝑉(𝑀2 ≥ 𝑀1).
Figure 2 the intersection between M1 and M2 (Demirel et al., 2008, pp72)
Step 3, the degree of possibility for a convex fuzzy number to be greater than k convex fuzzy
numbers 𝑀𝑖(𝑖 = 1, 2, … , 𝑘) can be defined (10), (11) and (12):
𝑉(𝑀 ≥ 𝑀1, 𝑀2, … 𝑀𝑘)
= 𝑉[(𝑀 ≥ 𝑀1) and (𝑀 ≥ 𝑀2) and … and (𝑀 ≥ 𝑀𝑘)]
= min𝑉(𝑀 ≥ 𝑀𝑖), 𝑖 = 1, 2, … , 𝑘
(10)
Assume that
21
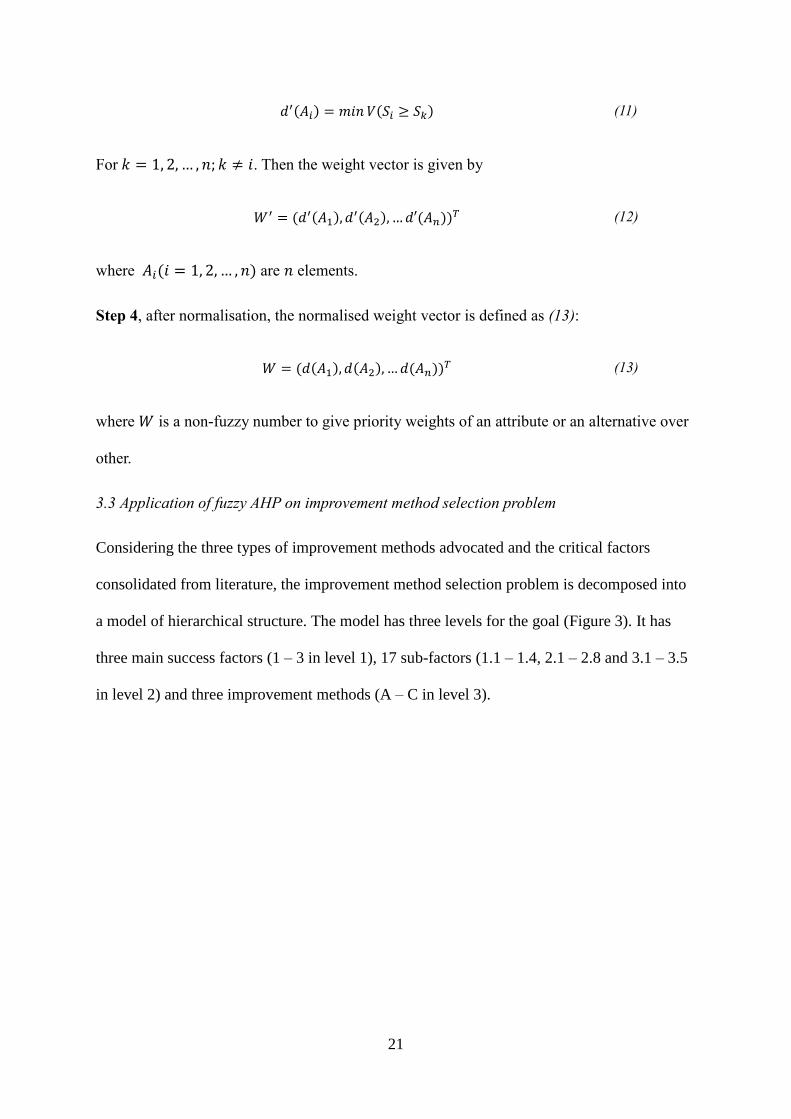
𝑑′(𝐴𝑖) = 𝑚𝑖𝑛 𝑉(𝑆𝑖 ≥ 𝑆𝑘) (11)
For 𝑘 = 1, 2, … , 𝑛; 𝑘 ≠ 𝑖. Then the weight vector is given by
𝑊′ = (𝑑′(𝐴1), 𝑑′(𝐴2), … 𝑑′(𝐴𝑛))𝑇 (12)
where 𝐴𝑖(𝑖 = 1, 2, … , 𝑛) are 𝑛 elements.
Step 4, after normalisation, the normalised weight vector is defined as (13):
𝑊 = (𝑑(𝐴1), 𝑑(𝐴2), … 𝑑(𝐴𝑛))𝑇 (13)
where 𝑊 is a non-fuzzy number to give priority weights of an attribute or an alternative over
other.
3.3 Application of fuzzy AHP on improvement method selection problem
Considering the three types of improvement methods advocated and the critical factors
consolidated from literature, the improvement method selection problem is decomposed into
a model of hierarchical structure. The model has three levels for the goal (Figure 3). It has
three main success factors (1 – 3 in level 1), 17 sub-factors (1.1 – 1.4, 2.1 – 2.8 and 3.1 – 3.5
in level 2) and three improvement methods (A – C in level 3).
21
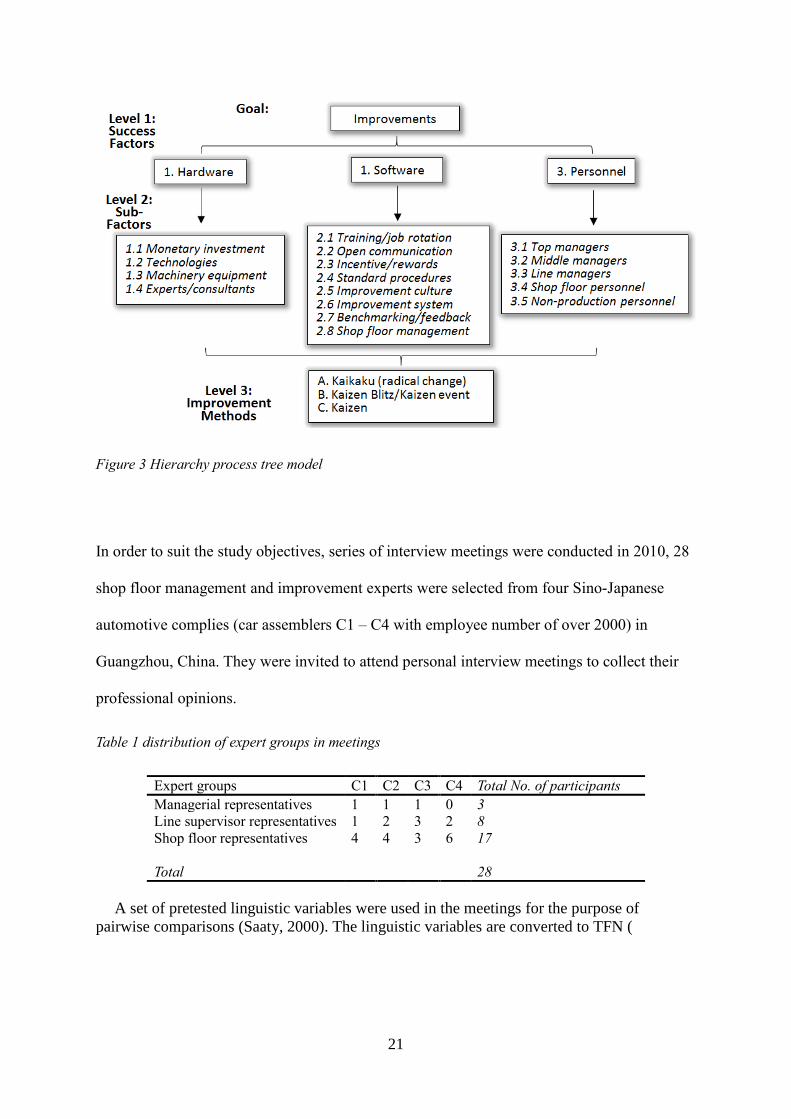
Figure 3 Hierarchy process tree model
In order to suit the study objectives, series of interview meetings were conducted in 2010, 28
shop floor management and improvement experts were selected from four Sino-Japanese
automotive complies (car assemblers C1 – C4 with employee number of over 2000) in
Guangzhou, China. They were invited to attend personal interview meetings to collect their
professional opinions.
Table 1 distribution of expert groups in meetings
Expert groups C1 C2 C3 C4 Total No. of participants
Managerial representatives 1 1 1 0 3
Line supervisor representatives 1 2 3 2 8
Shop floor representatives 4 4 3 6 17
Total
28
A set of pretested linguistic variables were used in the meetings for the purpose of
pairwise comparisons (Saaty, 2000). The linguistic variables are converted to TFN (

18
Table 2).

19
Table 2 The triangular fuzzy numbers
Definition Fuzzy AHP Scale
Equally preferred (1, 1, 1)
Weakly preferred (2/3, 1, 3/2)
Fairly strongly preferred (3/2, 2, 5/2)
Very strongly preferred (5/2, 3, 7/2)
Absolutely preferred (7/2, 4, 9/2)
Thirdly, the Chang’s (1992, 1996) four-step extend analysis approach was followed to 1)
calculate the priority weights for all factors and sub-factors; 2) compute the global priority
weights to choose the best improvement methods; and finally 3) the priority weights of the
improvement methods with respect to the main attributes.

20
4. Results
The level 1 success factors: hardware, software and personnel on improvement method
selections are compared in Error! Reference source not found..
Table 3 Evaluation of main attributes with respect to improvement
1. Hardware 2. Software 3. Personnel
1. Hardware (1, 1, 1) (2/3, 1, 3/2) (2/7, 1/3, 2/5)
2. Software (2/3, 1, 3/2) (1, 1, 1) (3/2, 2, 5/2)
3. Personnel (5/2, 3, 7/2) (2/5, 1/2, 2/3) (1, 1, 1)
The level 2 sub-factors on improvement are compared in
Table 4 - Table 6.
Table 4 Evaluation of sub-factors of hardware factors
1.1 1.2 1.3 1.4
1.1 (1, 1, 1) (2/5, 1/2, 2/3) (2/3, 1, 3/2) (1, 1, 1)
1.2 (3/2, 2, 5/2) (1, 1, 1) (2/3, 1, 3/2) (3/2, 2, 5/2)
1.3 (2/3, 1, 3/2) (2/3, 1, 3/2) (1, 1, 1) (2/3, 1, 3/2)
1.4 (1, 1, 1) (2/5, 1/2, 2/3) (2/3, 1, 3/2) (1, 1, 1)
Table 5 Evaluation of sub-factors of software factors
2.1 2.2 2.3 2.4 2.5 2.6 2.7 2.8
2.1 (1, 1, 1) (2/3, 1,
3/2)
(2/3, 1,
3/2)
(3/2, 2,
5/2)
(3/2, 2,
5/2)
(2/3, 1,
3/2)
(2/3, 1,
3/2)
(2/3, 1,
3/2)
2.2 (2/3, 1,
3/2)
(1, 1, 1) (2/5, 1/2,
2/3)
(2/3, 1,
3/2)
(2/3, 1,
3/2)
(1, 1, 1) (1, 1, 1) (2/5, 1/2,
2/3)
2.3 (2/3, 1,
3/2)
(3/2, 2,
5/2)
(1, 1, 1) (5/2, 3,
7/2)
(3/2, 2,
5/2)
(3/2, 2,
5/2)
(3/2, 2,
5/2)
(2/3, 1,
3/2)
2.4 (2/5, 1/2,
2/3)
(2/3, 1,
3/2)
(2/7, 1/3,
2/5)
(1, 1, 1) (1, 1, 1) (2/3, 1,
3/2)
(2/3, 1,
3/2)
(2/7, 1/3,
2/5)
2.5 (2/5, 1/2,
2/3)
(2/3, 1,
3/2)
(2/5, 1/2,
2/3)
(1, 1, 1) (1, 1, 1) (1, 1, 1) (2/3, 1,
3/2)
(2/7, 1/3,
2/5)
2.6 (2/3, 1,
3/2)
(1, 1, 1) (2/5, 1/2,
2/3)
(2/3, 1,
3/2)
(1, 1, 1) (1, 1, 1) (1, 1, 1) (2/5, 1/2,
2/3)
2.7 (2/3, 1,
3/2)
(1, 1, 1) (2/5, 1/2,
2/3)
(2/3, 1,
3/2)
(2/3, 1,
3/2)
(1, 1, 1) (1, 1, 1) (2/5, 1/2,
2/3)
2.8 (2/3, 1,
3/2)
(3/2, 2,
5/2)
(2/3, 1,
3/2)
(5/2, 3,
7/2)
(5/2, 3,
7/2)
(3/2, 2,
5/2)
(3/2, 2,
5/2)
(1, 1, 1)
Table 6 Evaluation of sub-factors of personnel factors
3.1 3.2 3.3 3.4 3.5
3.1 (1, 1, 1) (3/2, 2, 5/2) (2/3, 1, 3/2) (1, 1, 1) (3/2, 2, 5/2)
3.2 (2/5, 1/2, 2/3) (1, 1, 1) (2/7, 1/3, 2/5) (2/3, 1, 3/2) (1, 1, 1)
3.3 (2/3, 1, 3/2) (5/2, 3, 7/2) (1, 1, 1) (2/3, 1, 3/2) (3/2, 2, 5/2)
3.4 (1, 1, 1) (2/3, 1, 3/2) (2/3, 1, 3/2) (1, 1, 1) (2/3, 1, 3/2)
3.5 (2/5, 1/2, 2/3) (1, 1, 1) (2/5, 1/2, 2/3) (2/3, 1, 3/2) (1, 1, 1)
21
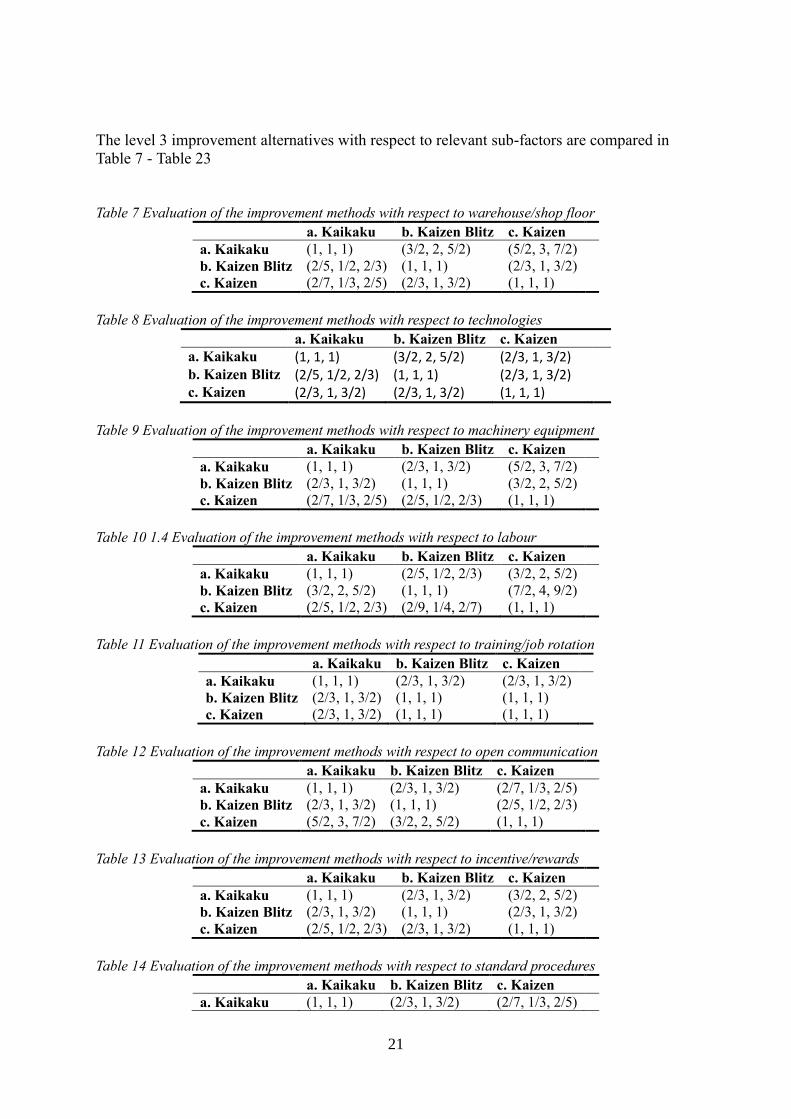
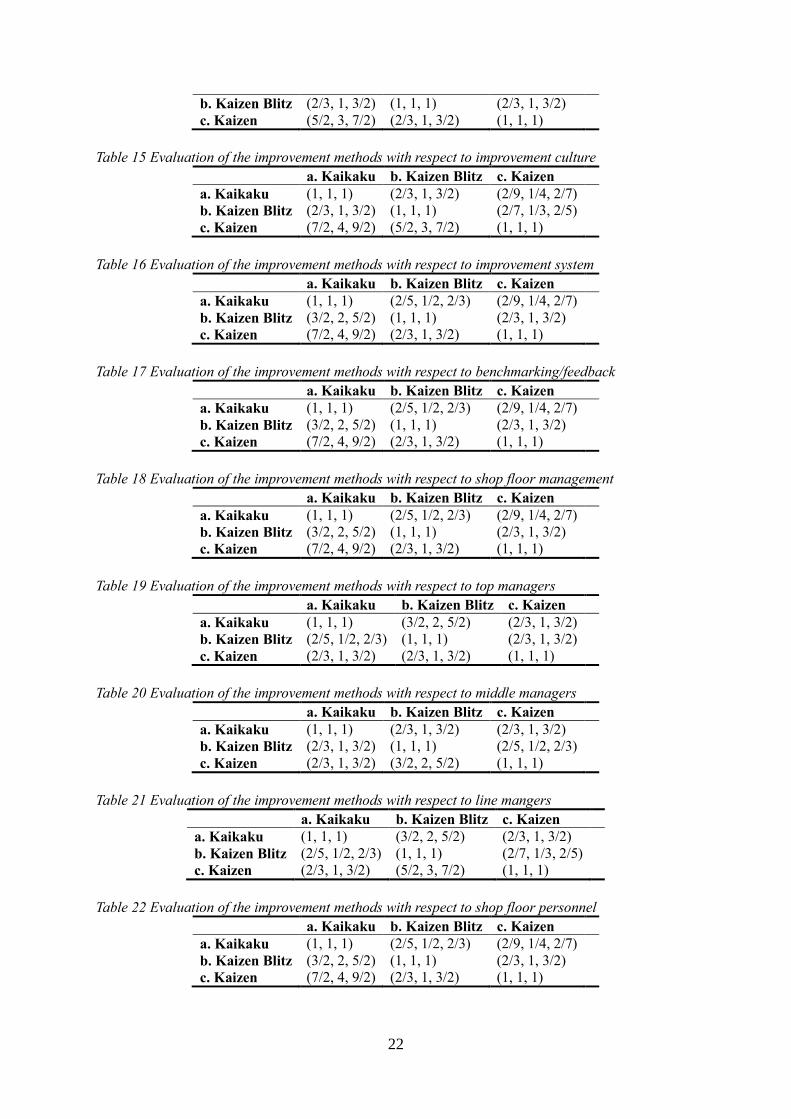
The level 3 improvement alternatives with respect to relevant sub-factors are compared in
Table 7 - Table 23
Table 7 Evaluation of the improvement methods with respect to warehouse/shop floor
a. Kaikaku b. Kaizen Blitz c. Kaizen
a. Kaikaku (1, 1, 1) (3/2, 2, 5/2) (5/2, 3, 7/2)
b. Kaizen Blitz (2/5, 1/2, 2/3) (1, 1, 1) (2/3, 1, 3/2)
c. Kaizen (2/7, 1/3, 2/5) (2/3, 1, 3/2) (1, 1, 1)
Table 8 Evaluation of the improvement methods with respect to technologies
a. Kaikaku b. Kaizen Blitz c. Kaizen a. Kaikaku (1, 1, 1) (3/2, 2, 5/2) (2/3, 1, 3/2) b. Kaizen Blitz (2/5, 1/2, 2/3) (1, 1, 1) (2/3, 1, 3/2) c. Kaizen (2/3, 1, 3/2) (2/3, 1, 3/2) (1, 1, 1)
Table 9 Evaluation of the improvement methods with respect to machinery equipment
a. Kaikaku b. Kaizen Blitz c. Kaizen
a. Kaikaku (1, 1, 1) (2/3, 1, 3/2) (5/2, 3, 7/2)
b. Kaizen Blitz (2/3, 1, 3/2) (1, 1, 1) (3/2, 2, 5/2)
c. Kaizen (2/7, 1/3, 2/5) (2/5, 1/2, 2/3) (1, 1, 1)
Table 10 1.4 Evaluation of the improvement methods with respect to labour
a. Kaikaku b. Kaizen Blitz c. Kaizen
a. Kaikaku (1, 1, 1) (2/5, 1/2, 2/3) (3/2, 2, 5/2)
b. Kaizen Blitz (3/2, 2, 5/2) (1, 1, 1) (7/2, 4, 9/2)
c. Kaizen (2/5, 1/2, 2/3) (2/9, 1/4, 2/7) (1, 1, 1)
Table 11 Evaluation of the improvement methods with respect to training/job rotation
a. Kaikaku b. Kaizen Blitz c. Kaizen
a. Kaikaku (1, 1, 1) (2/3, 1, 3/2) (2/3, 1, 3/2)
b. Kaizen Blitz (2/3, 1, 3/2) (1, 1, 1) (1, 1, 1)
c. Kaizen (2/3, 1, 3/2) (1, 1, 1) (1, 1, 1)
Table 12 Evaluation of the improvement methods with respect to open communication
a. Kaikaku b. Kaizen Blitz c. Kaizen
a. Kaikaku (1, 1, 1) (2/3, 1, 3/2) (2/7, 1/3, 2/5)
b. Kaizen Blitz (2/3, 1, 3/2) (1, 1, 1) (2/5, 1/2, 2/3)
c. Kaizen (5/2, 3, 7/2) (3/2, 2, 5/2) (1, 1, 1)
Table 13 Evaluation of the improvement methods with respect to incentive/rewards
a. Kaikaku b. Kaizen Blitz c. Kaizen
a. Kaikaku (1, 1, 1) (2/3, 1, 3/2) (3/2, 2, 5/2)
b. Kaizen Blitz (2/3, 1, 3/2) (1, 1, 1) (2/3, 1, 3/2)
c. Kaizen (2/5, 1/2, 2/3) (2/3, 1, 3/2) (1, 1, 1)
Table 14 Evaluation of the improvement methods with respect to standard procedures
a. Kaikaku b. Kaizen Blitz c. Kaizen
a. Kaikaku (1, 1, 1) (2/3, 1, 3/2) (2/7, 1/3, 2/5)
22
b. Kaizen Blitz (2/3, 1, 3/2) (1, 1, 1) (2/3, 1, 3/2)
c. Kaizen (5/2, 3, 7/2) (2/3, 1, 3/2) (1, 1, 1)
Table 15 Evaluation of the improvement methods with respect to improvement culture
a. Kaikaku b. Kaizen Blitz c. Kaizen
a. Kaikaku (1, 1, 1) (2/3, 1, 3/2) (2/9, 1/4, 2/7)
b. Kaizen Blitz (2/3, 1, 3/2) (1, 1, 1) (2/7, 1/3, 2/5)
c. Kaizen (7/2, 4, 9/2) (5/2, 3, 7/2) (1, 1, 1)
Table 16 Evaluation of the improvement methods with respect to improvement system
a. Kaikaku b. Kaizen Blitz c. Kaizen
a. Kaikaku (1, 1, 1) (2/5, 1/2, 2/3) (2/9, 1/4, 2/7)
b. Kaizen Blitz (3/2, 2, 5/2) (1, 1, 1) (2/3, 1, 3/2)
c. Kaizen (7/2, 4, 9/2) (2/3, 1, 3/2) (1, 1, 1)
Table 17 Evaluation of the improvement methods with respect to benchmarking/feedback
a. Kaikaku b. Kaizen Blitz c. Kaizen
a. Kaikaku (1, 1, 1) (2/5, 1/2, 2/3) (2/9, 1/4, 2/7)
b. Kaizen Blitz (3/2, 2, 5/2) (1, 1, 1) (2/3, 1, 3/2)
c. Kaizen (7/2, 4, 9/2) (2/3, 1, 3/2) (1, 1, 1)
Table 18 Evaluation of the improvement methods with respect to shop floor management
a. Kaikaku b. Kaizen Blitz c. Kaizen
a. Kaikaku (1, 1, 1) (2/5, 1/2, 2/3) (2/9, 1/4, 2/7)
b. Kaizen Blitz (3/2, 2, 5/2) (1, 1, 1) (2/3, 1, 3/2)
c. Kaizen (7/2, 4, 9/2) (2/3, 1, 3/2) (1, 1, 1)
Table 19 Evaluation of the improvement methods with respect to top managers
a. Kaikaku b. Kaizen Blitz c. Kaizen
a. Kaikaku (1, 1, 1) (3/2, 2, 5/2) (2/3, 1, 3/2)
b. Kaizen Blitz (2/5, 1/2, 2/3) (1, 1, 1) (2/3, 1, 3/2)
c. Kaizen (2/3, 1, 3/2) (2/3, 1, 3/2) (1, 1, 1)
Table 20 Evaluation of the improvement methods with respect to middle managers
a. Kaikaku b. Kaizen Blitz c. Kaizen
a. Kaikaku (1, 1, 1) (2/3, 1, 3/2) (2/3, 1, 3/2)
b. Kaizen Blitz (2/3, 1, 3/2) (1, 1, 1) (2/5, 1/2, 2/3)
c. Kaizen (2/3, 1, 3/2) (3/2, 2, 5/2) (1, 1, 1)
Table 21 Evaluation of the improvement methods with respect to line mangers
a. Kaikaku b. Kaizen Blitz c. Kaizen
a. Kaikaku (1, 1, 1) (3/2, 2, 5/2) (2/3, 1, 3/2)
b. Kaizen Blitz (2/5, 1/2, 2/3) (1, 1, 1) (2/7, 1/3, 2/5)
c. Kaizen (2/3, 1, 3/2) (5/2, 3, 7/2) (1, 1, 1)
Table 22 Evaluation of the improvement methods with respect to shop floor personnel
a. Kaikaku b. Kaizen Blitz c. Kaizen
a. Kaikaku (1, 1, 1) (2/5, 1/2, 2/3) (2/9, 1/4, 2/7)
b. Kaizen Blitz (3/2, 2, 5/2) (1, 1, 1) (2/3, 1, 3/2)
c. Kaizen (7/2, 4, 9/2) (2/3, 1, 3/2) (1, 1, 1)

23
Table 23 Evaluation of the improvement methods with respect to non-production personnel
a. Kaikaku b. Kaizen Blitz c. Kaizen
a. Kaikaku (1, 1, 1) (2/3, 1, 3/2) (2/5, 1/2, 2/3)
b. Kaizen Blitz (2/3, 1, 3/2) (1, 1, 1) (2/3, 1, 3/2)
c. Kaizen (3/2, 2, 5/2) (2/3, 1, 3/2) (1, 1, 1)
The priority weights of success factors and sub-factors are calculated. The following
equations illustrate the calculations of the fuzzy synthetic extent values of the level 1 factors.
𝑆1 = (1.96, 2.33, 2.9) ⊗ (1 13.07⁄ , 1 12.33⁄ , 1 9.03⁄ ) = (0.15, 0.19, 0.32)
𝑆2 = (3.17, 4, 5) ⊗ (1 13.07⁄ , 1 12.33⁄ , 1 9.03⁄ ) = (0.24, 0.32, 0.55)
𝑆3 = (3.9, 6, 5.17) ⊗ (1 13.07⁄ , 1 12.33⁄ , 1 9.03⁄ ) = (0.30, 0.49, 0.57)
The degree of possibility of the level 1 factors are determined in the following
Equations.
𝑉(𝑆1 ≥ 𝑆2) =
(0.24 − 0.32)
(0.19 − 0.32) − (0.32 − 0.24)= 0.38
𝑉(𝑆1 ≥ 𝑆3) =
(0.30 − 0.32)
(0.19 − 0.32) − (0.49 − 0.30)= 0.06
𝑉(𝑆2 ≥ 𝑆1) = 1
𝑉(𝑆2 ≥ 𝑆3) =
(0.30 − 0.55)
(0.32 − 0.55) − (0.49 − 0.30)= 0.60
𝑉(𝑆3 ≥ 𝑆1) = 1
𝑉(𝑆3 ≥ 𝑆2) = 1
The priority weight vector is calculated in the following Equations.
𝑑′(𝐴1) = 𝑉(𝑆1 ≥ 𝑆2, 𝑆3) = 𝑚𝑖𝑛(0.38, 0.06) = 0.06
𝑑′(𝐴2) = 𝑉(𝑆2 ≥ 𝑆1, 𝑆3) = 𝑚𝑖𝑛(1, 0.60) = 0.60
𝑑′(𝐴3) = 𝑉(𝑆3 ≥ 𝑆1, 𝑆2) = 𝑚𝑖𝑛(1, 1) =1
Therefore,
𝑊′ = (0.06, 0.60, 1)𝑇
After normalisation, the weight vector of the level 1 factors (L1) is:
𝑊′ = (0.04, 0.36, 0.60)
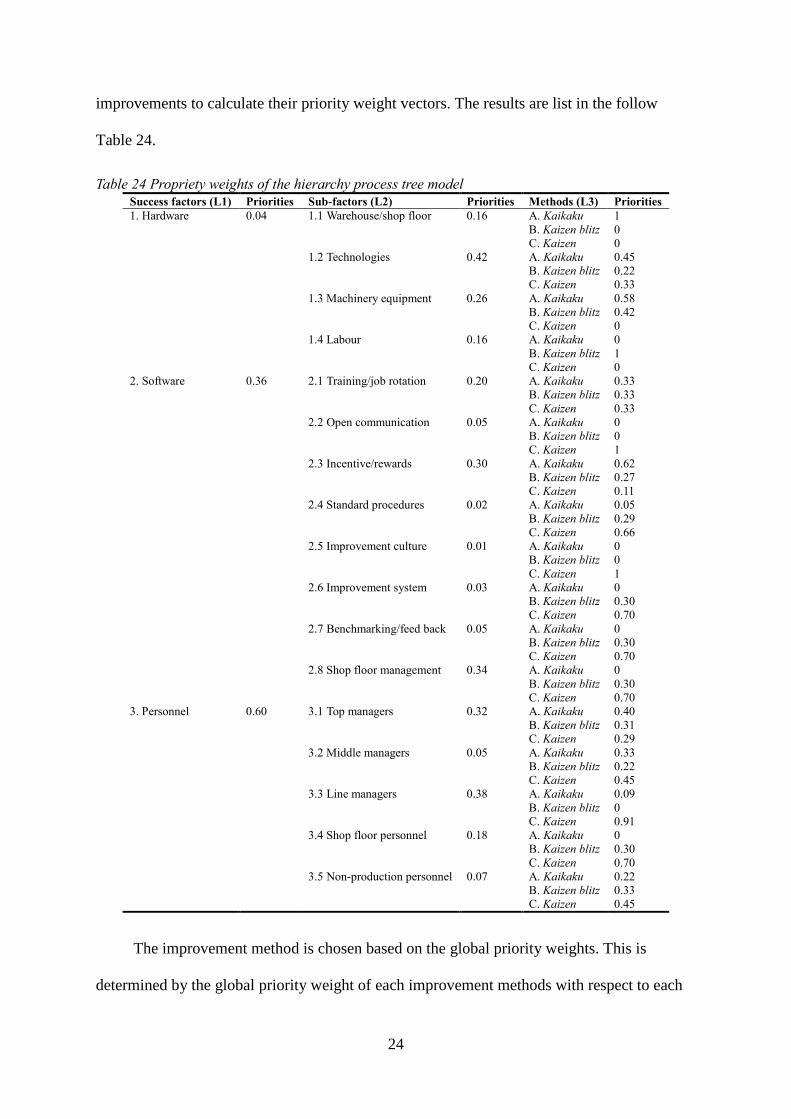
The same systematic approaches are followed for the level 2 sub-factors and level 3
24
improvements to calculate their priority weight vectors. The results are list in the follow
Table 24.
Table 24 Propriety weights of the hierarchy process tree model
Success factors (L1) Priorities Sub-factors (L2) Priorities Methods (L3) Priorities
1. Hardware 0.04 1.1 Warehouse/shop floor 0.16 A. Kaikaku 1
B. Kaizen blitz 0
C. Kaizen 0
1.2 Technologies 0.42 A. Kaikaku 0.45
B. Kaizen blitz 0.22
C. Kaizen 0.33
1.3 Machinery equipment 0.26 A. Kaikaku 0.58
B. Kaizen blitz 0.42
C. Kaizen 0
1.4 Labour 0.16 A. Kaikaku 0
B. Kaizen blitz 1
C. Kaizen 0
2. Software 0.36 2.1 Training/job rotation 0.20 A. Kaikaku 0.33
B. Kaizen blitz 0.33
C. Kaizen 0.33
2.2 Open communication 0.05 A. Kaikaku 0
B. Kaizen blitz 0
C. Kaizen 1
2.3 Incentive/rewards 0.30 A. Kaikaku 0.62
B. Kaizen blitz 0.27
C. Kaizen 0.11
2.4 Standard procedures 0.02 A. Kaikaku 0.05
B. Kaizen blitz 0.29
C. Kaizen 0.66
2.5 Improvement culture 0.01 A. Kaikaku 0
B. Kaizen blitz 0
C. Kaizen 1
2.6 Improvement system 0.03 A. Kaikaku 0
B. Kaizen blitz 0.30
C. Kaizen 0.70
2.7 Benchmarking/feed back 0.05 A. Kaikaku 0
B. Kaizen blitz 0.30
C. Kaizen 0.70
2.8 Shop floor management 0.34 A. Kaikaku 0
B. Kaizen blitz 0.30
C. Kaizen 0.70
3. Personnel 0.60 3.1 Top managers 0.32 A. Kaikaku 0.40
B. Kaizen blitz 0.31
C. Kaizen 0.29
3.2 Middle managers 0.05 A. Kaikaku 0.33
B. Kaizen blitz 0.22
C. Kaizen 0.45
3.3 Line managers 0.38 A. Kaikaku 0.09
B. Kaizen blitz 0
C. Kaizen 0.91
3.4 Shop floor personnel 0.18 A. Kaikaku 0
B. Kaizen blitz 0.30
C. Kaizen 0.70
3.5 Non-production personnel 0.07 A. Kaikaku 0.22
B. Kaizen blitz 0.33
C. Kaizen 0.45
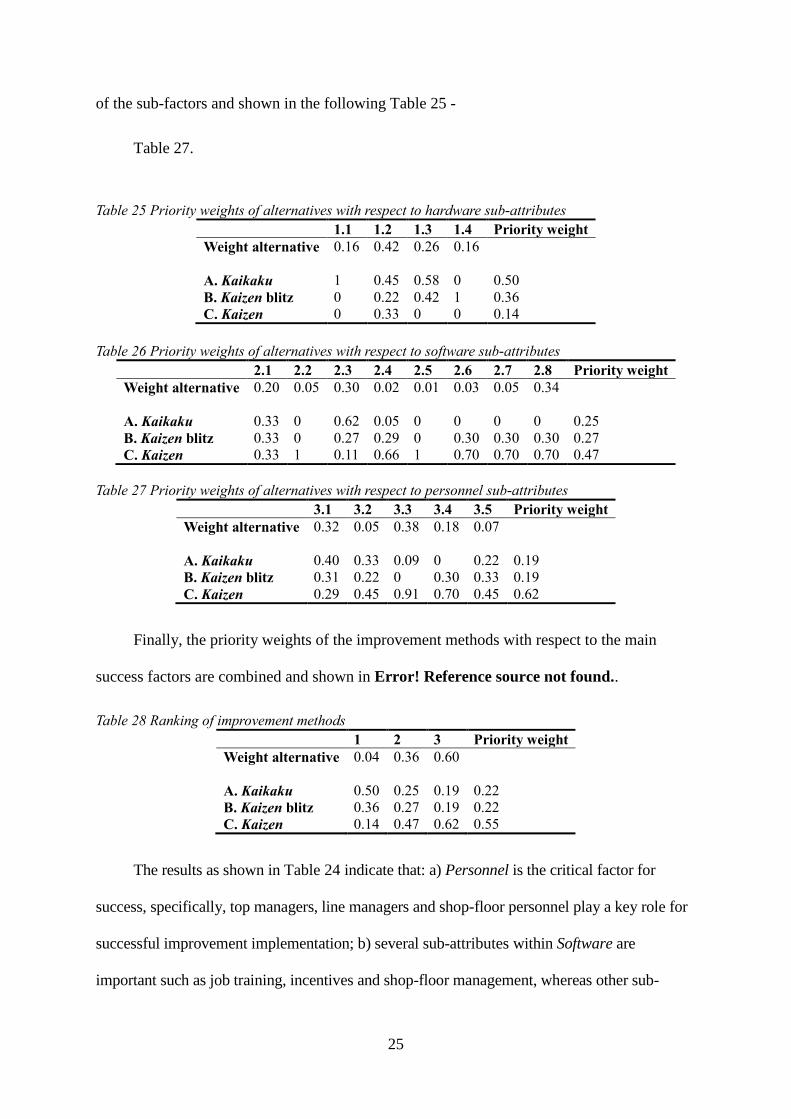
The improvement method is chosen based on the global priority weights. This is
determined by the global priority weight of each improvement methods with respect to each
25
of the sub-factors and shown in the following Table 25 -
Table 27.
Table 25 Priority weights of alternatives with respect to hardware sub-attributes
1.1 1.2 1.3 1.4 Priority weight
Weight alternative
0.16 0.42 0.26 0.16
A. Kaikaku 1 0.45 0.58 0 0.50
B. Kaizen blitz 0 0.22 0.42 1 0.36
C. Kaizen 0 0.33 0 0 0.14
Table 26 Priority weights of alternatives with respect to software sub-attributes
2.1 2.2 2.3 2.4 2.5 2.6 2.7 2.8 Priority weight
Weight alternative
0.20 0.05 0.30 0.02 0.01 0.03 0.05 0.34
A. Kaikaku 0.33 0 0.62 0.05 0 0 0 0 0.25
B. Kaizen blitz 0.33 0 0.27 0.29 0 0.30 0.30 0.30 0.27
C. Kaizen 0.33 1 0.11 0.66 1 0.70 0.70 0.70 0.47
Table 27 Priority weights of alternatives with respect to personnel sub-attributes
3.1 3.2 3.3 3.4 3.5 Priority weight
Weight alternative
0.32 0.05 0.38 0.18 0.07
A. Kaikaku 0.40 0.33 0.09 0 0.22 0.19
B. Kaizen blitz 0.31 0.22 0 0.30 0.33 0.19
C. Kaizen 0.29 0.45 0.91 0.70 0.45 0.62
Finally, the priority weights of the improvement methods with respect to the main
success factors are combined and shown in Error! Reference source not found..
Table 28 Ranking of improvement methods
1 2 3 Priority weight
Weight alternative
0.04 0.36 0.60
A. Kaikaku 0.50 0.25 0.19 0.22
B. Kaizen blitz 0.36 0.27 0.19 0.22
C. Kaizen 0.14 0.47 0.62 0.55
The results as shown in Table 24 indicate that: a) Personnel is the critical factor for
success, specifically, top managers, line managers and shop-floor personnel play a key role for
successful improvement implementation; b) several sub-attributes within Software are
important such as job training, incentives and shop-floor management, whereas other sub-

26
factors such as improvement culture and standard operations are less important; c) Hardware is
the least important factor.
5. Conclusion and contributions
In attempt to prioritise the key enablers for successfully implementing Kaizen activities
in China, this study compared the adoption and implementation of the three types of
improvement methods: Kaizen, Kaikaku and Kaizen blitz from 28 experts working in Sino-
Japanese joint ventures in China. The results show that the top critical enabler is about
Personnel, including all levels of staff from top managers, to line managers and shop-floor
employees, followed by Software which includes job training, incentives and shop-floor
management. The factor of experts/consultants (1.4) as a Hardware sub-factors is not weighted
as important. This may also indicate that the number of the employees is not critical for
improvement, where the skills and abilities of the employees may be more important. Culture
(2.5) for improvement is weighted very low. This might imply that improvement methods are
transferable from one organisation to another, or between countries. Job training (2.1),
incentives (2.3) and shop floor management (2.8) are the three highest score sub-factors under
Software, where the rest of scored low and less important therefore. Organisations should pay
more attentions to these attributes for improvement implementations. Top managers, line
managers and shop floor personnel are the three important Personnel for improvement
implementations. Kaizen is the highest rank improvement method, whilst Kaikaku and Kaizen
blitz have the same ranking scores.
The findings of this study have important managerial implications. Given that the critical
factors for Kaizen in China are the Software (essential rules, routines, procedures, policies and
institutional arrangements) and Personnel (human sources), improvement implementation
should be based on factors such as regular training, incentives for motivations and shop-floor
management. Organisations implementing long-term improvement should rely less on
27
Hardware (physical, measureable hard facts or resources) than the other two for improvement
methods and Kaizen is the appropriate method to support long-term and process-oriented
improvements.
This study identified the key enablers for successful Kaizen implementation based on
interviews with shop floor managers and improvement experts, future study could examine and
compare the statistical links of those factors to either perceptual or actual firm performance
outcomes by applying quantitative methods such as survey or secondary longitudinal data. Our
sample of Sino-Japan ventures is limited to Guangzhou, China and a larger sample size from a
broader area of China would help generalise the results.

28
References
Alstrup, L. (2000). Coaching continuous improvement in small enterprises. Integrated
Manufacturing Systems, 11(3), 165-170.
Aoki, K. (2008). Transferring Japanese kaizen activities to overseas plants in China.
International Journal of Operations & Production Management, 28(6), 518-539.
Ariga, K., Kurosawa, M., Ohtake, F., Sasaki, M., & Yamane, S. (2013). Organization
adjustments, job training and productivity: Evidence from Japanese automobile
makers. Journal of the Japanese and International Economies, 27, 1-34.
Bateman, N. (2005). Sustainability: the elusive element of process improvement.
International Journal of Operations & Production Management, 25(3), 261-276.
Bateman, N., & Brander, C. (2000). The drive for process improvement. Manufacturing
Engineer, 79(6), 241-245.
Bateman, N., & Rich, N. (2003). Companies' perceptions of inhibitors and enablers for
process improvement activities. International Journal of Operations & Production
Management, 23(2), 185-199.
Bessant, J., & Caffyn, S. (1997). High-involvement Innovation Through Continuous
Improvement. International Journal of Technology Management, 14(1), 7-28.
Bessant, J., Caffyn, S., & Gallagher, M. (2001). An evolutionary model of continuous
improvement behaviour. Technovation, 21(2), 67-77.
Bessant, J., Caffyn, S., Gilbert, J., Harding, R., & Webb, S. (1994). Rediscovering continuous
improvement. Technovation, 14(1), 17-29.
Bessant, J., & Francis, D. (1999). Developing strategic continuous improvement capability.
International Journal of Operations & Production Management, 19(11), 1106-1119.
Bhuiyan, N., & Baghel, A. (2005). An overview of continuous improvement: from the past to
the present. Management Decision, 43(5), 761-771.
Bicheno, J. (2001). Kaizen and kaikaku. In D. Taylor & D. Brunt (Eds.), Manufacturing
Operations and Supply Chain Management, the Lean approach (Vol. 1, pp. 175-184).
Mitcham, Surrey: Thomson Learning.
Bodek, N. (2002). Quick and easy kaizen. IIE Solutions, 34(7), 43.
Bodek, N. (2004). Kaikaku: The Power and Magic of Lean: a Study in Knowledge Transfer:
PCS Inc.
Bond, T. C. (1999). The role of performance measurement in continuous improvement.
International Journal of Operations & Production Management, 19(12), 1318-1334.
Brotherton, B., & Shaw, J. (1996). Towards an identification and classification of critical
success factors in UK hotels Plc. International Journal of Hospitality Management,
15(2), 113-135.
Browning, T. R., & Heath, R. D. (2009). Reconceptualizing the effects of lean on production
costs with evidence from the F-22 program. Journal of Operations Management,
27(1), 23-44.
Brunet, A. P., & New, S. (2003). Kaizen in Japan: an empirical study. International Journal of
Operations & Production Management, 23(12), 1426-1446.
Buckley, J. J. (1985). Fuzzy hierarchical analysis. Fuzzy sets and systems, 17(3), 233-247.
Caffyn, S. (1999). Development of a continuous improvement self-assessment tool.
International Journal of Operations & Production Management, 19(11), 1138-1153.
Calantone, R. J., & Zhao, Y. S. (2001). Joint Ventures in China: A Comparative Study of
Japanese, Korean, and U.S. Partners. Journal of International Marketing, 9(1), 1-23.
Chang, D. (1992). Extent analysis and synthetic decision, optimization techniques and
applications, Vol. 1: World Scientific, Singapore.
Chang, D. (1996). Applications of the extent analysis method on fuzzy AHP. European
29
Journal of Operational Research, 95(3), 649-655.
Chartered Quality Institute. (2011). Continual Improvement. Retrieved 21/01/2011, 2011,
from http://www.thecqi.org/Knowledge-Hub/Resources/Factsheets/Continual-
improvement/
Cheng, C.-H. (1997). Evaluating naval tactical missile systems by fuzzy AHP based on the
grade value of membership function. European Journal of Operational Research,
96(2), 343-350.
Chin, K. S., Pun, K. F., Xu, Y., & Chan, J. S. F. (2002). An AHP based study of critical factors
for TQM implementation in Shanghai manufacturing industries. Technovation, 22(11),
707-715.
Choi, T. Y., & Liker, J. K. (1995). Bringing Japanese Continuous Improvement Approaches to
U.S. Manufacturing: The Roles of Process Orientation and Communications. Decision
Sciences, 26(5), 589-620.
Çiçek, M. C., Köksal, G., & Özdemirel, N. E. (2005). A team performance measurement
model for continuous improvement. Total Quality Management & Business
Excellence, 16(3), 331-349.
Crocker, O. L., Chiu, J. S. L., & Charney, C. (1984). Quality Circles: A guide to participation
and productivity (1984 ed.). Toronto, New York, London, Sydney, Auckland: Methuen
Publications.
Demirel, T., Demirel, N. Ç., & Kahraman, C. (2008). Fuzzy analytic hierarchy process and its
application Fuzzy Multi-Criteria Decision Making (pp. 53-83): Springer.
Done, A., Voss, C., & Rytter, N. G. (2011). Best practice interventions: Short-term impact and
long-term outcomes. Journal of Operations Management, 29(5), 500-513.
Doolen, T. L., Van Aken, E. M., Farris, J. A., Worley, J. M., & Huwe, J. (2008). Kaizen events
and organizational performance: a field study. International Journal of Productivity
and Performance Management, 57(8), 637-658.
Doolen, T. L., Worley, J., Van Aken, E. M., & Farris, J. (2003, May 18-20). Development of
an Assessment Approach for Kaizen Events. Paper presented at the Proceedings of the
2003 Industrial Engineering and Research Conference, Portland.
Dorfman, P. W., Howell, J. P., Hibino, S., Lee, J. K., Tate, U., & Bautista, A. (1997).
Leadership in Western and Asian countries: Commonalities and differences in
effective leadership processes across cultures. The Leadership Quarterly, 8(3), 233-
274.
Farris, J. A., Van Aken, E. M., Doolen, T. L., & Worley, J. (2009). Critical success factors for
human resource outcomes in Kaizen events: An empirical study. International Journal
of Production Economics, 117(1), 42-65.
Fryer, K. J., Antony, J., & Douglas, A. (2007). Critical success factors of continuous
improvement in the public sector: A literature review and some key findings. The
TQM Magazine, 19(5), 497-517.
Fryer, K. J., Ogden, S., & Anthony, J. (2013). Bessant's continuous improvement model:
revisiting and revising. International Journal of Public Sector Management, 26(6),
481-494.
García, J. L., Maldonado, A. A., Alvarado, A., & Rivera, D. G. (2014). Human critical
success factors for kaizen and its impacts in industrial performance. The International
Journal of Advanced Manufacturing Technology, 70(9-12), 2187-2198.
García, J. L., Rivera, D. G., & Iniesta, A. A. (2013). Critical success factors for Kaizen
implementation in manufacturing industries in Mexico. The International Journal of
Advanced Manufacturing Technology, 68(1-4), 537-545.
Glover, W. J., Farris, J. A., & Van Aken, E. M. (2014). Kaizen Events: Assessing the Existing
Literature and Convergence of Practices. Engineering Management Journal, 26(1),

30
39-61.
Glover, W. J., Farris, J. A., & Van Aken, E. M. (2014). The relationship between continuous
improvement and rapid improvement sustainability. International Journal of
Production Research, 53(13), 4068-4086.
Glover, W. J., Liu, W.-H., Farris, J. A., & Van Aken, E. M. (2013). Characteristics of
established kaizen event programs: an empirical study. International Journal of
Operations & Production Management, 33(9), 1166-1201.
Govindarajulu, N., & Daily, B. F. (2004). Motivating employees for environmental
improvement. Industrial Management & Data Systems, 104(4), 364-372.
Graban, M., & Swartz, J. E. (2012). Healthcare Kaizen: Engaging Front-Line Staff in
Sustainable Continuous Improvements: Taylor & Francis.
Handyside, E. (1997). Genba Kanri. Hampshire, Brookfield: Gower Publishing Limited.
Hines, P., Found, P., Griffiths, G., & Harrison, R. (2008). Staying Lean, Thriving, not just
serviving. Cadiff: Lean Enterprise Research Centre.
Hines, P., Holweg, M., & Rich, N. (2004). Learning to evolve, a review of contemporary lean
thinking. International Journal of Operations & Production Management, 24(10),
994-1011.
Hirano, H. (1996). 5S for Operators: 5 Pillars of the Visual Workplace. Portland, Oregon:
Productivity Press.
Hong, J. F., Easterby‐Smith, M., & Snell, R. S. (2006). Transferring Organizational
Learning Systems to Japanese Subsidiaries in China. Journal of Management Studies,
43(5), 1027-1058.
Hong, J. F., Snell, R. S., & Easterby-Smith, M. (2006). Cross-cultural influences on
organizational learning in MNCS: The case of Japanese companies in China. Journal
of International Management, 12(4), 408-429.
Huang, C. C., & Liu, S. H. (2005). A novel approach to lean control for Taiwan-funded
enterprises in mainland China. International Journal of Production Research, 43(12),
2553-2575.
Hull, F., Azumi, K., & Wharton, R. (1988). Suggestion Rates and Sociotechnical Systems in
Japanese versus American Factories : Beyond Quality Circles. IEEE Transactions on
Engineering Management, 35(1), 11-24.
Imai, M. (1986). Kaizen, The Key to Japan's Competitive Success (1st ed.). United States of
America: McGraw-Hill, Inc.
Kahraman, C., Demirel, N. Ç., Demirel, T., & Ateş, N. Y. (2008). A SWOT-AHP application
using fuzzy concept: e-government in Turkey Fuzzy Multi-Criteria Decision Making
(pp. 85-117): Springer.
Kaye, M., & Anderson, R. (1999). Continuous improvement: the ten essential criteria.
International Journal of Quality and Reliability Management, 16(5), 485-509.
Kerrin, M. (1999). Continuous improvement capability: assessment within one case study
organisation. International Journal of Operations & Production Management, 19(11),
1154-1167.
Kerrin, M., & Oliver, N. (2002). Collective and individual improvement activities: the role of
reward systems. Personnel Review, 31(3), 320-337.
Kumar, U., Kumar, V., de Grosbois, D., & Choisne, F. (2009). Continuous improvement of
performance measurement by TQM adopters. Total Quality Management & Business
Excellence, 20(6), 603-616.
Laraia, A. C., Moody, P. E., & Hall, R. W. (1999). The Kaizen Blitz: Accelerating
Breakthroughs in Productivity and Performance: John Wiley and Sons.
Lee, C. (1996). Origin of the Adoption of the Toyota Production System in China. Japanese
Business History Review 31(2), 31-64.

31
Letmathe, P., Schweitzer, M., & Zielinski, M. (2012). How to learn new tasks: Shop floor
performance effects of knowledge transfer and performance feedback. Journal of
Operations Management, 30(3), 221-236.
Liker, J. K. (2004). The Toyota Way, 14 Management Principles from the world's greatest
manufacturer. London: Mc-Graw-Hill.
Liker, J. K., & Hoseus, M. (2008). Toyota Culture: The Heart and Soul of the Toyota Way.
London: McGraw-Hill.
Liker, J. K., & Meier, D. (2006). the Toyota Way Fieldbook: a practical guide for
implementing Toyota's 4Ps: McGraw-Hill.
Lillrank, P., & Kano, N. (1989). Continuous improvement: quality control circles in Japanese
industry. Michigan: The University of Michigan.
Ma, J. (2014). The adoption and implementation of Kaizen in Sino-Japanese automotive joint
ventures. (PhD), Newcastle University, Newcastle upon Tyne.
Marin-Garcia, J. A., del Val, M. P., & Martin, T. B. (2008). Longitudinal study of the results
of continuous improvement in an industrial company. Team Performance
Management, 14(1/2), 1352-7592.
Marin-Garcia, J. A., & Poveda, Y. B. (2010). The Implementation of a Continuous
Improvement Project at a Spanish Marketing Company: A Case Study. International
Journal of Management, 27(3), 593-606.
Monden, Y. (1983). Toyota Production System, Practical Approach to Production
Management. Norcross, Georgia: Industrial Engineering and Management Press.
Montabon, F. (2005). Using kaizen events for back office processes: the recruitment of
frontline supervisor co-ops. Total Quality Management & Business Excellence,
16(10), 1139-1147.
Natale, J., Uppal, R., & Wang, S. (2014). Improving Kaizen event success in healthcare
through shorter event duration. International Journal of Collaborative Enterprise,
4(1-2), 3-16.
Nihon HR Kyōkai. (1995). The Improvement Engine: Creativity & Innovation Through
Employee Involvement : The Kaizen Teian System (1st ed.). Tokyo: Productivity Press.
Phan, A. C., Abdallah, A. B., & Matsui, Y. (2011). Quality management practices and
competitive performance: Empirical evidence from Japanese manufacturing
companies. International Journal of Production Economics, 133(2), 518-529.
Radnor, Z. J., Holweg, M., & Waring, J. (2012). Lean in healthcare: The unfilled promise?
Social Science & Medicine, 74(3), 364-371.
Recht, R., & Wilderom, C. (1998). Kaizen and culture: on the transferability of Japanese
suggestion systems. International Business Review, 7(1), 7-22.
Saaty, T. L. (1980). The Analytic Hierarchy Process: Planning, Priority Setting, Resource
Allocation. New York: McGraw-Hill.
Saaty, T. L. (1994). Highlights and critical points in the theory and application of the Analytic
Hierarchy Process. European Journal of Operational Research, 74(3), 426-447.
Saaty, T. L. (2000). Models, methods, concepts & applications of the analytic hierarchy
process. Massachusetts: Kluwer Academic Publishers.
Santos, J., Wysk, R. A., & Torres, J. M. (2014). Improving production with lean thinking:
John Wiley & Sons.
Savolainen, T. I. (1999). Cycles of continuous improvement. International Journal of
Operations & Production Management, 19(11), 1203-1222.
Sayer, N. J., & Williams, B. (2012). Lean For Dummies (2nd edition ed.). Hoboken, NJ: John
Wiley & Sons, Inc.
Shang, G., & Pheng, L. S. (2013). Understanding the application of Kaizen methods in
construction firms in China. Journal of Technology Management in China, 8(1), 18-

32
33.
Shortell, S. M., O'Brien, J. L., Carman, J. M., Foster, R. W., Hughes, E. F., Boerstler, H., &
O'Connor, E. J. (1995). Assessing the impact of continuous quality improvement/total
quality management: concept versus implementation. Health Services Research,
30(2), 377-401.
Singh, J., & Singh, H. (2015). Continuous improvement philosophy–literature review and
directions. Benchmarking: An International Journal, 22(1), 75-119.
Stam, A., Sun, M., & Haines, M. (1996). Artificial neural network representations for
hierarchical preference structures. Computers & Operations Research, 23(12), 1191-
1201.
Suárez-Barraza, M. F., & Smith, T. (2014). The Kaizen approach within process innovation:
findings from a multiple case study in Ibero-American countries. Total Quality
Management & Business Excellence, 25(9-10), 1002-1025.
Taj, S. (2008). Lean manufacturing performance in China: assessment of 65 manufacturing
plants. Journal of Manufacturing Technology Management, 19(2), 217-234.
Takeuchi, H., Osono, E., & Shimizu, N. (2008). The Contradictions That Drive Toyota's
Success. Harvard Business Review, 86(6), 96-104.
Taylor, M., & Taylor, A. (2008). Operations management research in the automotive sector:
Some contemporary issues and future directions. International Journal of Operations
& Production Management, 28(6), 480-489.
Terziovski, M., & Sohal, A. S. (2000). The adoption of continuous improvement and
innovation strategies in Australian manufacturing firms. Technovation, 20(10), 539-
550.
Van Aken, E. M., Farris, J. A., Glover, W. J., & Letens, G. (2010). A framework for
designing, managing, and improving Kaizen event programs. International Journal of
Productivity and Performance Management, 59(7), 641-667.
Van Laarhoven, P., & Pedrycz, W. (1983). A fuzzy extension of Saaty's priority theory. Fuzzy
sets and Systems, 11(1), 199-227.
Vinodh, S., & Chintha, S. K. (2011). Leanness assessment using multi-grade fuzzy approach.
International Journal of Production Research, 49(2), 431-445.
Weck, M., Klocke, F., Schell, H., & Rüenauver, E. (1997). Evaluating alternative production
cycles using the extended fuzzy AHP method. European Journal of Operational
Research, 100(2), 351-366.
Womack, J. P., Jones, D. T., & Roos, D. (1990). The Machine That Changed the World: The
Story of Lean Production New York: Rawson Associates.
Yasuda, Y. (1989). Toyota no soi kufuteian Katsudo (40 years, 20 million ideas, The Toyota
Suggestion System) (F. Czupryna, Trans.). Tokyo: Japan Management Association.
Zadeh, L. A. (1965). Fuzzy sets. Information and control, 8(3), 338-353.
Zhang, L. H., & Goffin, K. (1999). Joint venture manufacturing in China: an exploratory
investigation. International Journal of Operations & Production Management, 19(5-
6), 474-490.