principles of machine learning - github · principles of machine learning lab 6 – unsupervised...
TRANSCRIPT

Principles of Machine Learning Lab 6 – Unsupervised Learning
Overview In this lab, you will use Azure Machine Learning to build unsupervised learning models. Up until now in this course, you have been working with supervised machine learning models. Supervised machine learning models are trained using known labels. In contrast, unsupervised learning models do not require labels. However, the lack of labels makes evaluation of unsupervised learning models more challenging and less objective. First, you will create a K-Means clustering model that clusters adults based on census information. Then you will create another unsupervised learning model, a recommender for a movie service.
What You’ll Need To complete this lab, you will need the following:
An Azure ML account
A web browser and Internet connection
The files for this lab
Note: To set up the required environment for the lab, follow the instructions in the Setup Guide for this
course. Then download and extract the lab files for this lab.
Creating a Clustering Model In this exercise you will perform k-means cluster analysis on the Adult Census Income Binary
Classification Dataset. You will determine how many natural clusters these data contain and evaluate
which features define this structure.
Prepare the Data The source data for the classification model you will create is provided as a sample dataset in Azure ML.
before you can use it to train a classification model you must prepare the data using some of the
techniques you have learned previously in this course.
1. Open a browser and browse to https://studio.azureml.net. Then sign in using the Microsoft
account associated with your Azure ML account.
2. Create a new blank experiment and name it Adult Income Clustering. 3. In the Adult Income Clustering experiment, drag the Adult Census Income Binary Classification
sample dataset to the canvas.
4. Visualize the output of the dataset, and review the data it contains. Note that the dataset contains the following variables:
age: A numeric feature representing the age of the census respondent.
workclass: A string feature representing the type of employment of the census respondent.
fnlwgt: A numeric feature representing the weighting of this record from the census sample when applied to the total population.
education: A string feature representing the highest level of education attained by the census respondent.
education-num: A numeric feature representing the highest level of education attained by the census respondent.
marital-status: A string feature indicating the marital status of the census respondent.
occupation: A string feature representing the occupation of the census respondent.
relationship: A categorical feature indicating the family relationship role of the census respondent.
race: A string feature indicating the ethnicity of the census respondent.
sex: A categorical feature indicating the gender of the census respondent.
capital-gain: A numeric feature indicating the capital gains realized by the census respondent.
capital-loss: A numeric feature indicating the capital losses incurred by the census respondent.
hours-per-week: A numeric feature indicating the number of hours worked per week by the census respondent.
native-country: A string feature indicating the nationality of the census respondent.
income: A label indicating whether the census respondent earns $50,000 or less, or more than $50,000.
5. Add a Select Columns in Dataset module to the experiment, and connect the output of the dataset to its input.
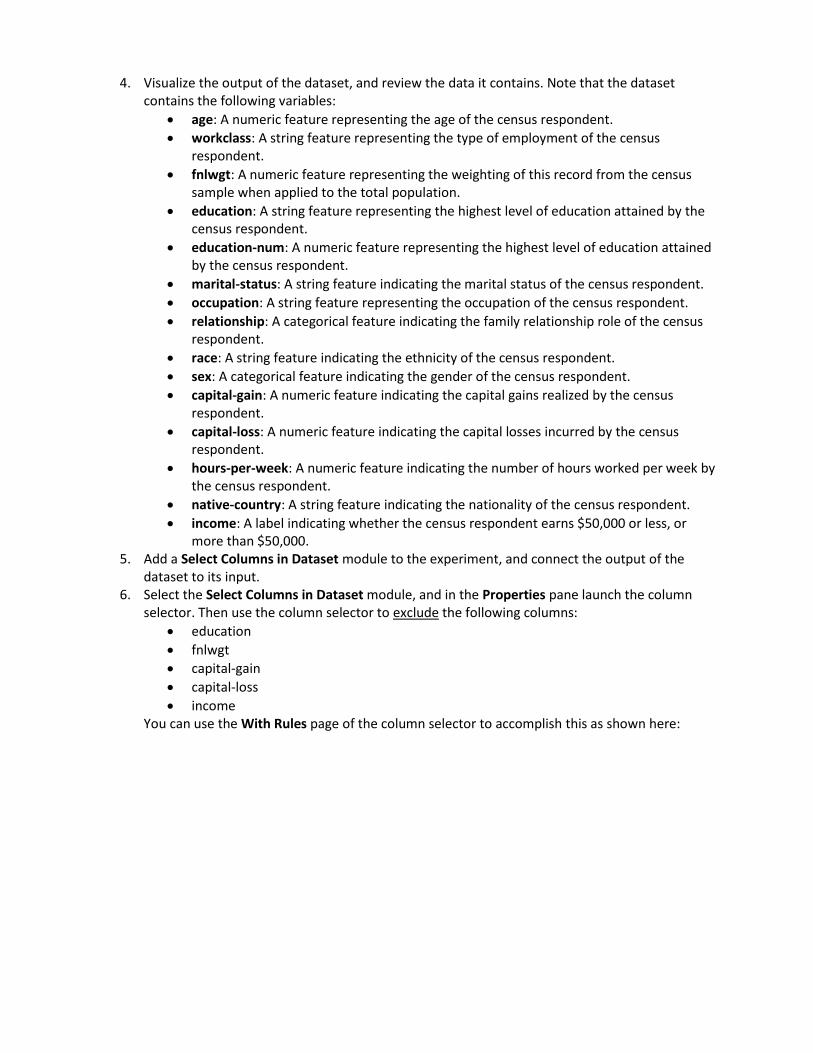
6. Select the Select Columns in Dataset module, and in the Properties pane launch the column selector. Then use the column selector to exclude the following columns:
education
fnlwgt
capital-gain
capital-loss
income You can use the With Rules page of the column selector to accomplish this as shown here:
7. Add a Normalize Data module to the experiment and connect the output of the Select Columns in Dataset module to its input.
8. Set the properties of the Normalize Data module as follows:
Transformation method: MinMax
Use 0 for constant columns: Unselected
Columns to transform: All numeric columns 9. Add an Edit Metadata module to the experiment, and connect the Transformed dataset (left)
output of the Normalize Data module to its input. 10. Set the properties of the Edit Metadata module as follows:
Column: All string columns
Data type: Unchanged
Categorical: Make categorical
Fields: Unchanged
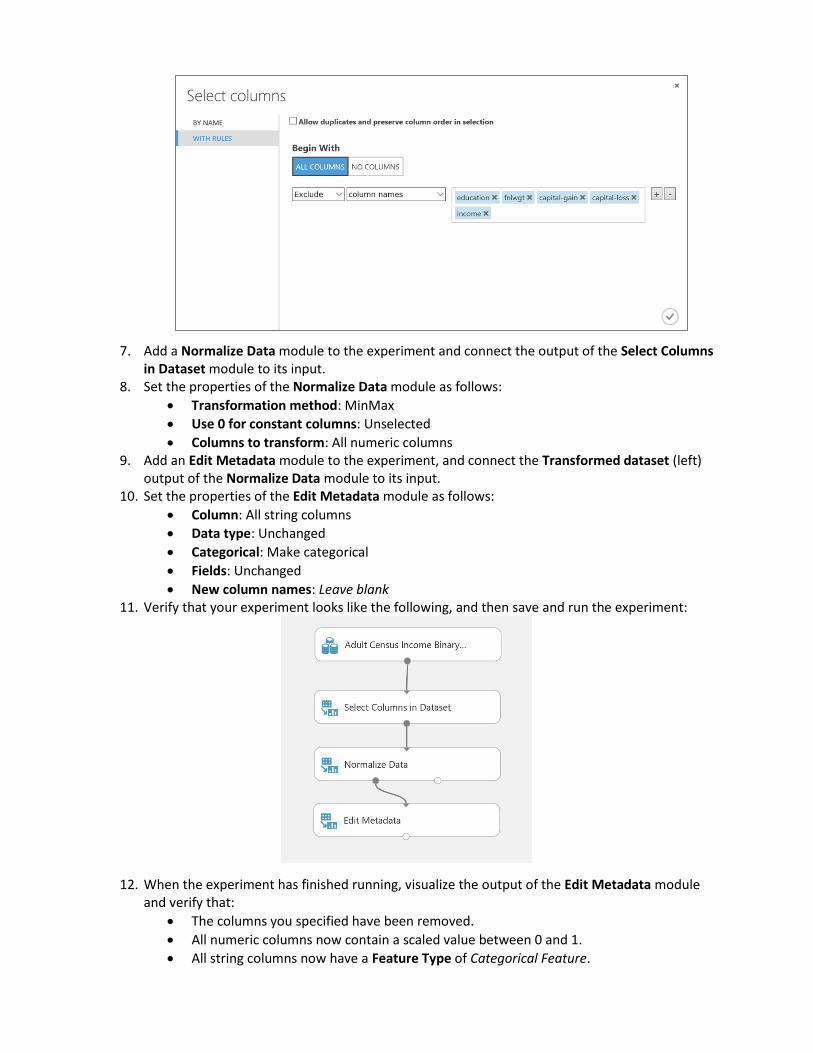
New column names: Leave blank 11. Verify that your experiment looks like the following, and then save and run the experiment:
12. When the experiment has finished running, visualize the output of the Edit Metadata module and verify that:
The columns you specified have been removed.
All numeric columns now contain a scaled value between 0 and 1.
All string columns now have a Feature Type of Categorical Feature.
Determine the Optimal Number of Clusters Now that the data is prepared, you are ready to use K-Means clustering to separate the data out into
clusters. Before doing this, you should spend some time determining the optimal K value – in other
words how many clusters the data can be clearly separated into.
1. Add a K-Means Clustering module to the Adult Income Clustering experiment, and set its
properties as follows:
Create trainer mode: Parameter Range
Range for number of Centroids: 2, 3, 4, 5
Initialization for sweep: K-Means ++
Random number seed: 123
Number of seeds to sweep: 10
Metric: Euclidian
Iterations: 100
Assign Label Model: Ignore label column 2. Add a Sweep Clustering module to the experiment, and connect the output of the K-Means
Clustering module to its Untrained model (left) input and the output of the Edit Metadata
module to its Dataset (right) input.
3. Configure the properties of the Sweep Clustering module as follows:
Metric for measuring cluster result: Average Deviation
Specify parameter sweeping mode: Random sweep
Maximum number of runs on random sweep: 25
Random seed: 123
Column set: Start with no columns and select all numeric columns.
Check for Append or uncheck for Result Only: Checked
4. Add an Evaluate Model module to the experiment, and connect the Results dataset (middle)
output of the Sweep Clustering module to its input.
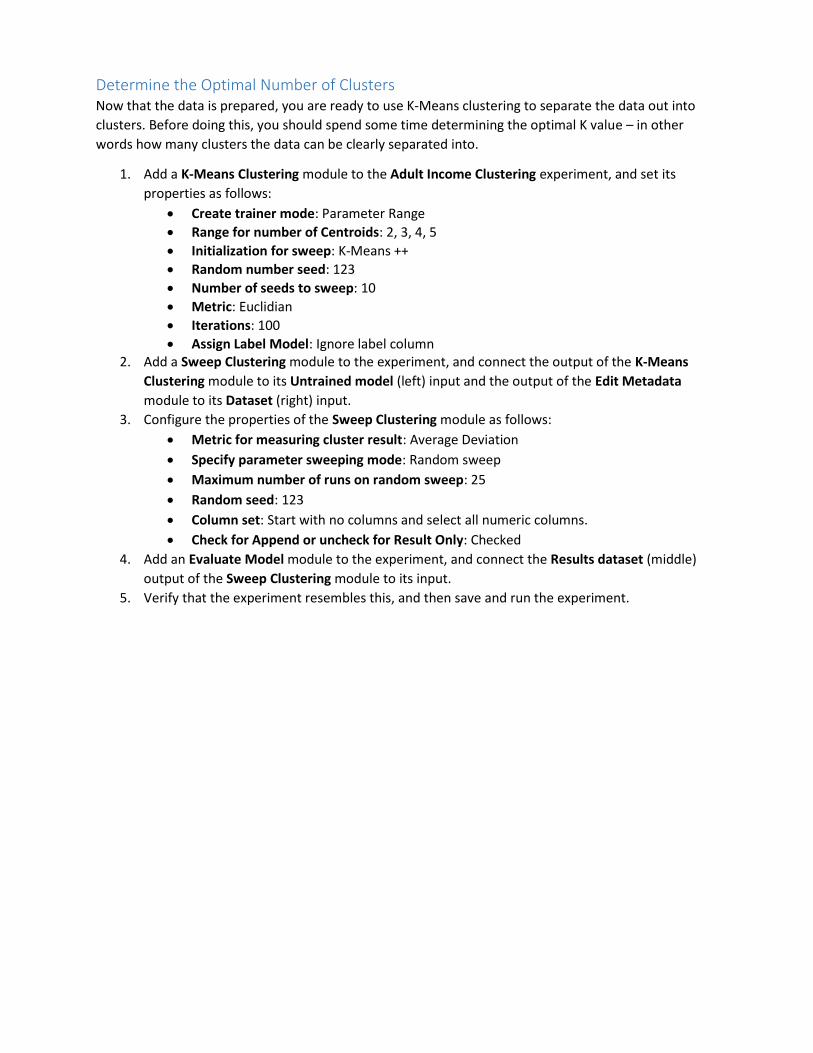
5. Verify that the experiment resembles this, and then save and run the experiment.
6. When the experiment has finished running, visualize the Sweep Results (right-most) output of
the Sweep Clustering module and review the results. The results with the lowest average
deviations are the best clusters, so it looks like the optimal number of centroids for this data is
five.
7. Visualize the Results (middle) output of the Sweep Clustering module, which shows the cluster
assignments for the best performing model. Note that each row has an Assignment column
indicating to which of the five clusters the point represented by this row is assigned, and metrics
that show the distance to the center of each cluster. The row is assigned to the cluster to which
it is closest, but in some cases this may be a marginal difference.
8. Visualize the output of the Evaluate Model module, and review the details for each cluster.
These include the average distance between points in each cluster and its center, and the
average distance between to the center of the other clusters. In some cases, the numbers are
close, indicating that there may be a degree of overlap in the clusters. The evaluation results
also includes the number of points assigned to each cluster.
Create a K-Means Clustering Model Now you are ready to create a clustering model using the K value you have determined.
1. Add a Train Clustering Model module to the experiment, and connect the Best Trained model
(left) output of the Sweep Clustering module to its Untrained model (left) input and the output
of the Edit Metadata module to its Dataset (right) input.
2. Configure the properties of the Train Clustering Model module to select all numeric features
and enable the Check for Append or Uncheck for Result Only option.
3. Verify that the experiment resembles this, and then save and run the experiment.
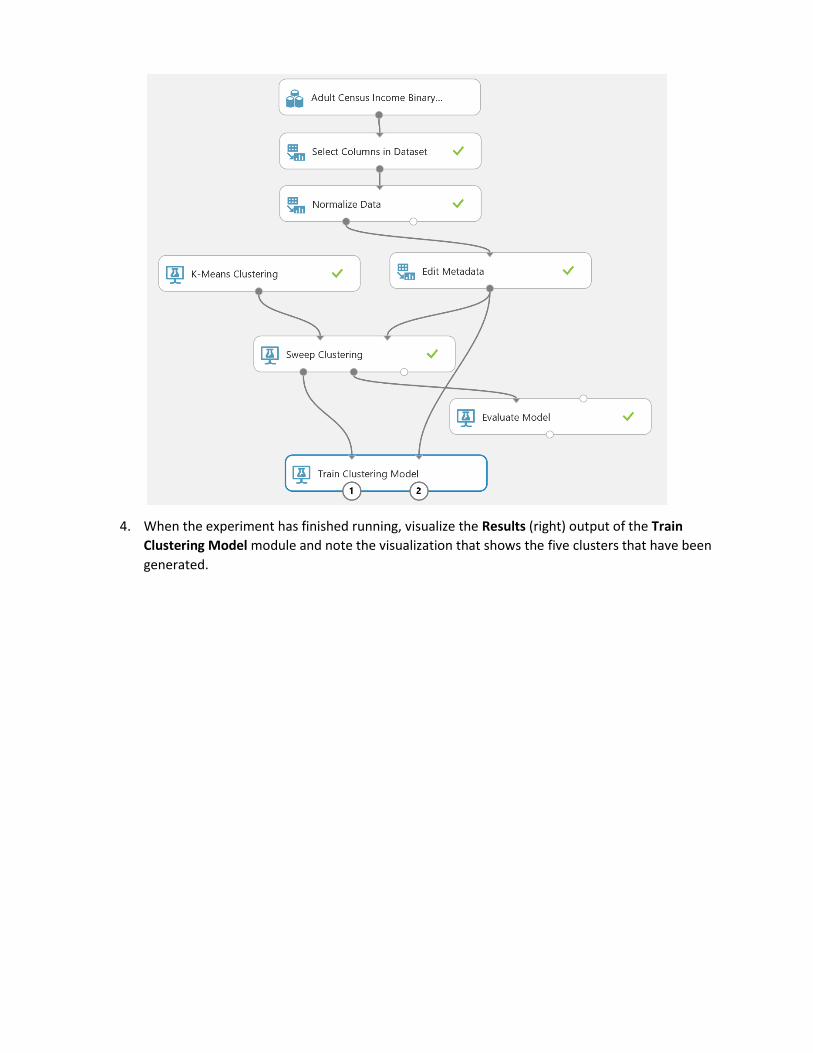
4. When the experiment has finished running, visualize the Results (right) output of the Train
Clustering Model module and note the visualization that shows the five clusters that have been
generated.
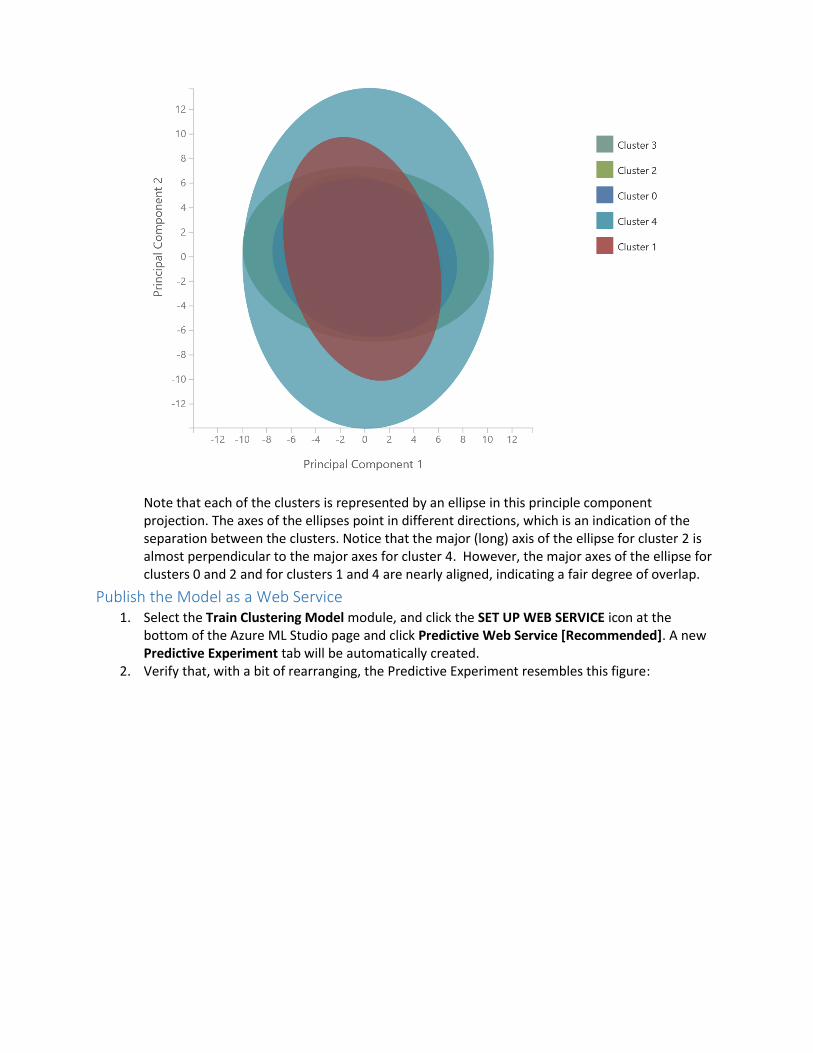
Note that each of the clusters is represented by an ellipse in this principle component projection. The axes of the ellipses point in different directions, which is an indication of the separation between the clusters. Notice that the major (long) axis of the ellipse for cluster 2 is almost perpendicular to the major axes for cluster 4. However, the major axes of the ellipse for clusters 0 and 2 and for clusters 1 and 4 are nearly aligned, indicating a fair degree of overlap.
Publish the Model as a Web Service 1. Select the Train Clustering Model module, and click the SET UP WEB SERVICE icon at the
bottom of the Azure ML Studio page and click Predictive Web Service [Recommended]. A new Predictive Experiment tab will be automatically created.
2. Verify that, with a bit of rearranging, the Predictive Experiment resembles this figure:
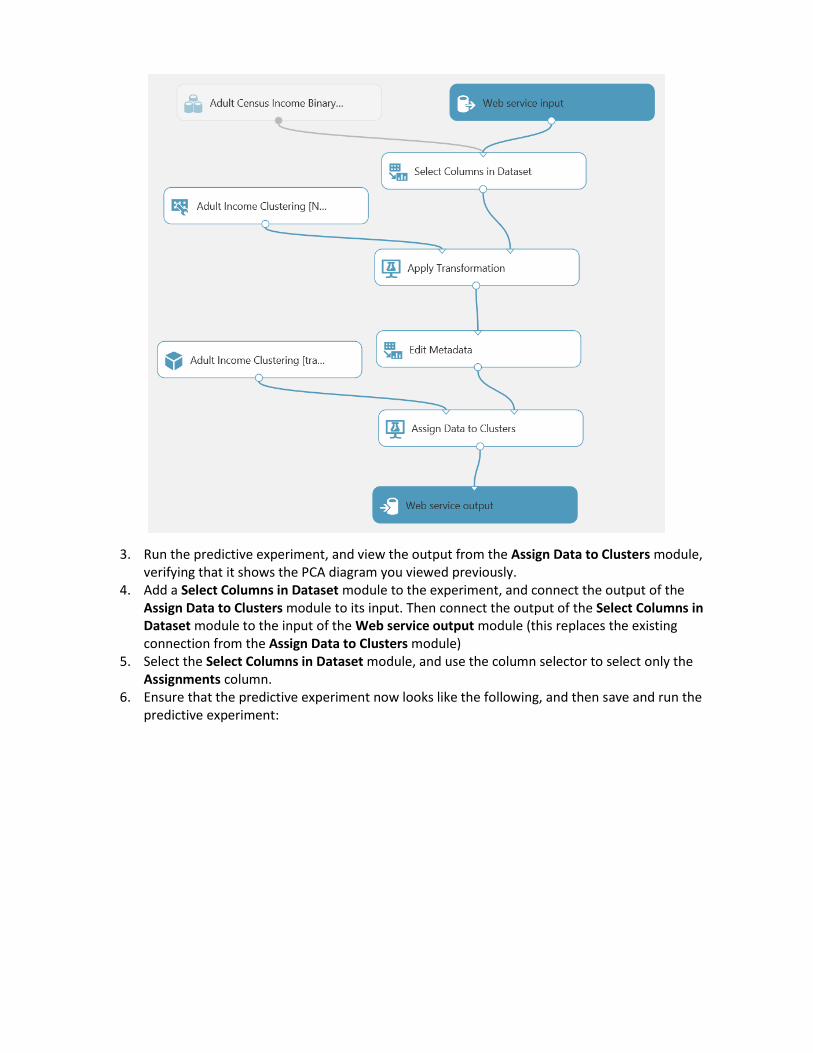
3. Run the predictive experiment, and view the output from the Assign Data to Clusters module, verifying that it shows the PCA diagram you viewed previously.
4. Add a Select Columns in Dataset module to the experiment, and connect the output of the Assign Data to Clusters module to its input. Then connect the output of the Select Columns in Dataset module to the input of the Web service output module (this replaces the existing connection from the Assign Data to Clusters module)
5. Select the Select Columns in Dataset module, and use the column selector to select only the Assignments column.
6. Ensure that the predictive experiment now looks like the following, and then save and run the predictive experiment:
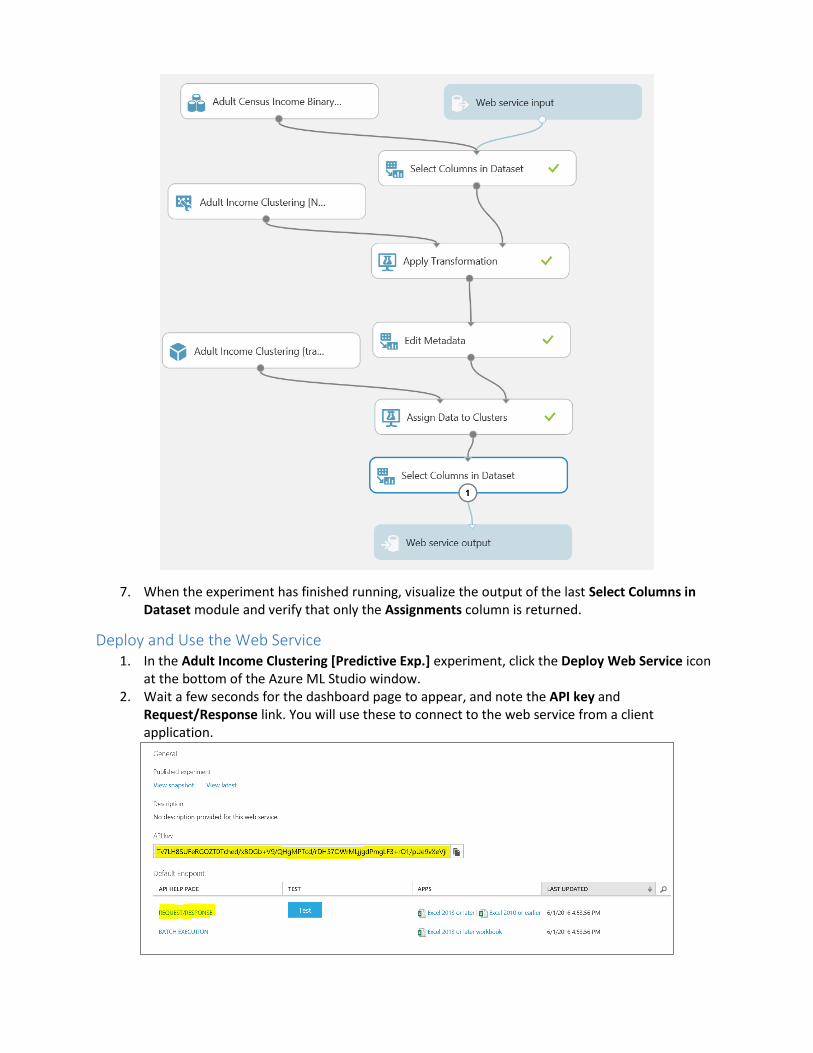
7. When the experiment has finished running, visualize the output of the last Select Columns in Dataset module and verify that only the Assignments column is returned.
Deploy and Use the Web Service 1. In the Adult Income Clustering [Predictive Exp.] experiment, click the Deploy Web Service icon
at the bottom of the Azure ML Studio window. 2. Wait a few seconds for the dashboard page to appear, and note the API key and
Request/Response link. You will use these to connect to the web service from a client application.
3. Leave the dashboard page open in your web browser, and open a new browser tab. 4. In the new browser tab, navigate to https://office.live.com/start/Excel.aspx. If prompted, sign in
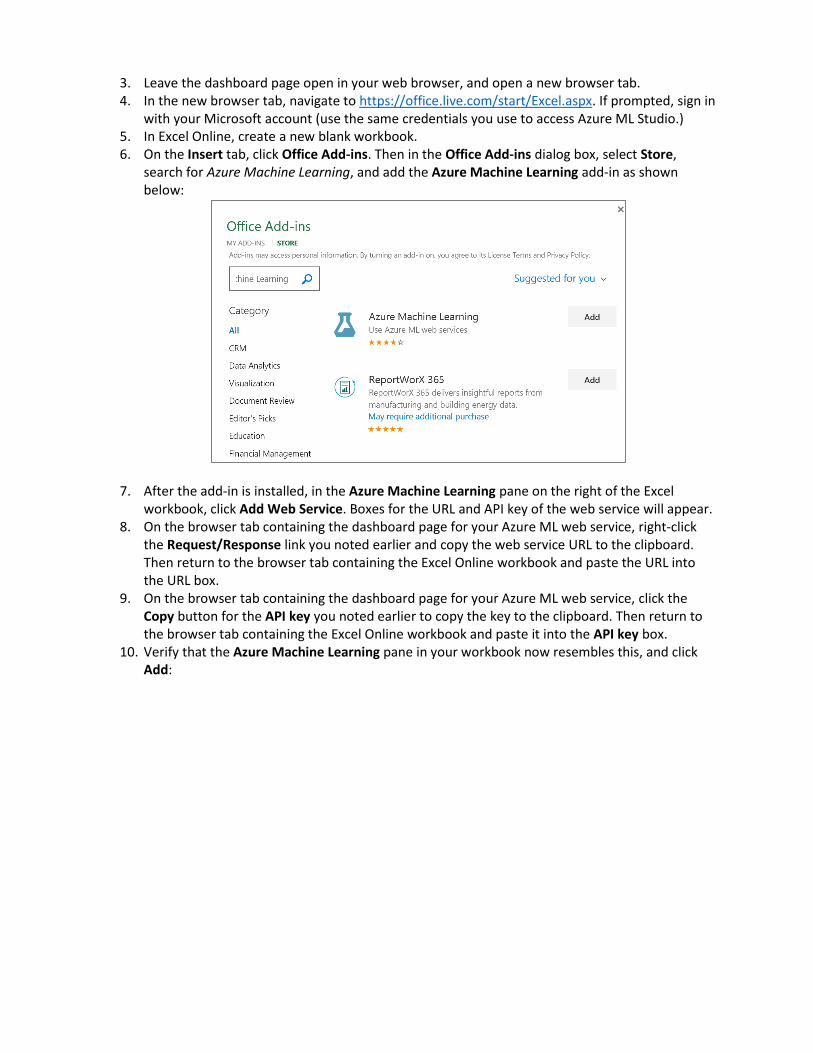
with your Microsoft account (use the same credentials you use to access Azure ML Studio.) 5. In Excel Online, create a new blank workbook. 6. On the Insert tab, click Office Add-ins. Then in the Office Add-ins dialog box, select Store,
search for Azure Machine Learning, and add the Azure Machine Learning add-in as shown below:
7. After the add-in is installed, in the Azure Machine Learning pane on the right of the Excel workbook, click Add Web Service. Boxes for the URL and API key of the web service will appear.
8. On the browser tab containing the dashboard page for your Azure ML web service, right-click the Request/Response link you noted earlier and copy the web service URL to the clipboard. Then return to the browser tab containing the Excel Online workbook and paste the URL into the URL box.
9. On the browser tab containing the dashboard page for your Azure ML web service, click the Copy button for the API key you noted earlier to copy the key to the clipboard. Then return to the browser tab containing the Excel Online workbook and paste it into the API key box.
10. Verify that the Azure Machine Learning pane in your workbook now resembles this, and click Add:
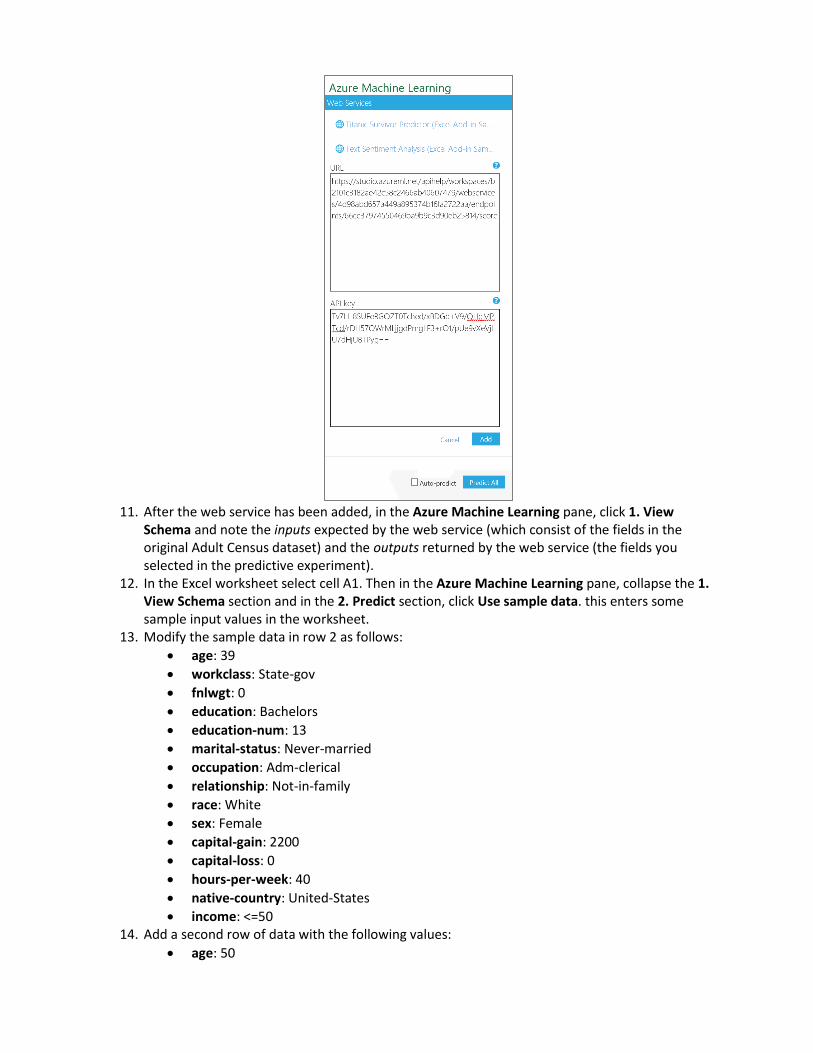
11. After the web service has been added, in the Azure Machine Learning pane, click 1. View
Schema and note the inputs expected by the web service (which consist of the fields in the original Adult Census dataset) and the outputs returned by the web service (the fields you selected in the predictive experiment).
12. In the Excel worksheet select cell A1. Then in the Azure Machine Learning pane, collapse the 1. View Schema section and in the 2. Predict section, click Use sample data. this enters some sample input values in the worksheet.
13. Modify the sample data in row 2 as follows:
age: 39
workclass: State-gov
fnlwgt: 0
education: Bachelors
education-num: 13
marital-status: Never-married
occupation: Adm-clerical
relationship: Not-in-family
race: White
sex: Female
capital-gain: 2200
capital-loss: 0
hours-per-week: 40
native-country: United-States
income: <=50 14. Add a second row of data with the following values:
age: 50
workclass: Self-emp-no
fnlwgt: 0
education: Bachelors
education-num: 13
marital-status: Married-civ-spouse
occupation: Exec-managerial
relationship: Husband
race: Black
sex: Male
capital-gain: 0
capital-loss: 0
hours-per-week: 13
native-country: United-States
income: >=50 15. Add a third row of data with the following values:
age: 38
workclass: Private
fnlwgt: 0
education: HS-grad
education-num: 9
marital-status: Divorced
occupation: Handlers-cleaners
relationship: Not-in-family
race: White
sex: Male
capital-gain: 0
capital-loss: 0
hours-per-week: 40
native-country: United-States
income: <=50 16. Select the cells containing the input data (cells A1 to O4), and in the Azure Machine Learning
pane, click the button to select the input range and confirm that it is ‘Sheet1’!A1:O4. 17. Ensure that the My data has headers box is checked. 18. In the Output box type P1, and ensure the Include headers box is checked. 19. Click the Predict button, and after a few seconds, note the predicted cluster assignments
returned in column P.
Implementing a Recommender Recommenders are an interesting and useful class of machine learning models. Creating good
recommenders is challenging since there is no objective way to measure how good a recommendation is
for a given individual. There is no way to know if the recommendation is the best possible for an
individual. Further, the ratings provided by the users, is based on their personal subjective judgement.
In this exercise you will implement a recommender for a movie streaming service. Your solution will
recommend up to three movies for a user based on movies they, and other users like them, have
previously viewed.

Create Sample Datasets The built-in sample dataset for movie recommendations contains over 227,000 reviews. While this is a
reasonable number for training a recommender, using this full dataset will result in long model training
times when using a free Azure ML account. For expediency, you will therefore extract a 5 % sample of
this data for use in this exercise.
1. In Azure ML Studio, create a new experiment called Movie Sampling.
2. Search for the Movie Ratings dataset and drag it onto the blank canvas.
3. Add a Partition and Sample module to the experiment, and connect the output of the Movie
Ratings dataset to its input. Then set its properties as follows:
Partition or sample mode: Sampling
Rate of sampling: 0.05
Random seed for sampling: 123
Stratified split for sampling: False
4. Search for the IMDB Movie Titles dataset and drag it onto the canvas. This dataset maps
numeric movie IDs to human readable movie titles.
5. Search for the Join module and drag it onto the canvas.
6. Connect the Results dataset output of the Partition and Sample module to the Dataset1 (left)
input of the Join module.
7. Connect the output of the IMDB Movie Titles dataset to the Dataset2 (right) input of the Join
module.
8. Configure the properties of the Join module as follows:
Column Selector for L (left): MovieId
Column Selector for R (right): Movie ID
Match case: Checked
Join type: Inner Join
Keep right key column: Checked
9. Add a Select Columns in Dataset module, and connect the output of the Join Data module to its
input. Then configure it to select only the Movie ID and Movie Name columns.
10. Add a Remove Duplicate Rows module and connect the output of the Select Columns in
Dataset module to its input. Then configure its properties to select the Movie ID and Movie
Name columns and to retain the first duplicate.
11. Verify that your experiment looks like this:
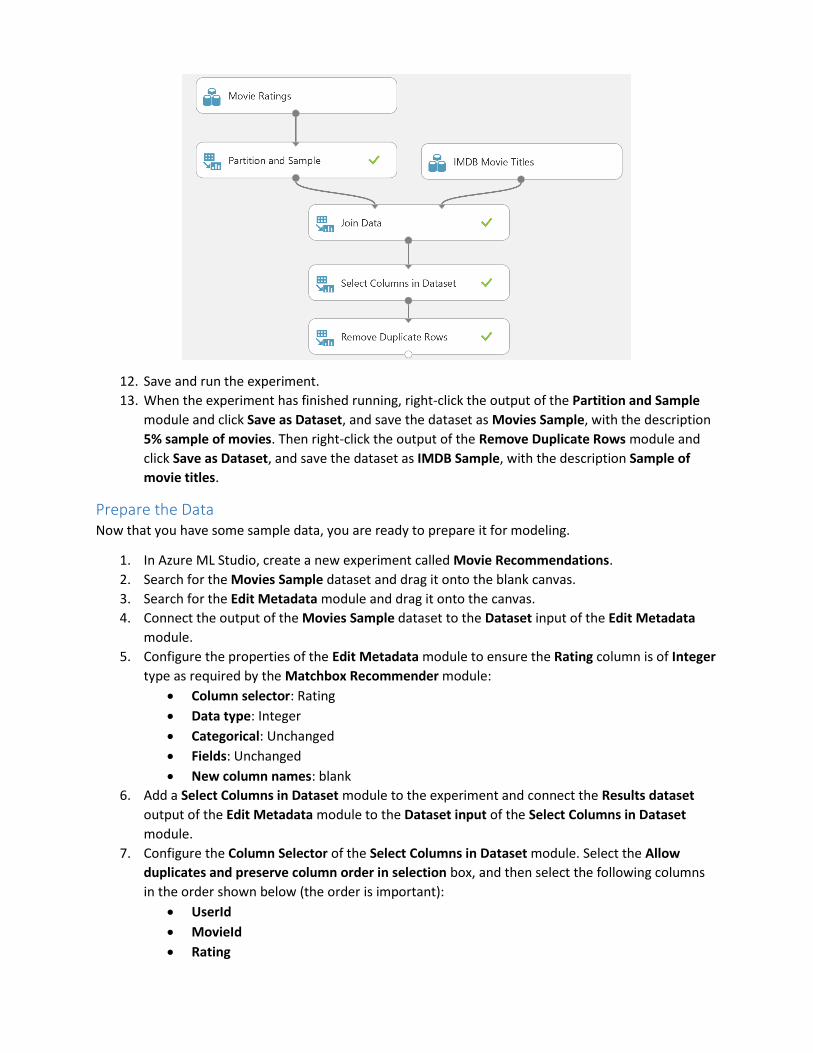
12. Save and run the experiment.
13. When the experiment has finished running, right-click the output of the Partition and Sample
module and click Save as Dataset, and save the dataset as Movies Sample, with the description
5% sample of movies. Then right-click the output of the Remove Duplicate Rows module and
click Save as Dataset, and save the dataset as IMDB Sample, with the description Sample of
movie titles.
Prepare the Data Now that you have some sample data, you are ready to prepare it for modeling.
1. In Azure ML Studio, create a new experiment called Movie Recommendations.
2. Search for the Movies Sample dataset and drag it onto the blank canvas.
3. Search for the Edit Metadata module and drag it onto the canvas.
4. Connect the output of the Movies Sample dataset to the Dataset input of the Edit Metadata
module.
5. Configure the properties of the Edit Metadata module to ensure the Rating column is of Integer
type as required by the Matchbox Recommender module:
Column selector: Rating
Data type: Integer
Categorical: Unchanged
Fields: Unchanged
New column names: blank
6. Add a Select Columns in Dataset module to the experiment and connect the Results dataset
output of the Edit Metadata module to the Dataset input of the Select Columns in Dataset
module.
7. Configure the Column Selector of the Select Columns in Dataset module. Select the Allow
duplicates and preserve column order in selection box, and then select the following columns
in the order shown below (the order is important):
UserId
MovieId
Rating
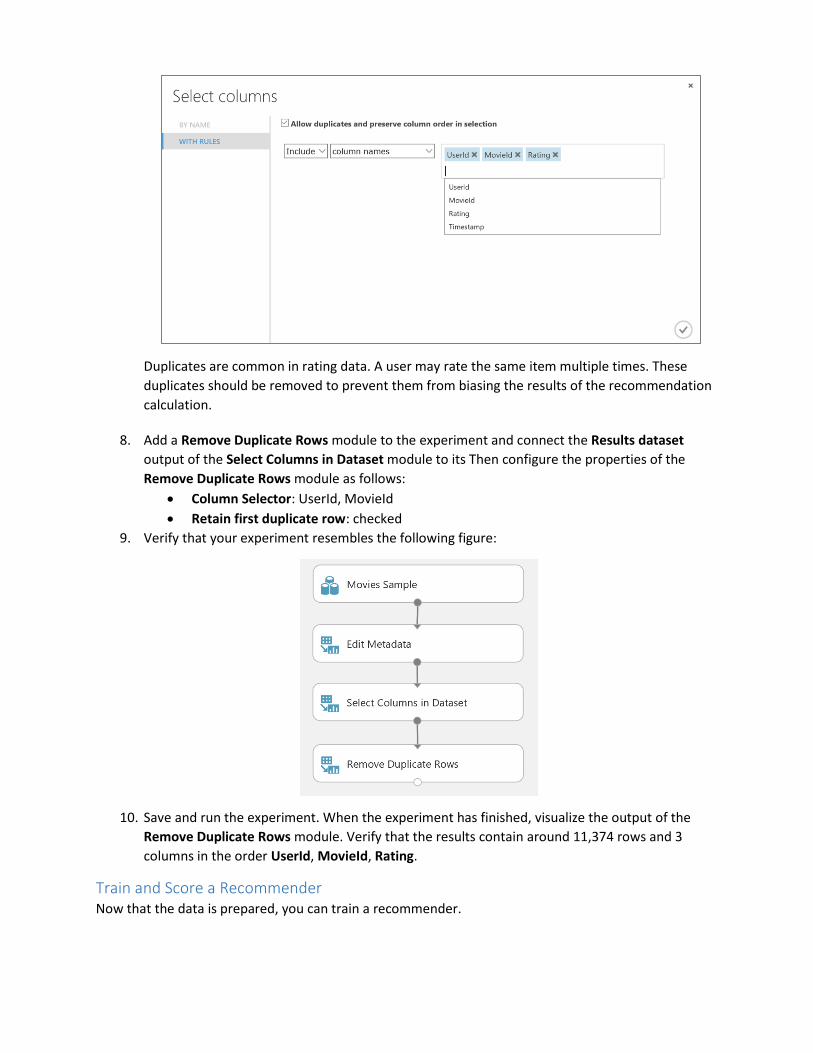
Duplicates are common in rating data. A user may rate the same item multiple times. These
duplicates should be removed to prevent them from biasing the results of the recommendation
calculation.
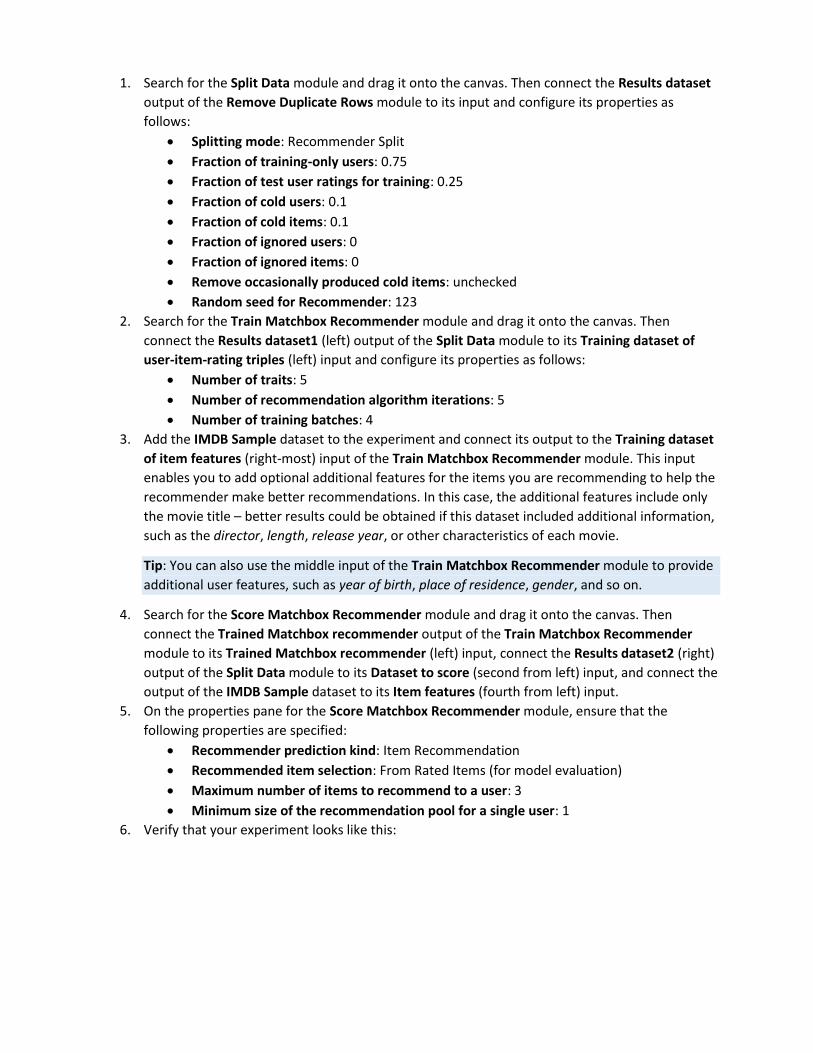
8. Add a Remove Duplicate Rows module to the experiment and connect the Results dataset
output of the Select Columns in Dataset module to its Then configure the properties of the
Remove Duplicate Rows module as follows:
Column Selector: UserId, MovieId
Retain first duplicate row: checked
9. Verify that your experiment resembles the following figure:
10. Save and run the experiment. When the experiment has finished, visualize the output of the
Remove Duplicate Rows module. Verify that the results contain around 11,374 rows and 3
columns in the order UserId, MovieId, Rating.
Train and Score a Recommender Now that the data is prepared, you can train a recommender.
1. Search for the Split Data module and drag it onto the canvas. Then connect the Results dataset
output of the Remove Duplicate Rows module to its input and configure its properties as
follows:
Splitting mode: Recommender Split
Fraction of training-only users: 0.75
Fraction of test user ratings for training: 0.25
Fraction of cold users: 0.1
Fraction of cold items: 0.1
Fraction of ignored users: 0
Fraction of ignored items: 0
Remove occasionally produced cold items: unchecked
Random seed for Recommender: 123
2. Search for the Train Matchbox Recommender module and drag it onto the canvas. Then
connect the Results dataset1 (left) output of the Split Data module to its Training dataset of
user-item-rating triples (left) input and configure its properties as follows:
Number of traits: 5
Number of recommendation algorithm iterations: 5
Number of training batches: 4
3. Add the IMDB Sample dataset to the experiment and connect its output to the Training dataset
of item features (right-most) input of the Train Matchbox Recommender module. This input
enables you to add optional additional features for the items you are recommending to help the
recommender make better recommendations. In this case, the additional features include only
the movie title – better results could be obtained if this dataset included additional information,
such as the director, length, release year, or other characteristics of each movie.
Tip: You can also use the middle input of the Train Matchbox Recommender module to provide
additional user features, such as year of birth, place of residence, gender, and so on.
4. Search for the Score Matchbox Recommender module and drag it onto the canvas. Then
connect the Trained Matchbox recommender output of the Train Matchbox Recommender
module to its Trained Matchbox recommender (left) input, connect the Results dataset2 (right)
output of the Split Data module to its Dataset to score (second from left) input, and connect the
output of the IMDB Sample dataset to its Item features (fourth from left) input.
5. On the properties pane for the Score Matchbox Recommender module, ensure that the
following properties are specified:
Recommender prediction kind: Item Recommendation
Recommended item selection: From Rated Items (for model evaluation)
Maximum number of items to recommend to a user: 3
Minimum size of the recommendation pool for a single user: 1
6. Verify that your experiment looks like this:
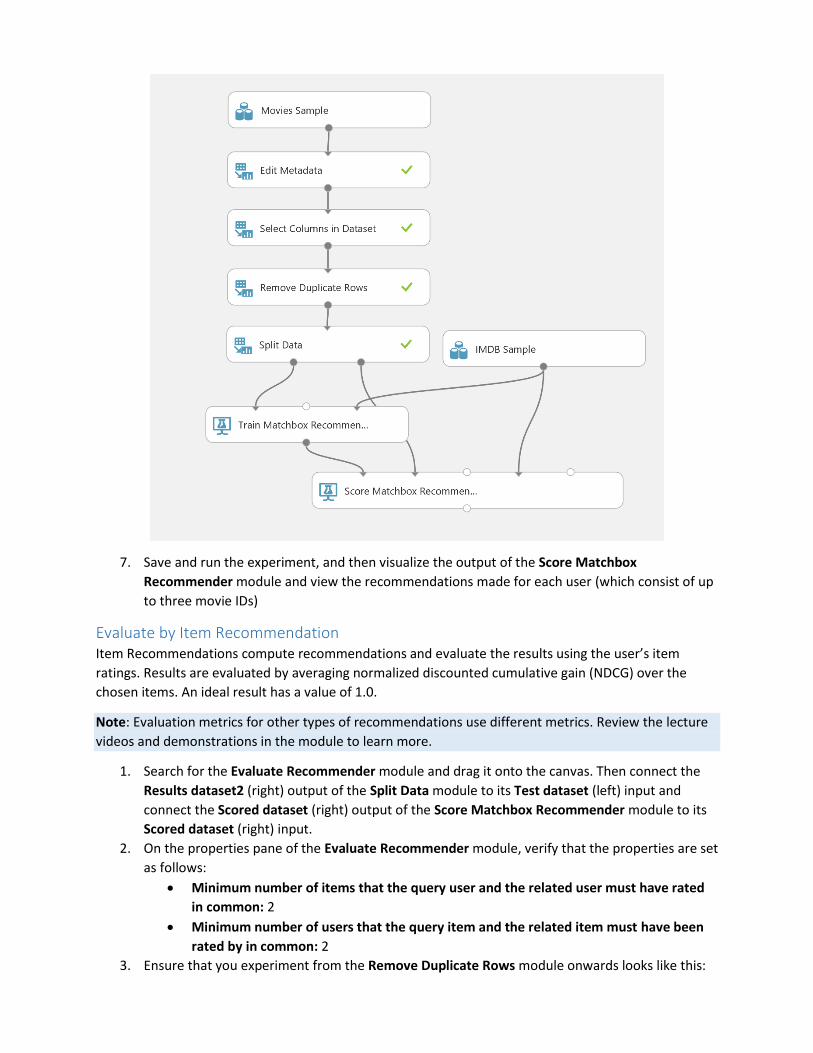
7. Save and run the experiment, and then visualize the output of the Score Matchbox
Recommender module and view the recommendations made for each user (which consist of up
to three movie IDs)
Evaluate by Item Recommendation Item Recommendations compute recommendations and evaluate the results using the user’s item
ratings. Results are evaluated by averaging normalized discounted cumulative gain (NDCG) over the
chosen items. An ideal result has a value of 1.0.
Note: Evaluation metrics for other types of recommendations use different metrics. Review the lecture
videos and demonstrations in the module to learn more.
1. Search for the Evaluate Recommender module and drag it onto the canvas. Then connect the
Results dataset2 (right) output of the Split Data module to its Test dataset (left) input and
connect the Scored dataset (right) output of the Score Matchbox Recommender module to its
Scored dataset (right) input.
2. On the properties pane of the Evaluate Recommender module, verify that the properties are set
as follows:
Minimum number of items that the query user and the related user must have rated
in common: 2
Minimum number of users that the query item and the related item must have been
rated by in common: 2
3. Ensure that you experiment from the Remove Duplicate Rows module onwards looks like this:
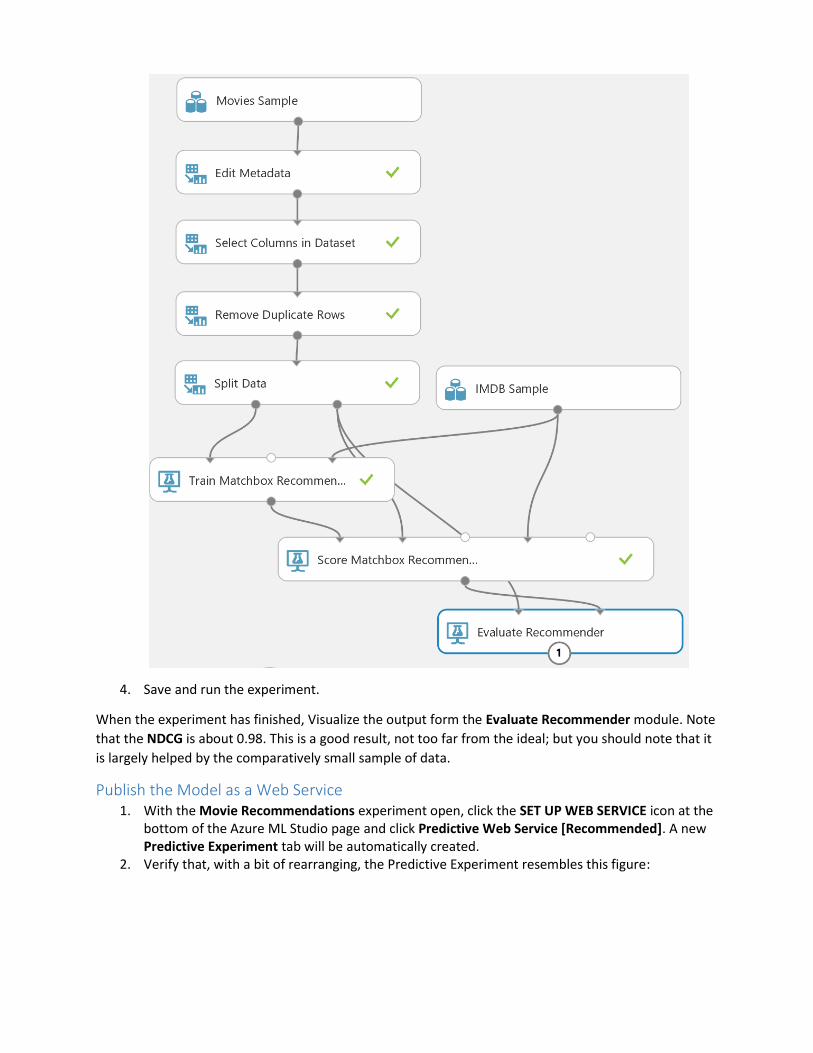
4. Save and run the experiment.
When the experiment has finished, Visualize the output form the Evaluate Recommender module. Note
that the NDCG is about 0.98. This is a good result, not too far from the ideal; but you should note that it
is largely helped by the comparatively small sample of data.
Publish the Model as a Web Service 1. With the Movie Recommendations experiment open, click the SET UP WEB SERVICE icon at the
bottom of the Azure ML Studio page and click Predictive Web Service [Recommended]. A new Predictive Experiment tab will be automatically created.
2. Verify that, with a bit of rearranging, the Predictive Experiment resembles this figure:
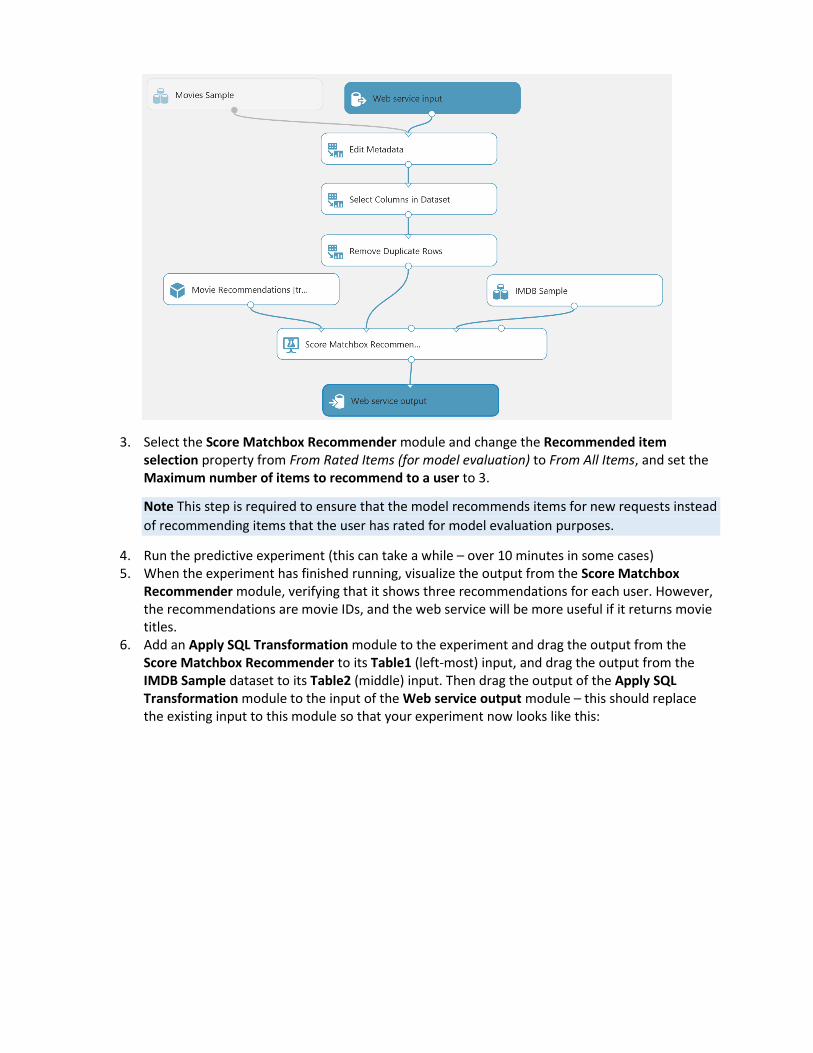
3. Select the Score Matchbox Recommender module and change the Recommended item selection property from From Rated Items (for model evaluation) to From All Items, and set the Maximum number of items to recommend to a user to 3.
Note This step is required to ensure that the model recommends items for new requests instead
of recommending items that the user has rated for model evaluation purposes.
4. Run the predictive experiment (this can take a while – over 10 minutes in some cases) 5. When the experiment has finished running, visualize the output from the Score Matchbox
Recommender module, verifying that it shows three recommendations for each user. However, the recommendations are movie IDs, and the web service will be more useful if it returns movie titles.
6. Add an Apply SQL Transformation module to the experiment and drag the output from the Score Matchbox Recommender to its Table1 (left-most) input, and drag the output from the IMDB Sample dataset to its Table2 (middle) input. Then drag the output of the Apply SQL Transformation module to the input of the Web service output module – this should replace the existing input to this module so that your experiment now looks like this:
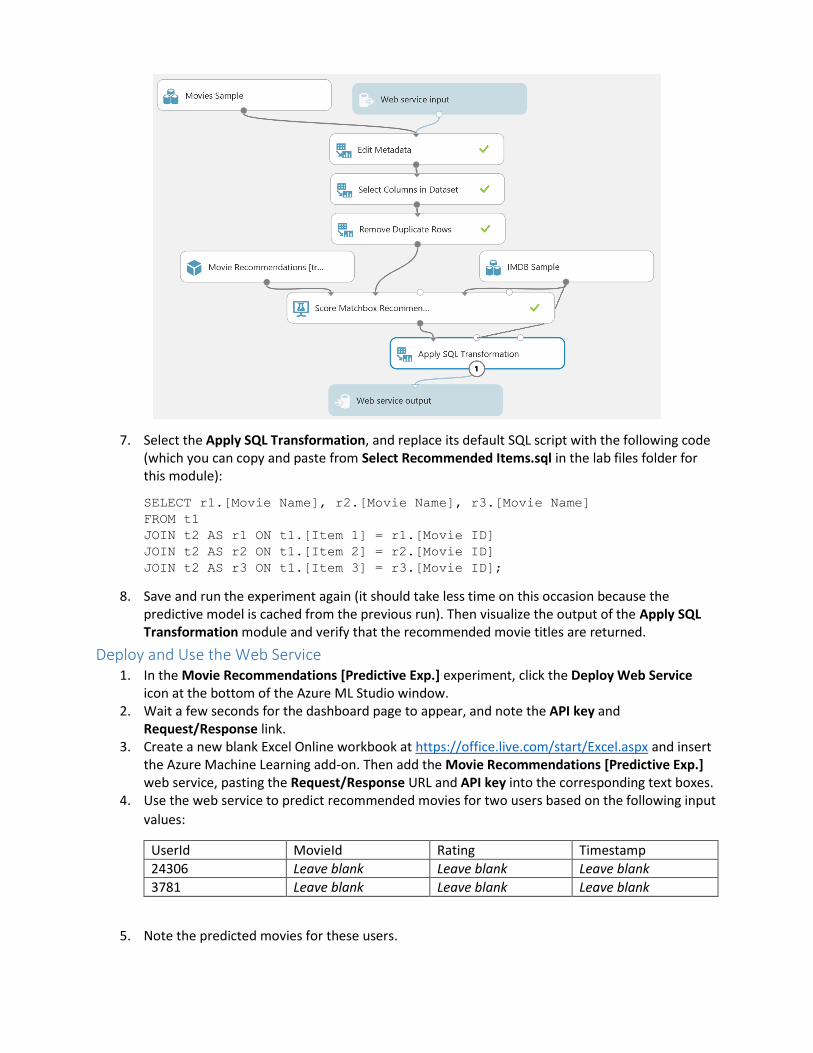
7. Select the Apply SQL Transformation, and replace its default SQL script with the following code (which you can copy and paste from Select Recommended Items.sql in the lab files folder for this module):
SELECT r1.[Movie Name], r2.[Movie Name], r3.[Movie Name]
FROM t1
JOIN t2 AS r1 ON t1.[Item 1] = r1.[Movie ID]
JOIN t2 AS r2 ON t1.[Item 2] = r2.[Movie ID]
JOIN t2 AS r3 ON t1.[Item 3] = r3.[Movie ID];
8. Save and run the experiment again (it should take less time on this occasion because the predictive model is cached from the previous run). Then visualize the output of the Apply SQL Transformation module and verify that the recommended movie titles are returned.
Deploy and Use the Web Service 1. In the Movie Recommendations [Predictive Exp.] experiment, click the Deploy Web Service
icon at the bottom of the Azure ML Studio window. 2. Wait a few seconds for the dashboard page to appear, and note the API key and
Request/Response link. 3. Create a new blank Excel Online workbook at https://office.live.com/start/Excel.aspx and insert
the Azure Machine Learning add-on. Then add the Movie Recommendations [Predictive Exp.] web service, pasting the Request/Response URL and API key into the corresponding text boxes.
4. Use the web service to predict recommended movies for two users based on the following input
values:
UserId MovieId Rating Timestamp
24306 Leave blank Leave blank Leave blank
3781 Leave blank Leave blank Leave blank
5. Note the predicted movies for these users.

Summary In this lab you:
Created a K-Means clustering model, and published it as an Azure Machine Learning web service.
Created a recommender, and published it as an Azure Machine Learning web service.