princelings and paupers? state employment and the ... · pdf filestate employment and the...
TRANSCRIPT
Princelings and paupers? State employment and the distribution of human capital
investments among Vietnamese households1
Ian Coxhead, University of Wisconsin-Madison, USA ([email protected])
Diep Phan, Beloit College, USA ([email protected])
ABSTRACT: Unequal access to education is known to be a key driver of income inequality in
developing countries. Vietnam, a transitional economy, exhibits significant segmentation in the
market for skilled labor based on more remunerative employment in government and state firms.
We ask whether this segmentation is also reflected in human capital investments at household
level. We find that households whose heads hold state jobs keep their children in school longer,
spend more on education, and are more likely to enroll their children in tertiary institutions
relative to households whose heads hold non-state jobs. The estimates are robust to a wide range
of household and individual controls. Over time, disparities in educational investments based on
differential access to jobs that reward skills and/or credentials help widen existing income and
earnings gaps between well-connected “princelings” and the rest of the labor market. Capital
market policies that create segmentation in the market for skills also crowd out investment in
private sector firms, further reducing incentives for human capital deepening.
KEY WORDS: Human capital, state-owned, education, connections, inequality, Vietnam
JEL CODES: J24, J45, O15, P23.
1 We thank Bernard Thiam Hee Ng, seminar participants at the Asian Development Bank and the University of Wisconsin-Madison, and two anonymous referees for helpful comments on earlier drafts. Remaining errors are ours alone.
1. Policy distortions, ‘connections’ and inequality in transition economies
“Like the Communist Party leaders in China, Vietnam’s political mandarins are struggling to reconcile their party’s message of social justice and equality with the realities of an elite awash in wealth and privilege.” (New York Times 2012b)
Inequality in Vietnam is low by the standards of Asian economies, but has risen during that
country’s transition to “market-led socialism.” Part of the rise can be explained by reference to
the weakening of many socialist-era policies that repressed returns to skills, ability and
entrepreneurial activity, in which case greater income disparities might be regarded as necessary
and even beneficial consequences of liberalization. But despite huge strides toward a market
economy, the Vietnamese state retains significant power over some product markets—notably
those in which there is potential for monopolistic behavior—and factor markets, especially those
for capital and land. It follows that part of the observed rise in inequality may be due to less
positive trends, including rent capture by those with access to high-level government positions or
to employment in firms that are in some way protected by policy or market structure. As in
China, another economy undergoing a broadly similar transition, there is widespread concern in
Vietnam over the alleged capture of state-owned or partially privatized firms and influential
public service positions by “princelings” – that is, members of the former nomenklatura and their
close relatives and associates (New York Times 2012a, 2012b). The same concerns extend to
many other developing economies in which privileges extended to well-connected owners of
capital and land have led to diminished earnings and opportunities for owners of labor (The
Economist 2012; Berg and Ostry 2011). Paradoxically, in some economies, the structure of
product and labor markets (and especially that for skilled labor) is such that the rewards to skills
are significantly higher in public sector employment than in the private sector, leading to
queuing and competition for such jobs (Financial Times 2012).
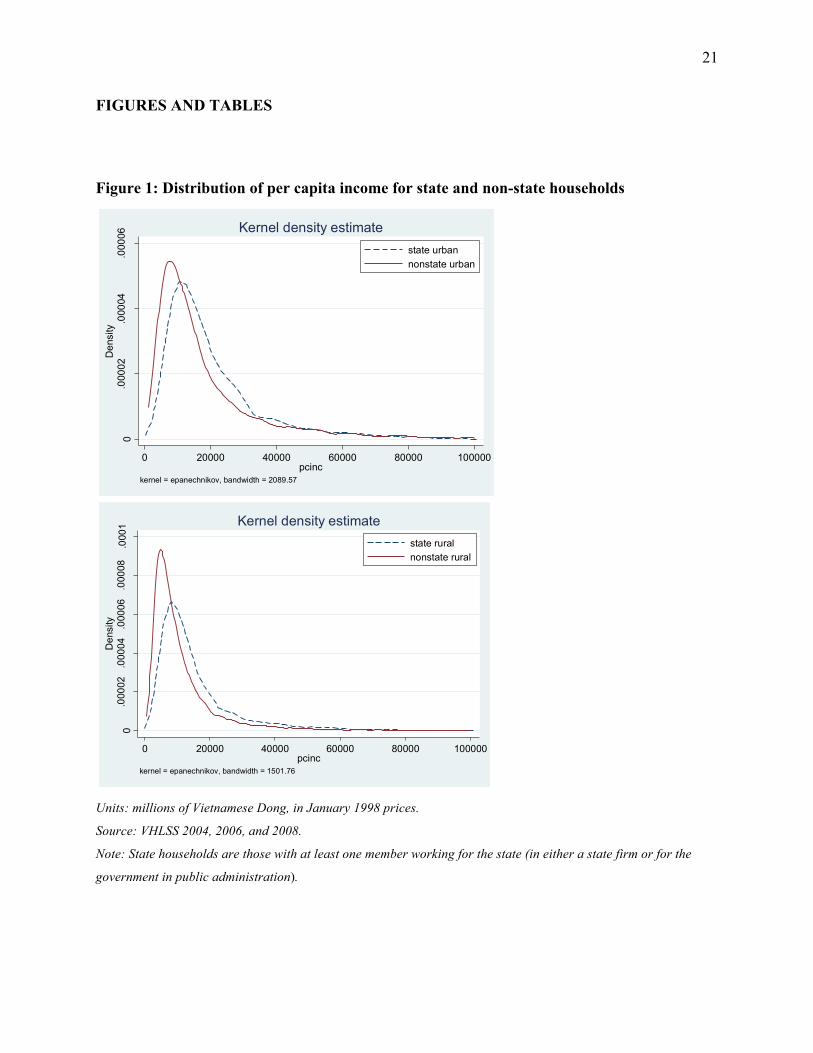
In Vietnam, income inequality across the state/non-state divide is clearly visible in household
survey data. These data also reveal that this inequality is not caused by just a few households at
the very top of the political hierarchy. Figure 1, based on representative national household data,
shows that the per capita incomes of “state” households (those containing at least one member
working for a state firm or in public administration) are appreciably higher than those for non-
2
state households, whether in urban or rural areas.2 The gap widened between 2004 and 2008, a
period of very rapid growth in Vietnam during which average real income per capita rose by
almost fifty percent.
[Figure 1 here]
Why should households’ labor market connections be important, and why should returns to skills
be higher for state employees rather than those in the private sector? A default model would
predict equal returns to labor of equal skills in equilibrium. Moreover, the experience of the
transition from socialism in Eastern Europe and the former Soviet Union was overwhelmingly
one in which movement of white-collar workers to the private sector was strongly positively
selected, reflecting more productive employment opportunities with higher earnings to match
(Adamchik and Bedi 2000; Munich et al. 2005). Vietnam, like China, shows the opposite trend
(Phan and Coxhead 2013).
Our answer, while speculative, fits with the stylized facts of an economy in an as-yet incomplete
transition from command to market economy. The skill-intensity of civil service employment is
high, but the demand for workers is limited by budget constraints on government agencies. State-
owned enterprises (SOEs), on the other hand, benefit from capital market interventions that
lower their borrowing costs; they therefore adopt relatively capital-intensive techniques. Because
capital and skills are complementary inputs, more highly educated workers are drawn to these
firms and compete to be hired by them. But since SOEs primarily supply goods and services to
(often highly-regulated) domestic markets, their expansion—and thus their demand for labor—is
bounded in ways that do not apply to privately-owned and trade-oriented firms. What both SOEs
and civil administration have in common, however, is access to rents, which when distributed
among their workers, generate potential for incomes that are higher than the earnings of
equivalent workers in competitive industries.3
2 Simple t tests also show statistically significant difference in the mean per capita income between the two groups of households, for both rural and urban areas (at 7% or lower significance levels). 3 For an equivalent account using Chinese labor market data see Xin Meng (2000).

3
Non-state firms, meanwhile, suffer from crowding out in capital markets and so adopt less
capital-intensive techniques. In these firms, capital-skills complementarity means they will hire
fewer skilled workers, and will offer to compensate them at a lower rate, commensurate with
their lower value marginal product.4
In this system, segmentation in the skilled labor market arises indirectly, from capital market
distortions, market structure, and budget constraints limiting hiring by state entities. This
segmentation is visible as queuing by applicants and demands for up-front payments from
prospective employers. The difference in earnings for equivalent workers at each type of firm
will persist so long as the favored firms face market or regulatory conditions that generate rents
and so encourage them to restrict hiring. Thus capital market policies will lead to job rationing
and incentives for corrupt behavior across a broad spectrum of the white-collar labor market, not
merely among the few that have direct access to the highest levels of political power.
In earlier work (Phan and Coxhead 2013) we uncovered evidence in support of an important part
of the above narrative. Vietnam displays a high degree of industrial policy distortion, with a clear
bias in favor of state-owned enterprises in the markets for banking sector credit, equity capital,
and land (World Bank 2006; Sjöholm 2008; Hakkala and Kokko 2008; Leung, 2009; Nixson et
al. 2010, IMF 2012) and in trade and pricing policies (Athukorala 2010). We discovered a highly
significant state-sector premium in earnings and in returns to education; as of 2008, this premium
had persisted despite two decades of economic reforms. We also found that family connections
to state sector employers increase an individual’s own probability of having a state sector job.
Together, these results indicate that connections to the state sector increase individual earnings
and returns on human capital investments, and that these effects operate at least in part through
household-level connections.
4 A recent study using labor force data covering five broad industrial sectors confirms this prediction, finding that in manufacturing, post-secondary qualifications earn a premium of only 40-50% over primary education, and concluding that “there is currently not a strong demand for workers with either professional training or tertiary education in either low-value or medium-value industries… workers with post-secondary qualifications are therefore likely to gravitate towards better-remunerated jobs in government and administration and the services” (Baulch et al. 2012:22-23).

4
The concerns raised by these findings are not limited to inequality. A country’s long-term
economic growth depends on its ability to accumulate and efficiently deploy human capital, and
the acquisition of human capital is a key determinant of improvements in individual earning
power. The preceding narrative suggests that in the presence of certain policies and capital
market distortions, household-level incentives for educational investments will depend, in part,
on the likelihood that their children will be able to secure jobs in which skills or credentials are
rewarded. If this probability is viewed as small, then returns to additional years of education are
perceived as low, and capital-constrained parents will spend less on education and/or withdraw
children from school earlier; those children will enter the labor force at a younger age and with
less formal training. That perceived returns matter for educational investments is well established
in empirical studies. In a study from the Dominican Republic, for example, Jensen (2010) finds
that when children are given information on higher measured returns to education, they complete
on average 0.20-0.35 more years of schooling over the next four years. Similarly, Jensen (2012)
finds that young rural women in India are significantly more likely to enter the labor market or
obtain more schooling instead of getting married and having children if they have access to
recruiting services, which increase their awareness of job opportunities.
Lower perceived returns to schooling reduce educational investments and the schooling
achievements of children. As a result their lifetime earnings profiles will be flatter and their
capacity to invest in the education of their own children will be diminished. In this way, initial
household-level disparities in opportunity may become persistent over more than one generation.
Moreover, the potential productivity of less-educated workers will also be lower, so the economy
as a whole will face a diminished growth rate and lower steady-state income per capita relative to
the counterfactual of one in which perceived returns are higher.
In this paper, we test the hypothesis that households with close connections to Vietnam’s state
sector invest more in their children’s human capital. Specifically, we ask whether children from
households headed by state employees are more likely to attend high school or university, and
whether those households spend more on their children’s education. The first of these questions
explores the extensive margin of educational attainment in an economy where only a small
minority of school-leavers continue on to higher education. The second question investigates the

5
intensive margin of educational investments in a system in which household spending on
discretionary educational items, such as tutors and private schools, is an important component of
total educational expenditures.
After controlling for characteristics of the potential student, the household head, and the
household we find robust evidence that children from households whose heads work for the state
are more likely to attend university, and that these households also spend significantly more on
their children’s education.
Our work extends the existing literature on educational inequality by identifying and focusing on
a previously neglected dimension. The state/non-state dichotomy among households proves to be
an important dividing line for investments in the most growth-oriented form of individual and
household capital, education. Policies that restrict access to schooling or reduce incentives to
remain in school create and exacerbate inequality, a phenomenon now widely seen as reducing
growth (Stiglitz 2012). By discouraging educational investments by some, they also reduce the
efficacy of efforts to promote and sustain long-run economic growth.
The rest of this paper is organized as follows. In section 2 we review basic data and trends on
educational attainment and related indicators in Vietnam. In section 3 we motivate a somewhat
deeper analysis and conduct an econometric exploration of our main hypotheses. In section 4 we
discuss our results, and in section 5 we draw some tentative conclusions, speculate on the
generalizability of our findings, and propose some avenues for future research.
2. A new dimension of inequality: state and non-state households
2a. Data
Our primary data source is the Vietnam Household Living Standards Survey, with rounds in
1993, 1998, 2002, 2004, 2006, and 2008.5 These surveys gather data on household income and
expenditure and are designed to measure living conditions and poverty and inequality (Grosh and
Glewwe 2000). They are intended to be representative at the national and provincial levels.
They also include modules on education and on employment and wages. Early rounds of VHLSS 5 Data from the most recent VHLSS rounds, in 2010 and 2012, are not yet available to us.

6
were smaller in size (4,800 households in 1993 and 6,000 in 1998). The survey year 2002 had the
largest number of households (29,533). In the most recent three rounds, the number of
households from which both expenditure and income data are collected has stabilized at around
9,000.6 In our regressions, we use data from the 2004, 2006, and 2008 rounds. Consistent
questionnaires and definitions of variables in all these three survey years allow us to pool data
into one estimating model.
To measure years of education, most other studies using VHLSS data have used the survey’s
original schooling year variable, which ranges from 0 through 12 years. We adjust schooling
years for highest educational level (junior college corresponds to 14 years of education, a college
degree 16 years, master’s degree 18 years, and Ph.D. 21 years). As a result, our calculated years
of schooling are higher than other studies.
In the descriptive analysis in the next section we also use the Vietnam Enterprise Survey for data
on firms. This is an annual survey begun in 2000.7 It covers all enterprises with independent
accounting systems that are established under and governed by the Law on State-owned
Enterprises, the Law on Cooperatives, the Law on Enterprises, and the Law on Foreign
Investment in Vietnam. All formal sectors and industries, including agriculture, are covered;
however, because the criterion for inclusion in the survey is establishment and governance under
the law, the informal sector is largely ignored. The survey questionnaire includes various
business and production activities: labor and employment, incomes of employees, number of
establishments, assets and liabilities, investments, capital stock, production costs, turnover,
products, profits, inventories, taxes, R&D investments, IT applications, and others.
2b. Employment and wages in state and non-state firms
In the course of Vietnam’s more than 20 years of transition to a market economy, the state sector
has retained an extraordinarily prominent role. SOEs account for between one-third and two-
fifths of economic activity. According to the VHLSS data, employment in SOEs has even risen
6 These are survey subsamples that have both income and expenditure modules. There are also much larger surveys with expenditure modules only, which we do not want to use because data are considered less reliable when income cannot be compared against expenditures. 7 This survey existed in the 1990s, but in a somewhat different form and quality.

7
as a share of total wage labor employment (which itself has risen substantially since the 1990s).
Table 1 provides a summary of employment by ownership type.
[Table 1 here]
Table 2 confirms that state sector firms are far more intensive in their use of educated workers
than are non-state firms. Although the average years of education for non-state workers has risen
steadily, from 5.6 in 1993 to 7.8 in 2008, this figure still remains far below years of education in
state sector firms. Moreover, as Table 3 shows, the proportion of workers in non-state firms with
a college degree remains extremely low (1.8% in 2008) by comparison with state firms (30%).
[Tables 2 and 3 here]
One reason for the higher skill-intensity of state sector employment is that some jobs in this
sector are government administrative positions that require higher education. Another important
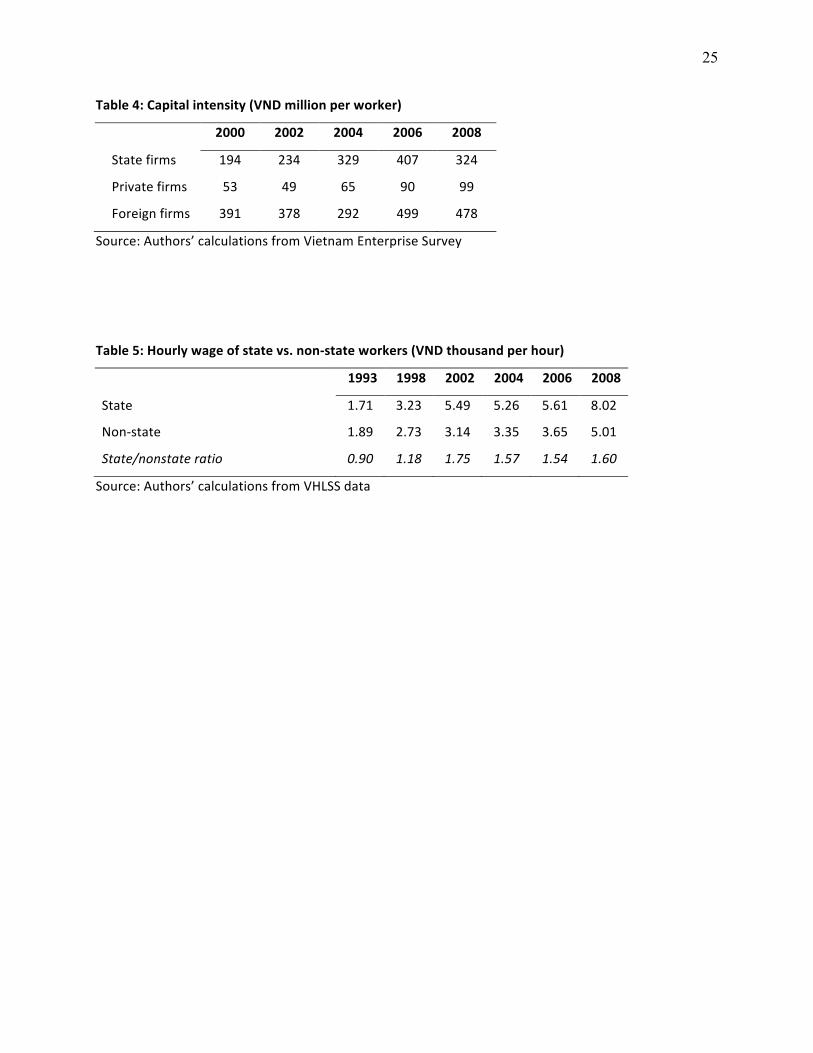
reason is technological: capital and skills are complements in production (Griliches 1969). Table
4 reveals much higher capital per worker in state and foreign-invested firms compared to non-
state firms. In the case of SOEs this is undoubtedly the result of their privileged access to capital.
The combination of technological factors and policy distortions results in higher demand for
skilled workers by SOEs than by private firms.
[Table 4 here]
These differentials in capital and skill intensities between state and non-state firms no doubt
contribute to the discrepancy in average hourly wages, shown in Table 5. In 1993, workers in the
state sector earned less on average than workers in the non-state sector. But this was prior to the
implementation of most market and labor reforms; since then, they have earned about 40% more
per hour than non-state workers. Of course, these are simple averages and do not take account of
differences in the composition of the labor force in each type of firm. But as mentioned earlier,
our earlier econometric investigation confirms that workers in state firms indeed receive higher
returns to education, even after controlling for many differences in worker and job

8
characteristics, and that far from being erased by the economic transition, this disparity has
increased over time (Phan and Coxhead 2013).
[Table 5 here]
2c. Educational attainment and investments by state and non-state households
There is a large literature on the influence of family environment on human capital investments
(for a recent and highly relevant survey, see Yi et al. 2011).8 For Vietnam, the VHLSS data
reveal well-known sources of cross-household variation in schooling rates and educational
expenditures, such as between urban and rural subpopulations, ethnic minority and Kinh majority
households, households in different regions of the country, and of course variation based on
differences in per capita income (Vu 2012).9 These are the familiar break points in econometric
analyses of educational attainment. But even after controlling for these sources of variation,
differences in human capital investments persist. What explains this? One clue to the remaining
differences comes from our prior work on returns to education. Our estimates of the treatment
equation for employment in the state sector revealed that workers in households where another
household member works for a state firm are far more likely themselves to have state sector jobs,
even after controlling for other household factors and individual characteristics. This empirical
insight points to a previously unexamined fracture line in the educational attainment and
investment data: variation by state vs. non-state households. We now turn to the examination of
these data.
In this section we use three different measures of educational attainment and investments:
average years of schooling, net and gross enrollment rates in different levels of schooling,10 and
household educational expenditures. No matter which measure we use, state households (those
with at least one member working for a state firm or for the government) tend to invest more in
8 See esp. their fn 21, a discussion of the “true” meaning of parental education, which has been shown to have a strong influence over schooling outcomes for children. Parts of this literature explore just what parental education stands for – whether income, or cultural norms favoring education, or other things. 9 And compare these differentials in similar countries, such as China (Wang et al. 2011) 10 Net enrollment rate is the ratio of enrolled children in the official school age group over the total number of children in that age group. Gross enrollment rate is the ratio of enrolled children of all ages over the total number of children in the official school age group.

9
the education of their children. Figure 2 shows that for all age groups, the average years of
schooling of children from state households are higher than those of children from non-state
households. The differences in means are small at lower levels of education, but widen
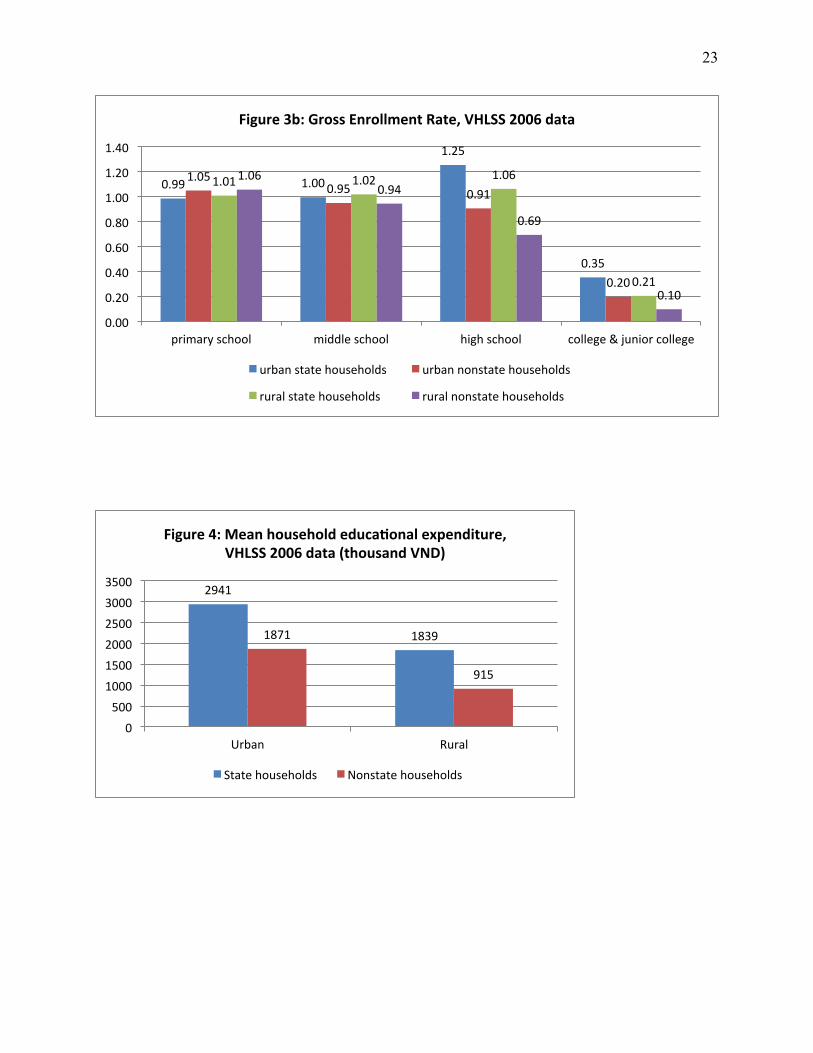
progressively through college. Figures 3a and 3b reveal a similar story. Net and gross enrollment
rates are higher for children from state households in both rural and urban areas. Again, the
differences are greatest at the college level—the level most relevant for the skilled labor market.
Finally, Figure 4 confirms that state households tend to spend more on their childrens’ education
than do non-state households, in both rural and urban areas.
[Figures 2, 3a, 3b, and 4 here]
In summary, the available data point to a large premium for educated workers employed in the
state sector. If the presence of a parent or other elder with a state sector job means easier access
for others in the same household, then schooling decisions appear to be driven (at least in part)
by access to jobs in the favored sector. There are, however, many covariates to be controlled for
when analyzing educational investments. Therefore we now turn to a more rigorous examination
of the determinants of household educational investment.
3. Determinants of household educational investments
3a. Empirical strategy
Our goal is to understand disparities in household educational investments. As is well known,
education is often terminated at discrete points such as the completion of a given level of
schooling. Therefore we focus on specific schooling decisions. These are first, the decision to
enroll a child in high school given completion of middle school, and second, the decision to
enroll a potential student in university given that he or she has completed high school. Our
empirical strategy is based on well-established human capital theory (Schultz 1960 and 1963,
Becker 1964 and 1981). This maintains that household demand for education is affected by
expected returns (r) and costs (c, including direct and opportunity costs) of education:
yi* = ƒ(ri, ci, Di, ui) = α + γri + δci + βDi + ui (1)

10
where yi* is a latent variable capturing the decision to enroll in university or high school by
potential student i, Di is a vector of controls including demographic variables such as gender,
age, and ethnicity, geographic variables, and other exogenous influences, and ui is a random
error term that is assumed independently and identically distributed with expected value E(ui) =
0. We have assumed a linear functional form for the explanatory variables.
The observed variable is yi, which is a dummy indicating whether the potential student i enrolls
in university (or high school).
yi = 1 if yi* >0, and
= 0 otherwise.
Thus, the frequency of the observed outcome, or the probability of enrolling in university or high
school is equal to:
Pi = Prob(yi = 1) = Prob(yi* >0)
= Prob(α + γri + δci + βDi + ui > 0)
= Prob(ui > -α - γri - δci - βDi)
= 1 – G(-α - γri - δci - βDi)
where G(.) is the cumulative distribution of the error term (Maddala 1983). If we use the logistic
cumulative distribution function and take the log of the odds ratios, then we have a logit model:
logit(Pi) =log[Pi /(1- Pi)]) = α + γri + δci + βDi (2)
Our primary focus is on explaining differential incentives to invest in education, given
differences in expected returns to education in private and state sector jobs. That is, the decision
to progress from middle to high school, or to enroll in tertiary education, takes into account the
trajectory of returns to education in state and non-state employment adjusted by the probabilities
of employment in either sector. From Phan and Coxhead 2013 we know that the average rate of
return to education in the state sector (rS) is higher than in the non-state sector (rN). If ρi is the

11
probability of state sector employment for potential student i, then his expected returns to
education is ri = rSρi + rN(1- ρi). Under the assumption of uniformity within each employment
sector, we can normalize rN = 1 and rewrite ri = 1 + [rS – 1]ρi. Substituting this into the previous
equation, our logit model becomes:
logit(Pi) = (α +γ) + γ(rS – 1)ρi + δci + βDi (3)
Equation (3) is our estimating equation.11 The variable of interest is ρi, the probability of getting
a state sector job. Lacking direct observations on this, we use two proxies: an “SOE” dummy
which equals 1 if household head works for a state firm, and a “civil” dummy equal to 1 if the
head of household works in public administration. These dummies aim to capture a household’s
connection to the state sector, whether state-owned enterprises or government. The null
hypothesis is that these dummies are not statistically different from zero; that is, the sector of
employment of a potential student’s household head has no effect on probability of high school
or university enrollment. Rejection of the null is evidence of state employment as a source of
household differences in educational incentives. We discuss the implications of such a finding in
section 4.
We include three other sets of explanatory variables:
• Household characteristics: log of household income,12 household composition by age,
urban or regional dummies, ethnic minority dummy (equals 1 if household is not of Kinh
or Chinese ethnicities);
• Household head characteristics: age, gender (equals 1 if male), years of schooling, and
skill dummy (equals 1 if household head holds a skilled job) ;
• Child characteristics: gender (equals 1 if male) and age.
Among the control variables, those of greatest economic interest are the household’s ability to
finance education, as measured by household income, and the household head’s years of
11 The model is estimated using maximum likelihood method using Stata. 12 We also ran a series of regressions using household expenditure, which yield similar results. Details are available from the authors.

12
schooling. Obviously, wealthier households are more able to pay for education and to keep
children out of the labor force until a later age. A large empirical literature confirms that more
educated parents tend to invest more in the education of their own children.13 Controlling for
parents’ education also helps reduce (although not completely eliminate) omitted variable biases,
because this variable serves as proxy for many monetary and non-monetary factors that affect
schooling decisions. For example, we have no information on children’s intelligence or ability:
smarter children do better in school and are more likely to attend high school and college, other
things equal. Another omitted variable is preferences: some children may love schooling for the
sake of knowledge, not for the monetary returns. If these omitted variables are correlated with
employment sector of household head, their omission causes upward biases in estimates of the
SOE and civil dummies. But it is reasonable to assume that parents who are smarter and who
love education tend to transfer their intelligence and love of schooling to their children. Such
parents also tend to attain more education. So parents’ education partly proxies and controls for
the two omitted variables, children’s ability and love of schooling.
In estimating determinants of school enrollment probability, we look only at the children and
grandchildren of household heads. We do this intentionally to avoid potential endogeneity due to
reverse causality. Since we examine the impact of the older generation’s employment on
educational investments for the younger generation, and it is not plausible that the younger
generation’s educational achievement increases the likelihood of state employment by the older
generation, there is no reverse causality problem.
In addition to estimating the probability of university or high school enrollment, we also estimate
household educational expenditures, another measure of household educational investment.
Since many households have zero educational expenditure, our sample suffers from censoring.
As a result, we use a Tobit model for this estimation.
3b. Results
13 A recent study of rural households in southern Vietnam confirms that as agricultural incomes increase, the schooling years of children (especially daughters) increase. See Edmonds 2005.

13
Estimation results are presented in Tables 6 through 8. In Tables 6 and 7, we use logistic
regressions to estimate school enrollment probabilities (see equation 3). We report both
estimated coefficients and odds ratios. Standard errors are robust and adjusted for clustering at
the commune level. In both Tables 6 and 7, most variables have coefficients of expected signs
and statistical significance. For brevity, we restrict our discussion to the main variables of
interest, the civil and SOE dummies. In Table 6, these dummies are not statistically significant.
The household head’s employment does not seem to affect children’ probability of enrolling in
high school. But in Table 7, both dummies are positive and statistically significant. The
estimated odds ratios imply that the university enrollment probability of a potential student
whose household head works in an SOE is 1.3 times greater than that of someone whose
household head works elsewhere. For someone whose household head works in public
administration, the probability is 1.4 times greater.
[Tables 6 and 7 here]
That connection to the state sector is not a source of influence in schooling decisions at lower
levels of education is consistent with a theoretical model in Phan and Coxhead 2013. In that
paper, we argue that the rising wage premium of state sector jobs’ is a result of government
intervention in both capital markets and the market for skilled labor. As the government allocates
capital to the state sector, this raises the demand for skilled labor in that sector (because of skill-
capital complementarity). But since access to state sector jobs is restricted, the increase in
demand for skilled labor translates to higher earnings for skilled workers in this sector. These
distortions do not apply to unskilled labor markets, which require lower education. Therefore we
do not expect a relationship between state connection and investment in lower levels of
schooling.
In Tables 8 and 9, we estimate the determinants of households’ educational expenditures and the
share of education in total household expenditures. Once again, employment of the household
head is influential. In Table 8, the SOE and civil dummies have positive and statistically
significant impacts on (log of) household education expenditure, after controlling for household
14
income and other characteristics. In Table 9, the civil dummy has a positive and statistically
significant impact on the share of household education expenditure in total expenditure.
[Tables 8 and 9 here]
To summarize these results, even after controlling for the usual determinants of educational
investments we decisively reject the null hypothesis of no effect of state employment of parents
on investments in the education of children. The implication is that due to underlying distortions
that give rise to state sector wage premia and labor market segmentation, factors other than
ability are helping determine who among Vietnamese children receives more and better
educational opportunities. This has consequences for both equity and growth in the long run.
4. Discussion
Inequality. When there is rationing in the market for skills, discrepancies in the household
distribution of assets, including claims on state-sector jobs, can be transmitted across
generations. It follows (although we do not address this directly) that unequal access to education
and an unequal distribution of incentives to enroll in tertiary education could both exacerbate
initial inequality and increase the rate at which the fortunes of favored and less favored
households diverge during the course of economic growth and transition to a market economy.
Our main result is elaborates a point that has been made before in other settings. Becker and
Tomes (1993), for example, explore the potential of capital market imperfections to lower
parents’ investments in their children’s acquisition of human capital. The Vietnamese data
suggest two potentially interesting twists on this account. First, it is not only widely-studied
constraints such as access to credit that distinguish the fortunes of one family from those of
another. Labor market segmentation may also give rise to a structural disparity that is hard for
households to bridge. Second, and related to this, in our data it appears that a key asset that
parents can bequeath to their children is access to state jobs, and this in turn influences the
expected rate of return to the latters’ education. But access, like human capital itself, does not
function well as collateral. Two implications follow. First, even if a household could self-finance
a higher level of education for its children, that investment might still not pay off in the labor

15
market. Second, public policies aimed at broadening access to education might not raise
enrollments if incentives are reduced by distortions that lower the probability of getting a
suitably rewarding job.
Growth. In low-income countries, and especially in those undergoing transition, aggregate
growth can be sustained for a time through mobilization of underutilized resources and
efficiency gains due to economic policy reforms. But in the longer run, continued growth relies
on increases in total factor productivity and investments in reproducible factors of production,
most notably human capital. Developing economies that under-invest in human capital risk
landing in a middle-income trap in which their continued progress up the product quality ladder
or participation in global production networks is constrained by human capital shortages. This
leaves them reliant on other sources of income, typically natural resource extraction or low-skill
manufactures, for which global competition among suppliers is intense. Our results suggest that
at present, a large majority of Vietnamese workers have a low probability of finding employment
in an industry or occupation where returns to higher-quality education or tertiary credentials will
justify the cost of their acquisition. Even if other constraints (such as access to credit) do not
bind, some fraction of high school and college-age children are rationally opting out of education
to join the unskilled or semi-skilled labor force.
It may be possible for these individuals to acquire additional skills later in life, for example
through vocational training or on-the-job training, but at present, neither of these channels
appears promising in Vietnam. Vocational training is not widespread, nor is it respected by
Vietnamese employers (Chirot and Wilkinson 2009). And due to the crowding-out of banking
sector capital for small and medium enterprises, capital intensity outside of the state sectors and a
few other well-connected industries is very low; accordingly, returns to education and skills are
also low in these industries (Baulch et al., 2012). So Vietnam confronts a medium-run future in
which a large part of its adult labor force is inadequately prepared to support a move up the
product quality ladder, from assembly to innovation.
Finally, as discussed at the start of this paper, inequality and long-run economic growth are
increasingly widely regarded as positively linked, with access to education and incentives to

16
acquire human capital as key conduits. This was succinctly stated in a recent report on rising
inequality around the world:
If income gaps get wide enough, they can lead to less equality of opportunity, especially in education. Social mobility in America, contrary to conventional wisdom, is lower than in most European countries. The gap in test scores between rich and poor American children is roughly 30-40% wider than it was 25 years ago. And by some measures class mobility is even stickier in China than in America (The Economist 2012a).
The Economist’s primary proposed remedy is to dismantle monopolies and vested interests, be
they state-owned enterprises in China, India’s “unequal oligarchy or worse,”14 or big banks on
Wall Street. Although by the usual measures inequality in Vietnam is much lower than in most
economies, so too is its per capita income. Therefore, the prospect of a lower growth rate due to
inequality in human capital investments must be treated very seriously.
Generalizability. Our data are drawn from just one developing economy, but there are strong
indications that the analysis is relevant to a larger group. In many countries with less restrictive
regimes than Vietnam, SOEs enjoy qualitatively similar positions in terms of their access to
domestic capital, dominance in domestic markets, and connections to political decision-makers.
State involvement in developing economies is not disappearing as quickly as was perhaps
expected in the post-Cold War, Washington Consensus era. In fact there are some recent signs of
a resurgence of state engagement.15 Thus the role of personal connections, so highly significant
in the case of one rather heavily distorted developing economy, may well be present, albeit less
starkly so, in many others.
Our results are necessarily conditional on a set of parameters that is subject to change along with
Vietnamese economic policies. In particular, the state-nonstate gap in labor productivity (and
thus in returns to skills and earnings) could be reduced or eliminated by structural reforms that
14 Raghuram Rajan, quoted in The Economist 2012b. 15 The Economist, 21 July 2012, “The great slowdown” comments on this as follows:
“Sadly, many emerging-world governments have interpreted the crisis in rich-world finance as a reason to preserve a more muscular role for the state. China has reserved some sectors for state-owned enterprises. In Brazil the big state-controlled oil company, Petrobras, and the state-controlled banks have become virtual appendages of government policy. Having so much leverage over the economy is indeed helpful during a crisis, but in the long run it will stifle competition, starve the private sector of capital, deter foreign investment and know-how, and breed corruption.”

17
reduce or eradicate the special economic status of state sector enterprises. Alternatively, greater
access by firms, and especially by small and medium enterprises, to foreign capital would be
influential since it would offset the productivity-reducing effects of capital crowding-out by
SOEs. Whether either of these changes is sufficient to reverse the trend toward greater disparity
that we have documented remains an open question. Further analysis with the most recent rounds
of VHLSS (2010 and 2012), once they become available, will help answer this question.
5. Conclusion
In this paper we have explored a hitherto neglected dimension of inequality: that arising in a
transitional economy between households with access to rationed, rent-yielding state sector jobs
and those without. Data from several rounds of Vietnam’s household living standards surveys
confirm a substantial difference in per capita incomes across this divide. Our research then
reveals that the state/non-state dichotomy also marks a significant discrepancy in households’
educational investments in their children. When state employers are the largest demanders of
skills, and when they compensate those skills far more generously, on average, than do non-state
employers, there is competition among workers to win state jobs. These jobs are effectively
rationed by public sector budget constraints and limited domestic markets for the goods and
services produced by state-owned corporations. As a result, connections based on family ties
become important factors raising the probability of winning a state sector job. Households for
which these connections are strong tend to invest more heavily than others in education and
credentials for their offspring. In other households, the data suggest that opportunity cost drives
children whose parents cannot help them win lucrative state sector jobs out of education earlier
and at lower levels, and that those households invest less overall in education of their children.
These divisions depend on policy, not on secular development trends, and so could well persist
across generations, creating a two-track labor market of “princelings” and “paupers.”
International evidence suggests further that unequal incentives to invest in human capital will in
the long run lead to slower rates of aggregate economic growth. If so, then Vietnam could face
an earlier onset of the middle income trap than would be the case under the counterfactual of a
more level playing field for labor and education. Prior experience of other regional economies
like Malaysia, Thailand and Indonesia pinpoints underinvestment in human capital formation as

18
a key contributing factor to growth slowdowns and vulnerability to economic crises (Booth
2003; Warr 2005; Coxhead and Li 2008). These are important lessons for Vietnamese
policymakers. The insight from our study is that skills shortages will not necessarily be resolved
simply by increasing the supply of schools and teachers. There is a potentially binding demand
side constraint on human capital deepening, and this can be eliminated only by deeper structural
reforms.
19
References
Adamchik, V.A., and A.S. Bedi, 2000. “Wage differentials between the public and private sectors: evidence from an economy in transition.” Labor Economics 7: 203-224.
Athukorala, P. 2006. “Trade policy reforms and the structure of protection in Vietnam.” The World Economy 29(2): 161-187.
Baulch, B.; Vu Hoang Dat, and Nguyen Thang, 2012. “Do Vietnamese schools provide the right education for an industrializing country?” Young Lives project, Working Paper No. 81, September.
Becker, G., and N. Tomes, 1993. “Human capital and the rise and fall of families.” In G. Becker: Human Capital, 3rd edition (Chicago University Press).
Berg, A.G., and J.D. Ostry, 2011. “Inequality and unsustainable growth: two sides of the same coin?” IMF Staff Discussion Note SDN 11/08.
Booth, A., 2003. “Education and economic development in Southeast Asia: myths and realities.” in Jomo K.S. (ed), Southeast Asian Paper Tigers? From Miracle to Debacle and Beyond. RoutledgeCurzon.
Chirot, L., and B. Wilkinson, 2009. “The intangibles of excellence: Governance and the quest to build a Vietnamese apex research university” (mimeo, The New School).
Coxhead, I., and Muqun Li, 2008. “Prospects for skills-based exports in resource-rich developing economies: Indonesia in comparative perspective.” Bulletin of Indonesian Economic Studies 44(2): 199-228.
Edmonds, E.V. "Does child labor decline with improving economic status?" Journal of Human Resources 40(1): 77-99.
Financial Times, 2012. “Young feel hungrier for ‘golden rice bowl’ jobs: Record numbers eye public sector.” 25 October 2012.
Griliches, Z., 1969. “Capital-skill complementarity.” Review of Economics and Statistics 51(4): 465–468.
Hakkala, K., and A. Kokko, 2008. “The State and the private sector.” In A. Kokko, ed., Viet Nam: 20 Years of Doi Moi (Hanoi: The Gioi Publishers for Vietnam Academy of Social Sciences), pp. 81-126.
IMF, 2012. “2012 Article IV Consultation.” IMF Country Report No.12/165. www.imf.org, accessed 30 September 2012.
Jensen, R., 2012. “Do labor market opportunities affect young women’s work and family decisions? Experimental evidence from India,” Quarterly Journal of Economics 127(2): 753-792.
Jensen, R., 2010. “The (perceived) returns to education and the demand for schooling,” Quarterly Journal of Economics 125(2): 515-548
Leung, S., 2009. “Banking and financial sector reforms in Vietnam.” ASEAN Economic Bulletin 26(1): 44-57.

20
Maddala, G. S. 1983. Limited Dependent and Qualitative Variables in Econometrics. Cambridge University Press: New York.
Munich, D., J. Svejnar, and K. Terrell, 2005. “Returns to human capital under the communist wage grid and during the transition to a market economy.” Review of Economics and Statistics 87(1): 100-123.
New York Times, 2012a. “‘Princelings’ in China use family ties to gain riches.” 17 May 2012. www.nytimes.com, accessed 17 June 2012.
New York Times, 2012b. “In Vietnam, message of equality is challenged by widening wealth gap.” 1 September 2012. www.nytimes.com, accessed 1 September 2012.
Nixson, F., and B. Walters, 2010. “Vietnamese enterprises: toward global competitiveness.” Hanoi: UNDP.
Phan, Diep, and I. Coxhead, 2013. “Long-run costs of piecemeal reform: wage inequality and returns to education in Vietnam.” Journal of Comparative Economics, in press.
Pincus, J., Vu Thanh Tu Anh, Phan Duy Nghia, B. Wilkinson, and Nguyen Xuan Thanh, 2012. “Structural reform for growth, equity and national sovereignty.” Ho Chi Minh City: Fulbright Economics Teaching Program Discussion Papers, http://www.fetp.edu.vn/en/policy-papers/discussion-papers/, accessed 10 Oct. 2012.
Sjöholm, F., 2008. “State-owned enterprises and equitisation in Vietnam.” In A. Kokko, ed., Viet Nam: 20 Years of Doi Moi (Hanoi: The Gioi Publishers for Vietnam Academy of Social Sciences), pp. 45-80.
The Economist, 2012a. “Crony tigers, divided dragons” 13 October 2012. The Economist, 2012b. “True progressivism” 13 October 2012.
UNDP, 2006. “The state as investor: equitization, privatization and the transformation of SOEs in Vietnam.” Hanoi: UNDP Viet Nam Policy Dialogue Paper 2006/3.
Xin Meng, 2000. Labour Market Reform in China. Cambridge, UK: Cambridge University Press.Vu Hoang Linh, 2012. “An overview of access to and inequality in the education system of Viet Nam.” Asia-Pacific Development Journal 19(1): 37-62.
Warr, P.G., 2005. “Boom, bust and beyond.” In P.G. Warr, ed, Thailand Beyond the Crisis (RoutledgeCurzon), pp. 3-65.
Xiaobing Wang, Chengfang Li, Linxiu Zhang, Renfu Luo, T. Glauben, Yaojiang Shi, S. Rozelle, and B. Sharbono, 2011. “College education and the poor in China: documenting the hurdles to educational attainment and college matriculation.” REAP Working Paper No 213 (reapchina.org/reap.stanford.edu, accessed 1 October 2012).
Hongmei Yi, Linxiu Zhang, Renfu Luo, Yaojiang Shi, Di Mo, Xinxin Chen, C. Brinton, and S. Rozelle, 2011. “Dropping out: why are students leaving junior high in China’s poor rural areas?” REAP Working Paper No. 227 (reapchina.org/reap.stanford.edu, accessed 2 October 2012).
21
FIGURES AND TABLES
Figure 1: Distribution of per capita income for state and non-state households
Units: millions of Vietnamese Dong, in January 1998 prices.
Source: VHLSS 2004, 2006, and 2008.
Note: State households are those with at least one member working for the state (in either a state firm or for the
government in public administration).
0.0
0002
.000
04.0
0006
Den
sity
0 20000 40000 60000 80000 100000pcinc
state urbannonstate urban
kernel = epanechnikov, bandwidth = 2089.57
Kernel density estimate
0.0
0002
.000
04.0
0006
.000
08.0
001
Den
sity
0 20000 40000 60000 80000 100000pcinc
state ruralnonstate rural
kernel = epanechnikov, bandwidth = 1501.76
Kernel density estimate

22
10.7 9.5
4.9
8.6 8.6
4.4
0.0 2.0 4.0 6.0 8.0 10.0 12.0
College age group (18-‐22) High school age group (15-‐7) Primary and middle school age group (6-‐14)
Figure 2: Average years of schooling, VHLSS 2006 data
State households Non-‐state households
0.90 0.88 0.79
0.28
0.90
0.79
0.61
0.18
0.86 0.80
0.61
0.15
0.88
0.74
0.45
0.09
0.00 0.10 0.20 0.30 0.40 0.50 0.60 0.70 0.80 0.90 1.00
primary school middle school high school college & junior college
Figure 3a: Net Enrollment Rate, VHLSS 2006 data
urban state households urban nonstate households
rural state households rural nonstate households
23
0.99 1.00
1.25
0.35
1.05 0.95 0.91
0.20
1.01 1.02 1.06
0.21
1.06 0.94
0.69
0.10
0.00
0.20
0.40
0.60
0.80
1.00
1.20
1.40
primary school middle school high school college & junior college
Figure 3b: Gross Enrollment Rate, VHLSS 2006 data
urban state households urban nonstate households
rural state households rural nonstate households
2941
1839 1871
915
0 500 1000 1500 2000 2500 3000 3500
Urban Rural
Figure 4: Mean household educaGonal expenditure, VHLSS 2006 data (thousand VND)
State households Nonstate households

24
Table 1: Structure of employment by type and ownership
1993 1998 2002 2004 2006 2008
Self employed 73.4% 59.4% 60.9% 57.0% 55.7% 55.2%
Wage employed 26.6% 40.6% 39.1% 43.0% 44.3% 44.8%
State wage employed 4.3% 6.7% 10.2% 14.7% 15.4% 14.7%
Non-‐state wage employed 22.2% 33.9% 28.9% 28.3% 28.9% 30.1%
Source: Authors’ calculations from VHLSS data
Table 2: Average years of education of workers in state and non-‐state sectors
1993 1998 2002 2004 2006 2008
State 11.3 9.9 11.7 11.1 11.3 11.8
Non-‐state 5.6 5.8 6.7 6.9 7.0 7.3
Source: Authors’ calculations from VHLSS data
Table 3: Workers with college degree in state and non-‐state sectors (percent)
1993 1998 2002 2004 2006 2008
State 17.31 22.22 27.86 25.81 26.07 29.92
Non-‐state 0.38 0.78 1.38 0.98 1.12 1.77
Source: Authors’ calculations from VHLSS data
25
Table 4: Capital intensity (VND million per worker)
2000 2002 2004 2006 2008
State firms 194 234 329 407 324
Private firms 53 49 65 90 99
Foreign firms 391 378 292 499 478
Source: Authors’ calculations from Vietnam Enterprise Survey
Table 5: Hourly wage of state vs. non-‐state workers (VND thousand per hour)
1993 1998 2002 2004 2006 2008
State 1.71 3.23 5.49 5.26 5.61 8.02
Non-‐state 1.89 2.73 3.14 3.35 3.65 5.01
State/nonstate ratio 0.90 1.18 1.75 1.57 1.54 1.60
Source: Authors’ calculations from VHLSS data

26
Table 6: determinants of high school enrollment probability
Odds
Ratio Coeff. S.E. p-‐value
Household head characteristics
Head works for SOE (SOE dummy) 1.264 0.234 0.161 0.146
Head works for gov't (civil dummy) 0.998 -‐0.002 0.117 0.984
Head has a skilled job (skill dummy) 1.392 0.331 0.113 0.003
Head years of schooling 1.080 0.077 0.009 0.000
Gender of household head (male=1) 0.918 -‐0.086 0.065 0.185
Age of household head 1.011 0.011 0.003 0.000
Household characteristics
Log of household income 1.224 0.202 0.036 0.000
Ethnic minority dummy =1 1.481 0.393 0.099 0.000
Controls
Family demographic structure Yes
Child’s age and sex Yes
Region Yes
Year Yes
Constant
3.348 0.448 0.000
N 12333
Pseudo R-‐squared 0.299
NOTES: Data are from VHLSS 2004, 2006 & 2008. Logit regressions with robust standard errors (adjusted for clustering at commune level). Dependent variable: dummy equals 1 if potential student was currently enrolling in high school during survey year.
Sample includes children and grandchildren (who already obtained middle school diploma) of household heads.
Controls: Family demographic structure: # children ≤ 5 y.o; children 6-‐10 y.o.; children 11-‐14 y.o.; children 18-‐22 y.o.; fam.
members 23-‐65 y.o. Region: 8 administrative regions. Year: dummies for 2006 and 2008.
Bold means statistically significant at 5% level or less; Italic means statistically significant at 5-‐10% level.

27
Table 7: determinants of university or college enrollment probability
Odds
Ratio Coeff. S.E. p-‐value
Household head characteristics
Head works for SOE (SOE dummy) 1.332 0.287 0.148 0.053
Head works for gov't (civil dummy) 1.438 0.363 0.145 0.012
Head has a skilled job (skill dummy) 1.210 0.191 0.117 0.102
Head years of schooling 1.115 0.109 0.012 0.000
Gender of household head (male=1) 0.922 -‐0.081 0.087 0.352
Age of household head 1.018 0.018 0.005 0.000
Household characteristics
Log of household income 1.325 0.281 0.044 0.000
Ethnic minority dummy = 1 0.546 -‐0.604 0.177 0.001
Controls
Family demographic structure Yes
Child’s age and sex Yes
Region Yes
Year Yes
Constant
-‐4.585 0.558 0.000
N 8531
Pseudo R-‐squared 0.106
NOTES: Data are from VHLSS 2004, 2006 & 2008. Logit regressions with robust standard errors (adjusted for clustering at commune level). Dependent variable: dummy equals 1 if potential student was currently enrolling in college during survey year.
Sample includes children and grandchildren (who already obtained high school diploma) of household heads.
Controls: see notes to Table 6.
Bold means statistically significant at 5% level or less; Italic means statistically significant at 5-‐10% level.

28
Table 8: determinants of household educational expenditure
Dep. var = log of educational
expenditure
Coeff. S.E. p-‐value
Household head characteristics
Head works for SOE (SOE dummy) 0.495 0.128 0.000
Head works for gov't (civil dummy) 0.503 0.101 0.000
Head has a skilled job (skill dummy) 0.313 0.099 0.000
Head years of schooling 0.190 0.009 0.000
Gender of household head (male=1) -‐0.414 0.068 0.000
Age of household head -‐0.045 0.003 0.000
Household characteristics
Log of household income 0.812 0.036 0.000
Ethnic minority dummy = 1 -‐0.937 0.107 0.000
Controls
Family demographic structure Yes
Child’s age and sex Yes
Region Yes
Year Yes
Constant -‐6.726 0.401 0.000
N 27563
Pseudo R-‐squared 0.115
NOTES: Data are from VHLSS 2004, 2006 & 2008. Tobit regressions with robust standard errors (adjusted for clustering at commune level).
Controls: see notes to Table 6. Bold means statistically significant at 5% level or less; Italic means statistically significant at 5-‐10% level

29
Table 9: determinants of household educational expenditure
Dep. var = share of education in total
household expenditure
Coeff. S.E. p-‐value
Household head characteristics
Head works for SOE (SOE dummy) 0.004 0.003 0.228
Head works for gov't (civil dummy) 0.007 0.003 0.009
Head has a skilled job (skill dummy) 0.010 0.003 0.000
Head years of schooling 0.004 0.000 0.000
Gender of household head (male=1) -‐0.011 0.002 0.000
Age of household head -‐0.001 0.000 0.000
Household characteristics
Log of household income 0.008 0.001 0.000
Ethnic minority dummy = 1 -‐0.023 0.002 0.000
Controls
Family demographic structure Yes
Child’s age and sex Yes
Region Yes
Year Yes
Constant -‐0.091 0.009 0.000
N 27563
Pseudo R-‐squared -‐0.396
NOTES: Data are from VHLSS 2004, 2006 & 2008. Tobit regressions with robust standard errors (adjusted for clustering at commune level).
Controls: see notes to Table 6. Bold means statistically significant at 5% level or less; Italic means statistically significant at 5-‐10% level