primary production by suspended and benthic …. 145: 245-268, 1996 marine ecology progress series...
TRANSCRIPT
Vol. 145: 245-268, 1996 MARINE ECOLOGY PROGRESS SERIES
Mar Ecol Prog Ser l
Published December 31
Primary production by suspended and benthic microalgae in a turbid estuary: time-scales
of variability in San Antonio Bay, Texas
Hugh L. MacIntyre*, John J. Cullen*'
Marine Science Institute, University of Texas at Austin, Port Aransas, Texas 78373, USA
ABSTRACT: The within-day, between-day and month-to-month variability of light attenuation and microalgal chlorophyll a (chl a ) and photosynthetic response was measured in San Antonio Bay, Texas, USA. Waters were shallow (<2 m) and turbid (attenuation coefficients of 0.7 to 15.3 m"), yet daily rates of primary production (0.1 to 2.5 g C d-') were comparable to those in much deeper and clearer estuaries. Chl a concentrations in the sediment (459 to 7837 mg m-3 in the surficial millimeter) were much higher than those In the water column ( 4 to 48 mg m-'). The benthic assemblages were photo- synthetically competent, but dally benthic primary productivity was low (0.00 to 0.09 g C m-' d-'; an average of 2'Lb of productivity in the water colun~n) because of the very low irradiances at the sediment- water interface. The high rates of production by the suspended mlci-oalgae were largely due to high chlorophyll-specific light-saturdted rates of photosynthesis. P:,:' 13.0 to 24.4 g C (g chl a)- ' h- ' ] , which were correlated positively wlth temperat~lre and inversely with the mean irradiance in the water col- umn. The between-day and temperature-~ndependent variation in P$! was also correlated with F,,Chl-l, an index of the proportion of functional photosystem 11 reaction centers. In turn, within-day variability in F,,Chl-l was inversely correlated with the mean irradiance in the water column in 8 of 10 observations, a pattern consistent with photoinhibition. A depression of P:!' caused by photoinhibition throughout the water column may therefore be responsible for the inverse trend of P$' with mean irra- diance in the water column. Short-term (h) variability in suspended chl a and turbidity was high (coef- ficient of variation = 13 to 7 5 % ) , but estimates of daily productivity could be predicted with reasonable fidelity (mean error 2 7 % ) from a single midday determination of chl a, the photosynthesis versus lrra- d ~ a n c e response and the attenuation coefficient, along with daily incident radiation. The predictive power of a single observation was due to coherence in the variation of chl a, P::' and the attenuation coefficient In the water column- the decrease in mean irradiance caused by resuspension was compen- sated for by concomitant Increases in Pc,hland suspended chl a Between-day variability in productivity of 15 to 5 2 % approached month-to-month differences, so the optimal use of resources in monitoring productivity would be to take slngle samples daily.
KEY WORDS: Photosynthesis Photoacclilnation . Photoinhibition - Benthos . Resuspension. Turbidity . Mix~ng Modeling BZI Estuary
INTRODUCTION
Primary production by phytoplankton is determined by the availability of light as well as the abundance and photosynthetic com.petence of the microalgae.
'Present address and correspondence address: College of Marine Studies, University of Delaware, 700 Pilottown Rd, Lewes. Delaware 19958. USA. E-mail: [email protected]
"Present address: Department of Oceanography, Dalhousie University. Halifax. Nova Scotia. Canada B3H 451
Variability in these factors Inay be due to external forc- ing (e .g . the daily and seasonal cycles of incident irra- diance) or to more interactive changes in biological and physical characteristics of the water column, such as suspended chlorophyll a (chl a ) or turbidity. In estu- aries, variability in suspended chl a and turbidity occurs on shorter time-scales than the externally imposed daily changes in irradiance or water tempera- ture. The frequency and magnitude of the changes depend on the mechanisms that drive them, and their
O Inter-Research 1996 Resale of ful l article not permitted

246 Mar Ecol Prog Ser 145: 245-268, 1996
effect on overall rates of primary production depends on the degree to which, they Influence the co-occur- rence of chl a and light.
Turbidity in estuarine waters is determined largely by the concentration of suspended sediments (Cloern 1987). Turbidity can change with tidal frequency, either because of advection of water masses with dif- fering loads of seston (Litaker et al. 1.993) or because changes in current velocity cause alternating episodes of suspension and deposition of sediment (Cloern et al. 1989) Resuspension is also caused by wind-driven mixing (Gabrielson & Lukatelich 1985, Pejrup 1986, Demers et al. 1987, Arfi et a.1. 1993) and by boat traffi.~ (Anderson 1976, Garrad & Hey 1987). The domlnant short-term frequency with which water clarity varies may therefore be tidal or sub-tidal, depending on the relative influence of tides and winds. This variability is superimposed on the day/night cycle in determining the amount of light to which phytoplankton suspended in the water column are exposed.
Short-term variability in the amount of suspended chl a may be due to advection of patchily distributed populations, resuspension of benthic assemblages and/or changes in the balance between growth and grazing. Changes due to advection are largely driven by tides (Cloern et al. 1989, Powell et al. 1989, Litaker et al. 1993) but discrete patches of phytoplankton may coalesce or disperse when wind speeds vary (Lev- asseur et al. 1983) or when frontal zones in salinity interact with flooding and ebbing tides (Dustan & Pinckney 1989). Advection is responsible for the vari- ability in suspended chl a concentrations observed in comparatively deep (>5 m deep) estuaries, such as the St. Lawrence (Canada) (Sinclair et al. 1980) and South San Francisco Bay (California, USA) (Cloern et al. 1989, Powell et al. 1989). Resuspension of benthic microalgae has been inferred to cause much of the variability in chl a concentration in shallow estuaries (Baillie & Welsh 1980, Walker 1981, Demers et al. 1987, Shaffer & Sullivan 1988, Sullivan & Moncrieff 1988, Cloern et al. 1989, de Jonge & van Beusekom 1992, but see Litaker et al. 1993). Productivity in the water col- umn of turbid estuaries may even be dominated by resuspended benthic algae (Shaffer & Sullivan 1988, de Jonge & van Beusekom 1992). Further variability in suspended chl a on diel time-scales may be due to a change in the balance between grazing and the growth of suspended microalgae (Litaker et al. 1988, 1993). The dominant frequencies of change in chl a concentration are therefore the same as those of changes in the clarity of the water column. Both vary on shorter time-scales than the diel variability associ- ated with the dayhight cycle.
The effect of this short-term variability on productiv- ity depends on the covariance of changes in, turbidity
and microalgal biomass and on any changes in the photosynthetic responses of the microalgae. Resuspen- sion of sediment alone would cause a drop in system- level producti.vity because of the decrease in light availability. This depression can be offset where pho- tosynthetically-competent benthic algae are resus- pended in association with the sediment because an increase in algal biomass compensates for the de- crease in light availability. Covariance between short- term (hours) changes in chl a and turbidity has been shown in several studies (Demers et al. 1987, Cloern et al. 1989, Powell et al. 1989, Litaker et al. 1993). There may also be secondary effects on productivity due to changes in the photosynthetic responses of the entrained rnicroalgae. Where benthic algae differ in photosynthetic responses from the suspended popula- tion (MacIntyre & Cullen 1995), their resuspension will cause a change in th.e bulk responses of the resultant suspended population. Further variability in the photo- synthetic responses of the phytoplankton during the day may be due to endogenous diel rhythms (Harding et al. 1982) or photoinhibition (Vincent et al. 1984, Elser & Kimmel 1985, Neale & Richerson 1987).
The effect of the short-term variability in chl a, tur- bidity and photosynthesis-irradiance response on pro- ductivity depends on the degree to which changes occur in concert. Changes in one parameter may com- pensate for changes in another (e.g. the increase in chl a and turbidity due to resuspension or a reduction in the rate of photosynthesis with decreased turbidity due to photoinhibition) and the variability may have little effect on productivity. Where the parameters vary independently, though, the effects of changes may be cumulative and may exert a profound effect on pro- ductlvity. We descrlbe here temporal scales of variabil- ity in San Antonio Bay, a shallow and turbid estuary on the coast of Texas, USA. Our objectives were, first, to assess the magnitude and time-scales of variation in those parameters that determine the rate of productiv- ity (light availability and algal biomass and photosyn- thetic response), second, to determine the extent of coupling between the suspended and benthic popula- tions of microalgae, and third, to assess the effects of these interactions on system-level productivity.
METHODS
San Antonio Bay is a medium-sized bay (ca 15 X
30 km) with a freshwater inf1.0~ from the Guadalupe River in the north and some tidal exchange with the Gulf of Mexico, from which it is separated by a bar- rier island, via Espiritu Santo Bay and Cavallo Pass (Fig. 1). The water depth in the bay varies between about 1 m in the northern part, adjacent to the inlet

Maclntyre & Cullen: Suspended and benthic microalgae In a t u r b ~ d estuary 247
Fig 1 San Antonio Bay, Texas, and the 4 sites (A-D) from whlch samples were taken
from the Guadalupe, to 2.5 m in the south. The bay was sampled between November 1986 and July 1987 as part of a program designed to characterize the shallow, lagoonal bays on the southern coast of Texas.
Data from the bay are compared ~ i t h data collected from cultures of the diatom Thaldssiosira pseudonand (Clone 3H, obtained from the Center for the Culture of Marine Phytoplankton, Blgelow Laboratory, Booth- bay Harbor, ME, USA). Cultures were grown in 2 1 polycarbonate bottles in autoclaved filtered sea water (30 PSU) enriched to f/2 nutrient concentrations with. 100 PM silicate (Cuillard 1975) and 10 nM selenium (Keller et al. 1987). Cells were maintained at 20°C under nutrient-replete conditions (i.e. in log-phase growth, as determined daily from cell counts, chl a concentration and in vivo fluorescence in the absence and presence of DCMU; see below). Cultures were stirred and bubbled with air that was passed through an activated charcoal filter and a 0.2 pm pore Acrodlsc f~ltei- before entenng the culture vessels. Illum~nation of 10 to 900 pm01 m S-' was provided on a 12 h light:12 h dark cycle by cool-white fluorescent lights.
Based on a prelim~nary survey, 4 sampling sites in the bay were chosen as representative of the salinity gradient down the bay (Sites A, B and C) and the tidally-dominated influx from Esplritu Santo Bay (Site D) Sites A and C were occupied for a full day each in November. January, April and July. Site C was also occupied over a 24 h period, beginning at midday, in March and June. All 4 sites were sampled at least once, close to midday, on each sampling trip. Sampling consisted of a vertical profile of physical parameters and discrete water samples taken from the top and bot- tom of the water column. The discrete samples were analyzed for turbidity (to estimate light attenuation), chlorophyll a (chl a) concentration and in vivo fluores-
cence. Photosynthesis-irradiance (P-I) curves were measured in surface and bottom waters for all midday samples and for samples taken at daybreak and dusk at Sites A and C. The benthos was sampled for all mid- day samples for vertical profiles of chl a concentration and light attenuation. P-I curves for benthjc micro- algae were determined for the 0 to 1 and 2 to 3 mm strata in parallel to samples for the water column (i.e. for all midday samples and at dawn and dusk at Sites A and C) .
Vertical profiles of temperature, salinity (as conduc- tivity), pH and dissolved oxygen were obtained with a submersible Hydrolab sonde (Austin, TX). A vertical profile of photosynthetically available quantum scalar irradiance through the water column was measured using a submersible Biospherical Instruments, (San Diego, CA, USA) QSP-170 4rt detector with a QSR-240 4rc reference sensor. The output from the reference was integrated by a QSR-250 integrator to provide a record of daily incident radiation.
Discrete samples were taken from the surface and bottom of the water column with a 2 1 LaMotte water sampler (LaMotte Chemical, Chestertown, MA). The bottom sample was taken 20 cm above the bottom and great care was taken to avoid disturbing the benthos while sampling. Suspended chl a was measured fluoro- n~etrically using a Turner Designs (Sunnyvale, CA) 10-005R fluorometer, calibrated against chl a, after correction for degradation products by acidification (Holm-Hansen 1978). Samples were collected by filtra- tion through a Whatman GF/F filter and extracted in pre-chilled 90% acetone for 24 to 48 h at -4°C in the dark. Fluorescence in vivo was measured in the pres- ence and absence of DCMU (3-[3,4-dichlorophenyll- l, l-dimethylurea), added as a 3 mM solution in ethanol to a final concentration of 30 pM (Vincent e t al. 1984) after the sample was dark-adapted for 20 to 30 min. Data are presented as F, Chl-l. Variable fluorescence, F,, is equivalent to F,,, - Fo, where F. is fluorescence in the absence of and F,,, is fluorescence in the presence of DCMU, and is an index of the number of functional photosystem I1 (PS 11) reaction centers (Vincent et al. 1984). The dimensionless parameter F, Chl-' is the ratio of F, to the fluorescence of the equivalent chl a concen- tration in vitro when the cells are extracted in acetone (Kiefer 1973) and is a crude estimate of the proportion of functional PS 11 reaction centers.
Turbidity in the samples was measured as side-scat- ter, using a Hach (Loveland, CO, USA) 2100 Tur- bidimeter calibrated against a 10 Jackson Turbidity Unit (JTU) latex standard supplied by the manufac- turer. Samples with turbidity higher than 10 JTU were diluted with Milli-Q water before measurement. Mea- surements of turbidity were converted to a diffuse attenuation coefficient, k (m-') , using a regression of

248 Mar Ecol Prog Ser 145: 245-268. 1996
the attenuation coefficient, obtained with the Bios- pherical Instruments light meters (0.7 to 15.3 m-'), ver- sus turbidity (JTU) in the surface samples. The regres- sion is based on data collected at all sites during all sample periods except March.
k = 0.14 . Turbidity + 0.71 (R2 = 0.94, n = 89) (1)
Symbols and abbreviations used in this paper are summarized in Table 1. Application of Eq. (1) requires the assumption of a constant relationship between absorption and scattering in the suspended material (Kirk 1985). The variable contribution to absorption of the phytoplankton, which ranged between 4 and 4 8 mg chl a m-", was small in comparison to the scat- tering by inorganic pa.rticulates, and the relationship In Eq. (1) agrees well with that published by Walmsley et al. (1980). Conversion of turbidity to an attenuation
coefficient allowed estimation of the light attenuation through the water column where it was not well-mixed and for samples taken in March, when the llght meter was unavailable. For consistency, all values of k used to determine productivity are those calculated from
Eq. (1).
Mean irradiance in the water column, I,,., was calcu- lated according to Neale et al. (1991.):
where I. is incident irradiance and z,, is the depth of the water column.
A scuba diver sampled the benthos in a 0.5 X 0.5 m grid, using acrylic cores (25 mm inner diameter). Twelve cores were taken for each midday sample: 4 for determination of pigment profiles, 4 for determination of light attenuation in the sediment, and 4 for measure- ment of P-I curves. The sediment was extruded from the core using a micromanipulator (Joint et al. 1982) and sectioned in 1 mm slices. Chl a concentration was determined as for the suspended samples, except that the sedi.ment was added directly to 90% acetone (cf. Phinney & Yentsch 1985) and the samples were cen- trifuged for 5 min at 4000 X g and diluted before read- ing in the flu.orometer. The attenuation coefficient in the sediment was estimated by measuring the trans- mission of spectral irradiance through the upper milli- meter of sediment suspended and resettled over the
Table 1. Symbols, terms and abbreviations used in the text
Symbol Definition Units
, y h l
B21 p'h l
Chl D
Initial slope of the P- lcurve Composite parameter estimating n,, ,,,. = Chl X z,, X I,,, Photoinhibition parameter of the P - I curve Chlorophyll a concentration Length of the photoperiod Dark-adapted fluorescence 1n vivo in the absence of DCMU Dark-adapted fl .uor~sccnce in vlvo In the presence of UCMU Variablc flu.orescence, = l ' - F,, Ratio of F, to fluorescence of equ~valent chl a concentration in vitro Mean irradiance in the water column Mean incident irradiance over the course of a day Total incident irradiance over the course of a day Saturation parameter ot the P - I curve. = P',h'/nrh' Incident irradiance a t noon Incident irradiance Irradiance at depth z Diffrlse attenuation cn~fficirnt Composite parameter in Eq. 9, = P:' X Chl/k Photosynthesis versus irradiance Light-saturated rate of chlorophyll-specific photosynthesis Areal productivity a t time t Areal productivity a t irradiance I , and time t Daily areal productivity calculated by interpolation of H,,, Areal productivity at noon Daily areal productivity calculated by extrapolation of n,,,, Expected within-day coefficient of variation in M Observed wi.thin-day coefficient of variation in IM Depth of the euphotic zone, = 4.6/-k Depth of the water co1um.n Rat10 of z,,, to z,,,
chl a)-' (pmol photons)-' m' -' mol photons m-' d-' chl d)-l (pmol photons)-' m' 3
h Arbitrary units Arbitrary units Dimensionless Dimensionless pm01 m-2 S - '
pm01 m ' S - '
m01 m-= d.' 11mol m-? S - '
pm01 m-? S
pm01 m-' S - '
pmol m-' S- '
m-' or mm-l g C m ~ ' h- '
g C (g chl a) - ' h-' mg C m-' h- ' mg C m-? h-' g C m-' d - ' mg C m-' h-' g C m-l d.' Dimensionless Dimenslonless m m Dimensionless
Maclntyre & Cullen: Suspended and benth~c mlcroalgae in a t u r b ~ d estuary
sensor of an lSCO Model SR spectroradiometer (Mac- Intyre & Cullen 1995). Measurements were taken at 50 nm intervals between 400 and 750 nm and averaged to give a mean coefficient.
P-I curves for both the water column and benthos were determined from I4C-bicarbonate uptake in a 'photosynthetron' (Lewis & Smith 1983), as described by MacIntyre & Cullen (1995). Benthic samples were resuspended in GF/F-filtered water from the sample site. Light in the incubator was provided by 4 General Electric ENH projection lamps and filtered through successive 2.5 cm filters of water and 10 mg 1-' copper sulfate solution. Irradiances were measured with the QSP-170 4n sensor. The P-I curve was constructed by fitting the data to the equation of Platt et al. (1980):
pc'' _ .[l - exp(F)]. prhl
exp (-pc:' p prhl ] + p L h ~ (3)
where Pchl is the rate of photosynthesis, normalized to chl a [g C (g chl a)-' h-'] at irradiance I (pm01 photons m-2 S-'); [g C (g chl a)-' h-'] is the maximum rate of photosynthesis in the absence of photoinhibition; a'!" [g C (g chl a)-' (pm01 photons)-' m'] is the initial slope of the P-I curve, and Pchl [ g C (g chl a)- ' (pm01 photons)-' m2] is a parameter describing the reduction in photosynthesis a t high irradiance. PGh'[g C (g chl a ) ' h-'] is an intercept term, subtracted from P'"' so that modeled photosynthesis in the dark is always zero. Parameters were fit simultaneously using the multi- variate secant method (Ralston & J'ennrich 1978) of the NLIN procedure of SAS (SAS Institute Inc., Cary, NC). The light-saturated rate of photosynthesis, P$' [g C (g chl a)- ' h-'], was calculated as
The error of P$' was calculated as descl-ibed by Davis (1986), according to principles described by Ziinmer- man et al. (1987). The degree to which photosynthesis declines at high irradiance was described by the index P:,?/P:I'! the ratio of the realized light-saturated rate of photosynthesis to the maximum rate that would be obtained in the absence of photoinhibition. The fall-off in photosynthesis becomes less pronounced, and the P-I curve flatter, as the ratio tends to unity.
Productivity in the water column was calculated by integrating photosynthetic rates over depth and time. Photosynthesis at depth z, P(z) (mg C m-3 h-l), was cal- culated from the vertical profile of light intensity, the chl a concentration (Chl) and the P - l curve:
where irradiance at depth z is
I(z) = I,, . exp(-k . z ) (6)
Two profiles of P(z) were constructed for each set of samples, one using the parameter values (i.e. k, Chl and P- l parameters) determined on the surface sample and the second using the parameters from the bottom sample. To account for the vertical variation in k, Chl and P-I parameters, a third profile was constructed from the depth-weighted averages of these 2 estimates of photosynthesis (cf Cullen et al. 1992). The resultant profile was integrated over depth to give area1 produc- tivity, n(t) (mg C m-' h-'):
n(t) = '$'P(Z) n l (7) 7-0
where Az is 0.01 m. The limit with respect to depth ( z =
z,) was the depth of the water column. Where a site was occupied for a day, a vertical profile
of productivity was determined for each pair of sam- ples (surface and bottom) taken from the water col- umn. Paired samples were taken every 1 to 2 h for chl a concentrations and light attenuation coefficients, but P-I curves were measured only at dawn, midday and dusk. The photosynthetic parameters were interpo- lated linearly between daybreak and midday or mid- day and dusk values for the remaining samples. Daily productivity, n,,,, (g C m-' d. l ) , was calculated by inte- gration of successive values of n ( t ) from sunrise ( t = 0) to sunset ( t = day length, D):
where At is 1 to 2 h, the interval between successive samples.
Productivity in the benthos was calculated from the light intensity incident on the sediment and the attenuation coefficient, chl a concentration and P-I pal-ameters measured in the upper millimeter of ben- thos using Eqs. (5) to (8). (Only 0.01 to O.1'X of light incident on the sediment was transmitted through the surficial millimeter.) Daily productivity was calcu- lated by integrating these vertical profiles with respect to depth and time, as for the water column, except that Az (Eq. 6) was 0.05 mm. The technique used to measwe light attenuation through the sedi- ment is insensitive to backscatter, which can Increase light intensities in sandy sediment by 100% (Kiihl & J~lrgensen 1994). However, the sediment at the 4 sites studied was fine, reducing the magnitude of the error due to backscatter, and rates of production in the benthos were very low in comparison to those in the water column (see 'Results'). The error in esti- mating overall productivity at each site should be small.

250 Mar Ecol Prog Ser 145: 245-268, 1996
A B C D
Site
Nov. '86
Jan. '87
Mar. '87
Jun. '87
Jul. '87
Fly. 2. Variation in the midday values of water temperature (T) , the attenuation coefficient ( k ) , chl a concentration (Chl), photosynthetic capaclty (P',:' ) and areal productivily (H,,,) in the water column by site and by month. Data are the mean of surface and bottom samples: error bars are the range of
values
RESULTS
Month-to-month variability in the water column
Freshwater inflow into San Antonio Bay from the Guadalupe River was 0.6 to 2.3 X 10⁶ m ' d-' during most of the study, but rose during June and July to a peak of 7.6 X l o b 3 d-' (Whitledge 1989). resulting in a drop in salinity throughout the bay in June and July. There was concomitant warmlng, with water tempera- tures of 26 to 33°C in June and July, as compared to 12 to 19°C in the previous months (Fig 2). Inorganic nutri- ent concentrations in the water column were high throughout the sampling period, ranging between 10 and 80 p M nitrate, 0.2 and 40 ph4 ammonium, 0.5 and. 16 mM phosphate and 80 and 210 pM silicate (Whitledge 1989). There was a gradient of increasing salinity from north to south and from west to east dur- ing the 6 sample periods, suggesting that circulation in the bay was counterclockwise.
The parameters that determine primary productivity, the transparency of the water column and the abun- dance and photosynthetic response of the suspended rnicroa.lgae, showed the high variability characteristic of estuarine waters (Fig. 2). Attenuation coefficients, k, were high (0.7 to 15.3 m-', see 'Discussion' for a com- parison with other studies). The highest value corre- sponds to a 1 % light level at 0.3 m. The overall mean, measured at all sites during all sampling periods, was 4.2 m-' (SD = 2.7 m-', n = 213). Chl a concentrations varied by an order of magnitude (4 to 48 my m-3) over the sampling period and were comparable with other studies (see 'Discussion'). Light-saturated rates of pho- tosynthesis, P;:', were 3.0 to 22.9 g C (g chl a)-' h-' and mldday areal productivi.ty, n,,,,, ranged from 14 to 309 mg C m-' h-'
The attenuation coefficients were lowest in Novem- ber (0.7 to 1.6 m-'), when the water column was strati- fled. Otherwi.se, there was no clear temporaI or spatial. pattern in the midday m.easurements of attenuation at the 4 sites (Fig. 2). Chl a concentrations were highest in March at Site C, in April at Sites B and D, and in July at Site A. They were generally higher at Sites C and D than at A , with intermediate concentrations at Site B. There was no consistent difference in Pc' between the sites. The highest rates were measured in June and July, although rates were also high at Sites B, C and D in March. There were no consistent temporal trends in R,,,,, but productivity was generally higher at Sites C and D than at Site A , with Site B being intermediate between them.
Correlation analysis of the physical and biological parameters measured in the water column show that variation in any one factor could explain no more th.an 49%) of the variability in another, when measured on

Maclntyre & Cullen: Suspended and benthic microalgae in a turbid estuary 251
Table 2. Pearson correlation coefficients for multiple correlations of midday incident irradiance (I,), mean irradiance in the water column (l,,,.), water temperature (T) and salinity (S), chl a concentration (Chl), diffuse attenuation coefficient (k ) , light-saturated and light-limited rates of photosynthesis (P:!;' and uchl) and areal productivity (n,,,,) in the water coluinn Surface and bottom lneasurements were averaged in correlations with n,,,,,,,,, otherwise they are treated independently (n = 24 or 48) . ' p < 0.05.
"p c 0.01. "'p < 0.001
L v 7 S Chl k
fo 0.346 0.224 0.114 0.088 0.107 I , , 0.031 0 289 0 198 -0.700"' - T 0.258' 0.069 0.234 ' S 0.145 0.485"' Chl 0.119 k pr-hl
I1
arhl
these temporal and spatial scales (Table 2). The diffuse attenuation coefficient, k, was significantly correlated (p < 0.05) with both temperature and salinity. Microal- gal abundance, measured as chl a concentration, was not significantly correlated with any of the physical parameters, including nutrient concentrations (data not shown). Light-limited photosynthetic rates, a'"', were correlated with light-saturated rates, P::', and inversely correlated with the mean irradiance in the water column. In contrast, P::' was correlated with temperature, salinity, incident irradiance and the attenuation coefficient and negatively correlated with the mean irradiance in the water column. Area1 pro- ductivity was correlated both with the parameters that determine the light environment (incident irradiance and attenuation in the water column) and with the abundance and photosynthetic response of the microalgae.
and Site C in January, April, June and July), fluctua- tions in attenuation over the course of a single day were almost as great as the range of the entire dataset. There was no consistent pattern of die1 variation in the light-limited and light-saturated rates of photosynthe- sis, uch' and P::'. There was a progressive dec1in.e in pc111 ,, during the day as often as there was a midday peak. The index of functional PS I1 reaction centers, F, Chl-l, showed either a minimum at midday or a pro- gresslve decllne through the day at all sites, except at Site C in June and July. Production was restricted to the upper water column by high turbidity at Site A in January and April and at Site C in January, June and July. There were subsurface maxima in modeled pro- ductivity for part of the day at Site A in November, Jan- uary and April and at Site C in November, March and April.
Between-day variability in the water column Within-day variability in the water column
The within-day variation of surface and bottom chl a concentrations, attenuation coefficients, 111 vivo fluo- rescence and photosynthetic parameters at Sites A and C is shown in Figs. 3 & 4. The water column at both sites was strongly stratified in November and showed tidally-driven vertical gradients in salinity at Site C in the remaining months. Neither vertical gradients nor temporal patterns were detectable in profiles of salin- ity at Site A in January, April and July. Salinities were lower at Site A than at Site C, consistent with Site A's proximity to the Guadalupe River (Fig 1).
Both chl a and the attenuation coefficient showed marked variations over the course of a day: coefficients of variation (standard deviatiodmean, expressed as a percentage) were 16 to 52 O/o for chl a and 14 to 75 % for the attenuation coefficient. In 5 cases (at Site A in April
Midday samples were taken at Site C on 2 or 3 suc- cessive days in March, June and July to examine between-day variability (Fig 5). In the first of the 3 cases shown (March 4 and 5), there was very little change in chl a concentration or attenuation and a 25% decrease in both P',:' and urh'. This yields a dif- ference in maxiinal areal productivity (productivity In full sunlight) of about 13 %. In the second case (June 3 and 4), a 27% drop in P$' and 48% drop in ach' was more than compensated for by a 55 O/o increase in light penetration. Maximum areal productivity rate rose by 52'5,. In the third case (July 15 to 17), PC,;' rose by 57 % and a'"' rose by 64 '% in the first 24 h, but attenu- ation rose by 200(?io. Maximal areal productivity fell by 44%. During the next 24 h , P$" rose slightly to 164 % of the initial value while aCh' fell to 67 % of the initial value and attenuation rose by a further 15%.

Mar Ecol Prog Ser 145. 245-268, 1996
6 12 18 6 12 18 6 12 18 6 12 18 11 17 23 5 11 17
Time (h)
Flg 3 Varlatlon In chl a concentration ( C h l ) , the attenuation coeliiclent (k), chlorophyll-spec~flc vanable fluorescence (F, Chl ' 1 . the I~ght-saturated and llght-llmlted rates of photosynthesis (pc,hland a"') and the saturation parameter of the P-[response (I ,) at the surface (a) and bottom (0 ) of the water column Samples were taken dunng 5 d (November 1986 and January and March 1987) at S ~ t e s A and C In San Antomo Bay Mean i r rad~ance In the water column (I,,, W ) 1s shown wlth lk See table 1 for unlts Coefflc~ents of vanance (X) for each parameter are glven in each panel For depth, the upper row of contour plots are of sallnlty
(PSU) and the lower row are of productlv~ty. P(z ) , (mg C m h ')
Maximal area1 productivity fell to 79% of the value on the previous day and 44 % of the value on the first day. The between-day variations in productivity were almost as large as those observed between sites in a given month or between months at a single site (Fig. 2) . Changes in the P-I response (i.e. P:!; and U ' " )
occurred in parallel with changes in the fluorescence parameter F, Chl ' and in opposition to changes in the mean irradiance in the water column (Fig 5).
Photosynthetic responses of the suspended microalgae
The photosynthetic responses of the suspended microalgae varied with sampling time, irradiance and temperature. Die1 variability was examined by com- paring data from Sites A and C where P-l parameters were measured over the course of a day. Data were standardized to the within-day mean to obviate vari-

MacIntyre & Cullen: Suspended and ben th~c m~croalgae In a turbid estuary
6 12 18 6 12 18 11 17 23 5 11 6 12 18 6 12 18
Time (h)
Fig. 4. As for Fig. 3 but for samples taken In Apnl , June and July 1987
ability that occurs on longer time-scales. Standardized values of P$' varied significantly (p < 0.001, ANOVA) over a day, when grouped by sample period (Fig. 6A). There was no significant difference between samples taken at dawn and other times. Samples taken at dusk were lower than those taken at midday (p < 0.05, Sheffe's a posteriori comparison). Variability was com- parable in range but less coherent than that in nutri- ent-replete cultures of the diatom Thalassiosira pseudonana grown on a 12 h light:12 h dark cycle (Fig. 6C). There was no significant difference between standardized values of ach' in the natural assemblage. Standardized values of F, Chl-' varied significantly over the day (p < 0.001) but the pattern differed from
that in P%' (Fig. 6B). Standardized values were highest at dawn and lowest at midday. There was some re- covery by dusk but dusk values were still lower than those at dawn. In contrast, standardized values of F,,Chl-' in the cultures of 1 pseudonana showed a peak in the mid-morning, coincident with the peak in P c ' (Fig. GD), and were lowest at dusk. The P-I curves of the natural assemblage were also flatter than those of T. pseudonana, showing less of a reduction in photo- synthesis at high irradiance, as measured by the index PF/PZh' (p < 0.01, Kruskal-Wallace ANOVA). The ratio averaged 0.93 (SD = 0.09, n = 96) in the natural assem- blage, as compared to 0.86 (SD = 0.11, n = 75) in T pseudonana.
254 Mar Ecol Prog Ser 145: 245-268, 1996
at Site C) were both occasions on which the mean irradiance in the water column was lower than Ik, the saturation para- meter of the P-I curve (Fig. 4) , and on which the initial values of F\ Chl-' were low. There was a hysteresis in the trend between morning and afternoon values such that afternoon values of F, Chl-l were lower than the morning values in 5 of the 7 cases where the comparison could be made (Site A in all months and Site C in November, January and April). Because Site C was occupied from noon to noon in March and June, the after- noon values precede the morning values and cannot be used to assess any recov- ery.
To avoid differences due to die1 vari- Day ability, the effects of irradiance and tem-
perature on Pc 'were examined on sam- ples taken at midday at all sites. Midday values of P$'], which were measured within an hour of local noon, were com- parable to or higher than those of Thalas- siosira pseudonana grown on the 12 h light.12 h dark cycle and sampled 3, 6 and
?J E 45
30- culture varied with the log of irradiance (p < 0.001, R2 = 0.82), P%' in the sus- pended assemblage varied inversely with the log of mean irradiance in the water column, I,,, (p < 0.05, R2 = 0.18). The mean irradian.ce and water temperature were not correlated, but the variation of Pc,hl with mean irradiance was corrected
o 1000 2000 o 10iO ' 2000 for temperature effects by regressing I (pm01 m-2 S-') 1, (pm01 m-2 B') log(P$') on temperature (Fig. 8C). There
was a break in the distribution of data be- Fig. 5. Variation in midday measurements of chl a concentration (Chl), the cause of a rise in water temperature of attenuation coefficient (k), variable fluorescence (F,.Chl-'), the mean irradl- ance in the water column (l,,), the P-I response and potent~al areal productlv-
7°C between the March and June sam-
ity (n,,,,) in the water column at Site C over 2 or 3 consecutive days. Error bars pling trips (Fig. 2 ) . The was are the ranqe of surface and bottom values. Potential areal productivity is significant (p < 0.001, R 2 = 0.46) and the shown as a function of incident ~rradiance to allow companson between days slope, 0.025, yielded a Qlo value of 1.8, where irradiance differed. Data were collected on March 4 and 5, June 3 and The effect of irradiance on PE', inde- 4 and July 1.5 to 17, 1987. Italicized numbers on plots of P versus I and n,,,, ver-
sus I. refer to the day on which data were collected pendent of the effect of temperature, was determined by examining the resid- ual variation in P$" (i.e. the observed
The decline in F, Chl-l observed when Sites A and C value less the value predicted from the relationship of were occupied for a day was significantly correlated Pc:' with temperature). The temperature-insensitive with the mean irradiance in the water column (p < (i.e. residual) variation was significantly correlated 0.05) in 8 of the 10 sets of observations (Fig 7). The with I,, (p < 0.01, R2 = 0.18). Removing the effect of intercepts and slopes differed between sites and temperature did not change the nature of the relation- between months. The 2 sets of observations in which ship, which was still an inverse trend, nor did it F, Chl-' was not significantly correlated (June and July improve the amount of variability in P:' explained by
- - __C----
9 h after the beginning of the light period (Fig. 8A. B). However, while P$" in the

Maclntyre & Cullen: Suspended and benthic microalgae in a turbid estuary
I,,, (Fig. 8D). The mean irradiance is determined from the transparency of the water column and incident irradiance (Eq 2), either of which could be responsible for the relationship between P',hl and I,,,. There was no significant relationship between the temperature- insensitive variation in P$' and incident irradiance at the time of sampling (midday). Rather, the tempera- ture-insensitive variation was correlated wlth a n index of the transparency of the water column, z,.,, :~,,,, which is the ratio of the depth of the photic zone to the depth of the mixed layer, in thls case taken to be the depth of the water column ( p < 0.05, R2 = 0.16). The relationship was f i t to a simple exponential and the threshold value of z,,,:~,,, 2.2, above which P::' converges on the value at equilibrium, was determined by curve-fitting (Fig. 8E). Those data in the regression in which z,,, :~, was greater than 2.2 were for samples taken at all sites in November and at Site B in March, in each of which the water column was stratified and relatively clear. Last, there was a significant relationship between the temperature-insensitive variation in P:!' and F, Chl-l, the index that describes the proportion of functional PS I1 reaction centers (p < 0.05, R2 = 0.12). The trend was positive, so that P',!'increased as F,, Chl-l rose (Fig. 8F) There was no significant relationship between the midday values of F,Chl-' and either the mean irradi- ance in the water column or with z,,,:~.,,, although within-day variability in F,, Chl-' was inversely corre- lated with the mean irradiance in the water column in 8 of 10 sets of observations (Fig. 7).
Abundance and photosynthetic responses of the microphytobenthos
The benthic microalgae were abundant and photo- synthetically competent, although peak irradiances at the surface of the sediment were very low for all sain- ple periods except November (c150 pm01 m-' S-' In 19
Time (h)
Fig. 6 . Dawn-to-dusk variability in standardized values (1.e. normalized to the daily mean) of photosynthetic parameters. S tandard~zed values of (A) and (B) Fv Chl-' in San Antonio Bay. Standardized values of (C) P$' and (D) F,, Chl-l in Tha- lassiosira pseudonana. Data for San Antonio Bay (m) were col- lected at Sites A and C when the site was occupied for a full day. Data for the dlatom T pseudonana (0) are from cultures grown on a 12 h llght:12 h dark cycle at 8 irradiances between 10 and 900 pm01 m-' S-'. For each period, samples that a r e not significantly different (p c 0.05, l -way ANOVA) a re marked
with the same letter
Fig. 7. Variation In thcs fluores- 0.24
cence parameter F, C111-I with mean irradiance in the water m + * column, I,,,, during 10 day- 0.12 o long observations at Slte A (0. 0
U ) and Site C (0 , W). Data are 0.06 for mornings (0, 0) and after- 7 - noons I n . in (A) Novenlber, '0 400 800 1200 1600 0 200 400 600 800 0 200 400 600 800 (B) January, (C) March (Slte C 0
only), (D) April. (E) June (Site C only), and (F) July. The val- ues of F, Chl-' taken in the morning varied sign~flcantly with I,, (p < 0.05) in 8 of the 10
0.06 :4 "Q:
observations. There was no significant relationship at Site
C in June or July '0 300 600 900 1200 0 150 300 450 600 0 300 600 900 1200 lav (pm01 m-2 S-l)

Mar Ecol Prog Ser 145: 245-268, 1996
Fig. 8. Variation in the llght-saturated rate of photosynthesis, P?', in samples taken at midday in San Antonio Bay and In cultures of the diatom Thalassiosira pseudonana. Cultures were grown on a 12 h light:12 h dark and were sampled 3, 6 and 9 h into the light period. Regression fits are shown on each panel. Linear fits were by Bartlett's Type I1 regression. (A) 5:' versus mean irra- diance in the water column, I,,, in San Antonio Bay. p',hl= 23.0 - 5.41og(I,,,) (p < 0.05, R' = 0.18). (B) F,hl versus growth irrad~ance in cultures of T. pseudonana. Pi:' = -5.2 + 5.310g(la.) (p < 0.001, R' = 0.82). (C) P$' versus temperature in the water column in San Antonio Bay (data for 7 pseudonana (0) are shown for comparison) log(P$") = 0.42 + 0.025 X Temp. (p < 0.001, R2 = 0.46). (D) Tern- perature-insensitive variation in PC,hlversus I,, in San Antonio Bay. Temperature insensitive variation = 11.1 - 4.41og(I,,,) (p < 0.01, R' = 0.18). Temperature-insensitive variation is (observed - expected), where the expected value js calculated from temperature using the regression in (C). (E) Temperature-insensitive variation in PC,!' versus z,,:~,, in San Antonio Bay, where z,,:z, is the ratio of the depth of the euphotic zone to the depth of the water column. Temperature-~nsens~tive variation = 8.3exp(-2.2 X z,;~,,,) - 1.2 (p < 0.05, R' = 0.16). (F) Temperature-insens~tlve variation in P$' versus chlorophyll-specific variable fluorescence in vivo,
F,, Chl-' , In San Antonio Bay. Temperature-~nsensitive variation = -2.6 + 21 0 X F, Chl-' (p < 0.05, R' = 0 12)
of 24 cases). Chl a concentrations in the upper 1 to 10 mm of sediment were low in comparison with other studies (see 'Discussion'). Even so, concentrations in the surficial millimeter (0.5 to 7.8 g m-3) were 40 to 870 times higher (per unit volume) than those in the over- lying water In 12 of the 24 comparisons, the upper 10 mm of the sediment contained as much chl a as the entire overlying water column (Fig. 9) There was no relationship between benthic chl a concentratton and the irradiance at the sediment-water interface at the time of sampling. Instead, the abundance of benthic chl a had the same spatial and temporal patterns as the concentration in the water column. The vertical distri- bution within the sediment varied between sites and sample dates but concentrations at the surface of the benthos were higher than those at 10 mm in 17 of the 24 profiles (Fig. 9).
Although chl a concentrations at 0 to 1 mm in the sediment differed from those at 2 to 3 mm in only 6 of 24 profiles, the photosynthetic responses were consis- tently different, with lower values of both P$] and ach' in the 2 to 3 mm layer. Mean irradiances in the 0 to 1 mm layer were low (<l to 65 pm01 m-2 S-' at midday) because of the low irradiance incident on the sediment surface and the very rapid attenuation in the sediment itself (attenuation coefficients of 4.8 to 7.9 mm-'). The 2 to 3 mm layer was under aphotic conditions at all
times. There was no significant die1 variation in stan- dardized values of P$' and ach' in the benthic micro- algae. As with the suspended assemblage, there was a significant relationship between P$' at midday and water temperature (p c 0.05, R2 = 0.30; Fig. 10A) The slope was not significantly different (p c 0.05) from the trend for the suspended assemblage but the intercept was lower. In both layers of sediment, Pc$' was highly correlated (p < 0.001) with P$' in the suspended microalgae (Flg. 10B). The trend and the degree of correlation were both higher for the 0 to 1 mm layer than the 2 to 3 mm layer (R2 = 0.62 vs R2 = 0.50). Because P$" in both assemblages was correlated with temperature, this relationship might be due to the effect of temperature on each population. When the temperature-insensitive variations in Pg' were calcu- lated for both the 0 to 1 mm and 2 to 3 mm layers, they were significantly correlated with the temperature- insensitive var~ation in P$] in the suspended microal- yae (p < 0.001, R' = 0.44 for 0 to 1 mm, R2 = 0.42 for 2 to 3 mm; Fig. 10C). Covanation of p g l i n both the benthic and suspended assemblages was therefore not due simply to both varying with temperature.
Productivity in the benthos was restricted to the sur- ficial millimeter and was low (<0.1 to 11.2 mg C m-2 h :J, on average only 1.6% of productivity in the water column, although the benthic microalgae were abun-

~Maclntyre & Cullen: Suspended and benthic m~croalgae In a turbld estuary 257
p pp pp
p
Chl (mg m-2)
Nov Jan Mar A P ~ Jun Jul Fig. 9. Profiles of benthic chl a in the upper 10 mm of sediment by site and date. Error bars are SE of 4 replicates. Data are pre- sented as mg chl m-': this is equivalent to g chl m-3 for each millimeter-thick stratum of sediment. Italicized numbers in each panel give the chl a content of the overlying 1.25 to 2 m deep water column (mg chl m-') and vertical bars (where present) indi- cate the depth of sediment containing an equivalent quantity. Where no bar is shown, the overlying water contained more chl a
than the upper 10 mm of sediment
dant and photosynthetically competent. The technique (Figs. 3 & 4 ) on productivity depends on the magni- used to measure attenuat~on in the sediment likely tude and coherence of the changes. This can be illus- causes an underestimate of benthic productivity (Kiihl trated by a simple approximation to Eqs. (5) to (7) pro- & J ~ r g e n s e n 1994), but the contribution of the benthos posed by Talling (1957), as re-stated by Platt et al. in situ to overall productivity was nonetheless very (1990): small
Within-day variability and covariation of parameters where 1, is the saturation parameter of the P-I curve, equivalent to P:,yl/crch'. Eq. (9) allo\vs variability in pro-
Productivity in the water colun~n is determined by ductivity to be partitioned loosely between changes in irradiance and the abundance and P-I responses of the abundance and photosynthetic response of the sus- the suspended microalgae. The effect of short-term pended microalgae and the clarity of the water column variability in attenuation, chl a and P-I parameters ( P $ ' x Chllk) and changes imposed externally by the
Mar Ecol Prog Ser 145: 245-268, 1996
Temperature ("C) - 15 - c 1 -
b 10 f;
5 m 0
cn
'0 5 10 15 20 25 Suspended P:'
- c u E
(g C [g Chll-1 h-') a, 'olc' ' ' ' . I c L . -
Susp. T-l Var. in PC,"' (g C [g Chll-1 h-')
Fig. 10. Variation in P',!' in samples taken from the 0 to 1 (a) and 2 to 3 mm (0) layers of sediment. Bartlett's Type I1 regres- slon f ~ t s are shown on each panel. (A) P$'versus temperature in the water column. The fit is for data for the 0 to 1 and 2 to 3 mmlayers taken at all sites at midday. log(^:') = 0.03 + 0.026 X
Temp (p < 0.05, R' = 0.30). (B) P$' in the benthos versus P z ' i n samples from the surface of the water column. Samples were taken at all sites at dawn, midday and dusk. 0 to 1 mm (solid h e ) : benthlc P$"= 0.3 t 0.49 X Suspended P$'(p < 0.001, RZ = 0.62). 2 to 3 mm (broken line): benthic P$' = 0.4 + 0.39 X
Suspended P',h'(p < 0.001, R' = 0.50). (C) Temperature-insensi- tive variation in P?' in the benthos versus ttmperature-insen- sitive variation In ~ ' ,h ' in samples from the surface of the, water column. Temperature-insens~t~ve variation IS (observed - ex- pected), where the expected value is calculated from tempera- ture using the regression in (A) for the benthos and the regres- sion from Fig. 8C for the suspended a ~ s ~ m h l a g n O to 1 mm (solid line): benthic temperature-i.nsensitlve vanatlon - 1.0 + 0.39 xsuspended temperature-insensitive variation (p < 0.001, R2 = 0.44). 2 to 3 mm (broken line): benthic temperature-insen- sitive variation = 0.2 + 0.37 X suspended temperature-insensi-
tive variation (p < 0.001, R2 = 0.42)
availability of light ( l o / l k ) . This makes the simplifying assumption that variability in P-I response does not result in a change in Ik. Although P$' and ach' are cor- related, the relationship is not linear, so that Ik varies with P,$' over much of its range. Changes in Ik were small compared to changes in I. (Figs. 3 & 4 ) so, as a
first approximation, the effects of short-term variability In the biological and physical characteristics of the water column on productivity can be considered in terms of changes in chl a, attenuation and P::'.
Inspection of E q . (9) shows that if resuspension were the driving force b e h ~ n d variability, then the coher- ence in chl a, attenuation and P$' would at least par- tially compensate for the others' effects on n(t): resus- pension of the benthos would result in an increase in attenuation that would offset the lncrease in chl a and the increase in biomass would also be offset by a decrease in P$' (Fig. 10) . Alternately, if advection were the driving force behind short-term variability, changes in attenuation and chl a could be de-coupled and the effect of their variability on n(t) might be additive.
The data collected at Sites A and C are inadequate for cross-spectral analysis and P::' was measured only 3 times a day, while chl a and attenuation were mea- sured at hourly to 2 h intervals. Possible covariation between these parameters was therefore examined using 2 simple comparisons. Covariation of chl a, attenuation and salinity was examined using simple correlation coefficients (Table 3). Salinity is used as a conservative property indicative of different water masses. Changes in salinity were below the threshold of detection in 3 of 4 sets of observations at Site A. Examination of the correlation coefficients shotvs that there is a significant (p < 0.05) positive relationship between chl a and attenuation in only 2 of 12 cases and a significant negative correlation in 1. In contrast. there was a significant correlation between chl a and sa1ini.t~ in 3 of 9 cases and a significant correlation between attenuation and salinity in 4 . The opposed correlation of chl a and attenuation with salinity in 2 cases and the negative correlation of chl a with attenuation in 1 case suggests that advection is responsible for some of the variation observed. Equally, the positive correlation of chl a with attenua- tion in 2 cases and the covariation of chl a and atten- uation with salinity in a third are consistent with resuspension.
A second test for covariation in the biological and physical parameters that determine productivity is based on the relationship of productivity to P$', chl a and the attenuation coefficient (Eq. 9). The value of a composite parameter, M, can be calculated for each of the 10 samples series on which all 3 parameters were measured over the course of a day:
P$' . C h l M =
The observed coefficient of vanation in IV, CV,,,,, can be compared to a n expected coefficient of varia- tion, CV,,,, calculated on the assumption that there is

Maclntyre & Cullen Suspended and benthic ruicroalgae in a turbld estuary 259
no covariation between its 3 con- stituent parameters. If CVobs and CV,,,, are significantly different, then there must be some covari.ation in the observed changes in P:,:', chl a and attenuation. The observed coefficient of variation can be calculated as
where U,,., is the standard deviation and X h l is the mean of the calculated values of M. There are 6 values per day for 8 of the observations (surface and bottom samples taken at dawn, midday and dusk) and 8 for the remaining 2 (surface and bottom sam- ples taken at midday, dusk, dawn and midday).
Each value of CV,,, is compared with a value, CV,,,, that is calculated on the assumption that there is no covariation in P:,:', chl a and attenua- tion:
Table 3. Pearson correlation coefficients for multiple correlations of daily varia- tions in chl a concentration [Chl), atlenuation coefficient (k) and salinity (S). Cor- relation coeff~clents of chl a and attenuation wlth salinity are oln~tteti for Site A in Janual-\., Apl-11 and July because the range of salinities observed was less than the sensitivity of the conductivity probe Data for surface and bottom water are combined except for data collected in November, where there was a surface to bottom difference in salinity of 6 to 9 PSU at both sites. n is number of
observations. ' p < 0.05. " p < 0.01, "'p < 0 001
Site Month S vs Chl S vs k Chl vs k l A Surface Nov
Bottom Nov Jan A P ~ Jul
C Surface No\. Bottom Nov
Jan Mar APr Jun J ul
where ofi and M are an aggregate standard deviation and mean derived from the means and standard de- viations in P:,:', chl a and attenuation within each sam- ple series. For each day, the aggregate mean value, M, is
x,!:l ' Fchl = -- - (13) X k
The aggregate standard deviation, OM, can be derived from the mean and variance of each of the 3 parame- ters, P::!:, Chl and k, and 3 average cross-terms that descri.be covariat~on in each pair (Bevington 1969):
where o is the standard deviation and F the mean value of each parameter. If changes in P$'', Chl and k are independent of each other, the cross-terms tend to zero and Eq. (14) reduces to
Substituting Eqs. (13) and (15) into E q . (12), the expected coefficient of variation is therefore
Values of CV,,, and CV,,, were calculated for each of the 10 day-long observations. The observed coeffi- cients of variation were significantly lower than the coefficients of variation expected on the basis of inde- pendent changes In P::', chl a and attenuation (p < 0.001, paired t-test; Fig. l l ) , indicating that changes in the constituent parameters of M were compensatory. The lower-than-expected variation indicates that covariation between PC,:' and attenuation or between chl a and attenuation outweighed covariation between P:;' and chl a (see Eq. 14).
Estimates of daily productivity
Daily area1 productivity, n,,,,, was calculated by integrating between estimates of n(t) (Eq. 8) from dawn to dusk in 8 cases and from noon to noon in 2 oth- ers. Estimates of daily productivity were 0.13 to 2.47 g C m-' d-' in the water column and <0.001 to 0.09 g C m-' d-' in the benthos Daily productivity in the ben- thos averaged 1.6 % of that in the water column. There was a significant relationship (p < 0.05) between daily productivity and the composite parameter BZI (Cole & Cloern 1984), which is the product of the chl a concen- tration (Chl), the depth of the euphotic zone (z,,), and

260 Mar Ecol Prog Ser 145: 245-268, 1996
Fig. 11. Observed within-day variation in the composite para- meter M (= P',:' X Chl/k), CVob,, versus the variation expected on the assumption of independent changes in P::', Chl and k, CV,,,. Data were collected at the surface and bottom of the water column at Sites A and C at dawn, midday and dusk or at midday, dusk, dawn and midday. Dotted line shows the 1 1
relationship
BZI (g Chl m-2)(mol photons m-2 d-l)
Fig. 12. Dally productivity, n,l,,,, versus the compos~te para- meter BZlat S ~ t e s A and C, San Antonio Bay. Dally product~v- ity was calculated by interpolation between rates estimated from sa.mp1es taken every 1 to 2 h. The composite parameter is the product of the chl a concentration in the euphot~c zone (Chl x z,,) and dally incident irradiance, I,,,. Estimates were based on the values of Chl X z,,,, measured at midday (e, solld line) or on the daily average values of Chl X z,, (0, broken line). The lines are Type I1 regressions. Midday values: nd,, = 0.20 + 0.61 x BZl (p < 0.05, R2 = 0.75). Averaged values: n,,! = 0.20 + 0.85 X BZ1 (p < 0.05, R' = 0.72). The 95% confidence limits for the slopes were 0.33 and 0.99 (midday values) and
0.26 and 1.04 (averaged values)
total incident irradiance (I,,,). The relationship was sig- nificant whether the estimate of BZI was based on the concentration of chl a in the euphotic zone (Chl X z,,) averaged over the course of the day or on the midday values alone (Fig 12) . The sl.ope of the relationship was 0.88 (95 % conf~dence limits 0.26 and 1.04) for the averaged values and 0.67 (95 % confidence limits 0.33 and 0.99) for the midday values. Accounting for the full variability in chl a and attenuation did not improve the amount of variability in productivity explained by the composite parameter
The BZI model lacks any description of the photo- synthetic responses of the microalgae but could ac- count for 75% of the variability in daily productivity, albeit on a very small set of samples. Comparison of
predictions based on midday values of chl a and the at- tenuation coefficient with those based on full within- day variability show that daily productivity can be pre- dicted by extrapolation from the midday value. The accuracy of the estimate can be improved by inclusion of the P-I response. We examine 3 very simple formu- lations for calculating daily productivity, based on a single observation of microalgal biomass and P-I re- sponse. Daily productivity extrapolated from areal pro- ductivity at midday, n:.,.:, was compared with daily productivity calculated from Eqs. (5) to (8), &,,, using 3 simple models. The input for each model was the midday estimate of productivity, n,,,,,, supplemented with a n increasingly detailed record of irradiance.
The first model does not incorporate a continuous record of irradiance and is the product of n,,,, and the number of hours of daylight, D (Marshal1 et al. 1971):
Model 1 nidv = &W, D (17)
This assumes that the mean rate of areal photosynthe- sis does not vary over the course of the day. The second model is a modification of Model 1, in which n,,, is weighted by mean incident irradiance over the day (Leach 1970):
Model 2 G, = nnoon .D.(:)
where I, is incident irradiance at noon, the time of sampling, and Id is the mean irradiance over the day. This assumes that there is a linear relationship between I,(,, and I. (however, see Fig. 5 ) . The third model incorporates the die1 variability in irradiance:
1=U Model 3
%ay = C n i i t j . ~ t (19) 1=0
where values of I l l , , , were calculated according to Eqs. (5) to (8) using the single, midday measurement of chl a, attenuation and P-I parameters. Only I. was per- mitted to vary.
The output of the 3 models was compared to the observed value of daily production, Iday, calculated from Eqs. (5) to (8) in which full variability of chl a, P-I response, attenuation and irradiance is taken into account (Table 4 ) . The mean errors for Models 1, 2 and 3 were 62, 28 and 27 %, respectively. The 3 models can be ranked in order of the accuracy of prediction (i.e. the slope of the relationship and the magnitude and distribution of errors) in the following order: Model 3 > Model 2 > Model 1.
DISCUSSION
The waters of San Antonio Bay are both turbid and productive. The average and minimum depths of the
MacIntyre & Cullen Suspended and ben th~c microalgae in a tu rb~d estuary 26 1
euphotic zone (1.1 and 0.3 m) rank it with the most tur- bid of 26 bays and estuaries reviewed by Cloern (1987). Even so, the mean irradiance in the shallow water column was comparatively high, exceeding 400 pm01 m-' S-' in half of the 28 samples taken at mid- day. Suspended chl a concentrations were in the mid- range of 39 estuarine systems reviewed by Day et al. (1989) but daily productivity was comparable to that in deeper and clearer waters, such as the Chesapeake, Delaware and Narragansett bays (eastern coast, USA), and the estuaries of the Fraser (Canada), Hudson (USA) and St. Lawrence rivers (reviewed by Pennock & Sharp 1986, Day et al. 1989). The high productivity is due, in part, to the microalgae maintaining high light- saturated rates of photosynthesis in spite of the turbid conditions characteristic of the bay.
The water column in San Antonio Bay was also char- acterized by a high degree of short-term (hours) vari- ability in both physical and biological characteristics (turbidity and microalgal biomass and photosynthetic response). On the same time-scale, productivity was less variable than might be expected because of coher- ence in the changes. A practical consequence of this is that reasonable estimates of integrated daily produc- tiv~ty can be obtained by extrapolation from an esti- mate of productivity at midday. We argue that the coherence is due to parallel resuspension of sediment and benthic microalgae and to covariation of light- saturated rates of photosynthesis and turbidity, be- cause high turbidity reduces the likelihood of photo- inhibition.
Photosynthetic responses of the suspended microalgae
Light-saturated rates of photosynthesis, PC,hl, in San Antonio Bay were comparable to those in much clearer waters, such as the Hudson River estuary and New
York Bight (Malone 1977, Malone & Neale 1981) and the Gulf of Mexico (Lohrenz et al. 1994, J. Cullen unpubl.). Similar values have also been measured in the Neuse River estuary (North Carolina, USA) (Boyer et al. 1993), in which the range of z,,:~,, was compara- ble (ca 0.5 to 1.6) to that in San Antonio Bay. although the water column was deeper (2.2 to 4.3 m). In all but the Neuse, much of the variability in P',hl could be explained by temperature. The Qlo of 1.8 reported here is comparable to values measured over seasonal time-scales by other investigators (Eppley 1972, Harris & Piccinin 1977, Malone 1977, Harrison & Platt 1980, Malone & Neale 1981), although temperature could explain only 46% of the variability in log(P',hl).
The decline in midday values of P$' as mean irradi- ance in the water column increases, which is robust after the data are corrected for the effect of tempera- ture, was not expected on the basis of the relationship between PC,F'and growth irradiance in cultures (Geider 1993), as typified by the response of the diatom Tha- lassiosira pseudonana. The trend was due to variation of P',"' with turbidity. We consider 3 mechanisms, which are not mutually exclusive, that might be re- sponsible for the relationship. These are (1) size- dependent variations in photosynthetic response, (2) acclimation to rapidly fluctuating irradiance, and (3) an effect of photoinhibition.
The first possible explanation is based on differences in the photosynthetic responses of large and small cells. Net plankton (>20 pm) tend to have lower light- saturated rates of photosynthesis than nanoplankton (Malone & Neale 1981). Where the reverse has been shown (Malone 1977), the net plankton was dominated by small chain-forming species. The relationship between temperature-independent variation in P:,!' and turbidity might therefore be due to a prevalence of small cells in turbid waters. Although large cells will sink out of the water column more rapidly than unat- tached small cells, the benthic microalgae most likely
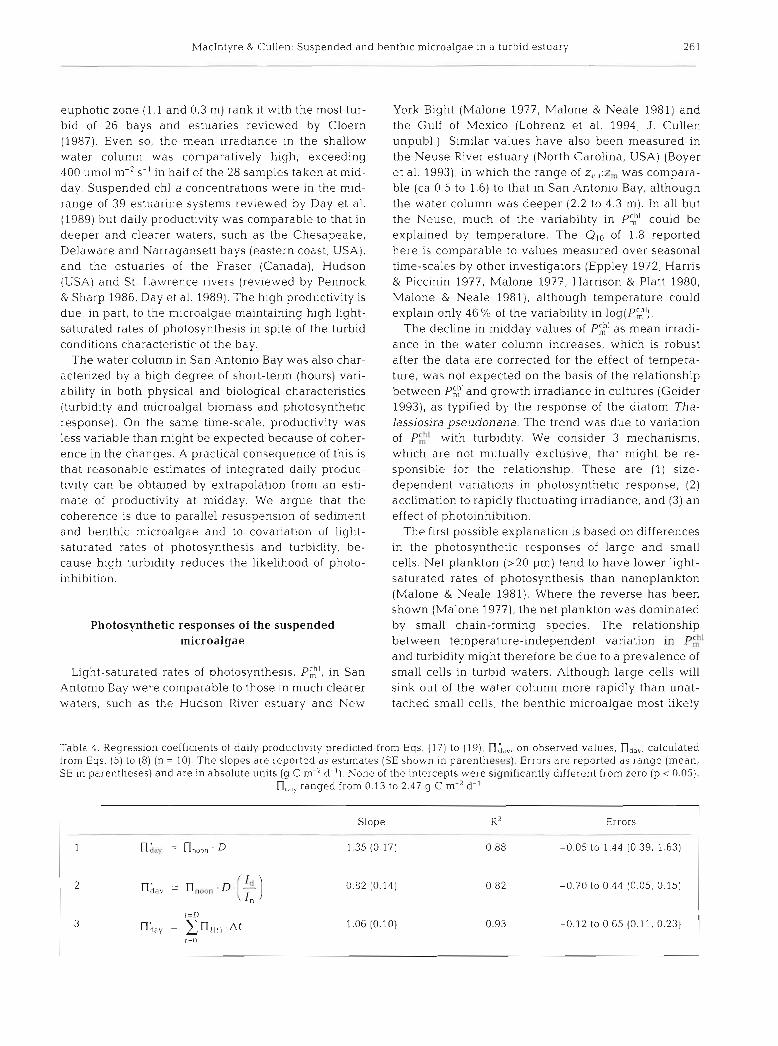
Table 4. Regression coefficients of daily productivity predicted from Eqs (17) to (19), n;,,,, on obsel-ved values, nd,,, calculated from Eqs. (5) to (8) (n = 10). The slopes are reported as estimates (SE shown in parentheses). Errors are reported as range (mean, SE in parentheses) and are in absolute units (g C m-' d-l). None of the intercepts were significantly different from zero (p < 0.05).
nd,, ranged from 0.13 to 2.47 g C m-' d-'
Slope Errors
-0.05 to 1.44 (0.39, 1.63)

262 Mar Ecol Prog Ser 145: 245-268, 1996
to be resuspended and then settle out of the water col- umn are small cells associated with silt particles (de Jonge & van den Bergs 1987, Delgado et al. 1991). However, the benthic assemblages had lower light-sat- urated rates of photosynthesis than the suspended assemblages (Fig. IO), so resuspension should cause a decrease rather than an increase in Pi:' as turbidity increases.
A second possible explanation for the observed trend of temperature-independent changes in P$'' with tur- bidity is that the cells in the water column are accli- mated to a fluctuating light regime. Laboratory studies in which microalgae have been subjected to simulated mlxing are available for 5 species from 3 classes. The algae were subjected to regimes in which either mean irradiance or the peak irradiance varied. Except for the response of the chlorophyte Chlorella pyrenoidosa (Kroon et al. 1992), P$' fell when mean irradiance declined but peak irradiances did not change, and rose when the peak irradiance increased and the mean irra- diance did not vary (Marra 1978a, Kromkamp & Lim- beek 1993, Ibelings et al. 1994). Similar trends have been observed in some estuarine habitats. Vincent et al. (1994) concluded that phytoplankton in the mixed layer of the St. Lawrence were acclimated to peak rather than mean irradiance and assemblages from the New York Bight (Malone 1977) and Vineyard Sound, Massachusetts (USA) (Glibert et al. 1985), had values of ~ 2 ' that were higher than expected from the rela- tionship with temperature when the water column was well-mixed. These results are broadly consistent with the responses of microalgae grown under stable ~llumi- nation, in which PE' increases with growth irradiance (Geider 1993).
The trend in P$' with mean irradiance presented here is the opposite of the acclimative responses described in the laboratory studies. This could be because the highest frequency of change employed in these studies, corresponding to a cycle through the euphotic zone in an hour, is much slower than the tran- sit-t1.m.e of minutes characteristic of a turbid and well- mixed body of water (MacIntyre 1993). There is also a mismatch in time-scales that make it unlikely that the trend in P$' is due to acclimation: kinetic studies with cultures (Post et al. 1984, Cullen & Lewis 1988, Kromkamp & Limbeek 1993) indicate that acclimative changes in Pc1 to a change in irradiance are slower than the time-scale on which turbidity varies in San Antonio Bay. An acclimat~ve response to a fluctuating light regime may be responsible for the generally hlgh values of P$", but is unlikely to account for the decline in P$' as the water column becomes clearer and more stable.
A third explanation for the trend in temperature- independent changes in P:!'' with turbidity is that high
turbidity and rapid mixing protect the suspended microalgae from photoinhibition (i.e. damage to photo- synthetic reaction centers). Photoinhibition occurs when the rate of excitation at the reaction centers exceeds the rate at which absorbed energy can be dis- sipated, either by photosynthesis or by a non-photo- synthetic mechanism su.ch as the xanthophyll cycle (Demers et al. 1991, Olaizola & Yamamoto 1994) or the Mehler reaction (Kana 1992). Thls is most likely to occur when phytoplankton acclimated to relatively low irradiance are stranded at high irradiance, as occurs when mixing is reduced (Vincent et al. 1984, Elser & Kimmel 1985, Neale & Richerson 1987). Surface pho- toinhibition is commonly seen in the fixed-depth in- cubations that are frequently used to estimate produc- tivity. The onset of photoinhibition can be rapid, occurring in <30 min (Neale & Richerson 1987) and photoinhibitory irradiances may extend well into the water column. In 4 h incubations in the Neuse river estuary, even photosynthesis at 58 0iu of surface irradi- ance was depressed relative to photosynthesis at 35 % of surface irradiance (Mallin & Paerl 1992). The 35% light level corresponded to a depth of 1.1 m in a 3.4 m water column. Imposing some degree of mixing by cycling incubated bottles through a light gradient can alleviate the photoinhibition (Marra 1978a, b, Randall & Day 1987, Mallin & Paerl 1992) but none of the com- parisons of moving- and fixed-bottle incubations have demonstrated that photoinhibition had been elimi- nated by mixing, only that it had been reduced relative to stationary controls.
In San Antonio Bay, the entire water column appears to be photoinhlbited u.nder the natural mixing regime. The basis for this argument is the decline in F,,Chl-' (an index of the proportion of functional reaction cen- ters) observed at high irradiance and the trend between F, Chl-l and the temperature-insensitive vari- ation in P%'. A decline in F, Chl-' after cells have been subjected to high light stress has been correlated with a reduction in light-limited and light-saturated rates of photosynthesls (Davis 1986, Neale & Richerson 1987, Neale et al. 1989, Leverenz 1990), although there ma.y be a reduction in achl and F,, Chl-' without a reduction in F:' (Cullen et al. 1988). The surface inhibition of modeled photosynthesis at Site A in November, Janu- ary and April and at Site C in November and April (Figs. 3 & 4) will occur only if the time-scale of mixing in San Antonio Bay is slower than the 20 min over which the P-I curves were measured (Davis 1986). This is potential photoinhibition, which is characterized by a fall-off in photosynthetic rates at hlgh irradiance dur- ing the P-I incubation and a consequent surface depression in modeled photosynthesis. Photoinhibition that has occurred in situ prior to the incubation is char- acterized by a reduction in F,. Chl-' and P%' and little,
Maclntyre & Cullen: Suspended and benthic microalgae in a turbid estuary 263
if any, fall-off (Vincent et al. 1984, Neale & Richerson 1987, Henley 1993).
In 8 of 10 cases where the water column in San Anto- nio Bay was monitored through the day, there w.ds a decline in F, Chl-' that was correlated with the mean irradiance in the water column. In 5 of the 7 cases where the comparison could be made, there was a hys- teresls in the afternoon recovery (Fig. 7). This is the pattern of photoinhibition described by Neale & Rich- erson (1987). The midday decline was sufficiently per- sistent that it was detectable when each day's data were standardized and pooled: there was a dec l~ne during the morning and a partial recovery in the after- noon (Fig. 6). The same pattern of within-day variabil- ity could be seen in 3 of 4 between-day comparisons, where changes in the mean irradiance in the water col- umn at midday were mirrored by opposing changes in F, Chl-I (Fig. 5). The depression in F, Chl-' at high irra- diance is unlikely to be due to quenching of fluores- cence by inter-conversion of the photoprotective xan- thophylls diatoxanthin and diadinoxanthin (Demei-S et al. 1991, Olaizola and Yamamoto 1994). Quenching by diatoxanthin after an imposed light stress can persist for 30 min or more in darkness, the pre-treatment for measuring F,,Chl-' in this study, but only after the reaction centers have endured photoinhibitory dam- age (Arsalane et al. 1994).
Variations in the photosynthetic responses of the sus- pended microalgae were also consistent with photo- inhibition. Both the light-limited and light-saturated rates of photosynthesis (arh' and P:!') varied with F, Chl-' and varied inversely with the mean irradiance in the water column between days at the same site (Fig. 5) and between months and sites (Table 2, Fig. 8). The temperature-insensitive variation in P$' was also correlated with F. Chl-' and mean irradiance between months and sites (Fig. 8). I t is possible that the lack of a diel maximum in p:,h1in the natural assemblage, coinci- dent with a minimum in F,Chl-I was partially due to photoinhibition (cf. Cullen et al. 1992). Die1 changes in Pky'and F,. C11l-' in San Antonio Bay were distinct from those in cultures of the diatom Thalassiosira pseudo- nana (Fig. 6 ) . Samples from the bay did not show the pronounced peak in Pihl that coincided with a peak in F,Chl-' in T pseudonana and which have been reported in other natural assemblages (Harding et al. 1982, 1987). The P-1 curves of the natural samples were also flatter than those in the cultures, as mea- sured by the index P::yP:,"', a characteristic of photoin- hition (Neale & Richerson 1987, Henley 1993). How- ever, a damping of the diel rhythm in P::' also occurs when cells are grown in fluctuating light fields (Kroon et al. 1992, lbelings et al. 1994).
The relationships between mean irradiance, P$" and F,, Chl-' can be ascribed to changes in turbidity that
lead to changes in the mean irradiance in the water column. The relationship between the temperature- insensitive variation in P:,:'and z,,,:~,, can therefore be interpreted as an increase in the degree of photoinhi- bition (a fall in the proportion of functional reaction centers and subsequently in PLY') as the water column becomes more stable and less turbid and the entrained microalgae are exposed to higher irradiances and slower mixing through the light gradient. While main- taining a high light-saturated rate of photosynthesis may be an adaptive trait, in that it allows opportunistic use of high irradiance during episodic exposure, ~t may also have a photoprotective role by reducing the range of conditions under which photoinhibition is likely to occur. We argue that the high values of P:::' measured in San Antonio Bay are an acclimative response to episodic high irradiances, possibly with a secondary photoprotective role, but that the trend of P:!' with mean irradiance is due to a n increasing degree of pho- toinhibition throughout the water column when turbid- ity declines.
Short-term variability in the water column and resuspension
Short-term (hours) variability of algal biomass in estual-ies may be due to advection of patchily-distrib- uted assemblages, resuspension of benthic microalgae or changes in the balance between algal growth and grazing. If resuspension dominates, an increase in tur- bidity will be offset by an increase in the abundance of microalgae in the water column. Covariance in chl a and turbidity has been reported in the shallow waters of other estuaries (Demers et al. 1987, Cloern e t al. 1989, Powell et al. 1989, Litaker et al. 1993).
Concentrations of benthic chl a in San Antonio Bay, although among the lowest reported (MacIntyre et al. 1996) are very high relative to concentrations in the overlying water. In half of the vertical profiles, the upper 10 mm of sediment contains as much chl a as the overly~ng 1.25 to 2 m deep water column (Fig. 9). Resuspension under controlled conditions has shown that only 2 to 11 '% of the chl a in the upper sediment is resuspended (Delgado et al. 1991, Sloth et al. 1996). However, these studies used sediment in which there was a well-developed algal mat, which can stabilize the sediment by excretion of extra-cellular organic compounds (Holland et al. 1974, Yallop et al. 1994) and retard resuspension. There was no surficial mat in any of the cores from San Antonio Bay, so resuspension might have involved more than the upper 6 mm described by Sloth et al. (1996): other studies have shown that the upper 3 to 5 cm of sediment may be involved (Jennes & Duineveld 1985, Arfi e t al. 1993).

Mar Ecol Prog Ser 145 245-268, 1996
The measured concentratlons of benthic chl a are therefore high enough to account for much of the observed var~abllity In suspended chl a
The Importance of resuspenslon in San Antonlo Bay could be Inferred from the h ~ g h turbldlty In the absence of any other data Resuspension would also account for the tight coupling between productivity In the water column and g rannq by the benthlc meio- fauna durlng this study (Montagna & Yoon 1991) The probabll~ty that resuspenslon causes the short-term varlabllity in the w a t e ~ column can be lnferred d~rectly from the correlat~on analyses and the predictive power of the productivity models and indirectly from the abundance and P - l responses of the b e n t h ~ c microal- gae None of the ev~dence 1s conclus~ve but taken together is strongly suggestive Of 12 correlat~on analyses 3 appeared to be consistent w ~ t h lesuspen- slon and 3 appeared to be ~nconslstent (Table 3) How- ever, the lack of a trend between changes In chl a and turbidlty does not preclude resuspenslon as the mech- anlsm underlying short-term va r l ab~ l~ ty Llnear corre- lation does not account for the complex interactions that occur in an estuary, 4 of which are of part~cular importance First, resuspenslon IS correlated w ~ t h the t ~ d a l veloc~ty maxlmum (Baillie & Welsh 1980, L~taker et a1 1993) and so IS out of phase w ~ t h tldal amplitude (and sallnlty) and shows a h t s t e ~ e s ~ s between flood~ng and ebblng tldes Second, resuspenslon may be caused by wind-driven mlxing (Gabrielson & Lukatel~ch 1985 Pelrup 1986, Demers et a1 1987, Arf~ et a1 1993) rather than tldes W ~ n d speed tends to vary on a d ~ e l b a s ~ s being h ~ g h e r d u r ~ n g the day than a t nlght, so resus- penslon may be largely independent of t~dally-drlven changes in sal~nity Thlrd, microalgal cells, sllt and sand have different characterlst~cs of resuspenslon (and presumably settling) at a glven flow veloclty (de Jonge & van der Bergs 1987, Delgado et a1 1991) Fourth there may be a strong die1 rhythm of grazing on suspended mlcroalgae superimposed on variations
caused by advection and/or resuspenslon (Lltaker et a1 1988, 1993) All of these effects wlll obscure slmple, h e a r relationships between sal~nity, chl a and turbldlty
A further indicat~on thdt resuspension d r ~ v e s short- term var~abllity comes from the covariatlon between components of the composite parameter M ( I e P' ' Chl and k) The observed vana t~on in M was less than expected on the assumption of Independent changes in ~ t s components, ~ n d i r a t ~ n g that t h e covar~ation of chl a and turbidity or P and turbidlty outweighed covaria- tion between chl a and P' ' Resuspens~on ~vould lead to both covanat~on of chl a and tuib~dlty and chl a and P' , as the benthlc assemblage had consistently lower light-saturated rates of photosynthes~s than the sus- pended population (Fig 10) Covariation of P' and
turbid~ty could be a secondary effect of resuspenslon ~f the increase in turbid~ty al lev~ated photoinhibition and allowed recovery of P , Were this to occur ~t would over-rlde the relationship between changes In chl a and P ' , , even in the absence of covarlat~on between chl a and turbldlty The RZI model, which lacks any descliption of the P-I response, provides evldence for covar~ation between chl a and turbidity the p r e d ~ c t ~ v e power of the BZI parameter was not reduced when it was based on a s ~ n g l e observation of the chl a content m the euphotlc zone rather than the average vdlue through the day
Last, the action of resuspenslon can be Inferred from the abundance and P - l responses of the benthlc mlcroalgae The photosynthetic responses of the phy- tobenthos are incons~stent with those of an assemblage restricted to an aphotic or nearly aphotlc environment
The photic zone did not extend to the sediment-water Interface In 70 of 106 observat~ons but, where ~t d ~ d only the upper 0 7 to 1 0 mm of the sed~men t would bc l l lum~nated T h e ~ e was no relatlonsh~p between P ' , and the mean irradiance in the sediment and the relatively high values of F', are a typ~cal of low-llght acchmated or re l~ct populatlons of mlcroalgae Instead v a r ~ a t ~ o n s in PC ' in both the dlmly lit 0 to 1 mm and aphotlc 2 to 3 mm strata were strongly correlated 1~1th those In the suspended population, suggesting that both have slmilar light histor~es The pattern held both for the absolute values of P' and for the deviat~ons from the trends predicted by temperature (Fig 10)
The decline in P: l between the 0 to 1 and 2 to 3 mm assemblages (Flg 10) may be due to less frequent exposure to llght of the deeper assemblage, as argued previously (MacIntyre & Cullen 1995) It m ~ g h t also be due to an artifact Introduced by f luo~omet r~c determl- nation of chl a In splte of the nom~na l correction for degradat~on products Where fluorometnc assays have been compared with HPLC in benthic samples, fluo- rometry may overestimate chl a concentration (Dae- men 1986, Riaux-Gobin et a1 1987) although it does not always do so (Plante-Cuny et a1 1993, Sun et a1 1994, MacIntyre et a1 1996) Where it occurs, the over- estimate IS 11kely due to the presence of the degrada- tlon product chlorophyllide w h ~ c h has opt~cal proper- t ~ e s ident~cal to those of chlorophyll (Holt & Jacobs 1954) and is therefore detected as chlorophyll by fluo- rometry spectrophotometry If there wele an increase In chlorophyllide concentrat~ons in the uppermost sed- ~ m e n t in San Antonio Bay, P ; would be underestl- mated In the deeper assemblages
Although there is no direct e v ~ d e n c e for resuspen- sion, we argue that there IS strong c~rcumstant~al ev~dence The compensatory nature of short-term changes In the charactenst~cs of the water column has an Important consequence for monitoring product~vlty

h4aclntyre & Cullen Suspended and benthlc microalgae in C I t u r b ~ d estuary 265
reasonable estimates of productivity can be obtained without a full description of the short-term variability.
Estimating daily productivity
Studies in other estuaries have shown that a high degree of variability in chl a and attenuation does not translate to an equally high degree of variability in productivity (Demers et al. 1987, Cloern et a1 1989, Powell et al. 1989, Litaker et al. 1993). This is also the case in San Antonio Bay. The practical consequence is that reasonable estimates of daily productivity can probably be obtained from single measurements of chl a and turbidity, particularly when these are com- plemented by a description of P-I response, and con- tinuous measurement of irradiance. Monitoring pro- grams frequently rely on llmited discrete sampling of water column parameters, which may be comple- mented by continuous recording of such parameters such as irradiance and temperature. The coherence in the variability in chl a, turbidity and P::' translates into a reduced need to sample the water column in order to get accurate descriptions of daily productivity.
One of the simplest models for estimating daily pro- ductivity is the BZI model proposed by Cole & Cloern (1984). The empirical factor relating daily productivity to the BZI parameter ( i .e . the slope of the regression) was not significantly different whether the relationship was determined from the full variability in chl a and z,,, or from the midday values only. The slope was 0.67 to 0.88 and comparable to values determined empirically in other estuaries, which range between 0.36 and 1.8 (Cole & Cloern 1987, Keller 1988, Cole 1989, Boyer et al. 1993). The coefficient of determination (R2 = 0.72) was in the mid-range of the coefficients from other studies, 0.42 to 0.94 (Cole & Cloern 1984, 1987, Hard- ing et al. 1986, Pennock & Sharp 1986, Keller 1988, Cole 1989, Mallin et al. 1991, Boyer et al. 1993).
Although 72 % of the variability in daily productivity can be accounted for by the BZI model, a better esti- mate can be made by supplementing the data with the P-I response of the suspended assemblage. In the 3 models discussed here, a single P-I curve is used to generate either one or more estimates of productivity that are extrapolated to a daily rate. In the first, Model 1 (Marshal1 et al. 1971), productivity at midday is multiplied by day-length to yield an estimate of daily productivity. An implicit assumption is that productiv- ity is independent of incldent irradiance, which is not the case. As productivity at midday was generally higher than at other times of the day, Model 1 tended to overestimate daily productivity (slope = 1.35), although it could describe more of the variability in nd,, (R2 = 0.88) than the BZI model. Model 2 (Leach
1970) differs from Model 1 in that it relates area1 pro- ductivity to incident irradiance, assuming that the rela- tionship is linear (but see plots of nl,,, vs I,, in Fig 5). The error in each estimate depends on the degree of curvature of the true relationship. Model 2 gives a good estimate where there is little curvature (i.e. where I, is high and/or there is little or no fall-off in the P-I curve at high irradiance). I t underestimates daily productivity where the average daily irradiance is lower than irradiance at midday and would overesti- mate dally productivity ~f the mean irradiance were hlgher. On average, it underestimated daily productiv- ity by 12% (slope = 0.88, K2 = 0.88). Model 3 dlffers from Model 2 in that it corrects for the non-linearity of the n,,,, vs I" curve. It gave the closest estimate of daily productivity of the 3 models (slope = 1.06, R2 = 0.93).
Although based on only 10 observations, this analy- sis suggests that good estimates of daily productivity can be made without accounting for the high within- day variability in turbidity and microalgal abundance and P-I response. Incorporating the P-I response into the estimate of daily productivity improves the accu- racy of the estimate and frees it from its reliance on a n empirically-derived conversion factor, which may vary between sites, between seasons or with the nutrient status of the assemblage (Pennock & Sharp 1986, Cole & Cloern 1987). Because differences in n,,,,,, on con- secutive days approached month-to-month variability in San Antonio Bay, the optimal use of limited resources would minimize within-day sampling and would focus on between-day variability. Models 2 and 3 give good predictions of nd,,, with average errors of 28 and 27 %,, respectively. Between-day variations in n ,,,,, were 13 %, 52 %, 44 'X and 21 $;, (Fig. 5) . I t would be a better use of resources to characterize between- day variability rather than reduce the error on within- day variability on a reduced set of samples.
Summary
The waters of San Antonio Bay were both turbid and productive. The high degree of short-term (hours) vari- ability in the physical and biological characteristics of the water column were likely due to resuspension of the benthos, which contained a n abundant assemblage of photosynthetically-competent microalgae. Resus- pension could account for the predominant covariance between chl a and turbidity and between turbidity and light-saturated rates of photosynthesis, P:!:'. The high short-term variability in the water colunln did not result in comparable variability in productivity be- cause of the compensatory increase in microalgal bio- mass and recovery of PC,:' from photoinhibition as tur- bidity increased. As a result, estimates of daily

266 Mar Ecol Prog Ser 145: 245-268, 1996
productivity based on single observations of sus- pended chl a, light attenuation and P-I response could predict daily productivlty with reasonable fidelity. The high degree of between-day variability indicates that the optimal use of resources would focus on between- day rather than within-day variability.
Acknowledgements. We thank Rob Lane, Joe Dirnberger, Jake Garrett. Mark Westerman, Rick Kalke, Paul Montagna and Capt. John Turany of the RV 'Katy' for help in sampling. Richard Geider and 3 anonymous reviewers provided valu- able criticism of the manuscript. This work was supported by the Texas Water Development Board Interagency Contract IAC (86-87) 0757 and NSERC funding to J .J .C. and by NSF Grant OCE-9301768 to R~chard Geider.
LITERATURE CITED
Anderson FE (1976) Rapid settling rates observed in sedi- ments resuspended by boat waves over a tidal flat. Neth J Sea Res 10:44-58
Arfi R, Guiral D, Bouvy M (1993) Wind induced resuspension in a shallow tropical lagoon. Estuar Coast Shelf Sci 36: 587-604
Arsalane W, Rousseau B, Duval J C (1994) Influence of the pool size of the xanthophyll cycle on the effects of light stress in a diatom: competition between photoprotection and photoinhibition. Biochem Photobiol 60:237-243
Baillie PW, Welsh BL (1980) The effect of tidal resuspension on the d~stribution of ~ntertidal epipellc algae in an estu- ary. Estuar Coast Shelf Sci 10:165-180
Bevington PR (1969) Data reduction and error analysis for the physical sciences. McGraw Hill. Hightstown, NJ
Boyer JN, Christian RR, Stanley DW (1993) Patterns of phyto- plankton pnmary productivity in the Neuse River estuary, North Carolina, USA. Mar Ecol Prog Ser 97:287-297
Cloern JE (1987) Turbidity as a control on phytoplankton bio- mass and productivity in estuaries. Cont Shelf Res 7: 1367-1381
Cloern JE, Powell TM, Huzzey LM (1989) Spatial and tempo- ral vdriability in south San Francisco Bay (USA) 11. Tempo- ral changes in salinity, suspended sedlnlents, and phyto- plankton biomass and productivity over tidal time scales. Estuar Coast Shelf Sci 28599-613
Cole B (1989) Temporal patterns of phytoplankton production in Tomales Bay, California, U.S.A. Estuar Coast Shelf SCI 28:103-115
Cole B, Cloern JE (1984) Significance of b~omass and light availability to phytoplankton productivity in San Francisco Bay. Mar Ecol Prog Ser 17:15-24
Cole B, Cloern JE (1987) An empirical model for estimating phytoplankton productivlty in estuaries. Mar Ecol Prog Ser 36:2Qq-305
Cullen JJ. Lewis MR (1988) The kinet~cs of algal photoadap- tation in the context of vertical mixing. J Plankton Res 10: 1039-1063
Cullen J J , Lewis MR, Davis CO, Barber RT (1992) Photosyn- thetic characteristics and estmated growth rates lnd~cate grazing is the proximate control of prlmary productlon In the equatorial Pacific. J Geophys Res 97:639-654
Cullen J J , Yentsch CM, Cucci TL, MacIntyre HL (1988) Auto- fluorescence and other optical properties as tools in bio- logical oceanography. SPIE 925: 149-156
Daemen EAIMJ (1986) Companson of methods for the deter-
mination of chlorophyll in estuarine sediments. Neth J Sea Res 20:21-28
Davis RF (1986) Measurement of primary production in turbid waters. MSc thesis, University of Texas at Aust~n
Day JW, Hall CAS, I<emp WM, Yaliez-Aranc~bia A (1989) Estuarine ecology. John Wiley & Sons, Inc. New York
de Jonge VN, van Beusekom JEE (1992) Contnbution of resuspended microphytobenthos to total phytoplankton in the Ems Estuary and its possible role for grazers. Neth J Sea Res 30:91-105
de Jonge VN, van den Bergs J (1987) Experiments on the resuspension of estuarine scdiments containing benthic diatoms. Estuar Coast Shelf Sci 24:725-740
Delgado M, de Jonge VN, Peletier H (1991) Experiments on resuspension of natural microphytobenthos populations. Mar Biol 108.321-328
Demers S, Roy S, Gagnon R, V~gnault C (1991) Rapid light- induced changes in cell fluorescence and in xanthophyll- cycle pigments of Alexandriurn excavalum (Dinophyceae) and Thalasslosira pseudonana (Bacillariophyceae): a photo-protect~on mechanism. Mar Ecol Prog Ser 76: 185- 193
Demers S, Therriault JC, Bourget E, Bah A (1987) Resuspen- sion In the shallow sublittoral zone of a macrot~dal estuar- ine environment: wind influence. Limnol Oceanogr 32: 327-339
Dustan P, Pinckney JLJ (1989) Tidally induced estuarine phytoplankton patchiness. Limnol Oceanogr 34:410-419
Elser JJ , K~rnmel BL (1985) Photoinhibition of temperate lake phytoplankton by near-surface irradiance: evidence from vertical profiles and field experiments. J Phycol 21 419-427
Eppley RW (1972) Temperature and phytoplankton growth in the sea. Fish Bull 70:1063-1085
Gabrielson JO, Lukatelich RJ (1985) Wind-related resuspen- sion of sediments in the Peel-Harvey estuarine system. Estuar Coast Shelf Sci 20:135-145
Garrad P, Hey RD (1987) Boat traffic, sediment resuspension and turbidity In a broadland river. J Hydrology 95: 289-297
Geider RJ (1993) Quantitative phytoplankton physiology: implications for primary production and phytoplankton growth. ICES Mar Sci Symp 19452-62
Gllbert PM, Dennett MR, Goldman JC (1985) Inorganic car- bon uptake by phytoplankton In Vineyard Sound, Massa- chusetts. I. Measurements of the photosynthesis-irradi- ance response of winter and early-spring assemblages. J Exp Mar Biol Ecol 8521-36
Guillard RRL (1975) C'ullure of phytoplankton for feeding marlne invertebrates. In: Smith WL, Chanley MH [eds) Culture of marine invertebrate animals. Plenum Publish- ing CO, New York, p 108-132
Harding LW. Fisher TR, Tyler MA (1987) Adaptive responses of photosynthesis in phytoplankton: specificity to tlnlc- scale of change in light Biol Oceanogr 4403-437
Hardlng LW, Prezehn BB, Sweeney BM, Cox JL (1982) Die1 oscillations of the photosynthesis-irradiance (PI) relation- ship in natural assemblages of phytoplankton. hlar Biol 67:167-178
Harding LWJ, Meeson BW, Fisher TRJ (1986) Phytoplankton product~on in two east coast estuanes: photosynthesis- llght functions and patterns of carbon assimilation in Chesapeake and Delaware Bays. Estuar Coast Shelf Sci 23:773-806
Harns GP, Piccinin BB (1977) Photosynthesis by natural pop- ulat~ons of phytoplanklon. Arch Hydrobiol 80:405-457
Harnson WG, Platt T (1980) Variat~ons in assimilation number
Maclntyre & Cullen: Suspended and benthic microdlgrie in a turbid estuary 267
of coastal lnarlne phytoplankton: effects of environmental CO-variatcs. J Plankton Res 2:249-260
Henley WJ (1993) Medsurement and interpretation of photo- synthetic light-response curves in algae In the context of photoinhib~t~on and die1 changes. J Phycol 29:729-739
Holland AT;, Zlngmark KG, Dean J M (1974) Quantitative evi- dence concerning the stabilization of sediments by marine benthic diatoms. ivlar Biol 27:191-196
Holm-Hansen 0 (1978) Chlorophyll a determination: im- provements In methodology Oikos 30 438-447
Holt AS, Jacobs EE (1954) Spectroscopy of plant pigments. 1 Ethyl chlorophyllides A and B and their phaeophorbides. Am J Rot 41:710-722
Ibelings BW, Kroon BMA, Mur LR (1994) Acclimation of pho- tosystem 11 In a cyanobactel-~um and a eukaryotic green alga to high and fluctuat~ng photosynthet~c photon flux densities, simulating light regimes Induced by ln~xing in lakes. New Phytol 128:407-424
Jennes MI, Duineveld GCA (1985) Effects of tidal currents on chlorophyll a content of sandy sediments in the southern North Sea. Mar Ecol Prog Ser 21:283-287
Joint IR, Gee JM. Warwick KM (1982) Determination of fine- scale vertical distribution of microbes and meiofauna in an intertidal sediment. Mar Biol72:157-164
Kana TM (1992) Relationship between photosynthetic oxy- gen cycling and carbon assimilation in Synechococcus WH7803 (Cyanophyta). J Phycol28:304-308
Keller .AA (19881 Estimating phytoplankton productivity from light availability and biomass in the MERL mesocosms and Nai-ragansett Bay, Mar Ecol Prog Ser 45 159-168
Keller iAlD, Selvin RC, Claus \V, Guillard RRL (1987) M e d ~ a for the culture of oceanic ultraphytoplankton. J Phycol 23. 633-638
Kiefer DA (1973) Fluorescence properties of natural phyto- plankton assemblages. bldr Biol 22:263-269
Kirk JTO (1985) Effects of suspensoids on penetration of solar radiation In aquatic ecosystems. Hydrobiologia 125 195-208
Kromkamp J . Limbeek M (1993) Effect of short-term variation in irradiance on light harvesting and photosynthesis of the marine diatom Skeletonema costatum: a laboratory study simulating vertical mlxlng. J Gen Microbiol 139: 2277-2284
Kroon BMA, Burger-Wiersma T. Visser P, iMur LR (1992) The effect of dynamic light regimes on Chlorella. I. Minimum quantum requirement and photosynthesis-irrad~ance parameters. Hydrobiologia 238:79-88
Kiihl. M, Jsrgensen BB (1994) The light field In mlcrobenthlc communities: radiance distribution and the lnicroscale optics of sandy coastal sediments. Limnol Oceanogr 39: 1368-1399
Leach J H (1970) Epibenthic algal production in an intertidal mudflat. Linlnol Oceanogr 15:514-521
Levasscur M, Therriault J-C. Legendre L (1983) Tidal cur- rents, wlnds and the morphology of phytoplankton spa t~a l structure. J Mar Res 41:655-672
Leverenz Jhi, Falk S, Pilstrom C-b1, Sainuelsson G (1990) The effects of photoinhibition on the photosynthetic llght- response curve of green plant cells (Chlamniydomonas reinhardtii). Planta 182: 161 -168
Lewis MR, Smith J C (1983) A small-volume, short-incubation- tline method for measurement of photosynthesis as a func- tion of incident irradianrc. Mar Ecol Prog Ser 13:99-102
Lrtaker W, Duke CS. Kenney BE. Ramus J (1988) Die1 chl a and phaeopigment cycles in a shallow tidal estuary: potential role of microzooplankton grazing. Mar Ecol Prog Ser 47:259-270
Litaker W, Duke CS, Kenney BE, Ramus J (1993) Short-term variability and phytoplankton abundance in a shallo\h~ tidal estuary. 11. Spring and fall. Mar Ecol Prog Ser 94: 141-154
Lohrenz SE, Fahnenstiel GL, Redalje DG (1994) Spatial and temporal variations of photosynthetlc pardrnetera in rela- tion to environmental conditions in coastal waters of the Northern Gulf of Mexico. Estuaries 17:779-795
MacIntyre HL, Cullen JJ (1995) Fine-scale vertical resolution of chlorophyll and photosynthetlc parameters in shallow- \vater benthos. Mar Ecol Prog Ser 122:227-237
MacIntyre HL, Geider RJ, Miller DC (1996) Microphytoben- thos: the ecological role of the 'secret garden' of unvege- tated, shallow-water marine hab~ta ts . I. Distribution. abundance and primary production. Estuar~es 19:186-201
MacIntyre S (19931 Vertical mixing in a shallow, eutrophlc lake: possible consequences for the light climate of phyto- plankton. Limnol Oceanogr 38:798-817
Mallin MA, Paerl HW (1992) Effects of variable irradiance on phytoplankton productivity in shallo~v water. Limnol Oceanogr 3 7 5 - 6 3
Mallin MA, Paerl HW, Kudek J (1991) Seasonal phytoplank- ton composition, productivity and biomass in the Neuse River estuary. South Carolina. Estuar Coast Shelf Sci 32: 609-623
Malone TC (1977) Light-saturated photosynthesis by phyto- plankton size fractions in the New York B~gh t , USA. Mar Bio1 42:281-292
Malone TC. Neale PJ (1981) Parameters of light-dependent photosynthes~s for phytoplankton size fractions in temper- ate estuarine and coastal environments Mar Biol 61. 289-297
Marra J (1978a) Effect of short-term variations In light inten- sity on photosynthesis of a marine phytoplankter: a labo- ratory simulation study. Mar B~ol 46:191-202
Marra J (1978b) Phytoplankton photosynthetic response to vertical movement in a m ~ x e d layer. Mar Biol 46:203-208
Marshall N, Oviatt CA, Skauen DM (1971) Productivity of the benthic microflora of shoal estuarine environments in southern New England. Int Rev Gesamten Hydrobiol 56: 947-956
Montagna PA, Yoon WB (1991) The effect of freshwater Inflow on rneiofaunal consumption of sediment bacteria and microphytobenthos in San Antonio Bay, Texas, USA. Estuar Coast Shelf Sci 33:529-547
Neale PJ, Cullen J J , Yentsch CM (1989) Bio-optical infer- ences from chlorophyll a fluorescence: what kind of fluo- rescence is measured in flow cytornetry. Limnol Oceanogr 34:1739-1748
Neale PJ, Richerson PJ (1987) Photoinhibition and the diurnal vanation of phytoplankton photosynthesis-l. Develop- ment of a photosynthesis-irracl~ance model from studies of in situ responses. J Plankton Kes 9:167-193
Neale PJ, Talling JF, Heaney S1, Reynolds CS. Lund JWG (1991) Long time series from the English Lake District: irradiance-dependent phytoplankton dynamics during the sprlng maxlrnum Limnol Oceanogr 36:751-760
Olalzola M, Yarnamoto HY (1994) Short-term response of the diadinoxanthin cycle and fluorescence yield to high irradi- ance in Chaetoceros mueller; (Bacillariophyceae) J Phycol 30:606-612
Pejrup M (1986) Parameters affecting fine-grained suspended sedlment concentrations in a shallo~v micro-tidal estuary, Ho Bugt, Denmark. Estuar Coast Shelf Sci 22:241-254
Pennock JR, Sharp J H (1986) Phytoplankton production in the Delaware Estuary: temporal and spatial variability. Mar Ecol Prog Ser 34:143-155

Mar Ecol Prog Ser 145: 245-268, 1996
Phinney DA, Yentsch CS (19851 A novel phytoplankton chlorophyll technique: toward automated analysis. J Plankton Res 7:633-642
Plante-Cuny M, Barranguet C, Bonn D, Grenz C (1993) Does chlorophyllide a reduce reliability of chlorophyll a mea- surements in marine coastal sediments? Aquat Sci 55: 19-30
Platt T. Gallegos CL, Harrison WG (1980) Photoinhibition of photosynthesis in natural assemblages of marine phyto- plankton. J Mar Res 38687-701
Platt T, Sathyendranath S. Ravindran P (1990) Primary produc- tion by phytoplankton: analytic solutions for daily rates per unit area of water surface. Proc R Soc Lond 241:lOl-111
Post AF, Dubinsky Z, Wyman K , Falkowski PG (1984) finetics of light-intensity adaptation in a marine planktonic diatom. Mar B101 83:231-238
Powell TM, Cloern JE, Huzzey LM (1989) Spatial and tempo- ral variability in south San Francisco Bay (USA) I . Hori- zontal distributions of salinity, suspended sediments, and phytoplankton biomass and productivity. Estuar Coast Shelf Sci 28583-597
Ralston KL, Jennrich RI (1978) DUD, a derivative-free algo- rithm for nonlinear least squares. Technometrics 20:7-14
Randall JM, Day JW (1987) Effects of nver discharge and ver- tical circulation on aquatic primary production in a turbid Louisiana (USA) estuary. Neth J Sea Res 21:231-242
Riaux-Gobin C, Llewellyn CA, Klein B (1987) Microphytoben- thos from two subtidal sediments from North Brittany. 11. Variations of pigment compositions and concentrations determined by HPLC and conventional techniques. Mar Ecol Prog Ser 40:275-283
Shaffer GP, Sullivan MJ (1988) Water column productivity attributable to displaced benthic diatoms in well-mixed shallow estuaries. J Phycol24:132-140
Sinclair M, Chanut JP, El-Sabh M (1980) Phytoplankton dis- tributions observed during a 31/2 days fixed-station in the lower St. Lawrence Estuary. Hydrobiologia 75129-147
Sloth NP, Riemann B, Nielsen LP, Blackburn TH (1996) Resilience of pelagic and benthic microbial communities
This article was submitted to the editor
to sediment resuspension in a coastal ecos:.tstem, Knebel Vig, Denmark. Estuar Coast Shelf Sci 42:405 115
Sullivan MJ, Moncrieff CA (1988) Pr~mary production of edaphic algal communities in a Mississippi salt marsh. J Phycol24:49-58
Sun MY, Aller RC, Lee C (1994) Spatial and ten~poral distrib- utions of sedimentary chloropigments as t~enthic pro- cesses in Long Island Sound. J Mar Res 52:149-176
Talling JF (1957) The phytoplankton population as a com- pound photosynthetic unit. New Phytol56:133-149
Vincent WF, Bertrand N, Frenette J J (1994) Photoadaptation to intermittent light across the St. Lawrence freshwater- saltwater transition zone. mar Ecol Prog Ser 110:283-292
Vincent WF, Neale PJ, Richerson PJ (1984) Photoinhibition: algal responses to bright light during die1 stratification and mixing in a tropical alpine lake. J Phycol 20:201-211
Walker TA (1981) Dependence of phytoplankton chlorophyll on bottom resuspension In Cleveland Bay, northern Queensland. Aust J Mar Freshwat Res 32:981.-986
Walmsley RD, Butty M, Van Der Peipen H, Grobler D (1980) Light penetration and the lnterrelationships between optical parameters in a turbid subtropical ~mpoundment. Hydobiologia 70: 145-157
Whitledge TE (1989) Data synthesis and analysis. Nitrogen processes study (NIPS): Nutrient distributions and dynam- ics in Lavaca. San Antonio and Nueces/Corpus Christi Bays in relation to freshwater inflow. Part 11: Hydrography, nutrient and chlorophyll data tables. University of Texas Marine Science Institute Technical Report No. TR/89-007 University of Texas. Port Aransas
Yallop ML, de Winder B, Paterson DM, Stal LJ (1994) Com- parative structure, primary production and biogenic stabi- lization of cohesive and non-cohesive marine sediments inhabited by microphytobenthos. Estuar Coast Shelf Sci 39:565-582
Zimmerman RC, SooHoo JB, Kremer JN, D'Argenio DZ (1987) Evaluation of variance approximation techniques for non-linear photosynthesis-irradiance models. Mar Biol 95:209-215
Manuscript first received: January 31, 1995 Revised version accepted: September 11, 1996