primary care division operational plan - ireland's … · 2017 primary care division...
TRANSCRIPT

Draft
2017
Primary Care Division Operational Plan


Contents
Introduction....................................................................................................................1
Building a Better Primary Care Service.........................................................................4
Finance..........................................................................................................................7
Workforce......................................................................................................................10
Primary Care Service Delivery......................................................................................12
Appendices
Appendix 1: Financial Tables..................................................................................32
Appendix 2: HR Information....................................................................................37
Appendix 3: Primary Care Scorecard and Performance Indicator Suite ................39
Appendix 4: Capital Listing.....................................................................................75

2017 Primary Care Division Operational Plan Page 1
Introduction The Primary Care chapter of the 2017 National Service Plan (NSP) sets out the key priorities and volume of primary care, social inclusion, palliative care and primary care reimbursement services (PCRS) to be provided in 2017, within the funding available. It also seeks to align our priorities to the Corporate Plan 2015-2017 and priorities of the Minister for Health and Government as set out in A Programme for a Partnership Government. The development of primary care services is a key element of the overall Health Reform Programme. A decisive shift to primary care in the Irish health system is required to bring about improvements to the health and wellbeing of the population and better integrated health services. The key objective is to achieve a more balanced health service by ensuring that the vast majority of patients and clients who require urgent or planned care are managed within primary and community based settings, while ensuring that services are:
Safe and of the highest quality
Responsive and accessible to patients and clients
Highly efficient and represent good value for money
Well integrated and aligned with the relevant specialist services. Primary Care division services include primary care teams (PCTs), community healthcare network services, general practice, schemes reimbursement, social inclusion and palliative care services; reference to primary care throughout this plan includes reference to all of these services. In addition to setting out our priorities and volume of services in the NSP, this 2017 Primary Care Operational Plan sets out supporting demographic information, further actions and data/metrics to demonstrate that we will work to provide services that better meet the needs of people who depend on them. We will also:
Focus on supporting our staff who are fundamental to delivering primary care services across the country.
Describe the financial framework that supports the plan.
List the performance indicators and supporting metrics against which performance will be measured.
The NSP is supported by the Performance and Accountability Framework, the focus of which is on recognising good management and outcomes while continually improving performance within primary care, social inclusion, palliative care and PCRS services. This Framework, which has been adopted by the HSE Directorate, sets out how the HSE, including Primary Care (and all managers within Primary Care) will be held to account for their performance in relation to the Quality and Safety of services, Access to services and managing within the Financial and Human resources available.
Health Challenges that impact on services include:
Primary Care Following the implementation of policies to widen access to primary care services, 46.4% of the population now have access to either a GP visit card or a medical card. This compares with 41.4% at the start of 2015. The number of long term illness scheme patients has increased by 87% since 2014. In the case of

2017 Primary Care Division Operational Plan Page 2
diabetes mellitus for example, the number of claimants increased by 40,446, doubling the number of claimants with this illness. Social Inclusion There is a strong link between poverty, socio-economic status and health. Mental and physical health problems can be both a cause and consequence of homelessness and social deprivation. Disadvantaged groups within the population carry a disproportionate burden of mental and physical ill-health and disability, with consequent high health service utilisation and health and social care costs. Palliative Care With population ageing, the need for palliative care services is growing and will challenge existing capacity: for example, patients experiencing end-of-life with cancer alone are projected to increase by 5.8% and 23% in 2017 and 2022 respectively. Priorities for 2017 include:
Improving quality, safety, access to and responsiveness of primary care services to support the decisive shift of services to primary care
Improving health outcomes for the most vulnerable in society including those with addiction issues, the homeless, refugees, asylum seekers, Traveller and Roma communities
Improving access, quality and efficiency of palliative care services
Reimbursing contractors in line with health policy, regulations and within service level arrangements governing administration of health schemes
Processing applications for eligibility (under the PCRS) within agreed timelines
Strengthening accountability and compliance across all services and reviewing contractor arrangements.
Children First
The Children First implementation plan sets out key actions to ensure compliance with Children First legislation and national policy. Under legislation, the HSE and funded organisations providing services to children and young people are required to undertake an assessment of risk and to use this risk assessment to develop and publish a Child Safeguarding Statement. The Safeguarding Statement also outlines how staff/volunteers will be provided with information to identify abuse which children may experience outside of the organisation, and what they should do with concerns about child safety. In 2017, high level actions include the implementation of Children First plans by CHOs and Hospital Groups with support from the Children First National Office; and the delivery of Children First training programmes for HSE staff and HSE funded organisations. Child protection policies at CHO and Hospital Group level will also be developed and reports tracked and monitored by the Children First office. Children First compliance will also be included in the performance assurance process.
Risks to the delivery of the Primary Care Operational Plan
Service Demand The increasing demands for primary care services which are often beyond funded levels.
Paybill Management Control over pay and staff numbers to funded levels remain a priority while seeking to ensure recruitment and retention of highly skilled and qualified staff. The impact of continued Paybill Management in Primary Care in 2017 will be evident in certain areas– e.g. access waiting times for

2017 Primary Care Division Operational Plan Page 3
physiotherapy, occupational therapy, ophthalmology, audiology, dietetics, podiatry etc and in relation to dental services.
Paediatric Home Care Packages Maintaining complex paediatric home care packages to funded levels in the face of increasing demand and a pattern of earlier discharge from acute facilities is a particular challenge.
Homelessness The phased approach on a multi annual basis to the Homeless Action Plan will restrict the scale of additional activity in 2017.
National Virus Reference Laboratory (NVRL) The review of NVRL governance and activity referrals will represent a key challenge in order to maintain safe levels of service within the available funding.
New Drugs Capacity to meet the demand for new drug therapies within funded levels continues to be a significant challenge.
Primary Care Reimbursement Service (PCRS) The scale of financial management required within PCRS in line with the numbers availing of schemes, including medical cards is a challenge due to the demand led nature of eligibility.
Signed
John Hennessy
National Director
Primary Care

2017 Primary Care Division Operational Plan Page 4
Building a Better Primary Care
Service Introduction
Primary care continues on a programme of service improvement and reform with the 2017 priorities set out througout this plan. Building a Better Health Service sets out some of the strategic approaches being developed to better meet the needs of people who use primary care services. In 2017, we will aim to finalise the review of the GP Contract along with the priorities and actions arising from this, and continue to implement the organisational priorities as set out below.
Improving the quality and safety of our services
Every person who uses our services should receive a safe service which is person-centred and of high quality. We will engage with the three-year National Safety Programme and the implementation of safety priorities and intiaitives including the following:
Develop the capacity of the Community Healthcare Organisations (CHOs) to manage safety, risk and improve quality including implementing the Safety Programme priorities at service level.
Plan, oversee and ensure clinical leadership for targeted safety initiatives in areas such as the deteriorating patient, early warning systems and clinical handover, medication safety, pressure ulcers, falls prevention, healthcare associated infection (HCAI) and the implementation of related National Clinical Guidelines and Standards for Clinical Practice Guidance.
Implement the new National Standards for the Conduct of Reviews of Patient Safety Incidents 2016, continuing to build the organisation’s capacity to manage safety incidents including serious reportable events. This will include the development and implementation of enhanced approaches to the review of these incidents and will be supported by the further roll-out of the Open Disclosure Policy.
Implement the revised Integrated Risk Management Policy 2016.
Strengthen the accountability for safety, risk and quality by building capacity for gathering and analysing safety information and audit, including clinical audit.
Implement the Framework for Quality Improvement with a particular focus on working with front line staff on innovative ways to improve care and, strengthening engagement with patients and families to ensure services are focused on their needs.
Learn from feedback provided by patients and service users.
Building a Better Health Service
Improving the health and wellbeing of the population
Life expectancy in Ireland has increased and is above the EU average at 83 years for a woman and 79 years for a man. People are living longer through advances in medicine, technology and improved models of care. The population will grow by 34,800 (0.7%) people between 2016 and 2017. The Healthy Ireland Framework sets out a vision for how people can live fulfilled lives and be as healthy as they can. In 2017 we will:
Continue to assess the health needs of the population as part of designing services to promote good physical and mental health.
Integrate illness prevention, early detection and self-management as part of models of care.

2017 Primary Care Division Operational Plan Page 5
Implement programmes to reduce the burden of chronic disease by promoting an increase in active living, positive ageing and positive mental health, healthy eating and reductions in smoking levels and alcohol consumption.
Deliver Healthy Ireland actions in services through implementation plans for CHOs.
Providing care in a more integrated way
Our aim is to provide a primary care service which is available to people where they need it and when they need it and to provide people with the best outcomes that can be achieved. The clinical and integrated care programmes are central to this approach, and clinical leadership is at the core of reform and service improvement to support better health outcomes. In 2017 we will:
Continue to implement integrated care programmes for chronic disease prevention and management, older people, children and patient flow.
Continue to work with patients, medical colleges, nursing and therapy leads to develop and implement processes that will improve the way care is provided.
Engage with GPs in relation to the review and updating of the GP contract.
Health Service Improvement
Primary care services are provided across the country in general practice, urban primary care centres and smaller local health centres. It is essential that primary care services are organised in a way that ensures they are capable of responding to the needs of these communities. Decision-making and accountability is being devolved as close as possible to front line services through the development of CHOs. The Programme for Health Service Improvement is key to enabling a more integrated care delivery model. Appropriately trained programme management staff, expert specialist support and direct project management support for the health service improvement programme of work will be put in place. This is aligned with the change management programme for national functions under the Centre Transformation Programme and supported by interconnected development programmes within human resources, eHealth, finance, communications, health business service and quality and safety services. In 2017 actions across the health system and within the health service improvement programme will:
Support the decisive shift of service to primary care and associated strengthening of primary care teams and networks.
Progress the implementation of the Hospital Groups, CHOs, the Centre Transformation Programme, National Ambulance Service and enabling service programmes.
Develop structures and processes for Hospital Groups, CHOs, National Ambulance Service and the National Centre reflecting the developing accountable and autonomous nature of these organisations.
Support the development and implementation of the Patient Safety Programme.
Support local service improvement programmes, prioritising quality and patient safety and implementing integrated models of care.
Develop programme offices in each of the service delivery organisations which will provide local implementation support to the integrated care programmes. In addition it will support other strategic programmes including quality and safety, eHealth Ireland, service specific improvement programmes, including the Emergency Department (ED) Task Force and the Performance and Accountability Framework improvement programmes.
Continue to develop the way in which the corporate ‘centre’ relates to Hospital Groups, CHOs, PCRS and the Ambulance Service. This will be achieved through the development of an operating

2017 Primary Care Division Operational Plan Page 6
model, at the heart of which will be a comprehensive ‘commissioning’ cycle aimed at empowering, resourcing and supporting the delivery of quality services.
Developing a performing and accountable primary care service
There will be a focus on improving the performance of services and accountability in relation to Access and the Quality and Safety of those services, and doing this within the financial resources available. With the goal of improving services, the Performance and Accountability Framework sets out the means by which the HSE and in particular services including Primary Care and individual managers are held to account for their performance. In 2017 we will:
Implement the HSE’s Performance and Accountability Framework, including strengthened processes for escalation, support and intervention in underperforming service areas.
Measure and report on performance against the key performance indicators (KPIs) set out in the NSP as part of the monthly performance reporting cycle.
Strengthen and oversee the HSE’s Governance Framework with funded section 38 and section 39 agencies through the Compliance Unit and strengthen the management of the HSE’s relationship with its funded agencies at CHO and Hospital Group level.
Develop data gathering, reporting processes and systems to support the Performance and Accountability Framework.
Developing business supports and infrastructure
The Health Business Services will continue to grow and develop using a shared model of delivery for a range of critical business support services to both the statutory and voluntary sectors (funded under section 38 / section 39 of the Health Act 2004). This best practice approach drives value for money, efficiency, compliance and service quality objectives and will maximise the use of digital opportunities. Primary Care service improvement is supported through the continuing development of infrastructure. In addition to the ongoing infrastructural programme in 2017 we will continue the development of new primary care centres and address backlogs in replacement and upgrading of existing facilities.
Implementing eHealth Ireland
A modern primary care health service will depend upon high quality information and digital technology. A Knowledge and Information Plan was published to support implementation of the eHealth Ireland strategy with the objectives of:
Knowing our patients: by providing access to data when and where it is legitimately needed most, to identify what is happening and predict what will happen next.
Engaging the population: by connecting patients to their care teams to better manage care delivery and engage people individually in their health and wellbeing.
Managing our services: by putting data into action to improve outcomes, manage demand and optimise service delivery, maximising value and better service delivery.
The 2017 priority list of Primary Care ICT Reform Projects is set out in the service delivery chapter.

2017 Primary Care Division Operational Plan Page 7
Finance
Budget 2017 versus budget 2016
The 2017 divisional allocation is €3,828.2m compared with an opening 2017 budget of €3,781.3 million. This represents a €46.9m (1.24%) increase in funding. The Department of Health is holding a further €21.5m of development funding for 2017.
Additional funding was received in 2016 to deal with cost pressures as follows:
€4m Local demand led schemes.
€125m PCRS.
This funding is reflected in the opening base budget for 2017. In 2016, the Division supported base funding deficits with time related savings across a number of pay and non pay headings. However, in 2017 the necessity to continue to apply tight cost control and achieve savings through improved models of care and procurement initatives will be a critical component in delivering a balanced budgetary position.
Existing level of service (ELS)
Funding was received to support existing level of services and provide for some additional growth in 2017 as follows:
€10m funding for pay cost pressures.
€11m funding for non-pay core services.
€3m funding for local demand led schemes.
A significant portion of the ELS funding is required to cover costs of medical and surgical supplies and the demand led costs associated with paediatric home care packages.
Primary Care Social Inclusion Palliative Care Local DLS PCRS Total
€m €m €m €m €m €m
Budget 2016 764.8 127.1 72.8 242.6 2417.1 3624.4
Income Defict Funding 4 125 129
Once off Adjustments and release of Held Funding 8.8 2.8 2.8 13.5 27.9
Opening Base Budget 2017 773.6 129.9 75.6 246.6 2555.6 3781.3
Full year costs of 2015 Developments 3 3
Expected Level of Service Funding 10.6 0.4 3 -10.1 3.9
Pay cost pressures 8.9 0.4 0.5 0.2 10
Funding to Expand existing Developments 7 1.5 8.5
29.5 0.4 0.9 3 -8.4 25.4
Primary Care Division Budget allocated 2017 803.1 130.3 76.5 249.6 2547.2 3806.7
Funding Held by Department of Health 5 3 13.5 21.5
Primary Care Division Budget Received 2017 808.1 133.3 76.5 249.6 2560.7 3828.2
Increase versus opening Base 34.5 3.4 0.9 3 5.1 46.9
% Change 4.46% 2.62% 1.19% 1.22% 0.20% 1.24%
2017 Primary Care Division - Net Expenditure Allocations

2017 Primary Care Division Operational Plan Page 8
Notwithstanding the additional funding received there an estimated unfunded pay requirment of €5.383m across a number of pay elements of which €2.590m comprises increments.
Non-pay and demographic related costs
The key elements of non-pay cost in 2017 for primary care continue to be medical and surgical supplies, primary care lease costs including IT costs associated with previously commissioned centres, and paediatric home care packages.
Additional funding has been allocated to support growth in these services. The full year cost has also been provided for the opening of Kerry Hospice beds.
€7m funding to expand existing developments.
€3m developments (Including Kerry Hospice).
Funding held by the Department of Health
The Department of Health is holding additional funding in respect of the Primary Care division for developments in relation to Prescrition charges, GMS and Social Inclusion measures.
Furthermore, Primary Care will work with Mental Health to jointly implement the development plan for pyschology services and homeless initatives with funds provided in the 2016 Service Plan.
€5m – Psychology services.
€2m - Homeless services.
Clinical Strategies and Programmes hold a further €1.5m of funding to address a number of homeless services initatives.
Approach to financial challenge in 2017
Given the underlying base funding pressures (which were offset by time related savings in 2016) and the shortfall in the pay requirement, the 2017 budgetary environment will be challenging. The requirement to adhere to a balanced pay budget will continue to be a critical component to deliver an overall balanced position in 2017 and will require an extension of pay control measures currently in place across a number of CHO areas. Efforts to eliminate or reduce agency will continue to deliver savings and we will encourage and support service improvement initiatives that maximise throughput across therapy disciplines in a safe and effective manner.
A number of value for money initatives are at an advanced stage across the local demand led cost headings and it is expected that the associated procurement and process improvement initatives will assist in controlling cost growth across this heading in 2017. However significant volume growth across these headings, particulary in an environment where the primary care division is supporting earlier discharge and care in the community, will likely result in upward pressure on these cost headings.

2017 Primary Care Division Operational Plan Page 9
Exceptional cost pressures
PCRS supports the delivery of a wide range of primary care services to the general public through 7,000 primary care contractors across a range of community health schemes. The PCRS budget for 2017 has been framed by reference to a series of working assumptions which have been developed in detailed discussions with the Department of Health and Department of Public Expenditure and Reform. As the wide range of services provided to the public by PCRS is of a demand-led nature, the budget allocation presents challenges for maintaining existing levels of service within funded levels.
Costs related to new drugs and medicines or new indications for existing medications
Recent sectoral agreements have set out the framework under which new drugs can be introduced. We will work with other divisions to maximise the delivery of improved services, including the provision of new drugs within the overall funding provision. The HSE will indicate to the Department of Health the nature and extent of any interventions that it considers necessary in relation to the affordability of certain new drugs.

2017 Primary Care Division Operational Plan Page 10
Workforce Introduction
Primary care staff are at the forefront of healthcare delivery in the community. Recruitment, retention and appropriate allocation of human resources continue to be key objectives.
The health service has a workforce of over 105,000 who deliver care across the country, 365 days a year. The workforce for services under the remit of Primary Care account for 10,404 of the overall staff numbers.
The Health Service People Strategy
The People Strategy 2015-2018 was developed in recognition of the vital role our workforce plays in delivering safe better healthcare. It is a strategy that extends to the entire health sector workforce and managers at all levels. The strategy is underpinned by a commitment to engage, develop, value and support our workforce. Alongside the strategy are work plans across the eight priority areas: Leadership and Culture, Staff Engagement, Learning and Development, Workforce Planning, Evidence and Knowledge, Performance, Partnering and Human Resource Professional Services. In 2017, these work plans will be further developed and rolled out, with particular focus on performance achievement, leadership development and e-HRM, in addition to the work plans already commenced in 2016.
Pay and Numbers Strategy 2017 and funded workforce plans
The Pay and Numbers Strategy 2017 is a continuation of the strategy that was approved in July 2016, central to which is compliance with allocated pay expenditure budgets to ensure effective allocation and deployment of available resources. Overall pay expenditure, which is a made up of direct employment costs, overtime and agency will continue to be monitored, managed and controlled. This will ensure compliance with allocated pay budgets as set out in the annual funded workforce plan at divisional and service delivery unit level that are required to:
Take account of any first charges in pay overruns that may arise from 2016
Operate strictly within allocated pay frameworks, while ensuring that services are maintained to the maximum extent and that service priorities determined by Government are progressed
Comply strictly with public sector pay policy and the code of practice for public sector appointments
Identify further opportunities for pay savings to allow for re-investment purposes in the health sector workforce and to address any unfunded pay cost pressures.
Pay and staff monitoring, management and control at all levels will continue to be an area of significant focus for primary care in 2017, in line with the Performance and Accountability Framework. Early intervention and effective plans to address any deviation from the approved funded workforce will be central to maximising full pay budget adherence at the end of 2017. There will be a continuous review of the cost and reliance on agency staff to ensure that the level used is appropriate to meet the needs of service delivery and that agency use is reduced or service need met by recruitment of staff paid directly when this is suitable.

2017 Primary Care Division Operational Plan Page 11
Within primary care, particular attention will be paid to the further development and implementation of measures to support the recruitment and retention of nursing and midwifery staff in light of identified shortages in particular areas.
Attendance Management
Primary Care will continue to actively monitor and manage the Attendance Management Framework towards achieving the management target of ≤3.5%.

2017 Primary Care Division Operational Plan Page 12
Primary Care Service Delivery

2017 Primary Care Division Operational Plan Page 13
Cross cutting priorities
A multi-year system-wide approach The following system wide priorities will be delivered across the organisation.
Promote health and wellbeing as part of
everything we do
Implement measures outlined in the ‘Healthy
Ireland in the Health Service Implementation
Plan 2015–2017’.
Implement actions in support of priority
programmes for tobacco, alcohol, healthy
eating, active living, healthy childhood,
sexual health, positive ageing and wellbeing
and mental health.
Progress implementation of Making Every
Contact Count.
Implement Connecting for Life.
Increase support for staff health and
wellbeing.
Quality, safety and service improvement
Implement integrated care programmes, with
an emphasis on chronic disease and frail
elderly.
Implement priorities of the national clinical
programmes.
Implement the Safety Programme initiatives
including those for HCAI and medication
safety.
Implement the HSE’s Framework for
Improving Quality.
Measure and respond to service user
experience including complaints.
Carry out patient experience surveys and
implement findings.
Continue to implement open disclosure and
assisted decision-making processes.
Implement Safeguarding Vulnerable Persons
at Risk of Abuse – National Policy and
Procedures.
Report serious reportable events and other
safety incidents and undertake appropriate
reviews or investigations of serious incidents.
Implement programmes of clinical audit.
Implement National Clinical Effectiveness
Guidelines.
Continue to implement the National
Standards for Safer Better Healthcare.
Carry out the Programme for Health Service
Improvement.
Put Children First legislation into action.
Implement eHealth Ireland programmes.
Finance, governance and compliance
Implement the HSE’s Performance and
Accountability Framework.
Comply with governance arrangements for
the non-statutory sector.
Implement and monitor internal and external
audit recommendations.
Progress the new finance operating model
and further embed activity based funding.
Implement the Protected Disclosures
legislation.
Put in place standards / guidelines to ensure
reputational and communications
stewardship.
Workforce
Implement the 2017 priorities of the People
Strategy.
Implement the Pay and Numbers Strategy
2017.
Carry out a staff survey and address findings.
Progress the use of appropriate skill mix
across the health service.

2017 Primary Care Division Operational Plan Page 14
Primary Care 2017 Operational Plan Actions to support Service Plan Priorities
Priority Actions Target Q
Primary Care
Improve quality, safety, access and responsiveness of primary care services to support the decisive
shift of services to primary care
Deliver integrated care programmes for chronic disease prevention and management in primary care Q3
Operational Plan Actions
Support the implementation of the Chronic Disease Framework.
Respiratory
Progress the implementation of the respiratory integrated care projects utilising the 6 Clinical Nurse Specialists (Respiratory) and 6 Senior Physiotherapists approved in 2016. - CHO 1 – Senior Physiotherapist (1) and Integrated Care Clinical Nurse Specialist (1). - CHO 2 – Senior Physiotherapist (2) and Integrated Care Clinical Nurse Specialist (2). - CHO 5 – Senior Physiotherapist (1) and Integrated Care Clinical Nurse Specialist (1). - CHO 7 – Senior Physiotherapist (2) and Integrated Care Clinical Nurse Specialist (2).
Diabetes
Progress the implementation of the chronic disease integrated care projects utilising the 2016 approved posts for diabetes. - CHO 1 – Senior Dietitian (2). - CHO 2 – Senior Podiatrist (1), Integrated Care Clinical Nurse Specialist (1) and Senior Dietitian (2). - CHO 3 – Senior Podiatrist (1), Senior Dietitian (2) and Integrated Care Clinical Nurse Specialist (2). - CHO 4 – Senior Dietitian (2) and Integrated Care Clinical Nurse Specialist (1). - CHO 5 – Integrated Care Clinical Nurse Specialist (1), Senior Podiatrist (1) and Senior Dietitian (2). - CHO 6 – Senior Podiatrist (1), Senior Dietitian (2) and Integrated Care Clinical Nurse Specialist (1). - CHO 7 – Senior Podiatrist (2), Senior Dietitian (2) and Integrated Care Clinical Nurse Specialist (2). - CHO 8 – Senior Podiatrist (2) and Senior Dietitian (2). - CHO 9 – Senior Podiatrist (1), Integrated Care Clinical Nurse Specialist (1) and Senior Dietitian (2). - A national post (1) of Clinical Specialist Dietitian was also approved to support the above.
Heart Failure
Provide a structured approach to the diagnosis and care of heart failure patients in the primary care setting.
Progress the development of integrated care pathways between primary, secondary and tertiary care with prompt access to specialist opinion and diagnostics.
Heart Failure Virtual Consultation Service
Implement a virtual heart failure consultation service enabling outpatient referrals between the hospital and primary care.
Asthma and COPD Advice Line Service
Evaluate the 2016 asthma and COPD advice line service in collaboration with the Asthma Society of Ireland and COPD Support Ireland.
Q3
Q2
Q2
Q2
Q2
Q3
Strengthen and expand Community Intervention Team (CIT) / Outpatient Parenteral Antimicrobial Therapy (OPAT) services
Q2
Operational Plan Actions
Provide treatment for in excess of 32,000 referrals.
Strengthen governance and reporting of CIT services and ensure shared learning in relation to best practice.
Increase the number of patients supported and trained to self administer compounded IV antibiotics S-
Q1
Q2
Q2

2017 Primary Care Division Operational Plan Page 15
Priority Actions Target Q
OPAT.
Update CIT Guidance Document.
Prioritise CIT/OPAT services for audit, undertake audits and support CIT/OPAT services to put in place quality improvement programmes to address audit findings.
Identify outcome measures to assess the impact of CIT care.
Establish collection systems for OPAT data.
Q1
Q2
Q2
Q2
Consolidate the provision of ultrasound and minor surgery services in primary care sites and expand provision of direct access to x-ray services within existing resources
Q4
Operational Plan Actions
Consolidate provision of minor surgery by GP Surgeons providing 15 minor surgery procedures.
Expand minor surgery sites subject to resources.
Consolidate and expand primary care ultrasound service: Provide 16,640 ultrasounds across the following primary care sites:
1. Kenmare Primary Care Centre – 780. 2. Ballyheigue Health Centre – 780. 3. Mallow/Cork Site – 4,420. 4. St Camillus Hospital, Limerick – 2,080. 5. Galway (East) Primary Care Centre – 2,340. 6. Castlebar Primary Care Centre – 1,820. 7. Roscommon Primary Care Centre – 780. 8. Sligo Primary Care Centre – 1,300. 9. Letterkenny Primary Care Centre – 2,340.
See all urgent referrals within 5 days of referral.
See all routine referrals within 10 days of referral.
Monitor onward referral rates to a hospital setting for further radiological / medical investigations.
Evaluate the 2015-2016 ultrasound initiative to inform service planning and improvement. Expand provision of direct access to x-ray services within existing resources:
Support and expand existing community x-ray schemes in Donegal and Kerry.
Trial local solutions to increase GP Direct Access to X-Ray services.
Q2
Q2
Q4
Q2
Q1
Q3
Strengthen governance arrangements to support packages of care for children discharged from hospital with complex medical conditions to funded levels
Q4
Operational Plan Actions
Support 514 packages of care for children discharged from hospital with complex medical conditions.
Agree and implement a protocol for discharge planning for children with complex medical conditions.
Agree and implement a clinical and service assessment tool for children with complex medical conditions.
Finalise, in collaboration with the Office of the Nursing and Midwifery Services Director, a training programme for HSE and provider nursing and health care assistant staff working with children with complex medical conditions.
Undertake a quality assurance review of home care packages in place for children with complex medical needs.
Q4
Q2
Q2
Q3
Q2
Implement the recommendations of the GP Out of Hours, Primary Care Eye Services and Island Services Reviews
Q4
GP Out of Hours Review Report Operational Plan Actions
Implement, within existing resources, the recommendations from the GP Out of Hours Review 2016.
Implement recommendations for: - Future provision of GP Out of Hours services based on available evidence and value for money. - Performance and assurance oversight of GP Out of Hours services.
Develop an enhanced performance data set and key performance indicators.
Q3

2017 Primary Care Division Operational Plan Page 16
Priority Actions Target Q
Primary Care Eye Services Review Report Operational Plan Actions
Develop and agree an implementation plan to commence phased roll out of service model and care pathways – implementation plan will address workforce planning and capacity, training, communications, equipping and guidance on roll out of care pathways.
Provide change management / team training for CHO primary care eye team staff.
Develop eye care algorithms for GPs in relation to commonly presenting eye conditions in conjunction with the ICGP and GP Leads.
Oversee national procurement process for equipment and consumables.
Support Head of Contracts to agree updated eye care contracts.
Establish a new primary care eye team in South Dublin and expand the existing primary care eye team
in North Dublin.
Q1
Q2
Q4
Q4
Q4
Q4
Island Services Review Report Operational Plan Actions
Implement, on a phased basis, recommendations of the Island Services Review (expected January
2017).
Q3
Civil Registration Review Report Operational Plan Actions
Implement, on a phased basis and within existing resources, recommendations from the Civil
Registration Review Report.
Q4
Develop and implement integrated models of Hepatitis C treatment across community and acute settings, ensure that treatment is offered to all state-infected patients by the end of 2017
Q1-Q4
Operational Plan Actions
Monitor developments in therapeutic treatments and liaise with industry to achieve optimum value for money in drug procurement.
Provide treatment to approximately 1,600 patients including all state-infected patients across 10 sites in line with goal of eliminating Hepatitis C by 2026.
Develop a Hepatitis C Treatment Programme strategic plan in collaboration with the Programme Advisory Group.
Develop and implement performance metrics for all Hepatitis C treatment sites to drive treatment volume and monitor performance.
Devise strategies for the continued identification of patients for treatment and development of pathways to care.
Review prioritisation and selection criteria of patients for treatment through the National Hepatitis C Treatment Programme Clinical Advisory Group.
Continue development and implementation of the National Hepatitis C Treatment Programme Communication Plan.
Develop the Hepatitis C registry to support continued planning of treatment for the duration of the National Hepatitis C Treatment Programme.
Develop the Hepatitis C registry to support the provision of clinical information on patient outcomes to the National Hepatitis C Treatment Programme.
Develop and implement improved infrastructural support to the Hepatitis C Registry.
Q1-Q4
Progress the recommendations of the national clinical guidelines on Hepatitis C screening (when published) within available funding
Q4
Operational Plan Action
Interface with all Hepatitis C initiatives to improve surveillance, screening, education and ensure that pathways to care are based on the National Clinical Guidelines on Hepatitis C screening.
Q4
Improve waiting times for therapy services by implementing a revised model of care for children’s speech and language therapy services and psychology services and develop new models for physiotherapy, occupational therapy and lymphodema services
Q4
Operational Plan Actions

2017 Primary Care Division Operational Plan Page 17
Priority Actions Target Q
Conclude recruitment of 83 WTEs (75 SLT WTEs and 8 Grade 3 WTEs) for implementation of speech and language therapy service improvement initiatives across CHOs, focussing on children/young people.
Agree and commence implementation of the revised model for children’s speech and language therapy services.
Provide in excess of 100,000 additional speech and language assessment/therapy appointments as part of the 2016 service improvement initiative.
Implement revised model for primary care psychology service, utilising 2016 approved funding (as per actions set out below).
Convene governance groups to develop and agree revised models for primary care physiotherapy and occupational therapy services to include development and agreement of care pathways, workforce planning and implementation plan.
Develop and agree a standardised model of care for lymphodema services including the supply and reimbursement of compression garments.
Q2
Q1
Q4
Q3
Q1
Q3
Implement the mental health and primary care initiative to enhance counselling services with a focus on enhanced counselling interventions for children and adolescents
Q4
Operational Plan Actions
Roll out the revised psychology service model with a focus on children and adolescents.
Recruit 114 assistant psychology posts to deliver rapid access low intensity psychological interventions for young people. These posts will deliver stepped care and will result in high throughput for young people with mild to moderate mental health problems.
Recruit 20 staff grade psychology posts for services for children in geographical areas where there are inadequate numbers of posts in place. These posts will provide the necessary governance framework to oversee the stepped care provision of Assistant Psychologists.
Provide a computerised cognitive behavioural therapy programme for young people which will be adapted from the work already completed for the programme for adults.
Q4
Improve access to children’s oral health services and improve access to orthodontic services for children
Q2
Operational Plan Actions Oral health and orthodontics
Establish a clinical oversight group to advise on clinical standards in HSE funded primary dental services.
Implement targeted screening for areas that do not have access for 11-13 year olds to ensure national equity.
Provide treatment for 11-13 year old children in all CHO areas, prioritising public dental health i.e. fissure sealants.
Complete wave 2 – Fluoride and Caring for Children’s Teeth (FACCT) fieldwork.
Develop a communication action plan to support implementation of antimicrobial guidelines in dentistry.
Implement the SMILES programme for under three year olds in CHO 4.
Continue the waiting list initiative for children’s orthodontic services for ‘long-waiters’ by reducing the waiting list to three years or under.
Continue the training of orthodontic therapists and liaise with HR to introduce the grade of orthodontic therapist based on the evaluation of the current scheme.
Q1
Q2
Q3
Q1
Q3
Q4
Q4
Q1
Implement primary care actions aligned to the action plan for healthcare associated infections (HCAI) in line with new governance arrangements (resource neutral) and ensure governance structures are in place in CHOs to drive improvement and monitor compliance for healthcare associated infections and anti-microbial (AMR) resistance targets
Q4
Support Ireland’s Global Action Plan for Anti-Microbial (AMR) Resistance due to be published in 2017
Q4
Other Primary Care Services Operational Plan Actions
Policy on Access to Services for Children with a Disability or Developmental Delay
Complete implementation of National Policy on Access to Services for Children with a Disability or
Q4

2017 Primary Care Division Operational Plan Page 18
Priority Actions Target Q
Developmental Delay Care with children’s disability network teams as they are established.
Implementation of Dementia Strategy Operational Plan Action
Select sites and deliver the Primary Care Education, Pathways and Research in Dementia
(PREPARED) education programme to primary care teams in collaboration with the Dementia Office
and Social Care services.
Q4
Community Nursing Services Operational Plan Actions
Support initiatives from recent and forthcoming policy developments through engagement with the office
of the Chief Nursing Officer, Department of Health, including the roll-out of the Framework for Staffing
and Skill Mix for Nursing.
Develop a standardised template for use by all public health nursing staff to allow safe and quality assured administration of medications prescribed by medical practitioners.
Implement the Service Improvement Framework for Public Health Nursing/collaborative between the
Office of Nursing and Midwifery Services Director and Primary Care.
Q4
Quality and Safety Operational Plan Actions
Promote quality and safe services in line with the Framework for Improving Quality:
Support the roll out of the HSE Framework for Improving Quality in our Health Service.
Support leadership and quality improvement training for primary care management teams in collaboration with the Quality Improvement Division (QID), to include measurement for improvement.
Provide support and advice to CHOs on implementing the National Standards for Safer Better Healthcare.
Support the implementation of safety programmes such as pressure ulcers, HCAI, falls prevention and decontamination.
Risk Management: - Support the implementation of the new Risk Management Policy (2016) in collaboration with the
Quality Assurance and Verification Division (QAVD). - Work with management team to agree the management and monitoring of the risk register. - Collaborate with other divisions to agree a cross divisional approach to support a train the trainer
model for CHOs.
Support the development of the Incident Management Framework. - Participate in the co-design of the new incident management framework. - Collaborate cross divisionally to agree the training needs for the implementation of the framework. - Support the development of the train the trainer model for CHOs.
Collaborate with QAVD in the development of incident type specific tools. - Develop capability within primary care to report, investigate, disseminate and implement learning
from safety incidents. - Oversee that the recommendations of serious incidents escalated nationally are disseminated and
implemented. - Support the Incident Management System (NIMS) Steering Group work programme. - Review monthly/quarterly incident analysis reports to elicit key themes and trends. - Provide NIMS train the trainer and incident management training as required.
Q4 Q4
Q4
Q4
Q2
Q1
Q4
Q1 Q1 Q2
Q3
Q4
Q4 Q4 Q4
Develop necessary governance structures and processes to deliver services that are safe and provide good quality of care:
Support the development of the quality and safety structures and processes within CHOs in collaboration with QID.
Support the Primary Care Quality and Safety Committee in its oversight role for quality and safety.
Support implementation of the new Policy Procedure Protocol and Guideline (PPPG) Framework.
Support the work of the Clinical Effectiveness Committee.
Support the delivery of an education and training process for clinical audit within CHOs, in collaboration with QID.
Q4
Q4 Q4 Q2 Q4

2017 Primary Care Division Operational Plan Page 19
Priority Actions Target Q
Support learning through the development of the primary care quality and safety dashboard
Support the ongoing development of the primary care quality and safety dashboard.
Seek assurance from COs through the performance framework regarding quality and safety of services by reviewing the primary care quality dashboard, primary care risk registers, incidents, quality improvement plans and other quality information sources.
Q4 Q4
Support initiatives to develop a more person centred approach through the roll out of the primary care survey
Support CHOs in conducting patient experience surveys in primary care with roll out of the revised primary care patient experience survey tool, in collaboration with QID.
Support QID in the open disclosure handover plan to CHOs.
Q4
Q4
Assisted Decision Making
Support the Assisted Decision Making Steering Group and participate with the needs assessment workshops and the national consultation process on Assisted Decision Making.
Develop a primary care Assisted Decision Making implementation plan.
Q3
Q3
Implement Children First Initiatives and Support Operational Plan Actions
Provide e-learning reports to each CHO and hospital group with breakdown of the number of local staff who have completed e-learning programmes as a percentage of the total number trained.
Evaluate e-learning programme by way of focus groups.
Undertake random audits of check list returns to ensure compliance with Children First training requirements by HSE and funded services.
Develop training programmes for website, webinars and face to face (where clinically necessary).
Collaborate with University College Dublin on synergistic training (use of recording labs etc).
Provide advice and support to CHOs.
Q4
Q3
Q4
Q3
Q2
Q4
Improve Audiology Services Operational Plan Action
Develop and agree a policy on provision of upgrades and replacements for bone anchored hearing aid devices.
Develop a policy regarding the management of lost and beyond economically repairable devices (this includes hearing aids, BAHA, Middle Ear and Cochlear Implant processors).
Q3
Q3
ED Taskforce and Winter Planning
Provide primary care services to support hospital avoidance and early discharge including GP out of hours services, community intervention team services and aids and appliances.
Q4
Outpatient Services Operational Plan Actions
The Outpatient Services Performance Improvement Programme will develop referral pathways from primary care to outpatient services for orthopaedics, urology, dermatology, ENT and ophthalmology in collaboration with primary care, clinical programmes, health and well-being and other key stakeholders.
Q4
ICT Operational Plan Actions
Proceed with Phase 2 of electronic referrals, under the auspices of the eReferrals Governance Group.
Continue deployment of healthmail to priority areas, guided by the formal evaluation of the Healthmail service.
Complete accreditation of GP Practice Systems and continue to develop these systems in line with eHealth Ireland priorities so that they can serve the needs of patients, clinicians and integrated care programmes effectively.
Develop requirements for technology that is the best fit for mobile (clinical) workers in primary care and commence deployment of that kit to enable more efficient work practices and better access to information.
Continue to build on the work of ePrescribing for Primary Care completed in 2016 (Phase 1) and implement Phase 2 in 2017. This will also support the enhancement in value for prescribing/medications usage in primary care initiative. ePrescribing in Primary Care is also an essential building block for the summary care record being developed.
Support the procurement of a Quality Management Information System (QMIS).
Support electronic ordering by GPs, using Healthlink, for the Medical Laboratory Information System and GP access to electronic shared care records for the Maternal and Newborn Clinical Information
Q1-Q4

2017 Primary Care Division Operational Plan Page 20
Priority Actions Target Q
System (MN-CMS).
Develop specification requirements for the Primary Care activity metrics system and progress procurement of same.
Complete the upgrade of the Out of Hours (OoH) system for Donegal and support the review of the Out of Hours service from an IT perspective.
Progress the linking of contracted diagnostic system services provided by 3rd parties to NIMIS.
Support the Immunisation System Project team by providing Office of the CIO resource to enable that project to progress through the initiation phase.
An Addiction System will be developed to funding approval stage.
ICT Projects planned to go live in 2017 include:
Commence implementation of the Audiology System.
SPG Online System – Section 38 and 39 SLA management system.
CIT/OPAT referral portal.
Community Funded Schemes – IT support developed in 2016 to support the Winter Initiative will be developed for the overall management of aids and appliances.
Q1-Q4
Develop Individual Health Identifier (IHI) Project Operational Plan Actions
Procure and configure the IHI business application tool.
Implement the IHI business service.
Roll out the IHI to initial selected GPs.
Commence broader roll out to national systems, further GP and first hospital systems.
Q1 Q1 Q1 Q2
Healthy Ireland/Health and Wellbeing Cross Divisional Operational Plan Actions
Operational Plan Actions Healthy Ireland:
Implement relevant actions from Healthy Ireland in the Health Service Improvement Plan 2015-2017.
Support CHOs to develop and implement CHO plans for Healthy Ireland.
Q4 Q4
Policy Programmes:
Implement actions in support of policy priority programmes for tobacco, alcohol, healthy eating active living, healthy childhood, sexual health, positive ageing and wellbeing and mental health.
Q1-Q4
Improve immunisation rates:
Improve influenza vaccination rates amongst persons aged 65 years and over.
Improve influenza vaccination rates among staff in front line settings.
Increase the percentage of children who receive vaccines to the target percentages.
Support the implementation of the rotavirus and meningococcal B vaccination programmes within available resources.
Q1-Q4
Enhance child health services:
Complete planning and develop implementation plan for a revised child health model and Nurture Programme.
Roll out the Ages and Stages Questionnaire in the public health nursing services.
Q4
Q3
Breastfeeding:
Increase breastfeeding rates at the first PHN visit and at three months by the phased implementation of the Action Plan for Breastfeeding 2016 -2021.
Q4
Implement Tobacco Control Implementation Framework:
Release a further 5% of front line primary care staff, in each CHO, to attend brief intervention training on smoking cessation to support the routine treatment of tobacco addiction as a healthcare issue.
Display QUIT support resources in all appropriate services.
Ensure staff are aware of the QUIT campaign and refer patients/clients to QUIT and to other appropriate smoking cessation services.
Q4
Q4
Q4
A Healthy Weight for Ireland: Obesity Policy and Action Plan 2016-2025:
Support the planning for key initial actions under the A Healthy Weight for Ireland: Obesity Policy and Action Plan 2016-2025 including planning for the provision of enhanced community-based, weight
Q4

2017 Primary Care Division Operational Plan Page 21
Priority Actions Target Q
management programmes.
Staff Health and Wellbeing
Increase support for staff health and wellbeing.
Q4
Social Inclusion
Improve health outcomes for the most vulnerable in society including those with addiction issues, the homeless, refugees, asylum seekers, Traveller and Roma communities
Addiction Services
Improve access to addiction treatment services for adults and children, with a particular focus on services for the under 18s
Q4
Operational Plan Actions
Ensure that adults deemed appropriate for treatment for substance use receive treatment within one calendar month (National Drug Strategy, 2009-2016, Action 32).
Ensure that children deemed appropriate for treatment for substance use receive treatment within one week.
Q4
Q4
Implement the recommendations of the National Drugs Rehabilitation Framework Q4
Operational Plan Actions
Roll out the National Drugs Rehabilitation Framework to all HSE services, statutory bodies and the community and voluntary sector.
Develop capacity to support each CHO to deliver the National Drugs Rehabilitation Framework (including SAOR screening and brief intervention for problem alcohol and substance use).
Review services in all CHOs in relation to the person-centred care planning processes of the Drugs Rehabilitation Framework re assessment, key working and care planning.
Undertake a service users experience survey and address findings.
Train 778 staff on SAOR screening and brief intervention for problem alcohol and substance use.
Support the implementation of making every contact count.
Q4
Q2
Q2
Q3
Q4
Q4
Establish a pilot supervised injecting facility in Dublin Q2
Operational Plan Actions
Support the enactment of the legislation on the misuse of drugs.
Undertake a process to identify an appropriate service provider for a supervised injecting facility. This service will be supported by a robust organisational and clinical governance structure.
Establish a working group to make recommendations on programme design and governance structures.
Carry out a survey of service users views in relation to the practical operation of the facility.
Report on an operating model of best practice to include monitoring and evaluation.
Oversee the establishment of the supervised injecting facility in an appropriate location.
Q2
Q2
Q1
Q1
Q2
Q3
Expand access to naloxone to approximately 600 new clients Q4
Naloxone Operational Plan Actions
Expand access to naloxone by implementing remaining findings from Naloxone Demonstrator Evaluation Project and prescribing naloxone to approx 600 new clients.
Roll out training in all CHOs for administration of naloxone.
Strengthen the Quality Assurance Group by incorporating additional clinical expertise, regional representation, service users and families.
Q4
Q4
Q1
Increase access to buprenorphine naloxone, buprenorphine products Q3
Operational Plan Actions
Support the agreement of regulations to allow for the introduction of buprenorphine naloxone, buprenorphine products.
Establish a working group to progress increased access to buprenorphine naloxone, buprenorphine products.
Organise and deliver a training programme for addiction staff, level 2 GPs and pharmacists.
Q2
Q1
Q2

2017 Primary Care Division Operational Plan Page 22
Priority Actions Target Q
Undertake roll out of buprenorphine naloxone, buprenorphine products through addiction services and GPs nationally.
Q4
Provide 25 more addiction residential treatment beds and 142 additional treatment episodes Q2
Operational Plan Actions Tier 4 Residential Services
Commence unit cost study (cost per treatment episode) to determine base line.
Undertake a review of supply and demand for HSE funded Tier 4 residential services.
Contract with preferred providers, through service level agreement, the additional 142 treatment episodes.
Agree scope (HSE funded residential centres) and support the self audit.
Q1
Q2
Q2
Q1
Other Addiction Services Operational Plan Actions
Pharmacy Needle Exchange Operational Plan Actions
Implement the recommendations of the Evaluation Report for the Pharmacy Needle Exchange Programme.
Ensure the provision of pharmacy needle exchange matches demand in each CHO.
Undertake research on prevalence and the needs of clients who require equipment for image and performance enhancing drugs.
Develop integrated care pathways and referral pathways from pharmacy needle exchange to other agencies e.g. sexual health, blood borne virus testing.
Expand and monitor the provision of other paraphernalia i.e. foil within the pharmacy needle exchange programme to allow clients the option of smoking rather than injecting.
Q4
Q3
Q2
Q1
Q2
Clinical Programme for Co-Morbid Mental Illness and Substance Misuse
Develop, in collaboration with mental health, a clinical programme for co-morbid mental illness and substance misuse (dual diagnosis).
Q4
Hidden Harm
Launch of Guidelines and Strategic Statement on Hidden Harm.
Provide, in collaboration with Tusla, co-ordinated response to needs of children of problem alcohol and substance users.
Develop, in collaboration with Tusla, a joint training programme on hidden harm in the identified three practice sites (CHO 1, 7 and 8).
Develop and deliver, in collaboration with Tusla, a Train the Trainers Programme on Hidden Harm to HSE Addiction staff and Tusla staff in Q4 2017, for full roll-out in 2018.
Q2
Q2
Q3
Q4
National Standards for Safer Better Healthcare in Addiction Services
Continue self assessment against the Standards for Safer Better Healthcare.
Address priority gaps following assessment through quality improvement plans.
Q3 Q4
Homeless Services
Improve health outcomes for people experiencing or at risk of homelessness, particularly those with addiction and mental health needs by providing key worker, case management, general practitioner (GP) and nursing services
Q4
Operational Plan Actions
Provide supports including key working, case management, GP and nursing services, to address the complex and diverse health needs of homeless people through the Homeless Action Team(s) in each CHO area.
Review existing service arrangements with Section 39 service providers to ensure a stronger focus on addressing the health needs of homeless persons including the development of targets, outcomes, quality standards, enhanced monitoring and evaluation.
Ensure that the Discharge Protocol for Homeless Persons in Acute Hospitals and Mental Health facilities is developed and implemented in each CHO/Hospital Group.
Ensure the development of quality standards for homeless services, by the Dublin Regional Homeless Executive, the HSE Quality Improvement Division and Social Inclusion, are aligned with the National
Q4
Q2
Q2
Q3

2017 Primary Care Division Operational Plan Page 23
Priority Actions Target Q
Standards for Safer Better Health Care.
Implement the health actions set out in Rebuilding Ireland, Action Plan for Housing and Homelessness, on a phased basis, in order to provide the most appropriate primary care and mental health services to those in homeless services and improve their ability to sustain a normal tenancy
Q4
Operational Plan Actions
Provide the required health services to support the extended housing led approach to other urban areas, outside Dublin, focusing on rough sleepers and long-term homeless households (Action 1.13).
Improve mental health and primary care services by enhancing services within homeless accommodation and by providing in reach speciality primary care and mental health services (Action 1.15).
Address the rehabilitation needs of homeless people by ensuring the drug rehabilitation pathway is linked to sustainable supported tenancy arrangements as provided by the Local Authority (Action 1.16).
Q4
Q3
Q3
Traveller, refugees, asylum seeker and Roma communities Q4
Deliver targeted programmes to support Travellers to manage chronic conditions such as diabetes, asthma and cardiovascular disease
Q4
Operational Plan Actions
Complete roll out of education resource “small changes, big difference” and associated health promotion programmes across Traveller Health Units.
Train staff in Traveller Health Units on Connecting for Life so that it can be promoted, in a culturally appropriate manner, to members of the Traveller community.
Geomap Traveller Health Units, Traveller sites and align these with primary care and mental health catchment areas.
Commission a review of Traveller Health Unit actions and outcomes in relation to the National Standards for Safer Better Healthcare.
Undertake a review of the role of Traveller community health workers and identify issues in relation to sustainability of this workforce.
Conduct a financial audit of Traveller services receiving funding from the HSE.
Q2
Q2
Q2
Q3
Q1
Q2
Expand primary care health screening and primary care services for refugees, asylum seeker and Roma communities
Q4
Operational Plan Actions
Roll out a mobile health screening unit to facilitate access to basic health screening, GP and nursing services by marginalised groups, refugees, asylum seekers and Roma communities.
Implement health actions, within available resources, including provision of GP, nursing and mental health support services, to support the Irish Refugee Protection Programme including supports at emergency reception and orientation centres during the resettlement phase.
Launch HSE Intercultural Health Strategy and develop phased implementation plan.
Develop and pilot a vulnerability assessment tool in collaboration with the Mental Health for use in screening of asylum seekers and refugees.
Facilitate translation of health related materials for asylum seekers and refugees.
Review use of emergency multilingual aid and update as necessary.
Train a minimum of 2 staff in each CHO on intercultural awareness and practice in health and social care. On completion of training each CHO to develop a quality improvement plan incorporating the further roll out of this training.
Q1
Q4
Q3 Q3
Q2
Q2 Q4
Domestic, sexual and gender-based violence
Implement health related actions in line with National Strategy on Domestic, Sexual and Gender-based Violence 2016-2021
Q3
Operational Plan Actions
Implement, the phased 2017 prioritised, health related actions in line with National Strategy on Domestic, Sexual and gender-based Violence, 2016-2021, (Actions 1.500, 2.100 and 2.400 refer).
Train a minimum of 2 staff in each CHO in Domestic Sexual and Gender Based Violence on a train the
Q1
Q4

2017 Primary Care Division Operational Plan Page 24
Priority Actions Target Q
trainer basis. On completion of training, each CHO to develop a quality improvement plan incorporating further roll out of this training to frontline staff.
Develop culturally appropriate toolkits and guidance to support staff dealing with victims of domestic, sexual and gender based violence.
Q3
Other Vulnerable Groups Operational Plan Actions
Prevent and Combat Human Trafficking
Implement the phased health actions from the 2nd National Action Plan to Prevent and Combat Human Trafficking in Ireland.
Develop a plan to provide supports and appropriate health services for victims of human trafficking (Actions 23, 24 and 25).
Review current supports to victims of human trafficking as part of the overall efforts towards monitoring provision of services to victims of human trafficking and identify areas for improvement (Action 24).
Develop a strategy and action plan to develop awareness, and identify further supports for victims of trafficking. This strategy will inform the HSE contribution to the comprehensive policy document to be developed by the Department of Justice in respect of measures designed to provide assistance to victims of human trafficking (Action 23).
Q3
Q4
Q2
Q4
Lesbian, Gay, Bisexual, Transgender and Intersex (LGBTI)
Implement the Lesbian, Gay, Bisexual, Transgender and Intersex (LGBTI) Practice Policy in each CHO.
Complete roll out of transgender health training across CHOs in partnership with Transgender Equality Network Ireland.
Q2
Q4
Connecting for Life
Increase awareness of available suicide prevention and mental health services to priority groups including travellers by piloting STORM® (Skills Training on Risk Management) self-harm training in one Traveller Health Unit and within addiction services in two CHOs (3 and 4).
Q4
Support Community Development
Review existing community development (HSE and cross sectoral) services provided in CHOs and identify models of good practice.
Develop a HSE strategic plan for community development.
Q4
Palliative Care Services
Improve access, quality and efficiency of palliative care services
Increase the specialist palliative care bed numbers in CHO 4 Q1
Operational Plan Action
Open 15 bed specialist inpatient unit (hospice) at University Hospital Kerry. Q1
Implement the model of care for adult palliative care services Q4
Operational Plan Action
Commence the implementation the model of care for adult palliative care services.
Q4
Implement a standardised approach to the provision of children’s palliative care in the community Q3
Operational Plan Actions
Develop standards, protocols and pathways to ensure a standardised approach to the provision of children’s palliative care in the community.
Undertake a consultation process with all service providers.
Implement the standards agreed.
Q4
Q2
Q4
Other Palliative Care Operational Plan Actions
Eligibility Criteria Guideline Operational Plan Actions
Ensure patients with a primary non-cancer diagnosis have equal access to services as per the eligibility criteria guideline.
Monitor the data on patient diagnosis returned by services to ensure compliance with the eligibility criteria guideline.
Q2
Q3
Management of Cancer Pain Operational Plan Actions Q3

2017 Primary Care Division Operational Plan Page 25
Priority Actions Target Q
Implement the Clinical Effectiveness Committee (NCEC) approved clinical guidelines on the management of cancer pain and the management of constipation in palliative care patients.
Undertake a mid-year review of the utilisation of the guidelines and e-learning module within palliative care services.
Work with the Irish Cancer Society and Department of Health and UCD to conduct a one day survey on the impact and treatment of cancer pain and constipation in the eight Designated Cancer Centres.
Care of the Dying Adult in the Last Days of Life Operational Plan Actions
Support the development of the clinical guideline on ‘Care of the Dying Adult in the last days of life’.
Q4
Design and Dignity Grant Scheme Operational Plan Actions
Improve the physical environment for patients, families and staff through the Irish Hospice Foundation / HSE Design and Dignity Grant Scheme.
Commence the development of up to 12 projects e.g. mortuaries, family rooms and personal rooms with privacy in acute hospitals including maternity units.
Q3
Palliative Care Support Beds Review Operational Plan Action
Implement, on a phased basis, the 10 recommendations from the Palliative Care Support Beds Review.
Q4
Specialist Palliative Care Initiative in Nursing Homes Operational Plan Actions
Work in partnership with four nursing homes in CHOs 1 and 8 to ensure residents requiring palliative care can remain at home (nursing home), prevent inappropriate admissions to acute hospitals and enable people to return home as quickly as possible after a stay in hospital.
Pilot tele-mentoring educational support from Specialist Palliative Care to Nursing Homes (Project Echo).
Q3
Patient Charter Operational Plan Action
Integrate palliative care into the revised HSE Patient Charter and support QID in its implementation of the Charter within specialist palliative care services.
Q3
Engage with service users, service providers and staff in the ongoing development and monitoring of palliative care services Operational Plan Actions Adults:
Work with the All Island Institute for Hospice and Palliative Care to engage with the Voices4Care patient representative group to review palliative care key performance indicators / metrics.
Disseminate the findings from the Lets Talk About Report. Children:
Implement, on a phased basis, the recommendations contained in the evaluation report on the children’s palliative care programme launched in 2016.
Q3
Q2
Q4
National Standards for Safer Better Healthcare Operational Plan Actions
Work in partnership with the Palliative Care Quality Improvement Collaborative to support services to develop and implement their quality improvement plans.
Q3
Primary Care Reimbursement Service (PCRS)
Reimburse contractors in line with health policy, regulations and within service level arrangements
governing administration of health schemes
Implement Programme for a Partnership Government Priorities including:
Provide medical cards for children in receipt of Domiciliary Care Allowance. Q3
Reduce prescription charge for those over 70 years of age from €2.50 per item to €2 and reduce the monthly cap on prescription charges for those over 70 years of age from €25 to €20.
Q3
Extend access to free GP care for children aged up to 12 years subject to negotiations under the Framework Agreement (subject to legislative change).
Q4
Implement the provisions of the Framework Agreement on the Supply and Pricing of Medicines
including:
Realign downward the price of all qualifying medicines on the 1st July 2017. Q3

2017 Primary Care Division Operational Plan Page 26
Priority Actions Target Q
Reduce the price of patent-expired, non-exclusive, non-biologic medicines where first generic products become available.
Q4
Reduce the price of patent-expired, non-exclusive, biologic medicines where first biosimilar products become available.
Q4
Collect the rebate of 5.25%, as provided for in the Agreement. Q4
Operational Plan Actions
Extend PCRS reimbursement arrangements to hospitals to medicines provided under local demand led
schemes.
Q1
Extend online processing to dentists and clinical dental technicians. Q2
Improve quality assurance by developing and expanding the PCRS quality assurance function Q4
Operational Plan Actions
Issue revised medical card application form, with suite of correspondence reviewed by National Adult Literacy Agency.
Mitigate data protection breaches with the support of the cross functional data protection working group.
Integrate risk management into operations.
Commence process for ISO accreditation in the Medical Card Unit.
Q1
Q1
Q2
Q1
Assess and reimburse applications in relation to new drugs and new uses of existing drugs in 2017 in accordance with the procedures outlined in the Framework Agreement on the Supply and Pricing of Medicines
Q4
Operational Plan Action
Strengthen High Tech drug scheme arrangement processes.
Q4
Process applications for eligibility (under the PCRS) within agreed timelines
Process 96% of completed medical / GP visit card applications within 15 days Q4
Operational Plan Actions
Configure all teams to ensure streamlined processing of all applications types.
Design and implement a suitable extension of the medical card numbering system.
Rollout document scanning, on a phased basis, to improve efficiency of processing.
Develop internal targets for each team.
Q3
Process 90% of medical card applications error free.
Assess eligibility of new applicants for medical cards and GP visit cards and review eligibility of existing cardholders in line with health legislation.
Engage with external stakeholders throughout the year e.g. Appeals Office, Patient Advocacy Groups etc.
Implement the Clinical Advisory Group recommendations approved by the Department of Health / HSE.
Provide online Change of Doctor facility to GMS Practices.
Implement quality initiative of standardised training for new and existing staff.
Q3
Q1
Web based paperless medical card application Operational Plan Actions
Roll out a web based paperless medical card application process to reduce the number of paper based
applications.
Q3
Enhanced Data Sharing Operational Plan Actions
Replace current system used to share data with the Department of Social Protection (DSP) with an enhanced data sharing solution.
Integrate DSP data using the published DSP application programme interface and enhance accurate processing of applications.
Train staff in the use of integrated DSP data in medical card application processing.
Re-configure existing practices with the phase-out of Infosys.
Q3
Q2
Q2
Q3
Implement document scanning in Contract Support Unit.
Implement optical character recognition scanning for optical claims. Q2

2017 Primary Care Division Operational Plan Page 27
Priority Actions Target Q
Implement integrated solution to allow GPs submit health check, asthma and diabetes cycle of care data.
Work to achieve accreditation in Excellence through People.
Q3
Q2
Q4
Medicine Management Programme Operational Plan Actions
Review and update core lists based on the outcome of Medicines Management Programme Review with Clinical Programmes.
Design, develop and implement reports to support the work of the Medicines Management Programme.
Complete review of oral nutritional supplements.
Q3
Develop Website Information Operational Plan Actions
Update medicalcard.ie (HSE website) and PCRS.ie microsites.
Convene ‘inter-functional’ editorial group.
Liaise with HSE Digital Team.
Q2
Recommendations of the Clinical Advisory Group Operational Plan Actions
Consider further recommendations of the Clinical Advisory Group including conclusions on the assessment of the burden of disease as agreed for implementation by the HSE and Department of Health.
Develop a burden of illness assessment tool.
PCRS to anticipate work plans coming from Clinical Advisory Group recommendations in order to ensure timely implementation of actions.
Q3
Improve Customer Engagements Operational Plan Actions
Convene meetings with representatives of CHOs, GPs and local representatives.
Provide opportunity for customer feedback.
Provide two information exchange sessions per month, in collaboration with the Office of the Chief Officer in each CHO Area.
Q4
Introduce Query Handling Operational Plan Actions
Introduce query handling for reimbursement operations.
Enhance system currently available for optical and dental processing teams to capture all primary care contractor types.
Develop daily reports to capture level of queries.
Develop and maintain frequently asked questions for each contractor group on www.pcrs.ie to reduce number of queries submitted.
Q3
Conduct Staff Engagement Operational Plan Actions
Conduct regular staff briefing sessions.
Roll out the staff development programme to all staff.
Q4
Develop PCRS ICT and Shared Services Operational Plan Actions
Develop ICT Projects as agreed under Programme 4 of the Primary Care System Reform Programme.
Upgrade core infrastructural components to ensure ongoing performance and resilience of medical card eligibility assessment and reimbursement operations.
Transition the current HR record management system and payroll to SAP HR and Payroll.
Transition the current payroll to SAP Payroll (in accordance with corporate plans).
Continue to implement Phase 2 of Single Euro Payments Area (SEPA) project to reduce the numbers of cheques being issued.
Utilise HSE Shared Services capacity for administrative support services (e.g. Payroll and Pension Administration and Vendor Management).
Q4 Q2
Q3
Q2
Q3
Strengthen accountability and compliance across all services and review contractor arrangements
Strengthen accountability within primary care and ensure compliance with service and probity arrangements and internal and external audit findings
Q4
Operational Plan Actions
Performance Monitoring and Compliance

2017 Primary Care Division Operational Plan Page 28
Priority Actions Target Q
Monitor performance of Primary Care services against agreed budgets and activity levels to ensure services are delivered within funded levels.
Implement measures where there is variance from break even position. Convene monthly engagement with Chief Officers in relation to budget and activity levels.
Q1-Q4
Operational Plan Actions
Service Arrangements
Undertake periodic review of service arrangements with a view to achieving 100% compliance.
Assign a senior manager to ensure Service Arrangements are complete.
Address incomplete service arrangements with Chief Officers, by having this as a permanent agenda item on CHO performance meetings with updates provided by CHOs on measures to be taken to ensure full compliance for service arrangements.
Internal Audit
Implement actions to address internal audit findings in a timely manner and in accordance with the targets set by Internal Audit.
Assign a senior manager to ensure Internal Audit recommendations are implemented.
Address internal audit recommendations with Chief Officers, by having this as a permanent agenda item on CHO performance meetings with updates provided by CHOs on measures to be taken to ensure implementation of recommendations (as appropriate).
Q1-Q4
Q1-Q4
Progress and implement policy and value for money projects for community demand-led schemes in relation to aids and appliances, respiratory products, orthotics, prosthetics and specialised footwear, incontinence wear, urinary, ostomy and bowel care, nutrition, bandages and dressings
Q4
Operational Plan Actions For each of the above progress the following: Agree national approved list of items. Communicate agreed approved list of items. Agree prescribing guidelines/clinical criteria. Develop prioritisation tool. Agree standard operating procedure. Develop product specification for all approved items. Complete tender process. Complete contracts/service level agreements for approved items and communicate to CHOs. Agree materials descriptors. Develop and implement ICT system for stock management. Review recycling model and implement recycling contracts (if appropriate) Review purchase versus rental model. Monitor and performance manage contracts.
Q1-Q4
Minor Ailment Scheme Operational Plan Action
Evaluate the 2016 pharmacy-based Minor Ailment Scheme pilot project.
Q1
Use the Optimising Primary Care Pharmaceutical Programme to ensure quality, safety and value for money
Q3
Ensure medicines are procured, provided and used in a cost-effective, efficient and rational manner across the health service
Q4
Operational Plan Actions Cross reference with Service Plan Actions on the Framework Agreement on the Supply and Pricing of Medicines
Monitor savings to be achieved under the Framework Agreement on the Supply and Pricing of Medicines.
Develop and implement a model of care for medical intervention with oral anticoagulants.
Develop and agree a report with recommendations to influence prescribing practices for prescriptions that originate in acute hospitals and are reimbursed in the primary care setting and GP prescribing in primary care.
Develop a report for use of powers under the Health (Pricing and Supply of Medical Goods) Act 2013,
Q4
Q4
Q3
Q3

2017 Primary Care Division Operational Plan Page 29
Priority Actions Target Q
with associated benefits, risks, dependencies and impact.
Develop a framework for the price-setting of biosimilars.
Develop a plan to address cost savings, risks and challenges in relation to the High Tech Drugs and Medicines Scheme.
Update probity processes.
Provide additional resources to ensure that the assessment process for new medicines is implemented effectively.
Q4
Q4
Q3
Q2
Review contractor arrangements, including the GP contract under the Framework Agreement in relation to GP contracts, the Dental Treatment Services Scheme and the Primary Care Ophthalmic, Optometry and Dispensing Optician Contracts
Q4
Operational Plan Actions
Finalise new contractual framework to comprehend all of the publicly funded health sector contracts involving GPs and define scope of services to be provided.
Finalise introduction of free GP care to children aged 6-11 years and children in receipt of Domiciliary Care Allowance.
Review of the Dental Treatment Service Scheme (DTSS). - Commence engagement with all of the relevant stakeholders on new contractual framework and
scope of services to be provided. - Finalise new contractual framework and new scope of service in line with Oral Health Policy (subject
to finalisation of Oral Health Policy).
Review of Primary Care Ophthalmic, Optometry and Dispensing Optician Contracts. - Commence review of contracts in line with recommendations of Primary Care Eye Services Review. - Finalise new contractual framework and new scope of service in line with recommendations of
Primary Care Eye Services Review.
Q4
Q4
Q4
Q4
Q4 Q4
Engage with the GP representatives and other stakeholders to develop appropriate contractual arrangements
Q4
Operational Plan Actions
Conclude engagement with all of the relevant stakeholders on new contractual framework and scope of services to be provided.
Q4
Finalise the service level agreement on the training programme for GPs Q2
Operational Plan Actions
Finalise and implement new arrangements for management of GP training, involving the Irish College of
General Practitioners.
Train 187 GP Trainees (annual intake).
Q2
Q4

2017 Primary Care Division Operational Plan Page 30
Volume of services in 2017 includes:
Primary Care
Area of service provision
NSP 2016 Expected
Activity Projected
Outturn 2016 Expected
Activity 2017
Primary Care
Community Intervention Teams
No. of referrals
Admission avoidance (includes OPAT)
Hospital avoidance
Early discharge (includes OPAT)
Unscheduled referrals from community sources
24,202
914
12,932
6,360
3,996
27,033
949
17,555
5,240
3,289
32,861
1,187
21,629
6,072
3,972
GP Activity
No. of contacts with GP Out of Hours Service
964,770
1,053,996
1,055,388
Therapies / Community Healthcare Network Services
Total no. of patients seen
1,249,772
1,508,664
1,549,256(i)
Physiotherapy
No. of patients seen
597,177
613,320
613,320
Occupational Therapy
No. of patients seen
329,991
335,988
338,705
Speech and Language Therapy
No. of patients seen
-
247,536
265,182
Podiatry
No. of patients seen
71,407
74,640
74,952
Ophthalmology
No. of patients seen
75,444
86,988
97,150
Audiology
No. of patients seen
50,659
47,988
56,834
Dietetics
No. of patients seen
84,215
64,308
65,217
Psychology
No. of patients seen
40,879
37,896
37,896
Nursing
No. of patients seen
898,944
663,300
898,944
Paediatric Homecare Packages
No. of packages (based on average cost per package of €0.075m)
-
474
514
GP Trainees
No. of trainees
157
172
187
National Virus Reference Laboratory
No. of tests
-
799,881
627,684(ii)
Social Inclusion
Opioid Substitution
No. of clients in receipt of opioid substitution treatment (outside prisons)
9,515
9,560
9,700
Needle Exchange
No. of unique individuals attending pharmacy needle exchange
1,731
1,647
1,647

2017 Primary Care Division Operational Plan Page 31
Primary Care
Area of service provision
NSP 2016 Expected
Activity Projected
Outturn 2016 Expected
Activity 2017
Homeless Services
No. of service users admitted to homeless emergency accommodation hostels / facilities whose health needs have been assessed within two weeks of admission
1,311
1,022
1,272
Traveller Health
No. of people who received health information on type 2 diabetes and cardiovascular health
3,470
3,481
3,481
Palliative Care
Inpatient Palliative Care Services
No. accessing specialist inpatient bed (during the reporting month)
New 2017
New 2017
3,555
Community Palliative Care Services
No. of patients who received specialist palliative care treatment in their normal place of residence in the month
3,309
3,517
3,620
Children’s Palliative Care Services
No. of children in the care of the children’s outreach nurse
New 2017
New 2017
269
No. of children in the care of the specialist paediatric palliative care team in an acute hospital setting (during the reporting month)
New 2017 New 2017 20
Primary Care Reimbursement Service(iii)
Medical Cards
No. of persons covered by medical cards as at 31st December
1,675,767
1,697,081
1,672,654
No. of persons covered by GP visit cards as at 31st December 485,192 478,541 528,593
Sub-total 2,160,959 2,175,622 2,201,247
General Medical Services Scheme
Total no. items prescribed - 58,929,932 57,821,617
Average dispensing fee (€) per item - 5.49 5.49
Average ingredient cost (€) per item (gross cost)(iv) - 11.56 11.55
Long Term Illness Scheme
Total no. items prescribed - 7,611,368 8,657,750
Average dispensing fee (€) per item - 4.32 4.32
Average ingredient cost (€) per item (gross cost) (iv) - 21.17 21.25
Drug Payment Scheme
Total no. items prescribed - 7,440,900 8,305,797
Average dispensing fee (€) per item - 1.88 1.88
Average ingredient cost (€) per item (gross cost) (iv) - 6.79 6.82
(i) Includes new patients seen for initial assessment as part of speech and language therapy service improvement initiative. Additional activity arising from psychology development initiative not included
(ii) Reduction of costs and activity targeted through revised governance arrangements and efficiency measures
(iii) The PCRS budget and activity profile has been framed with reference to current working assumptions in relation to the levels of schemes eligibility and the value of savings to be achieved in 2017
(iv) The gross cost is prior to any price reductions from the Framework Agreement on the Supply and Pricing of Medicines, manufacturers’ rebates and the netting off of prescription charges

Appendices
2017 Primary Care Division Operational Plan Page 32
Appendix 1: Financial Tables 2017 CHO Net Expenditure Allocations
CHO Pay Non Pay Gross Budget Income Net
Budget
€m €m €m €m €m
CHO 1
Primary Care 60.57 21.05 81.62 (1.43) 80.19
Social Inclusion 0.32 2.12 2.45 0.00 2.45
Palliative Care 4.99 1.58 6.57 (0.50) 6.06
Core Services 65.88 24.76 90.64 (1.94) 88.70
Local DLS 0.00 22.12 22.12 0.00 22.12
Total 65.88 46.88 112.76 (1.94) 110.82
CHO 2
Primary Care 57.62 25.40 83.02 (2.07) 80.95
Social Inclusion 0.07 5.99 6.06 0.00 6.06
Palliative Care 1.64 5.26 6.90 0.00 6.90
Core Services 59.33 36.65 95.99 (2.07) 93.92
Local DLS 0.00 21.71 21.71 0.00 21.71
Total 59.33 58.36 117.69 (2.07) 115.62
CHO 3
Primary Care 38.09 18.07 56.16 (1.48) 54.68
Social Inclusion 1.90 6.56 8.45 (0.04) 8.42
Palliative Care 0.00 11.62 11.62 0.00 11.62
Core Services 39.99 36.25 76.24 (1.52) 74.72
Local DLS 0.00 11.94 11.94 0.00 11.94
Total 39.99 48.19 88.18 (1.52) 86.66
CHO 4
Primary Care 67.89 31.21 99.09 (2.32) 96.77
Social Inclusion 2.35 13.64 15.99 (0.00) 15.99
Palliative Care 0.61 7.95 8.56 (0.25) 8.32
Core Services 70.85 52.80 123.65 (2.57) 121.08
Local DLS 0.00 29.44 29.44 0.00 29.44
Total 70.85 82.24 153.09 (2.57) 150.52
Cork Dental
Primary Care 1.48 0.71 2.19 (0.35) 1.84
Social Inclusion 0.00 0.00 0.00 0.00 0.00
Palliative Care 0.00 0.00 0.00 0.00 0.00
Core Services 1.48 0.71 2.19 (0.35) 1.84

Appendices
2017 Primary Care Division Operational Plan Page 33
CHO Pay Non Pay Gross Budget Income Net
Budget
€m €m €m €m €m
Local DLS 0.00 0.00 0.00 0.00 0.00
Total 1.48 0.71 2.19 (0.35) 1.84
Total CHO 4 (Incl. Cork Dental)
Primary Care 69.37 31.92 101.28 (2.67) 98.61
Social Inclusion 2.35 13.64 15.99 (0.00) 15.99
Palliative Care 0.61 7.95 8.56 (0.25) 8.32
Core Services 72.33 53.51 125.84 (2.92) 122.92
Local DLS 0.00 29.44 29.44 0.00 29.44
Total 72.33 82.94 155.28 (2.92) 152.36
CHO 5
Primary Care 55.47 24.18 79.66 (3.30) 76.36
Social Inclusion 2.26 5.44 7.70 (0.00) 7.70
Palliative Care 0.21 1.13 1.34 (0.00) 1.34
Core Services 57.94 30.76 88.70 (3.30) 85.40
Local DLS 0.00 18.53 18.53 0.00 18.53
Total 57.94 49.29 107.22 (3.30) 103.93
CHO 6
Primary Care 39.62 15.00 54.62 (4.51) 50.10
Social Inclusion 0.67 1.89 2.56 (0.00) 2.56
Palliative Care 0.38 0.39 0.77 (0.00) 0.77
Core Services 40.67 17.27 57.95 (4.52) 53.43
Local DLS 0.00 19.15 19.15 0.00 19.15
Total 40.67 36.42 77.10 (4.52) 72.58
Dublin Dental
Primary Care 5.20 1.63 6.83 (1.30) 5.53
Social Inclusion 0.00 0.00 0.00 0.00 0.00
Palliative Care 0.00 0.00 0.00 0.00 0.00
Core Services 5.20 1.63 6.83 (1.30) 5.53
Local DLS 0.00 0.00 0.00 0.00 0.00
Total 5.20 1.63 6.83 (1.30) 5.53
Total CHO 6 (Incl. Dublin Dental)
Primary Care 44.83 16.63 61.45 (5.82) 55.64
Social Inclusion 0.67 1.89 2.56 (0.00) 2.56
Palliative Care 0.38 0.39 0.77 (0.00) 0.77
Core Services 45.88 18.90 64.78 (5.82) 58.96

Appendices
2017 Primary Care Division Operational Plan Page 34
CHO Pay Non Pay Gross Budget Income Net
Budget
€m €m €m €m €m
Local DLS 0.00 19.15 19.15 0.00 19.15
Total 45.88 38.06 83.93 (5.82) 78.11
CHO 7
Primary Care 55.19 25.89 81.08 (0.27) 80.80
Social Inclusion 18.24 28.05 46.29 (0.09) 46.20
Palliative Care 2.50 0.55 3.05 (0.04) 3.01
Core Services 75.93 54.49 130.42 (0.40) 130.01
Local DLS 0.00 47.63 47.63 0.00 47.63
Total 75.93 102.12 178.05 (0.40) 177.64
OLH
Primary Care 0.00 0.00 0.00 0.00 0.00
Social Inclusion 0.00 0.00 0.00 0.00 0.00
Palliative Care 24.18 5.67 29.85 (8.75) 21.10
Core Services 24.18 5.67 29.85 (8.75) 21.10
Local DLS 0.00 0.00 0.00 0.00 0.00
Total 24.18 5.67 29.85 (8.75) 21.10
Total CHO 7 (Incl. OLH)
Primary Care 55.19 25.89 81.08 (0.27) 80.80
Social Inclusion 18.24 28.05 46.29 (0.09) 46.20
Palliative Care 26.69 6.22 32.90 (8.79) 24.11
Core Services 100.11 60.16 160.27 (9.15) 151.12
Local DLS 0.00 47.63 47.63 0.00 47.63
Total 100.11 107.79 207.90 (9.15) 198.75
CHO 8
Primary Care 78.67 36.07 114.74 (2.66) 112.08
Social Inclusion 1.78 2.04 3.81 (0.00) 3.81
Palliative Care 5.34 1.06 6.40 (0.48) 5.92
Core Services 85.79 39.16 124.95 (3.14) 121.81
Local DLS 0.00 26.70 26.70 0.00 26.70
Total 85.79 65.86 151.65 (3.14) 148.51
CHO 9
Primary Care 54.04 22.75 76.79 (0.06) 76.74
Social Inclusion 11.76 23.33 35.09 (0.21) 34.88
Palliative Care 0.01 10.88 10.89 0.00 10.89
Core Services 65.82 56.96 122.78 (0.26) 122.51
Local DLS 0.00 52.39 52.39 0.00 52.39

Appendices
2017 Primary Care Division Operational Plan Page 35
CHO Pay Non Pay Gross Budget Income Net
Budget
€m €m €m €m €m
Total 65.82 109.35 175.16 (0.26) 174.90
Other Primary Care Services (Note 1)
Primary Care 15.20 72.08 87.28 (0.21) 87.08
Social Inclusion 0.40 1.83 2.23 0.00 2.23
Palliative Care (0.46) 1.03 0.57 0.00 0.57
Core Services 15.13 74.95 90.08 (0.21) 89.87
Local DLS 0.00 0.00 0.00 0.00 0.00
Total 15.13 74.95 90.08 (0.21) 89.87
Primary Care Reimbursement Service
16.97 2,647.29 2,664.26 (103.56) 2,560.70
Total PCRS 16.97 2,647.29 2,664.26 (103.56) 2,560.70
Overall Totals
Primary Care 529.05 294.04 823.09 (19.96) 803.13
Social Inclusion 39.75 90.89 130.64 (0.34) 130.30
Palliative Care 39.40 47.12 86.52 (10.02) 76.50
Core Services Total 608.20 432.05 1,040.25 (30.32) 1,009.93
Local DLS 0.00 249.60 249.60 0.00 249.60
PCRS 16.97 2,647.29 2,664.26 (103.56) 2,560.70
Total 625.17 3,328.94 3,954.11 (133.88) 3,820.23
Note: Other primary care services include regional services and national services. Primary Care and Social Inclusion do not include funds held by the Department of Health of €5m and €3m respectively in the above table.
2017 PCRS Schemes Budget
Scheme/ Payment Category Allocation 2017
€m
GP Fees and Allowances 559.57
Drug Target Refund 0.49
GMS Pharmacy Claims 826.29
DPS Pharmacy Claims 68.57
LTI Pharmacy Claims 226.9
EEA Pharmacy Claims 1.07
Dental Treatment Services 66.14
High Tech Drugs/Medicines 608.81
Methadone Treatment 21.43
Health Amendment Act 1996 3.61

Appendices
2017 Primary Care Division Operational Plan Page 36
Scheme/ Payment Category Allocation 2017
€m
Community Ophthalmic Services 31.73
Hardship Arrangements 17.42
Oncology Drugs/Medicines 28.15
OPAT 8.13
OPIT 4.24
Orphan Drugs/Medicines 10.48
Hepatitis C Programme 30.0
Other Hospital Drugs 9.0
Administration (Pay and Non-Pay)
Technical Services/HSE Reg Stationery 38.67
Total Payments 2,560.70

Appendices
2017 Primary Care Division Operational Plan Page 37
Appendix 2: HR information Primary Care Workforce Position: Staff Category Information as at September 2016
(Source: Workforce Planning, Analytics & Informatics, National HR Directorate)
Medical/ Dental
Nursing Health &
Social Care Professionals
Management/ Admin
General Support
Staff
Patient &
Client Care
WTE Sep 16
% Total
CHO 1
HSE
73
295 294 319
71
80
1,131 10.90%
Total CHO 1 73
295 294 319
71
80
1,131 10.90%
CHO 2
HSE
91
287 300 295
31
69
1,073 10.30%
Total CHO 2 91
287 300 295
31
69
1,073 10.30%
CHO 3
HSE
71
199 101 199
44
50
665 6.40%
Total CHO 3 71
199 101 199
44
50
665 6.40%
CHO 4
HSE
112
334 285 239
6
69
1,044 10.00%
Section 38
18
9 3 25
10
27
92 0.90%
Total CHO 4 129
343 288 264
16
96
1,137 10.90%
CHO 5
HSE
75
258 248 215
27
50
874 8.40%
Total CHO 5 75
258 248 215
27
50
874 8.40%
CHO 6
HSE
118
186 167 182
19
54
725 7.00%
Section 38
13
5 2 28
13
28
89 0.90%
Total CHO 6 131
191 169 210
32
81
813 7.80%
CHO 7
HSE
93
338 311 256
54
154
1,206 11.60%
Section 38
18
167 59 52
86
107
489 4.70%
Total CHO 7 111 505 369 308 140 261 1,694 16.30%
CHO 8
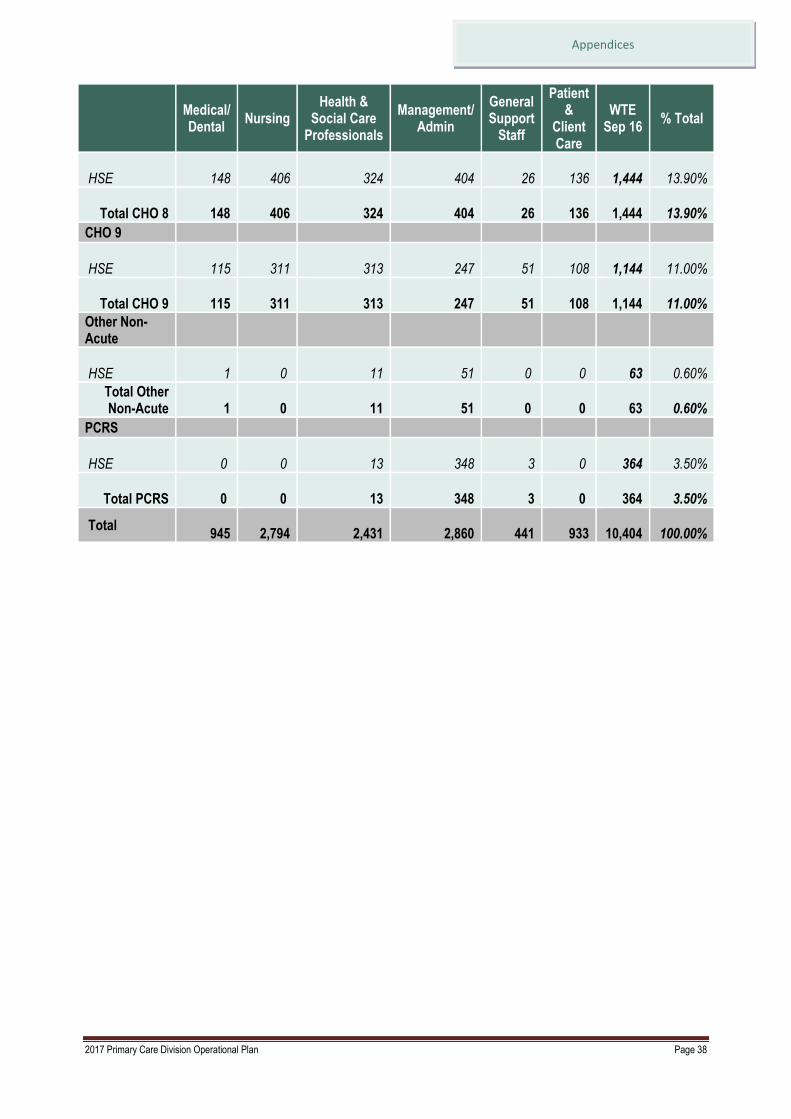
Appendices
2017 Primary Care Division Operational Plan Page 38
Medical/ Dental
Nursing Health &
Social Care Professionals
Management/ Admin
General Support
Staff
Patient &
Client Care
WTE Sep 16
% Total
HSE 148
406 324 404
26
136
1,444 13.90%
Total CHO 8 148
406 324 404
26
136
1,444 13.90%
CHO 9
HSE
115
311 313 247
51
108
1,144 11.00%
Total CHO 9 115
311 313 247
51
108
1,144 11.00%
Other Non-Acute
HSE
1 0 11 51 0 0
63 0.60%
Total Other Non-Acute 1 0 11 51 0 0
63 0.60%
PCRS
HSE 0 0 13 348
3 0
364 3.50%
Total PCRS 0 0 13 348 3 0
364 3.50%
Total 945
2,794 2,431 2,860
441
933
10,404 100.00%

Appendices
2017 Primary Care Division Operational Plan Page 39
Appendix 3: Primary Care Scorecard
and Performance Indicator Suite
Quality and Safety Expected Activity/
Target 2017
Access Expected Activity/
Target 2017
Primary Care
Healthcare Associated Infections: Medication Management
Consumption of antibiotics in community settings (defined daily doses per 1,000 population)
Community Intervention Teams (CITs) – Number of referrals
Admission avoidance (includes OPAT)
Hospital avoidance
Early discharge (includes OPAT)
Unscheduled referrals from community
sources
Health Amendment Act: Services to
persons with State Acquired Hepatitis C
Number of Health Amendment Act
cardholders reviewed
Primary Care Reimbursement Service
Medical Cards
% of medical card/GP visit card
applications, assigned for medical officer
review, processed within five days
% of medical card/GP visit card
applications which are accurately
processed from a financial perspective by
National Medical Card Unit staff
Social Inclusion
Homeless Services
Number and % of service users admitted
to homeless emergency accommodation
hostels/facilities whose health needs have
been assessed within two weeks of
admission
Traveller Health
Number of people who received health
information on type 2 diabetes and
cardiovascular health
Palliative Care
Inpatient Palliative Care Services
% of patients triaged within one working
day of referral (inpatient unit)
% of patients with a multidisciplinary care
plan documented within five working days
<21.7
32,861
1,187
21,629
6,072
3,972
586
91%
95%
1,272
85%
3,481
90%
90%
Primary Care
GP Activity
Number of contacts with GP out of hours
service
Nursing
% of new patients accepted onto the
caseload and seen within 12 weeks
Physiotherapy
% of new patients seen for assessment
within 12 weeks
% on waiting list for assessment ≤ 52 weeks
Occupational Therapy
% of new service users seen for assessment
within 12 weeks
% on waiting list for assessment ≤ 52 weeks
Speech and Language Therapy
% on waiting list for assessment ≤ 52 weeks
% on waiting list for treatment ≤ 52 weeks
Podiatry
% on waiting list for treatment ≤ 12 weeks
% on waiting list for treatment ≤ 52 weeks
Ophthalmology
% on waiting list for treatment ≤ 12 weeks
% on waiting list for treatment ≤ 52 weeks
Audiology
% on waiting list for treatment ≤ 12 weeks
% on waiting list for treatment ≤ 52 weeks
Dietetics
% on waiting list for treatment ≤ 12 weeks
% on waiting list for treatment ≤ 52 weeks
Psychology
% on waiting list for treatment ≤ 12 weeks
% on waiting list for treatment ≤ 52 weeks
Oral Health
% of new patients who commenced
treatment within three months of assessment
Orthodontics
% of referrals seen for assessment within six
months
Reduce the proportion of patients on the
treatment waiting list waiting longer than four
years (grades 4 and 5)
1,055,388
100%
81%
98%
72%
92%
100%
100%
44%
88%
50%
81%
50%
95%
48%
96%
60%
100%
88%
75%
<5%

Appendices
2017 Primary Care Division Operational Plan Page 40
Quality and Safety Expected Activity/
Target 2017
Access Expected Activity/
Target 2017
of initial assessment (inpatient unit)
Community Palliative Care Services
% of patients triaged within one working
day of referral (community)
90%
Primary Care Reimbursement Service
Medical Cards
% of completed medical card/GP visit card
applications processed within 15 days
Number of persons covered by medical
cards as at 31st December
Number of persons covered by GP visit
cards as at 31st December
Social Inclusion
Substance Misuse
% of substance misusers (over 18 years) for
whom treatment has commenced within one
calendar month following assessment
% of substance misusers (under 18 years)
for whom treatment has commenced within
one week following assessment
Opioid Substitution
Number of clients in receipt of opioid
substitution treatment (outside prisons)
Average waiting time from referral to
assessment for opioid substitution treatment
Average waiting time from opioid substitution
assessment to exit from waiting list or
treatment commenced
Needle Exchange
Number of unique individuals attending
pharmacy needle exchange
Palliative Care
Inpatient Palliative Care Services
Access to specialist inpatient bed within
seven days
Number accessing specialist inpatient bed
within seven days
Community Palliative Care Services
Access to specialist palliative care services
in the community provided within seven
days (normal place of residence)
Number of patients who received treatment
in their normal place of residence
Children’s Palliative Care Services
Number of children in the care of the
children’s outreach nurse
No. of children in the care of the specialist
paediatric palliative care team in an acute
hospital setting (during the reporting month)
96%
1,672,654
528,593
100%
100%
9,700
4 days
28 days
1,647
98%
3,555
95%
3,620
269
20
Child Health
% of children reaching 10 months within
the reporting period who have had child
development health screening on time or
95%

Appendices
2017 Primary Care Division Operational Plan Page 41
Quality and Safety Expected Activity/
Target 2017
Access Expected Activity/
Target 2017
before reaching 10 months of age
% of newborn babies visited by a PHN
within 72 hours of discharge from
maternity services
% of babies breastfed (exclusively and not
exclusively) at first PHN visit
% of babies breastfed (exclusively and not
exclusively) at three month PHN visit
98%
58%
40%
System Wide
Immunisation
% uptake in flu vaccine for those aged 65
and older with a medical card or GP visit
card
% children aged 24 months who have
received 3 doses of the 6-in-1 vaccine
% children aged 24 months who have
received the measles, mumps, rubella
(MMR) vaccine
% of first year girls who have received two
doses of HPV vaccine
75%
95%
95%
85%
System Wide
Serious Reportable Events (SREs)
% of serious reportable events being notified within 24 hours to the senior accountable officer
% of investigations completed within 120 days of the notification of the event to the senior accountable officer
Safety Incident Reporting
% of safety incidents being entered onto NIMS within 30 days of occurrence by CHO
Extreme and major safety incidents as a % of all incidents reported as occurring
% of claims received by the State Claims Agency that were not reported previously as an incident
Internal Audit
% of internal audit recommendations implemented within 6 months of the report being received
% of internal audit recommendations implemented, against total number of recommendations, within 12 months of report being received
Service Arrangements/Annual Compliance Statement
% of number of service arrangements signed
% of the monetary value of service
Target
99%
90%
90%
Actual to be reported in
2017
40%
75%
95%
100%
System Wide
Health and Safety
No. of calls that were received by the National Health and Safety Helpdesk
Service User Experience - Complaints
% of complaints investigated within 30 working days of being acknowledged by the complaints officer
Target
10% increase
75%

Appendices
2017 Primary Care Division Operational Plan Page 42
Quality and Safety Expected Activity/
Target 2017
Access Expected Activity/
Target 2017
arrangements signed
% annual compliance statements signed
100%
100%
Finance Workforce
Budget Management
Net expenditure: variance from plan
Pay: Direct / Agency / Overtime
Capital
Capital expenditure versus expenditure profile
≤0.1%
≤0.1%
100%
Absence
% absence rates by staff category
Staffing Levels and Costs
% adherence to funded staffing thresholds
≤3.5%
>99.5%

Appendices
2017 Primary Care Division Operational Plan Page 43
Primary Care Performance Indicator Suite
Primary Care
Primary Care
Indicator Reporting Frequency
NSP 2016
Expected Activity /
Target
Projected Outturn
2016
Expected Activity /
Target 2017
Healthcare Associated Infections: Medication Management
Consumption of antibiotics in community settings (defined daily doses per 1,000 population)
Q
< 21.7
27.6
< 21.7
Community Intervention Teams (No. of referrals)
Admission avoidance (includes OPAT)
M 24,202
914
27,033
949
32,861
1,187
Hospital Avoidance M 12,932 17,555 21,629
Early discharge (includes OPAT) M 6,360 5,240 6,072
Unscheduled referrals from community sources M 3,996 3,289 3,972
Health Amendment Act: Services to persons with State Acquired Hepatitis C
No. of Health Amendment Act cardholders who were reviewed
Q
798
212
586
GP Activity
No. of contacts with GP Out of Hours Service
M
964,770
1,053,996
1,055,388
Nursing
% of new patients accepted onto the caseload and seen within 12 weeks
M
New 2017
New
2017
100%
Child Health
% of children reaching 10 months within the reporting period who have had child development screening on time or before reaching 10 months of age
M 95% 94% 95%
% of newborn babies visited by a PHN within 72 hours of discharge from maternity services
Q 97% 98% 98%
% of babies breastfed (exclusively and not exclusively) at first PHN visit
Q 56% 57% 58%
% of babies breastfed (exclusively and not exclusively) at three month PHN visit
Q 38% 38% 40%
Physiotherapy
% of new patients seen for assessment within 12 weeks
M
70%
81%
81%
% on waiting list for assessment ≤ 52 weeks M 100% 98% 98%
Occupational Therapy
% of new service users seen for assessment within 12 weeks
M
70%
72%
72%
% on waiting list for assessment ≤ 52 weeks M 100% 82% 92%
Speech and Language Therapy

Appendices
2017 Primary Care Division Operational Plan Page 44
Primary Care
Indicator Reporting Frequency
NSP 2016
Expected Activity /
Target
Projected Outturn
2016
Expected Activity /
Target 2017
% on waiting list for assessment ≤ 52 weeks M 100% 97% 100%
% on waiting lists for treatment ≤ 52 weeks M 100% 85% 100%
Podiatry
% on waiting list for treatment ≤ 12 weeks
M
75%
44%
44%
% on waiting list for treatment ≤ 52 weeks M 100% 78% 88%
Ophthalmology
% on waiting list for treatment ≤ 12 weeks
M
60%
28%
50%
% on waiting list for treatment ≤ 52 weeks M 100% 71% 81%
Audiology
% on waiting list for treatment ≤ 12 weeks
M
60%
41%
50%
% on waiting list for treatment ≤ 52 weeks M 100% 85% 95%
Dietetics
% on waiting list for treatment ≤ 12 weeks
M
70%
48%
48%
% on waiting list for treatment ≤ 52 weeks M 100% 86% 96%
Psychology
% on waiting list for treatment ≤ 12 weeks
M
60%
28%
60%
% on waiting list for treatment ≤ 52 weeks M 100% 75% 100%
Oral Health
% of new patients who commenced treatment within three months of assessment
M
80%
88%
88%
Orthodontics
% of referrals seen for assessment within six months
Q
75%
60%
75%
Reduce the proportion of patients on the treatment waiting list waiting longer than four years (grades 4 and 5)
Q < 5% 6% < 5%
Note: The activity targets for therapy services are aligned to achievable levels based on 2016 existing levels of service. These targets will be reviewed in 2017 in association with service improvement initiatives in the therapy services.
Social Inclusion
Social Inclusion
Indicator Reporting Frequency
NSP 2016 Expected Activity / Target
Projected Outturn 2016
Expected Activity / Target 2017
Substance Misuse
% of substance misusers (over 18 years) for whom treatment has commenced within one calendar month following assessment
Q
100%
89%
100%
% of substance misusers (under 18 years) for whom treatment has commenced within one week following assessment
Q 100% 85% 100%
Opioid Substitution M 9,515 9,560 9,700

Appendices
2017 Primary Care Division Operational Plan Page 45
Social Inclusion
Indicator Reporting Frequency
NSP 2016 Expected Activity / Target
Projected Outturn 2016
Expected Activity / Target 2017
No. of clients in receipt of opioid substitution treatment (outside prisons)
Average waiting time from referral to assessment for opioid substitution treatment
M 14 days 4 days 4 days
Average waiting time from opioid substitution assessment to exit from waiting list or treatment commenced
M 28 days 31 days 28 days
Needle Exchange
No. of unique individuals attending pharmacy needle exchange
Q
1,731
1,647
1,647
Homeless Services
No. and % of service users admitted to homeless emergency accommodation hostels / facilities whose health needs have been assessed within two weeks of admission
Q
1,311
85%
1,022
68%
1,272
85%
Traveller Health
No. of people who received health information on type 2 diabetes and cardiovascular health
Q
3,470
3,481
3,481
Palliative Care
Palliative Care
Indicator Reporting
Frequency
NSP 2016 Expected Activity /
Target
Projected Outturn
2016
Expected Activity /
Target 2017
Inpatient Units – Waiting Times
Access to specialist inpatient bed within seven days
M
98%
97%
98%
No. accessing specialist inpatient bed within seven days during the reporting month
M New 2017
New 2017
3,555
% patients triaged within one working day of referral (inpatient unit) M 90% 90% 90%
% of patients with a multi-disciplinary care plan documented within five working days of initial assessment (inpatient unit)
M 90% 90% 90%
Community Palliative Care Services
Access to specialist palliative care services in the community provided within seven days (normal place of residence)
M 95% 92% 95%
No. of patients who received specialist palliative care treatment in their normal place of residence in the month
M 3,309 3,517 3,620
% patients triaged within one working day of referral (community) M New 2017
New 2017
90%
Children’s Palliative Care Services
No. of children in the care of the children’s outreach nurse
M New 2017
New 2017
269
No. of children in the care of the specialist paediatric palliative care team in an acute hospital setting (during the reporting month)
M New 2017
New 2017
20

Appendices
2017 Primary Care Division Operational Plan Page 46
Primary Care Reimbursement Service
Primary Care Reimbursement Service
Indicator Reporting Frequency
NSP 2016 Expected Activity / Target
Projected Outturn 2016
Expected Activity / Target 2017
% of completed medical card / GP visit card applications processed within 15 days
M 95% 95% 96%
% of medical card / GP visit card applications, assigned for Medical Officer review, processed within five days
M 90% 90% 91%
% of medical card / GP visit card applications which are accurately processed from a financial perspective by National Medical Card Unit staff
M 95% 86% 95%
No. of persons covered by medical cards as at 31st December M 1,675,767 1,697,081 1,672,654
No. of persons covered by GP visit cards as at 31st December M 485,192 478,541 528,593
Sub-total 2,160,959 2,175,622 2,201,247
The PCRS budget and activity profile has been framed with reference to current working assumptions in relation to the levels of schemes eligibility and the value of savings to be achieved in 2017
System Wide
System-Wide
Indicator Reporting
Frequency
NSP 2016 Expected Activity /
Target
Projected Outturn
2016
Expected Activity /
Target 2017
Budget Management
Net Expenditure: variance from plan
Pay: Direct / Agency / Overtime
M
≤0.33%
2016 Annual
Financial Statements
≤0.1%
Non-pay M ≤0.33% 2016 Annual
Financial Statements
≤0.1%
Income M ≤0.33% 2016 Annual
Financial Statements
≤0.1%
Capital
Capital expenditure versus expenditure profile
Q
100%
100%
100%
Audit
% of internal audit recommendations implemented within 6 months of the report being received
Q
75%
75%
75%
% of internal audit recommendations implemented, against total number of recommendations, within 12 months of report being received
Q 95% 95% 95%

Appendices
2017 Primary Care Division Operational Plan Page 47
System-Wide
Indicator Reporting
Frequency
NSP 2016 Expected Activity /
Target
Projected Outturn
2016
Expected Activity /
Target 2017
Service Arrangements / Annual Compliance Statement
% of number of service arrangements signed
M
100%
100%
100%
% of the monetary value of service arrangements signed M 100% 100% 100%
% of annual compliance statements signed A 100% 100% 100%
Workforce
% absence rates by staff category
M
≤ 3.5%
4.3%
≤ 3.5%
% adherence to funded staffing thresholds M > 99.5% >99.5% >99.5%
Health and Safety
No. of calls that were received by the National Health and Safety Helpdesk
Q
15% increase
>15%
10% increase
Service User Experience - Complaints
% of complaints investigated within 30 working days of being acknowledged by the complaints officer
M
75%
75%
75%
Serious Reportable Events
% of serious reportable events being notified within 24 hours to the senior accountable officer
M
99%
40%
99%
% of investigations completed within 120 days of the notification of the event to the senior accountable officer
M 90% 0% 90%
Safety Incident Reporting
% of safety incidents being entered onto NIMS within 30 days of occurrence by CHO
Q
90%
50%
90%
Extreme and major safety incidents as a % of all incidents reported as occurring
Q New PI 2017
New PI 2017
Actual results to be reported
in 2017
% of claims received by the State Claims Agency that were not reported previously as an incident
A New PI 2016
55% 40%
Immunisation
% uptake in flu vaccine for those aged 65 and older with a medical card or GP visit card
A 75% 55.4% 75%
% children aged 24 months who have received 3 doses of the 6-in-1 vaccine
Q 95% 94.9% 95%
% children aged 24 months who have received the measles, mumps, rubella (MMR) vaccine
Q 95% 92.7% 95%
% of first year girls who have received two doses of HPV vaccine
A 85% 70% 85%

Appendices
2017 Primary Care Division Operational Plan Page 48
2017 Primary Care – Full Metrics/KPI Suite (All metrics highlighted in yellow background are those that are included in the Balance Scorecard)
Key Performance Indicators Service Planning 2017
2016 2016 2017
2017 Expected Activity / Target
2017 Expected Activity / Target
2017 Expected Activity / Target
2017 Expected Activity / Target
2017 Expected Activity /
Target
2017 Expected Activity /
Target
2017 Expected Activity /
Target
2017 Expected Activity /
Target
2017 Expected Activity /
Target
KPI Title NSP/ DOP
KPI Type Access/ Quality /Access Activity
Report Freq-uency
2016 National Target /
Expected Activity
2016 Projected outturn
2017 National Target /
Expected Activity
Reported at
National/ CHO / HG
CHO 1 CHO 2 CHO 3 CHO 4 CHO 5 CHO 6 CHO 7 CHO 8 CHO 9
Community Intervention Teams (No. of referrals) 24,202 27,033 32,861 N/A 3,252 4,612 3,661 4,150 1,242 7,669 2,656 5,619
Admission Avoidance (includes OPAT) NSP Quality M 914 949 1,187 CHO N/A 92 98 182 282 76 130 179 148
Hospital Avoidance NSP Quality M 12,932 17,555 21,629 CHO N/A 1,946 2,787 1,846 2,961 1,008 6,683 1,319 3,079
Early discharge (includes OPAT) NSP Quality M 6,360 5,240 6,072 CHO N/A 934 1,045 799 758 158 856 975 547
Unscheduled referrals from community sources
NSP Quality M 3,996 3,289 3,972 CHO N/A 280 682 834 147 0 0 184 1,845
Outpatient Parenteral Antimicrobial Therapy (OPAT) Re-admission rate %
DOP Access /Activity
M ≤5% 2.3%
≤5% HG N/A ≤5% ≤5% ≤5% ≤5% ≤5% ≤5% ≤5% ≤5%
Community Intervention Teams Activity (by referral source)
24,202 27,033 32,861 CHO N/A 3,252 4,612 3,661 4,150 1,242 7,669 2,656 5,619
ED / Hospital wards / Units DOP Access /Activity
M 13,956 18,042 21,966 CHO N/A 2,039 2,964 1,884 2,361 688 6,707 1,898 3,425
GP Referral DOP Access /Activity
M 6,386 5,619 7,003 CHO N/A 836 720 855 1,455 466 540 409 1,722
Community Referral DOP Access /Activity
M 2,226 1,896 2,212 CHO N/A 164 784 671 0 0 158 186 249
OPAT Referral DOP Access /Activity
M 1,634 1,476 1,680 CHO N/A 213 144 251 334 88 264 163 223
GP Out of Hours
No. of contacts with GP Out of Hours Service
NSP Access /Activity
M 964,770 1,053,996 1,055,388 National
Physiotherapy
No. of patient referrals DOP Activity M 193,677 197,592 197,592 CHO 26,556 22,956 15,396 28,260 25,548 13,044 21,720 27,276 16,836
No. of patients seen for a first time assessment
DOP Activity M 160,017 163,596 163,596 CHO 22,248 17,136 11,304 24,396 22,704 11,568 19,176 22,056 13,008
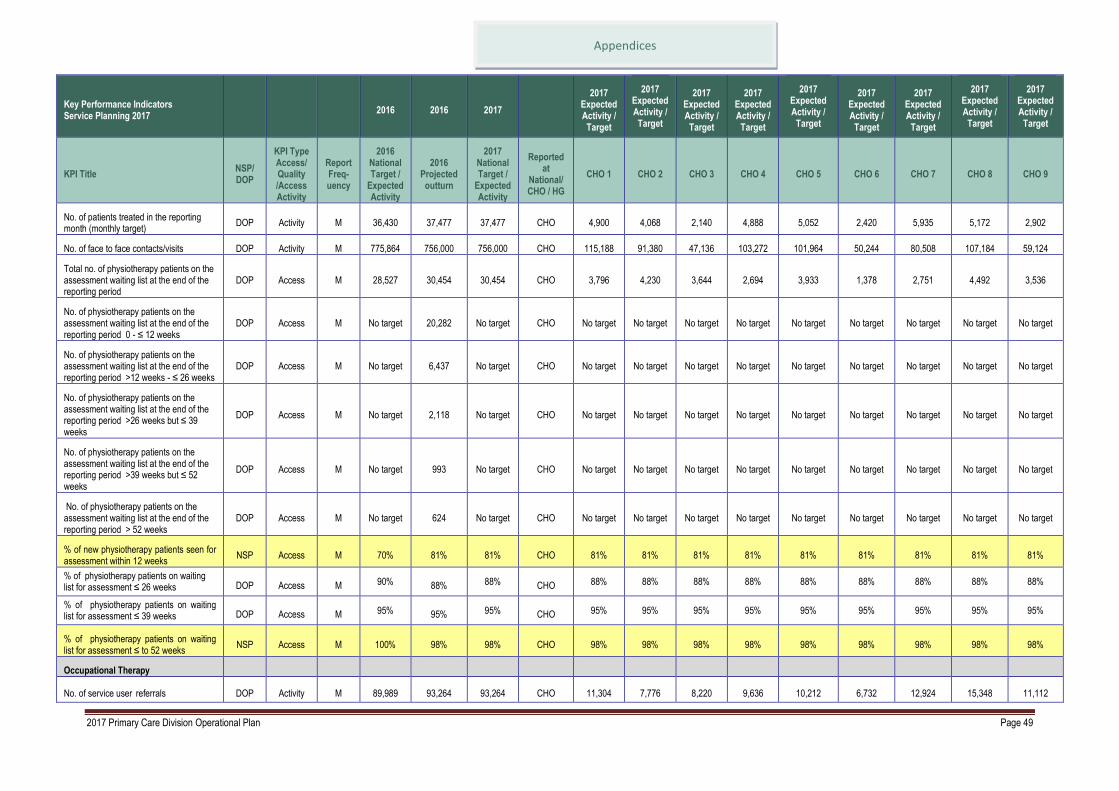
Appendices
2017 Primary Care Division Operational Plan Page 49
Key Performance Indicators Service Planning 2017
2016 2016 2017
2017 Expected Activity / Target
2017 Expected Activity / Target
2017 Expected Activity / Target
2017 Expected Activity / Target
2017 Expected Activity /
Target
2017 Expected Activity /
Target
2017 Expected Activity /
Target
2017 Expected Activity /
Target
2017 Expected Activity /
Target
KPI Title NSP/ DOP
KPI Type Access/ Quality /Access Activity
Report Freq-uency
2016 National Target /
Expected Activity
2016 Projected outturn
2017 National Target /
Expected Activity
Reported at
National/ CHO / HG
CHO 1 CHO 2 CHO 3 CHO 4 CHO 5 CHO 6 CHO 7 CHO 8 CHO 9
No. of patients treated in the reporting month (monthly target)
DOP Activity M 36,430 37,477 37,477 CHO 4,900 4,068 2,140 4,888 5,052 2,420 5,935 5,172 2,902
No. of face to face contacts/visits DOP Activity M 775,864 756,000 756,000 CHO 115,188 91,380 47,136 103,272 101,964 50,244 80,508 107,184 59,124
Total no. of physiotherapy patients on the assessment waiting list at the end of the reporting period
DOP Access M 28,527 30,454 30,454 CHO 3,796 4,230 3,644 2,694 3,933 1,378 2,751 4,492 3,536
No. of physiotherapy patients on the assessment waiting list at the end of the reporting period 0 - ≤ 12 weeks
DOP Access M No target 20,282 No target CHO No target No target No target No target No target No target No target No target No target
No. of physiotherapy patients on the assessment waiting list at the end of the reporting period >12 weeks - ≤ 26 weeks
DOP Access M No target 6,437 No target CHO No target No target No target No target No target No target No target No target No target
No. of physiotherapy patients on the assessment waiting list at the end of the reporting period >26 weeks but ≤ 39 weeks
DOP Access M No target 2,118 No target CHO No target No target No target No target No target No target No target No target No target
No. of physiotherapy patients on the assessment waiting list at the end of the reporting period >39 weeks but ≤ 52 weeks
DOP Access M No target 993 No target CHO No target No target No target No target No target No target No target No target No target
No. of physiotherapy patients on the assessment waiting list at the end of the reporting period > 52 weeks
DOP Access M No target 624 No target CHO No target No target No target No target No target No target No target No target No target
% of new physiotherapy patients seen for assessment within 12 weeks
NSP Access M 70% 81% 81% CHO 81% 81% 81% 81% 81% 81% 81% 81% 81%
% of physiotherapy patients on waiting list for assessment ≤ 26 weeks DOP Access M 90% 88% 88% CHO 88% 88% 88% 88% 88% 88% 88% 88% 88%
% of physiotherapy patients on waiting list for assessment ≤ 39 weeks DOP Access M 95% 95% 95% CHO 95% 95% 95% 95% 95% 95% 95% 95% 95%
% of physiotherapy patients on waiting list for assessment ≤ to 52 weeks
NSP Access M 100% 98% 98% CHO 98% 98% 98% 98% 98% 98% 98% 98% 98%
Occupational Therapy
No. of service user referrals DOP Activity M 89,989 93,264 93,264 CHO 11,304 7,776 8,220 9,636 10,212 6,732 12,924 15,348 11,112

Appendices
2017 Primary Care Division Operational Plan Page 50
Key Performance Indicators Service Planning 2017
2016 2016 2017
2017 Expected Activity / Target
2017 Expected Activity / Target
2017 Expected Activity / Target
2017 Expected Activity / Target
2017 Expected Activity /
Target
2017 Expected Activity /
Target
2017 Expected Activity /
Target
2017 Expected Activity /
Target
2017 Expected Activity /
Target
KPI Title NSP/ DOP
KPI Type Access/ Quality /Access Activity
Report Freq-uency
2016 National Target /
Expected Activity
2016 Projected outturn
2017 National Target /
Expected Activity
Reported at
National/ CHO / HG
CHO 1 CHO 2 CHO 3 CHO 4 CHO 5 CHO 6 CHO 7 CHO 8 CHO 9
No. of new service users seen for a first assessment
DOP Activity M 86,499 87,888 90,605 CHO 10,291 6,699 7,380 11,022 9,671 6,780 12,966 14,048 11,748
No. of service users treated (direct and indirect) monthly target
DOP Activity M 20,291 20,675 20,675 CHO 2,621 1,949 1,419 2,267 1,973 1,464 2,599 3,684 2,699
Total no. of occupational therapy service users on the assessment waiting list at the end of the reporting period
DOP Access M 19,932 25,874 25,874 CHO 1,240 2,275 1,339 4,677 4,426 1,523 3,171 4,123 3,100
No. of occupational therapy service users on the assessment waiting list at the end of the reporting period 0 - ≤ 12 weeks
DOP Access M No target 9,074 No target CHO No target No target No target No target No target No target No target No target No target
No. of occupational therapy service users on the assessment waiting list at the end of the reporting period >12 weeks - ≤ 26 weeks
DOP Access M No target 6,249 No target CHO No target No target No target No target No target No target No target No target No target
No. of occupational therapy service users on the assessment waiting list at the end of the reporting period >26 weeks but ≤ 39 weeks
DOP Access M No target 3,506 No target CHO No target No target No target No target No target No target No target No target No target
No. of occupational therapy service users on the assessment waiting list at the end of the reporting period >39 weeks but ≤ 52 weeks
DOP Access M No target 2,385 No target CHO No target No target No target No target No target No target No target No target No target
No. of occupational therapy service users on the assessment waiting list at the end of the reporting period > 52 weeks
DOP Access M No target 4,660 No target CHO No target No target No target No target No target No target No target No target No target
% of new occupational therapy service users seen for assessment within 12 weeks
NSP Access M 70% 72% 72% CHO 72% 72% 72% 72% 72% 72% 72% 72% 72%
% of occupational therapy service users on waiting list for assessment ≤ 26 weeks
DOP Access M 80% 59% 59% CHO 59% 59% 59% 59% 59% 59% 59% 59% 59%
% of occupational therapy service users on waiting list for assessment ≤ 39 weeks
DOP Access M 95% 73% 73% CHO 73% 73% 73% 73% 73% 73% 73% 73% 73%

Appendices
2017 Primary Care Division Operational Plan Page 51
Key Performance Indicators Service Planning 2017
2016 2016 2017
2017 Expected Activity / Target
2017 Expected Activity / Target
2017 Expected Activity / Target
2017 Expected Activity / Target
2017 Expected Activity /
Target
2017 Expected Activity /
Target
2017 Expected Activity /
Target
2017 Expected Activity /
Target
2017 Expected Activity /
Target
KPI Title NSP/ DOP
KPI Type Access/ Quality /Access Activity
Report Freq-uency
2016 National Target /
Expected Activity
2016 Projected outturn
2017 National Target /
Expected Activity
Reported at
National/ CHO / HG
CHO 1 CHO 2 CHO 3 CHO 4 CHO 5 CHO 6 CHO 7 CHO 8 CHO 9
% of occupational therapy service users on waiting list for assessment ≤ to 52 weeks
NSP Access M 100% 82% 92% CHO 92% 92% 92% 92% 92% 92% 92% 92% 92%
Primary Care – Speech and Language Therapy
No. of patient referrals DOP Activity M 50,863 52,584 52,584 CHO 5,556 4,896 4,332 6,924 5,436 3,036 6,060 7,968 8,376
Existing patients seen in the month DOP Activity M New 2016
16,958 16,958 CHO 2,394 1,630 1,239 2,736 2,226 944 1,655 2,846 1,288
New patients seen for initial assessment DOP Activity M 41,083 44,040 44,040 CHO 4,296 4,572 3,492 6,576 4,500 1,860 4,872 6,912 6,960
Total no. of speech and language patients waiting initial assessment at end of the reporting period
DOP Access M 13,050 14,164 14,164 CHO 1,116 854 1,052 1,916 1,305 578 2,694 2,227 2,422
Total no. of speech and language patients waiting initial therapy at end of the reporting period
DOP Access M 8,279 8,823 8,823 CHO 124 786 507 1,380 2,125 372 1,223 1,193 1,113
% of speech and language therapy patients on waiting list for assessment ≤ to 52 weeks
NSP Access M 100% 97%
100%
CHO 100% 100% 100% 100% 100% 100% 100% 100% 100%
% of speech and language therapy patients on waiting list for treatment ≤ to 52 weeks
NSP Access M 100% 85% 100% CHO 100% 100% 100% 100% 100% 100% 100% 100% 100%
Primary Care – Speech and Language Therapy Service Improvement Initiative
New patients seen for initial assessment DOP Activity M New 2017
New 2017 17,646 CHO 280 656 920 1,512 1,440 600 4,972 2,666 4,600
No. of speech and language therapy initial therapy appointments
DOP Access M New 2017
New 2017 43,201 CHO 2,058 4,424 2,240 6,524 10,360 2,240 5,579 4,666 5,110
No. of speech and language therapy further therapy appointments
DOP Access M New 2017
New 2017 39,316 CHO 3,052 2,828 5,950 6,230 1,120 910 8,120 4,666 6,440

Appendices
2017 Primary Care Division Operational Plan Page 52
Key Performance Indicators Service Planning 2017
2016 2016 2017
2017 Expected Activity / Target
2017 Expected Activity / Target
2017 Expected Activity / Target
2017 Expected Activity / Target
2017 Expected Activity /
Target
2017 Expected Activity /
Target
2017 Expected Activity /
Target
2017 Expected Activity /
Target
2017 Expected Activity /
Target
KPI Title NSP/ DOP
KPI Type Access/ Quality /Access Activity
Report Freq-uency
2016 National Target /
Expected Activity
2016 Projected outturn
2017 National Target /
Expected Activity
Reported at
National/ CHO / HG
CHO 1 CHO 2 CHO 3 CHO 4 CHO 5 CHO 6 CHO 7 CHO 8 CHO 9
Primary Care – Podiatry
No. of patient referrals DOP Activity M 11,589 11,148 11,148 CHO 2,688 2,280 1,020 1,380 156 No direct service
No direct service
3,624 No direct service
Existing patients seen in the month DOP Activity M 5,210 5,454 5,454 CHO 1,636 998 565 1,485 87 No direct service
No direct service
683 No direct service
New patients seen DOP Activity M 8,887 9,192 9,504 CHO 2,616 1,708 918 1,022 168 No direct service
No direct service
3,072 No direct service
Total no. of podiatry patients on the treatment waiting list at the end of the reporting period
DOP Access M 3,186 2,699 2,699 CHO 397 609 504 597 26 No direct service
No direct service
566 No direct service
No. of podiatry patients on the treatment waiting list at the end of the reporting period 0 - ≤ 12 weeks
DOP Access M No target 1,194 No target CHO No target No target No target No target No target No direct service
No direct service
No target No direct service
No. of podiatry patients on the treatment waiting list at the end of the reporting period >12 weeks - ≤ 26 weeks
DOP Access M No target 481 No target CHO No target No target No target No target No target No direct service
No direct service
No target No direct service
No. of podiatry patients on the treatment waiting list at the end of the reporting period >26 weeks but ≤ 39 weeks
DOP Access M No target 244 No target CHO No target No target No target No target No target No direct service
No direct service
No target No direct service
No. of podiatry patients on the treatment waiting list at the end of the reporting period >39 weeks but ≤ 52 weeks
DOP Access M No target 190 No target CHO No target No target No target No target No target No direct service
No direct service
No target No direct service
No. of podiatry patients on the treatment waiting list at the end of the reporting period > 52 weeks
DOP Access M No target 590 No target CHO No target No target No target No target No target No direct service
No direct service
No target No direct service
% of podiatry patients on waiting list for treatment ≤ 12 weeks NSP Access M 75% 44% 44% CHO 44% 44% 44% 44% 44% No direct
service No direct service
44% No direct service
% of podiatry patients on waiting list for treatment ≤ 26 weeks DOP Access M 90% 62% 62% CHO 62% 62% 62% 62% 62% No direct
service No direct service
62% No direct service
% of podiatry patients on waiting list for treatment ≤ 39 weeks DOP Access M 95% 71% 71% CHO 71% 71% 71% 71% 71% No direct
service No direct service
71% No direct service

Appendices
2017 Primary Care Division Operational Plan Page 53
Key Performance Indicators Service Planning 2017
2016 2016 2017
2017 Expected Activity / Target
2017 Expected Activity / Target
2017 Expected Activity / Target
2017 Expected Activity / Target
2017 Expected Activity /
Target
2017 Expected Activity /
Target
2017 Expected Activity /
Target
2017 Expected Activity /
Target
2017 Expected Activity /
Target
KPI Title NSP/ DOP
KPI Type Access/ Quality /Access Activity
Report Freq-uency
2016 National Target /
Expected Activity
2016 Projected outturn
2017 National Target /
Expected Activity
Reported at
National/ CHO / HG
CHO 1 CHO 2 CHO 3 CHO 4 CHO 5 CHO 6 CHO 7 CHO 8 CHO 9
% of podiatry patients on waiting list for treatment ≤ to 52 weeks
NSP Access M 100% 78% 88% CHO 88% 88% 88% 88% 88% No direct service
No direct service
88% No direct service
No of patients with diabetic active foot disease treated in the reporting month
DOP Quality M 133 140 166 CHO 44 45 15 32 8 1 6 14 1
No. of treatment contacts for diabetic active foot disease in the reporting month
DOP Access /Activity
M 532 561 667 CHO 176 180 61 126 30 5 25 59 5
Primary Care – Ophthalmology
No. of patient referrals DOP Activity M 26,913 28,452 28,452 CHO 6,360 3,060 2,232 5,328 4,824 792 1,116 2,448 2,292
Existing patients seen in the month DOP Activity M 4,910 5,281 5,281 CHO 1,906 426 521 402 1,092 156 230 273 275
New patients seen DOP Activity M 16,524 23,616 33,779 CHO 9,702 3,428 3,680 3,923 5,298 1,204 1,408 1,593 3,543
Total no. of ophthalmology patients on the treatment waiting list at the end of the reporting period
DOP Access M 14,267 16,090 16,090 CHO 2,387 1,015 1,682 3,444 1,344 1,064 1,149 785 3,220
No. of ophthalmology patients on the treatment waiting list at the end of the reporting period 0 - ≤ 12 weeks
DOP Access M No target 4,550 No target CHO No target No target No target No target No target No target No target No target No target
No. of ophthalmology patients on the treatment waiting list at the end of the reporting period >12 weeks - ≤ 26 weeks
DOP Access M No target 3,117 No target CHO No target No target No target No target No target No target No target No target No target
No. of ophthalmology patients on the treatment waiting list at the end of the reporting period >26 weeks but ≤ 39 weeks
DOP Access M No target 2,095 No target CHO No target No target No target No target No target No target No target No target No target
No. of ophthalmology patients on the treatment waiting list at the end of the reporting period >39 weeks but ≤ 52 weeks
DOP Access M No target 1,670 No target CHO No target No target No target No target No target No target No target No target No target

Appendices
2017 Primary Care Division Operational Plan Page 54
Key Performance Indicators Service Planning 2017
2016 2016 2017
2017 Expected Activity / Target
2017 Expected Activity / Target
2017 Expected Activity / Target
2017 Expected Activity / Target
2017 Expected Activity /
Target
2017 Expected Activity /
Target
2017 Expected Activity /
Target
2017 Expected Activity /
Target
2017 Expected Activity /
Target
KPI Title NSP/ DOP
KPI Type Access/ Quality /Access Activity
Report Freq-uency
2016 National Target /
Expected Activity
2016 Projected outturn
2017 National Target /
Expected Activity
Reported at
National/ CHO / HG
CHO 1 CHO 2 CHO 3 CHO 4 CHO 5 CHO 6 CHO 7 CHO 8 CHO 9
No. of ophthalmology patients on the treatment waiting list at the end of the reporting period > 52 weeks
DOP Access M No target 4,658 No target CHO No target No target No target No target No target No target No target No target No target
% of ophthalmology patients on waiting list for treatment ≤ 12 weeks NSP Access M 60% 28% 50% CHO 50% 50% 50% 50% 50% 50% 50% 50% 50%
% of ophthalmology patients on waiting list for treatment ≤ 26 weeks DOP Access M 80% 48% 58% CHO 58% 58% 58% 58% 58% 58% 58% 58% 58%
% of ophthalmology patients on waiting list for treatment ≤ 39 weeks DOP Access M 90% 61% 61% CHO 61% 61% 61% 61% 61% 61% 61% 61% 61%
% of ophthalmology patients on waiting list for treatment ≤ 52 weeks
NSP Access M 100% 71% 81% CHO 81% 81% 81% 81% 81% 81% 81% 81% 81%
Primary Care – Audiology
No. of patient referrals DOP Activity M 18,317 22,620 22,620 CHO 3,144 3,240 1,392 3,108 3,180 Service
included in CHO9
3,432 2,232 2,892
Existing patients seen in the month DOP Activity M 2,850 2,740 2,740 CHO 417 341 188 386 269 Service
included in CHO9
489 298 352
New patients seen DOP Activity M 16,459 15,108 23,954 CHO 3,697 2,547 1,571 3,706 2,971 Service
included in CHO9
2,163 5,014 2,285
Total no. of audiology patients on the treatment waiting list at the end of the reporting period
DOP Access M 13,870 14,650 14,650 CHO 2,341 2,300 1,222 1,579 1,702 Service
included in CHO9
1,692 3,204 610
No. of audiology patients on the treatment waiting list at the end of the reporting period 0 - ≤ 12 weeks
DOP Access M No target 5,956 No target CHO No target No target No target No target No target Service
included in CHO9
No target No target No target
No. of audiology patients on the treatment waiting list at the end of the reporting period >12 weeks - ≤ 26 weeks
DOP Access M No target 3,352 No target CHO No target No target No target No target No target Service
included in CHO9
No target No target No target
No. of audiology patients on the treatment waiting list at the end of the reporting period >26 weeks but ≤ 39 weeks
DOP Access M No target 1,856 No target CHO No target No target No target No target No target Service
included in CHO9
No target No target No target

Appendices
2017 Primary Care Division Operational Plan Page 55
Key Performance Indicators Service Planning 2017
2016 2016 2017
2017 Expected Activity / Target
2017 Expected Activity / Target
2017 Expected Activity / Target
2017 Expected Activity / Target
2017 Expected Activity /
Target
2017 Expected Activity /
Target
2017 Expected Activity /
Target
2017 Expected Activity /
Target
2017 Expected Activity /
Target
KPI Title NSP/ DOP
KPI Type Access/ Quality /Access Activity
Report Freq-uency
2016 National Target /
Expected Activity
2016 Projected outturn
2017 National Target /
Expected Activity
Reported at
National/ CHO / HG
CHO 1 CHO 2 CHO 3 CHO 4 CHO 5 CHO 6 CHO 7 CHO 8 CHO 9
No. of audiology patients on the treatment waiting list at the end of the reporting period >39 weeks but ≤ 52 weeks
DOP Access M No target 1,340 No target CHO No target No target No target No target No target Service
included in CHO9
No target No target No target
No. of audiology patients on the treatment waiting list at the end of the reporting period > 52 weeks
DOP Access M No target 2,146 No target CHO No target No target No target No target No target Service
included in CHO9
No target No target No target
% of audiology patients on waiting list for treatment ≤ 12 weeks NSP Access M 60% 41% 50% CHO 50% 50% 50% 50% 50%
Service included in
CHO9
50% 50% 50%
% of audiology patients on waiting list for treatment ≤ 26 weeks DOP Access M 80% 64% 64% CHO 64% 64% 64% 64% 64%
Service included in
CHO9
64% 64% 64%
% of audiology patients on waiting list for treatment ≤ 39 weeks DOP Access M 90% 76% 76% CHO 76% 76% 76% 76% 76%
Service included in
CHO9
76% 76% 76%
% of audiology patients on waiting list for treatment ≤ to 52 weeks
NSP Access M 100% 85% 95% CHO 95% 95% 95% 95% 95% Service
included in CHO9
95% 95% 95%
Primary Care – Dietetics
No. of patient referrals DOP Activity M 27,858 31,884 31,884 CHO 4,692 3,444 2,760 7,584 3,696 2,460 2,856 1,896 2,496
Existing patients seen in the month DOP Activity M 5,209 3,480 3,480 CHO 623 434 132 1,007 353 289 311 164 167
New patients seen DOP Activity M 21,707 22,548 23,457 CHO 3,516 2,402 1,320 5,158 2,316 2,076 2,180 3,132 1,356
Total no. of dietetics patients on the treatment waiting list at the end of the reporting period
DOP Access M 5,479 8,843 8,843 CHO 1,065 1,492 514 1,240 1,361 291 789 1,576 515
No. of dietetics patients on the treatment waiting list at the end of the reporting period 0 - ≤ 12 weeks
DOP Access M No target 4,255 No target CHO No target No target No target No target No target No target No target No target No target

Appendices
2017 Primary Care Division Operational Plan Page 56
Key Performance Indicators Service Planning 2017
2016 2016 2017
2017 Expected Activity / Target
2017 Expected Activity / Target
2017 Expected Activity / Target
2017 Expected Activity / Target
2017 Expected Activity /
Target
2017 Expected Activity /
Target
2017 Expected Activity /
Target
2017 Expected Activity /
Target
2017 Expected Activity /
Target
KPI Title NSP/ DOP
KPI Type Access/ Quality /Access Activity
Report Freq-uency
2016 National Target /
Expected Activity
2016 Projected outturn
2017 National Target /
Expected Activity
Reported at
National/ CHO / HG
CHO 1 CHO 2 CHO 3 CHO 4 CHO 5 CHO 6 CHO 7 CHO 8 CHO 9
No. of dietetics patients on the treatment waiting list at the end of the reporting period >12 weeks - ≤ 26 weeks
DOP Access M No target 1,921 No target CHO No target No target No target No target No target No target No target No target No target
No. of dietetics patients on the treatment waiting list at the end of the reporting period >26 weeks but ≤ 39 weeks
DOP Access M No target 912 No target CHO No target No target No target No target No target No target No target No target No target
No. of dietetics patients on the treatment waiting list at the end of the reporting period >39 weeks but ≤ 52 weeks
DOP Access M No target 536 No target CHO No target No target No target No target No target No target No target No target No target
No. of dietetics patients on the treatment waiting list at the end of the reporting period > 52 weeks
DOP Access M No target 1,219 No target CHO No target No target No target No target No target No target No target No target No target
% of dietetics patients on waiting list for treatment ≤ 12 weeks
NSP Access M 70% 48% 48% CHO 48% 48% 48% 48% 48% 48% 48% 48% 48%
% of dietetics patients on waiting list for treatment ≤ 26 weeks DOP Access M 85% 70% 70% CHO 70% 70% 70% 70% 70% 70% 70% 70% 70%
% of dietetics patients on waiting list for treatment ≤ 39 weeks DOP Access M 95% 80% 80% CHO 80% 80% 80% 80% 80% 80% 80% 80% 80%
% of dietetics patients on waiting list for treatment ≤ to 52 weeks
NSP Access M 100% 86% 96% CHO 96% 96% 96% 96% 96% 96% 96% 96% 96%
Primary Care – Psychology
No. of patient referrals DOP Activity M 12,261 13,212 13,212 CHO 1,356 1,212 396 888 1,524 1,212 1,164 4,044 1,416
Existing patients seen in the month DOP Activity M 2,626 2,312 2,312 CHO 548 189 107 184 222 168 132 643 119
New patients seen DOP Activity M 9,367 10,152 10,152 CHO 1,200 1,032 84 420 1,128 1,164 1,644 2,748 732
Total no. of psychology patients on the treatment waiting list at the end of the reporting period
DOP Access M 6,028 7,068 7,068 CHO 848 679 483 957 838 371 548 1,267 1,077
No. of psychology patients on the treatment waiting list at the end of the reporting period 0 - ≤ 12 weeks
DOP Access M No target 1,979 No target CHO No target No target No target No target No target No target No target No target No target
No. of psychology patients on the treatment waiting list at the end of the reporting period >12 weeks - ≤ 26 weeks
DOP Access M No target 1,584 No target CHO No target No target No target No target No target No target No target No target No target

Appendices
2017 Primary Care Division Operational Plan Page 57
Key Performance Indicators Service Planning 2017
2016 2016 2017
2017 Expected Activity / Target
2017 Expected Activity / Target
2017 Expected Activity / Target
2017 Expected Activity / Target
2017 Expected Activity /
Target
2017 Expected Activity /
Target
2017 Expected Activity /
Target
2017 Expected Activity /
Target
2017 Expected Activity /
Target
KPI Title NSP/ DOP
KPI Type Access/ Quality /Access Activity
Report Freq-uency
2016 National Target /
Expected Activity
2016 Projected outturn
2017 National Target /
Expected Activity
Reported at
National/ CHO / HG
CHO 1 CHO 2 CHO 3 CHO 4 CHO 5 CHO 6 CHO 7 CHO 8 CHO 9
No. of psychology patients on the treatment waiting list at the end of the reporting period >26 weeks but ≤ 39 weeks
DOP Access M No target 1,026 No target CHO No target No target No target No target No target No target No target No target No target
No. of psychology patients on the treatment waiting list at the end of the reporting period >39 weeks but ≤ 52 weeks
DOP Access M No target 694 No target CHO No target No target No target No target No target No target No target No target No target
No. of psychology patients on the treatment waiting list at the end of the reporting period > 52 weeks
DOP Access M No target 1,785 No target CHO No target No target No target No target No target No target No target No target No target
% of psychology patients on waiting list for treatment ≤ 12 weeks NSP Access M 60% 28% 60% CHO 60% 60% 60% 60% 60% 60% 60% 60% 60%
% of psychology patients on waiting list for treatment ≤ 26 weeks DOP Access M 80% 50% 80% CHO 80% 80% 80% 80% 80% 80% 80% 80% 80%
% of psychology patients on waiting list for treatment ≤ 39 weeks DOP Access M 90% 65% 90% CHO 90% 90% 90% 90% 90% 90% 90% 90% 90%
% of psychology patients on waiting list for treatment ≤ to 52 weeks
NSP Access M 100% 75% 100% CHO 100% 100% 100% 100% 100% 100% 100% 100% 100%
Primary Care – Nursing
No. of patient referrals DOP Activity M 159,694 135,384
Data Gap
135,384
Data Gaps
CHO
6,156
Data Gaps
13,992
Data Gaps
18,648
Data Gaps
72,840
Data Gaps
1,284
Data Gaps
3,108
Data Gaps
1,308
Data Gaps Unavailable
18,048
Data Gaps
Existing patients seen in the month DOP Activity M 64,660 46,293
Data Gap
64,660
Data Gaps
CHO
3,857
Data Gaps
5,341
Data Gaps
21,934
Data Gaps
26,441
Data Gaps
Unavailable
Data Gaps
1,482
Data Gaps
1,800
Data Gaps Unavailable
3,805
Data Gaps
New patients seen DOP Activity M 123,024 110,784
Data Gap
123,024
Data Gaps
CHO
10,960
Data Gaps
17,185
Data Gaps
16,509
Data Gaps
49,450
Data Gaps
Unavailable Data Gaps
5,948
Data Gaps
1,884
Data Gaps Unavailable
21,088
Data Gaps
% of new patients accepted onto the caseload and seen within 12 weeks
NSP Access M New 2017
New 2017 100% CHO 100% 100% 100% 100% 100% 100% 100% 100% 100%

Appendices
2017 Primary Care Division Operational Plan Page 58
Key Performance Indicators Service Planning 2017
2016 2016 2017
2017 Expected Activity / Target
2017 Expected Activity / Target
2017 Expected Activity / Target
2017 Expected Activity / Target
2017 Expected Activity /
Target
2017 Expected Activity /
Target
2017 Expected Activity /
Target
2017 Expected Activity /
Target
2017 Expected Activity /
Target
KPI Title NSP/ DOP
KPI Type Access/ Quality /Access Activity
Report Freq-uency
2016 National Target /
Expected Activity
2016 Projected outturn
2017 National Target /
Expected Activity
Reported at
National/ CHO / HG
CHO 1 CHO 2 CHO 3 CHO 4 CHO 5 CHO 6 CHO 7 CHO 8 CHO 9
Child Health
% of children reaching 10 months within the reporting period who have had child development health screening on time or before reaching 10 months of age
NSP Quality M 95% 94% 95% CHO 95% 95% 95% 95% 95% 95% 95% 95% 95%
% of newborn babies visited by a PHN within 72 hours of discharge from maternity services
NSP Quality Q 97% 98% 98% CHO 98% 98% 98% 98% 98% 98% 98% 98% 98%
% of babies breastfed (exclusively and not exclusively) at first PHN visit
NSP Quality Q 56% 57% 58% CHO 58% 58% 58% 58% 58% 58% 58% 58% 58%
% of babies breastfed (exclusively and not exclusively) at three month PHN visit
NSP Quality Q 38% 38% 40% CHO 40% 40% 40% 40% 40% 40% 40% 40% 40%
Oral Health Primary Dental Care
No. of new patients attending for scheduled assessment
DOP Access /Activity
M Unavailable 47,904
Data Gap Unavailable CHO Unavailable Unavailable Unavailable Unavailable Unavailable Unavailable Unavailable Unavailable Unavailable
No. of new patients attending for unscheduled assessment
DOP Access /Activity
M Unavailable 25,476
Data Gap Unavailable CHO Unavailable Unavailable Unavailable Unavailable Unavailable Unavailable Unavailable Unavailable Unavailable
% of new patients who commenced treatment within three months of assessment
NSP Access M 80% 88%
Data Gap 88% CHO 88% 88% 88% 88% 88% 88% 88% 88% 88%
Orthodontics
No. of patients receiving active treatment at the end of the reporting period
DOP Access Q 16,887 18,404 18,404 National/ former region
% of referrals seen for assessment within 6 months
NSP Access Q 75% 60% 75% National/ former region
% of orthodontic patients on the waiting list for assessment ≤ 12 months
DOP Access Q 100% 99% 100% National/ former region

Appendices
2017 Primary Care Division Operational Plan Page 59
Key Performance Indicators Service Planning 2017
2016 2016 2017
2017 Expected Activity / Target
2017 Expected Activity / Target
2017 Expected Activity / Target
2017 Expected Activity / Target
2017 Expected Activity /
Target
2017 Expected Activity /
Target
2017 Expected Activity /
Target
2017 Expected Activity /
Target
2017 Expected Activity /
Target
KPI Title NSP/ DOP
KPI Type Access/ Quality /Access Activity
Report Freq-uency
2016 National Target /
Expected Activity
2016 Projected outturn
2017 National Target /
Expected Activity
Reported at
National/ CHO / HG
CHO 1 CHO 2 CHO 3 CHO 4 CHO 5 CHO 6 CHO 7 CHO 8 CHO 9
% of orthodontic patients on the treatment waiting list less than two years
DOP Access Q 75% 62% 75% National/ former region
% of orthodontic patients on treatment waiting list less than four years (grades 4 and 5)
DOP Access Q 95% 94% 95% National/ former region
No. of orthodontic patients on the assessment waiting list at the end of the reporting period
DOP Access Q 5,966 6,720 6,720 National/ former region
No. of orthodontic patients on the treatment waiting list – grade 4 –at the end of the reporting period
DOP Access /Activity
Q 9,912 9,741 9,741 National/ former region
No. of orthodontic patients on the treatment waiting list – grade 5 –at the end of the reporting period
DOP Access /Activity
Q 8,194 8,136 8,136 National/ former region
Reduce the proportion of orthodontic patients on the treatment waiting list waiting longer than 4 years (grades 4 and 5)
NSP Access Q <5% 6% <5% National/ former region
Health Amendment Act - Services to persons with State Acquired Hepatitis C
No. of Health Amendment Act cardholders who were reviewed
NSP Quality Q 798 212 586 National 50 50 40 64 60 50 135 50 87
Healthcare Associated Infections: Medication Management
Consumption of antibiotics in community settings (defined daily doses per 1,000 population)
NSP Quality Q <21.7 27.6 <21.7 National
Tobacco Control
% of primary care staff to undertake brief intervention training for smoking cessation
DOP Quality Q 5% 5% 5% CHO 5% 5% 5% 5% 5% 5% 5% 5% 5%

Appendices
2017 Primary Care Division Operational Plan Page 60
Social Inclusion – Full Metrics/KPI Suite (All metrics highlighted in yellow background are those that are included in the Balance Scorecard)
2016 2016 2017
2017 Expected Activity /
Target
2017 Expected Activity / Target
2017 Expected Activity /
Target
2017 Expected Activity /
Target
2017 Expected Activity /
Target
2017 Expected Activity / Target
2017 Expected Activity /
Target
2017 Expected Activity / Target
2017 Expected Activity /
Target
KPI Title NSP / DOP
KPI Type
Access/ Quality /Access Activity
Report Frequency
2016 National Target /
Expected Activity
2016 Projected outturn
2017 National Target /
Expected Activity
Reported at
National / CHO
CHO 1 CHO 2 CHO 3 CHO 4 CHO 5 CHO 6 CHO 7 CHO 8 CHO 9
Substance Misuse
No. of substance misusers who present for treatment
DOP Access
Q, 1 Qtr in arrears
6,972 6,760 6,760 CHO 804 624 288 512 1,316 588 1,276 652 700
No. of substance misusers who present for treatment who receive an assessment within two weeks
DOP Quality Q, 1 Qtr in
Arrears 4,864 4,748 4,748 CHO 348 616 256 280 1,024 432 1,088 216 488
% of substance misusers who present for treatment who receive an assessment within two weeks
DOP Quality Q,, 1 Qtr in
Arrears 100% 70% 100% CHO 100% 100% 100% 100% 100% 100% 100% 100% 100%
No. of substance misusers (over 18 years) for whom treatment has commenced following assessment
DOP Quality Q, 1 Qtr in
Arrears 5,584 5,932 5,932 CHO 664 616 240 440 1,212 532 1,136 516 576
No. of substance misusers (over 18) for whom treatment has commenced within one calendar month following assessment
DOP Quality Q, 1 Qtr in
Arrears 5,024 5,304 5,304 CHO 656 552 148 440 1,204 380 892 512 520
% of substance misusers (over 18 years) for whom treatment has commenced within one calendar month following assessment
NSP Access Q, 1 Qtr in
Arrears 100% 89% 100% CHO 100% 100% 100% 100% 100% 100% 100% 100% 100%
No. of substance misusers (under 18 years) for whom treatment has commenced following assessment
DOP Access Q, 1 Qtr in
Arrears 268 348 348 CHO 44 84 4 32 52 0 116 0 16
No. of substance misusers (under 18 years) for whom treatment has commenced within one week following assessment
DOP Access Q, 1 Qtr in
Arrears 260 296 296 CHO 24 76 4 32 52 0 92 0 16
% of substance misusers (under 18 years) for whom treatment has commenced within one week following assessment
NSP Access Q, 1 Qtr in
Arrears 100% 85% 100% CHO 100% 100% 100% 100% 100% 100% 100% 100% 100%

Appendices
2017 Primary Care Division Operational Plan Page 61
2016 2016 2017
2017 Expected Activity /
Target
2017 Expected Activity / Target
2017 Expected Activity /
Target
2017 Expected Activity /
Target
2017 Expected Activity /
Target
2017 Expected Activity / Target
2017 Expected Activity /
Target
2017 Expected Activity / Target
2017 Expected Activity /
Target
KPI Title NSP / DOP
KPI Type
Access/ Quality /Access Activity
Report Frequency
2016 National Target /
Expected Activity
2016 Projected outturn
2017 National Target /
Expected Activity
Reported at
National / CHO
CHO 1 CHO 2 CHO 3 CHO 4 CHO 5 CHO 6 CHO 7 CHO 8 CHO 9
% of substance misusers (over 18 years) for whom treatment has commenced who have an assigned key worker
DOP Quality Q, 1 Qtr in
Arrears 100% 74% 100% CHO 100% 100% 100% 100% 100% 100% 100% 100% 100%
% of substance misusers (over 18 years) for whom treatment has commenced who have a written care plan
DOP Quality Q, 1 Qtr in
Arrears 100% 87% 100% CHO 100% 100% 100% 100% 100% 100% 100% 100% 100%
% of substance misusers (under 18 years) for whom treatment has commenced who have an assigned key worker
DOP Quality Q, 1 Qtr in
Arrears 100% 91% 100% CHO 100% 100% 100% 100% 100% 100% 100% 100% 100%
% of substance misusers (under 18 years) for whom treatment has commenced who have a written care plan
DOP Quality Q, 1 Qtr in
Arrears 100% 90% 100% CHO 100% 100% 100% 100% 100% 100% 100% 100% 100%
Opioid Substitution
Total no. of clients in receipt of opioid substitution treatment (outside prisons)
NSP Access M, 1 Mth in
Arrears 9,515 9,560 9,700 CHO 94 136 294 438 464 991 3,733 594 2,956
No. of clients in opioid substitution treatment in clinics
DOP Access M, 1 Mth in
Arrears 5,470 5,466 5,084 CHO 0 49 134 326 172 477 2,023 196 1,707
No. of clients in opioid substitution treatment with level 2 GP’s
DOP Access M, 1 Mth in
Arrears 1,975 2,083 2,108 CHO 65 0 35 13 25 340 865 206 559
No. of clients in opioid substitution treatment with level 1 GP’s
DOP Access M, 1 Mth in
Arrears 2,080 2,011 2,508 CHO 29 87 125 99 267 174 845 192 690
No. of clients transferred from clinics to level 1 GP’s
DOP Access M, 1 Mth in
Arrears 300 288 300 CHO 0 5 9 18 60 27 86 12 83
No. of clients transferred from clinics to level 2 GP’s
DOP Access M, 1 Mth in
Arrears 134 81 140 CHO 0 0 2 8 6 15 50 9 50
No. of clients transferred from level 2 to level 1 GPs
DOP Access M, 1 Mth in
Arrears 119 21 150 CHO 10 0 6 10 10 16 48 10 40

Appendices
2017 Primary Care Division Operational Plan Page 62
2016 2016 2017
2017 Expected Activity /
Target
2017 Expected Activity / Target
2017 Expected Activity /
Target
2017 Expected Activity /
Target
2017 Expected Activity /
Target
2017 Expected Activity / Target
2017 Expected Activity /
Target
2017 Expected Activity / Target
2017 Expected Activity /
Target
KPI Title NSP / DOP
KPI Type
Access/ Quality /Access Activity
Report Frequency
2016 National Target /
Expected Activity
2016 Projected outturn
2017 National Target /
Expected Activity
Reported at
National / CHO
CHO 1 CHO 2 CHO 3 CHO 4 CHO 5 CHO 6 CHO 7 CHO 8 CHO 9
Total no. of new clients in receipt of opioid substitution treatment (outside prisons)
DOP Access
M, 1 Mth in Arrears
617 552 645 CHO 20 12 40 101 58 56 181 55 122
Total no. of new clients in receipt of opioid substitution treatment (clinics)
DOP Access
M, 1 Mth in Arrears
498 449 507 CHO 0 12 37 100 57 13 154 33 101
Total no. of new clients in receipt of opioid substitution treatment (level 2 GP)
DOP Access
M, 1 Mth in Arrears
119 103 138 CHO 20 0 3 1 1 43 27 22 21
Average waiting time (days) from referral to assessment for opioid substitution treatment
NSP Access M, 1 Mth in
Arrears 14 days 4 days 4 days CHO 4 days 4 days 4 days 4 days 4 days 4 days 4 days 4 days 4 days
Average waiting time (days) from opioid substitution assessment to exit from waiting list or treatment commenced
NSP Access M, 1 Mth in
Arrears 28 days 31 days 28 days CHO 28 days 28 days 28 days 28 days 28 days 28 days 28 days 28 days 28 days
No. of pharmacies providing opioid substitution treatment
DOP Access M, 1 Mth in
Arrears 653 654 654 CHO 26 42 44 69 74 60 134 96 109
No. of people obtaining opioid substitution treatment from pharmacies
DOP Access
M, 1 Mth in Arrears
6,463 6,630 6,630 CHO 101 143 279 429 509 608 2,079 639 1,843
Alcohol Misuse
No. of problem alcohol users who present for treatment
DOP Access
Q, 1 Qtr in Arrears
3,540 3,736 3,736 CHO 580 76 28 552 780 680 344 420 276
No. of problem alcohol users who present for treatment who receive an assessment within two weeks
DOP Access Q, 1 Qtr in
Arrears 2,344 1,900 1,900 CHO 256 68 20 272 616 336 140 128 64
% of problem alcohol users who present for treatment who receive an assessment within two weeks
DOP Access Q, 1 Qtr in
Arrears 100% 51% 100% CHO 100% 100% 100% 100% 100% 100% 100% 100% 100%
No. of problem alcohol users (over 18 years) for whom treatment has commenced following assessment
DOP Access Q, 1 Qtr in
Arrears 3,228 3,424 3,424 CHO 512 68 20 496 732 680 344 324 248

Appendices
2017 Primary Care Division Operational Plan Page 63
2016 2016 2017
2017 Expected Activity /
Target
2017 Expected Activity / Target
2017 Expected Activity /
Target
2017 Expected Activity /
Target
2017 Expected Activity /
Target
2017 Expected Activity / Target
2017 Expected Activity /
Target
2017 Expected Activity / Target
2017 Expected Activity /
Target
KPI Title NSP / DOP
KPI Type
Access/ Quality /Access Activity
Report Frequency
2016 National Target /
Expected Activity
2016 Projected outturn
2017 National Target /
Expected Activity
Reported at
National / CHO
CHO 1 CHO 2 CHO 3 CHO 4 CHO 5 CHO 6 CHO 7 CHO 8 CHO 9
No. of problem alcohol users (over 18 years) for whom treatment has commenced within one calendar month following assessment
DOP Access Q, 1 Qtr in
Arrears 3,228 2,956 2,956 CHO 508 68 20 496 728 348 228 312 248
% of problem alcohol users (over 18 years) for whom treatment has commenced within one calendar month following assessment
DOP Access Q, 1 Qtr in
Arrears 100% 86% 100% CHO 100% 100% 100% 100% 100% 100% 100% 100% 100%
No. of problem alcohol users (under 18 years) for whom treatment has commenced following assessment
DOP Access Q, 1 Qtr in
Arrears 56 36 36 CHO 12 0 0 8 16 0 0 0 0
No. of problem alcohol users (under 18 years) for whom treatment has commenced within one week following assessment
DOP Access Q, 1 Qtr in
Arrears 56 28 28 CHO 4 0 0 8 16 0 0 0 0
% of problem alcohol users (under 18 years) for whom treatment has commenced within one week following assessment
DOP Access Q, 1Qtr in Arrears
100% 78% 100% CHO 100% 100% 100% 100% 100% 100% 100% 100% 100%
% of problem alcohol users (over 18 years) for whom treatment has commenced who have an assigned key worker
DOP Quality Q, 1 Qtr in
Arrears 100% 60% 100% CHO 100% 100% 100% 100% 100% 100% 100% 100% 100%
% of problem alcohol users (over 18 years) for whom treatment has commenced who have a written care plan
DOP Quality Q, 1 Qtr in
Arrears 100% 91% 100% CHO 100% 100% 100% 100% 100% 100% 100% 100% 100%
% of problem alcohol users (under 18 years) for whom treatment has commenced who have an assigned key worker
DOP Quality Q, 1 Qtr in
Arrears 100% 89% 100% CHO 100% 100% 100% 100% 100% 100% 100% 100% 100%
% of problem alcohol users (under 18 years) for whom treatment has commenced who have a written care plan
DOP Quality Q, 1 Qtr in
Arrears 100% 67% 100% CHO 100% 100% 100% 100% 100% 100% 100% 100% 100%

Appendices
2017 Primary Care Division Operational Plan Page 64
2016 2016 2017
2017 Expected Activity /
Target
2017 Expected Activity / Target
2017 Expected Activity /
Target
2017 Expected Activity /
Target
2017 Expected Activity /
Target
2017 Expected Activity / Target
2017 Expected Activity /
Target
2017 Expected Activity / Target
2017 Expected Activity /
Target
KPI Title NSP / DOP
KPI Type
Access/ Quality /Access Activity
Report Frequency
2016 National Target /
Expected Activity
2016 Projected outturn
2017 National Target /
Expected Activity
Reported at
National / CHO
CHO 1 CHO 2 CHO 3 CHO 4 CHO 5 CHO 6 CHO 7 CHO 8 CHO 9
No. of staff trained in SAOR Screening and Brief Intervention for problem alcohol and substance use
DOP Quality Q, 1 Qtr in
Arrears 300 397 778 CHO 18 200 50 100 80 70 100 100 60
Needle Exchange
No. of pharmacies recruited to provide Needle Exchange Programme
DOP Quality TRI M, 1 Qtr
in Arrears 119 112 112 CHO 12 11 16 21 18 0 0 34 0
No. of unique individuals attending pharmacy needle exchange
NSP Access TRI M, 1 Qtr
in Arrears 1,731 1,647 1,647 CHO 39 128 279 383 337 0 0 481 0
Total no. of clean needles provided each month
DOP Access TRI M, 1 Qtr
in Arrears New 2017 New 2017 23,727 CHO 771 1,807 4,394 5,221 5,152 0 0 6,382 0
Average no. of clean needles (and accompanying injecting paraphenilia) per unique individual each month
DOP Quality TRI M, 1 Qtr
in Arrears New 2017 New 2017 14 CHO 14 14 14 14 14 14 14 14 14
No. and % of needle / syringe packs returned
DOP Quality TRI M, 1 Qtr
in Arrears 1,032 (30%)
863
(22%)
1,166 (30%)
CHO 28
(30%)
86
(30%)
204
(30%)
295
(30%)
253
(30%) 0 0
300
(30%) 0
Homeless Services
No. and % of individual service users admitted to homeless emergency accommodation hostels/ who have medical cards
DOP Quality Q 1,108 (75%)
1,093 (73%)
1,121 (75%)
CHO 55
(75%) 85
(75%) 152
(75%) 395
(75%) 93
(75%) 7
(75%) 57
(75%) 98
(75%) 179
(75%)
No. and % of service users admitted during the quarter who did not have a valid medical card on admission and who were assisted by hostel staff to acquire a medical card during the quarter
DOP Quality Q 302
(70%) 218
(54%) 281
(70%) CHO
8 (70%)
18 (70%)
29 (70%)
130 (70%)
17 (70%)
2 (70%)
8 (70%)
24 (70%)
45 (70%)

Appendices
2017 Primary Care Division Operational Plan Page 65
2016 2016 2017
2017 Expected Activity /
Target
2017 Expected Activity / Target
2017 Expected Activity /
Target
2017 Expected Activity /
Target
2017 Expected Activity /
Target
2017 Expected Activity / Target
2017 Expected Activity /
Target
2017 Expected Activity / Target
2017 Expected Activity /
Target
KPI Title NSP / DOP
KPI Type
Access/ Quality /Access Activity
Report Frequency
2016 National Target /
Expected Activity
2016 Projected outturn
2017 National Target /
Expected Activity
Reported at
National / CHO
CHO 1 CHO 2 CHO 3 CHO 4 CHO 5 CHO 6 CHO 7 CHO 8 CHO 9
No. and % of service users admitted to homeless emergency accommodation hostels / facilities whose health needs have been assessed within two weeks of admission
NSP Quality Q
1,311 (85%)
1,022 (68%)
1,272 (85%)
CHO
62 (85%)
97 (85%)
173 (85%)
448 (85%)
105 (85%)
8 (85%)
65 (85%)
111 (85%)
203 (85%)
No. and % of service users admitted to homeless emergency accommodation hostels / facilities whose health needs have been assessed and are being supported to manage their physical / general health, mental health and addiction issues as part of their care/support plan
DOP
Quality
Q 80%
1,128 (76%)
1,017 (80%)
CHO
50 (80%)
78 (80%)
138 (80%)
358 (80%)
84 (80%)
6 (80%)
52 (80%)
89 (80%)
162 (80%)
Traveller Health
No. of people who received health information on type 2 diabetes and cardiovascular health
NSP
Quality
Q
3,470 20% of the population
in each Traveller
Health Unit
3,481 3,481 CHO
246
697 351 321 396 130 477 587 276
No. of people who received awareness and participated in positive mental health initiatives
DOP Quality Q
3,470 20% of the population
in each Traveller
Health Unit
4,167 3,481 CHO
246
697 351 321 396 130 477 587 276

Appendices
2017 Primary Care Division Operational Plan Page 66
Palliative Care – Full Metrics/KPI Suite (All metrics highlighted in yellow background are those that are included in the Balance Scorecard)
Key Performance Indicators Service Planning 2017
2016 2016 2017
2017 Expected Activity /
Target
2017 Expected Activity /
Target
2017 Expected Activity / Target
2017 Expected Activity / Target
2017 Expected Activity / Target
2017 Expected Activity /
Target
2017 Expected Activity / Target
2017 Expected Activity /
Target
2017 Expected Activity /
Target
KPI Title NSP / DOP
KPI Type
Access/ Quality /Access Activity
Report Frequency
2016 National Target /
Expected Activity
2016 Projected outturn
2017 National Target /
Expected Activity
Reported at
National/ CHO / HG
Level
CHO 1
Saolta and Royal
College of Surgeons
HGs
CHO 2
Saolta HG
CHO 3
University of
Limerick HG
CHO 4
South/ South
West HGs
CHO 5
South/ South
West and Ireland
East HGs
CHO 6
Ireland East HG
CHO 7
Royal College of Surgeons
and Dublin
Midlands/Children’s
HGs
CHO 8
Ireland East, Royal
College of Surgeons
and Dublin
Midlands HGs
CHO 9
Ireland East and
Royal College of Surgeons/Children’s
HGs
Inpatient Palliative Care Services
Access to specialist inpatient bed within seven days (during the reporting month)
NSP Access M 98% 97% 98% CHO/HG 98% 98% 98% 98% 98% 98% 98% No
inpatient service
98%
No. accessing specialist inpatient bed within seven days (during the reporting month)
NSP Access M New 2017 New 2017 3,555 CHO/HG 355 333 593 728 92 152 679 No
inpatient service
623
Access to specialist palliative care inpatient bed from eight to14 days (during the reporting month)
DOP Access M 2% 3% 2% CHO/HG 2% 2% 2% 2% 2% 2% 2% No
inpatient service
2%
% patients triaged within one working day of referral (Inpatient Unit)
NSP Quality
M
2016 Q4 Reporting
90% 90% 90% CHO/HG 90% 90% 90% 90% 90% 90% 90% No
inpatient service
90%
No. of patients in receipt of treatment in specialist palliative care inpatient units (during the reporting month)
DOP
Access /Activity
M 474 466 494 CHO/HG 41 45 70 127 7 32 82 No
inpatient service
90
No. of new patients seen or admitted to the specialist palliative care service (monthly cumulative)
DOP
Access /Activity
M 2,877 2,916 3,110 CHO/HG 270 304 400 790 40 200 496 No
inpatient service
610
No. of admissions to specialist palliative care inpatient units (monthly cumulative)
DOP
Access /Activity
M 3,310 3,708 3,815 CHO/HG 360 350 580 910 75 250 620 No
inpatient service
670

Appendices
2017 Primary Care Division Operational Plan Page 67
Key Performance Indicators Service Planning 2017
2016 2016 2017
2017 Expected Activity /
Target
2017 Expected Activity /
Target
2017 Expected Activity / Target
2017 Expected Activity / Target
2017 Expected Activity / Target
2017 Expected Activity /
Target
2017 Expected Activity / Target
2017 Expected Activity /
Target
2017 Expected Activity /
Target
KPI Title NSP / DOP
KPI Type
Access/ Quality /Access Activity
Report Frequency
2016 National Target /
Expected Activity
2016 Projected outturn
2017 National Target /
Expected Activity
Reported at
National/ CHO / HG
Level
CHO 1
Saolta and Royal
College of Surgeons
HGs
CHO 2
Saolta HG
CHO 3
University of
Limerick HG
CHO 4
South/ South
West HGs
CHO 5
South/ South
West and Ireland
East HGs
CHO 6
Ireland East HG
CHO 7
Royal College of Surgeons
and Dublin
Midlands/Children’s
HGs
CHO 8
Ireland East, Royal
College of Surgeons
and Dublin
Midlands HGs
CHO 9
Ireland East and
Royal College of Surgeons/Children’s
HGs
% patients with a multidisciplinary care plan documented within five working days of initial assessment (Inpatient Unit)
NSP Quality
M
2016 Q4 Reporting
90% 90% 90% CHO/HG 90% 90% 90% 90% 90% 90% 90% No
inpatient service
90%
Community Palliative Care Services
Access to specialist palliative care services in the community provided within seven days (Normal place of residence) (during the reporting month)
NSP Access M
95%
92%
95% CHO 95% 95% 95% 95% 95% 95% 95% 95% 95%
Access to specialist palliative care services in the community provided to patients in their place of residence within eight to 14 days (Normal place of residence) (during the reporting month)
DOP Access M 3% 6% 3% CHO 3% 3% 3% 3% 3% 3% 3% 3% 3%
Access to specialist palliative care services in the community provided to patients in their place of residence within 15+ days (Normal place of residence) (during the reporting month)
DOP Access M 2% 2% 2% CHO 2% 2% 2% 2% 2% 2% 2% 2% 2%
% patients triaged within one working day of referral (Community )
NSP Quality M New 2017 New 2017 90% CHO 90% 90% 90% 90% 90% 90% 90% 90% 90%
No. of patients who received treatment in their normal place of residence
NSP Access /Activity
M 3,309 3,517 3,620 CHO 410 410 485 600 450 260 275 430 300
No. of new patients seen by specialist palliative care services in their normal place of residence
DOP Access /Activity
M 9,353 9,864 9,610 CHO 900 1,120 910 1,550 1,050 830 940 1,360 950

Appendices
2017 Primary Care Division Operational Plan Page 68
Key Performance Indicators Service Planning 2017
2016 2016 2017
2017 Expected Activity /
Target
2017 Expected Activity /
Target
2017 Expected Activity / Target
2017 Expected Activity / Target
2017 Expected Activity / Target
2017 Expected Activity /
Target
2017 Expected Activity / Target
2017 Expected Activity /
Target
2017 Expected Activity /
Target
KPI Title NSP / DOP
KPI Type
Access/ Quality /Access Activity
Report Frequency
2016 National Target /
Expected Activity
2016 Projected outturn
2017 National Target /
Expected Activity
Reported at
National/ CHO / HG
Level
CHO 1
Saolta and Royal
College of Surgeons
HGs
CHO 2
Saolta HG
CHO 3
University of
Limerick HG
CHO 4
South/ South
West HGs
CHO 5
South/ South
West and Ireland
East HGs
CHO 6
Ireland East HG
CHO 7
Royal College of Surgeons
and Dublin
Midlands/Children’s
HGs
CHO 8
Ireland East, Royal
College of Surgeons
and Dublin
Midlands HGs
CHO 9
Ireland East and
Royal College of Surgeons/Children’s
HGs
Day Care
No. of patients in receipt of specialist palliative day care services (during the reporting month)
DOP Access /Activity
M 349 337 355 CHO 15 35 40 120 0 40 40 0 65
No. of new patients who received specialist palliative day care services (monthly cumulative)
DOP Access
M 985 996 1,010 CHO 90 65 120 375 0 120 120 0 120
Intermediate Care
No. of patients in receipt of care in designated palliative care support beds (during the reporting month)
DOP
Access /Activity
M 165 146 176 CHO 21 4 19 31 33 13 40 15 0
Children’s Palliative Care Services
No. of children in the care of the children’s outreach nurse
NSP Access /Activity
M New 2017 New 2017 269 CHO 25 29 32 29 41 15 33 35 30
No. of new children in the care of the children’s outreach nurse
DOP Access /Activity
M New 2017 New 2017 New metric 2017 CHO To be set
in 2017 To be set in 2017
To be set in 2017
To be set in 2017
To be set in 2017
To be set in 2017
To be set in 2017
To be set in 2017
To be set in 2017
No. of children in the care of the specialist paediatric palliative care team in an acute hospital setting in the month
NSP Access /Activity
M New 2017 New 2017 20 HG 20 To be set in 2017
No. of new children in the care of the specialist paediatric palliative care team in an acute hospital setting
DOP
Access /Activity
M
New 2017
New 2017
63
HG
63
To be set in 2017

Appendices
2017 Primary Care Division Operational Plan Page 69
Key Performance Indicators Service Planning 2017
2016 2016 2017
2017 Expected Activity /
Target
2017 Expected Activity /
Target
2017 Expected Activity / Target
2017 Expected Activity / Target
2017 Expected Activity / Target
2017 Expected Activity /
Target
2017 Expected Activity / Target
2017 Expected Activity /
Target
2017 Expected Activity /
Target
KPI Title NSP / DOP
KPI Type
Access/ Quality /Access Activity
Report Frequency
2016 National Target /
Expected Activity
2016 Projected outturn
2017 National Target /
Expected Activity
Reported at
National/ CHO / HG
Level
CHO 1
Saolta and Royal
College of Surgeons
HGs
CHO 2
Saolta HG
CHO 3
University of
Limerick HG
CHO 4
South/ South
West HGs
CHO 5
South/ South
West and Ireland
East HGs
CHO 6
Ireland East HG
CHO 7
Royal College of Surgeons
and Dublin
Midlands/Children’s
HGs
CHO 8
Ireland East, Royal
College of Surgeons
and Dublin
Midlands HGs
CHO 9
Ireland East and
Royal College of Surgeons/Children’s
HGs
Acute Services Palliative Care
No. of new referrals for inpatient services seen by the specialist palliative care team
DOP Access /Activity
M
11,224 12,300 12,300 HG 874 1,564 878 2,064 966 984 1,976 1,258 1,736
Specialist palliative care services provided in the acute setting to new patients and re-referrals within two days
DOP Access /Activity
M 13,298 13,520 13,520 HG 724 1,934 846 2,056 1,576 1,522 1,812 1,372 1,678
Bereavement Services
No. of family units who received bereavement services
DOP Access /Activity
M 621 670 671 CHO 50 132 125 60 78 16 66 78 66

Appendices
2017 Primary Care Division Operational Plan Page 70
PCRS1 – Full Metrics/KPI Suite (All metrics highlighted in yellow background are those that are included in the Balance Scorecard)
Key Performance Indicators 2016 2016 2017
KPI Title
Reported against NSP / DOP
KPI Type Access/ Quality /Access Activity
Report Frequency
2016 National Target /
Expected Activity
2016 Projected/Actual*
outturn
2017 National Target /
Expected Activity
Medical Cards / GP Visit Cards
No. of persons covered by medical cards as at 31st December NSP Access M 1,675,767 1,697,081 1,672,654
No. of persons covered by GP visit cards as at 31st December NSP Access M 485,192 478,541 528,593
Sub-total 2,160,959 2,175,622 2,201,247
% of completed medical / GP visit card applications processed within the 15 day turnaround NSP Access M 95% 95% 95%
% of medical card / GP visit card applications, assigned for medical officer review, processed within 5 days NSP Quality M 90% 90% 90%
% of medical card / GP visit card applications which are accurately processed from a financial perspective by National Medical Card Unit staff NSP Quality M 95% 86% 95%
% of applications for medical cards / GP visit cards that are processed from end to end without the need for additional information DOP Quality M 60% 60% 60%
General Medical Services Scheme (GMS)
No. of prescriptions NSP Access M 17,780,183 19,203,192* 18,811,508
Total no. items prescribed NSP Access M - 58,929,932 57,821,617
Average dispensing fee (€) per item NSP Access M - 5.49 5.49
Average ingredient cost (€) per item (gross cost)2 NSP Access M - 11.56 11.55
No. of line items DOP Access M 54,229,556 58,533,213* 57,328,951
No. of claims - special items of service DOP Access M 999,158 1,066,509* 1,074,865
No. of claims - special type of consultations DOP Access M 1,164,844 1,294,186* 1,350,710
Long Term Illness Scheme
No. of claims NSP Access M 2,125,507 2,141,313* 2,407,912
Total no. items prescribed NSP Access M - 7,543,128* 8,657,750
Average dispensing fee (€) per item NSP Access M - 4.32 4.32
1 The PCRS budget and activity profile has been framed with reference to current working assumptions in relation to the levels of schemes eligibility and the value of savings to be achieved in 2017.
2 The gross cost is prior to any price reductions from the Framework Agreement on the Supply and Pricing of Medicines, manufacturers’ rebates and the netting off of prescription charges.

Appendices
2017 Primary Care Division Operational Plan Page 71
Key Performance Indicators 2016 2016 2017
KPI Title
Reported against NSP / DOP
KPI Type Access/ Quality /Access Activity
Report Frequency
2016 National Target /
Expected Activity
2016 Projected/Actual*
outturn
2017 National Target /
Expected Activity
Average ingredient cost (€) per item (gross cost) 2 NSP Access M - 21.17 21.25
No. of line items DOP Access M 7,555,211 7,543,128* 8,589,580
Drug Payment Scheme DOP
No. of claims NSP Access M 2,177,935 2,207,979* 2,411,929
Total no. items prescribed NSP Access M - 7,197,509* 8,305,797
Average dispensing fee (€) per item NSP Access M - 1.88 1.88
Average ingredient cost (€) per item (gross cost) 2 NSP Access M - 6.79 6.82
No. of line items DOP Access M 7,113,927 7,216,663 7,862,888
High Tech Drugs
No. of claims NSP Access M 533,824 595,980* 660,125
Dental Treatment Service Scheme (DTSS)
No. of treatments (above the line) DOP Access M 1,207,639 1,152,654* 1,190,453
No. of treatments (below the line) DOP Access M 65,315 63,635* 65,964
Total NSP 1,272,954 1,216,289* 1,256,417
No. of patients who have received treatment (above the line) DOP Access M 567,728 560,049* 583,168
No. of patients who have received treatment (below the line) DOP Access M 63,000 61,023 64,373
Community Ophthalmic Services Scheme
No. of treatments
(a) Adult DOP Access M 747,849 772,028* 765,132
(b) Children DOP Access M 85,084 91,320 92,485
Total NSP 832,933 863,348* 857,617

Appendices
2017 Primary Care Division Operational Plan Page 72
System Wide – Full Metrics/KPI Suite (All metrics highlighted in yellow background are those that are included in the Balance Scorecard)
Key Performance Indicators Service Planning 2017
2016 2016 2017
2017 Expected Activity / Target
2017 Expected Activity / Target
2017 Expected Activity / Target
2017 Expected Activity /
Target
2017 Expected Activity /
Target
2017 Expected Activity /
Target
2017 Expected Activity /
Target
2017 Expected Activity /
Target
2017 Expected Activity / Target
KPI Title NSP / DOP
KPI Type Access/ Quality /Access Activity
Report Freq-uency
2016 National Target /
Expected Activity
2016 Projected outturn
2017 National Target /
Expected Activity
Reported at
National / CHO
CHO 1
CHO 2
CHO 3
CHO 4
CHO 5
CHO 6
CHO 7
CHO 8
CHO 9
Budget Management including savings
Net Expenditure variance from plan (within budget) Pay
NSP M ≤0.33%
2016 Annual
Financial Statements
≤0.1% CHO ≤0.1% ≤0.1% ≤0.1% ≤0.1% ≤0.1% ≤0.1% ≤0.1% ≤0.1% 0.1%
Non-pay NSP M ≤0.33%
2016 Annual
Financial Statements
≤0.1% CHO ≤0.1% ≤0.1% ≤0.1% ≤0.1% ≤0.1% ≤0.1% ≤0.1% ≤0.1% 0.1%
Income NSP M ≤0.33%
2016 Annual
Financial Statements
≤0.33% CHO ≤0.1% ≤0.1% ≤0.1% ≤0.1% ≤0.1% ≤0.1% ≤0.1% ≤0.1% 0.1%
Capital
Capital expenditure versus expenditure profile
NSP Q 100% 100% 100% CHO 100% 100% 100% 100% 100% 100% 100% 100% 100%
Audit
% of internal audit recommendations implemented within 6 months of the report being received
NSP Q 75% 75% 75% CHO 75% 75% 75% 75% 75% 75% 75% 75% 75%
% of internal audit recommendations implemented, against total number of recommendations, within 12 months of report being received
NSP Q 95% 95% 95% CHO 95% 95% 95% 95% 95% 95% 95% 95% 95%
Service Arrangements / Annual Compliance Statement
% of number of service arrangements signed NSP M 100% 100% 100% CHO 100% 100% 100% 100% 100% 100% 100% 100% 100%
% of the monetary value of service arrangements signed
NSP M 100% 100% 100% CHO 100% 100% 100% 100% 100% 100% 100% 100% 100%

Appendices
2017 Primary Care Division Operational Plan Page 73
Key Performance Indicators Service Planning 2017
2016 2016 2017
2017 Expected Activity / Target
2017 Expected Activity / Target
2017 Expected Activity / Target
2017 Expected Activity /
Target
2017 Expected Activity /
Target
2017 Expected Activity /
Target
2017 Expected Activity /
Target
2017 Expected Activity /
Target
2017 Expected Activity / Target
KPI Title NSP / DOP
KPI Type Access/ Quality /Access Activity
Report Freq-uency
2016 National Target /
Expected Activity
2016 Projected outturn
2017 National Target /
Expected Activity
Reported at
National / CHO
CHO 1
CHO 2
CHO 3
CHO 4
CHO 5
CHO 6
CHO 7
CHO 8
CHO 9
% of annual compliance statements signed NSP A 100% 100% 100% CHO 100% 100% 100% 100% 100% 100% 100% 100% 100%
Workforce
% absence rates by staff category NSP M ≤3.5% 4.3% ≤3.5% CHO ≤3.5% ≤3.5% ≤3.5% ≤3.5% ≤3.5% ≤3.5% ≤3.5% ≤3.5% ≤3.5%
% adherence to funded staffing thresholds NSP M >99.5% >99.5% >99.5% CHO >99.5% >99.5% >99.5% >99.5% >99.5% >99.5% >99.5% >99.5% >99.5%
Health and Safety
No. of calls that were received by the National Health and Safety Helpdesk
NSP Q 15%
increase 15%
10% increase
10%
increase 10%
increase 10%
increase 10%
increase 10%
increase 10%
increase 10%
increase 10%
increase 10%
increase
Service User Experience-Complaints
% of complaints investigated within 30 working days of being acknowledged by the complaints officer
NSP M 75% 75% 75% CHO 75% 75% 75% 75% 75% 75% 75% 75% 75%
Serious Reportable Events (SREs)
% of Serious Reportable Events being notified within 24 hours to the senior accountable officer
NSP Quality M 99% 40% 99% CHO 99% 99% 99% 99% 99% 99% 99% 99% 99%
% of investigations completed within 120 days of the notification of the event to the senior accountable officer
NSP Quality M 90% 0% 90% CHO 90% 90% 90% 90% 90% 90% 90% 90% 90%
Safety Incident Reporting
% of safety incidents being entered onto the National Incident Management System (NIMS) within 30 days of occurrence by CHO
NSP Quality Q 90% 50% 90% CHO 90% 90% 90% 90% 90% 90% 90% 90% 90%
Extreme and major safety incidents as a % of all incidents reported as occurring
NSP Quality Q New PI 2017
New PI 2017
Actual to be reported in
2017 CHO
Actual to be
reported in 2017
Actual to be
reported in 2017
Actual to be
reported in 2017
Actual to be reported in
2017
Actual to be reported
in 2017
Actual to be reported
in 2017
Actual to be reported
in 2017
Actual to be reported
in 2017
Actual to be
reported in 2017

Appendices
2017 Primary Care Division Operational Plan Page 74
Key Performance Indicators Service Planning 2017
2016 2016 2017
2017 Expected Activity / Target
2017 Expected Activity / Target
2017 Expected Activity / Target
2017 Expected Activity /
Target
2017 Expected Activity /
Target
2017 Expected Activity /
Target
2017 Expected Activity /
Target
2017 Expected Activity /
Target
2017 Expected Activity / Target
KPI Title NSP / DOP
KPI Type Access/ Quality /Access Activity
Report Freq-uency
2016 National Target /
Expected Activity
2016 Projected outturn
2017 National Target /
Expected Activity
Reported at
National / CHO
CHO 1
CHO 2
CHO 3
CHO 4
CHO 5
CHO 6
CHO 7
CHO 8
CHO 9
% of claims received by State Claims Agency that were not reported previously as an incident
NSP Quality A New PI 2016
55% 40% CHO 40% 40% 40% 40% 40% 40% 40% 40% 40%
Immunisation
% update in flu vaccine for those aged 65 and older with a medical card or GP visit card
NSP A 75% 55.4% 75% CHO 75% 75% 75% 75% 75% 75% 75% 75% 75%
% children aged 24 months who have received 3 doses of the 6-in-1 vaccine NSP Q 75% 94.9% 95% CHO 95% 95% 95% 95% 95% 95% 95% 95% 95%
% children aged 24 months who have received the measles, mumps, rubella (MMR) vaccine
NSP Q 95% 92.7% 95% CHO 95% 95% 95% 95% 95% 95% 95% 95% 95%
% of first year girls who have received two doses of HPV vaccine NSP A 85% 70% 85% CHO 85% 85% 85% 85% 85% 85% 85% 85% 85%
* All incidents including SREs are to be reported on NIMS.

Appendices
2017 Primary Care Division Operational Plan Page 75
Appendix 4: Capital Infrastructure This appendix outlines Primary Care capital projects that were: 1) completed in 2016 and will be operational in 2017; 2) are due to be completed and operational in 2017; or 3) are due to be completed in 2017 and will be operational in 2018.
Facility Project details Project
Completion Fully
Operational Additional
Beds Replace-
ment Beds
Capital Cost €m 2017 Implications
2017 Total WTE Rev Costs
€m
PRIMARY CARE
CHO 1: Donegal, Sligo/Leitrim/West Cavan, Cavan/Monaghan
Ballymote, Co. Sligo Primary Care Centre, by PPP Q4 2017 Q4 2017 0 0 1.60 1.60 0 0.00
CHO 2: Galway, Roscommon, Mayo
Ballinrobe, Co. Mayo Primary Care Centre, by PPP Q3 2017 Q3 2017 0 0 1.30 1.30 0 0.00
Boyle, Co. Roscommon Primary Care Centre, by PPP Q3 2017 Q3 2017 0 0 0.10 0.10 0 0.00
Tuam, Co. Galway Primary Care Centre, by PPP Q4 2017 Q4 2017 0 0 1.60 1.60 0 0.00
Claremorris, Co. Mayo Primary Care Centre, by PPP Q3 2017 Q4 2017 0 0 1.30 1.30 0 0.00
CHO 3: Clare, Limerick, North Tipperary/East Limerick
Borrisokane, Co. Tipperary Extension of primary care facility Q2 2017 Q3 2017 0 0 0.06 0.46 0 0.00
Lord Edward Street, Limerick City Primary Care Centre, by PPP Q4 2017 Q4 2017 0 0 1.10 1.10 0 0.00
CHO 4: Kerry, North Cork, North Lee, South Lee, West Cork
St. Finbarr’s Hospital, Cork Audiology services, ground floor, block 2 Q1 2017 Q1 2017 0 0 0.96 1.50 0 0.00
St. Mary’s, Gurranabraher, Cork City Primary Care Centre Q4 2017 Q4 2017 0 0 11.00 18.33 0 0.00
Ballyheigue, Co. Kerry Primary Care Centre, refurbishment of existing health centre
Q1 2017 Q2 2017 0 0 0.14 0.14 0 0.00
Carrigaline, Co. Cork Primary Care Centre, by lease agreement Q3 2017 Q4 2017 0 0 0.00 0.00 0 0.00
University Hospital Kerry, Tralee, Co. Kerry
Palliative Care Development –15-bed inpatient unit funded and directly contracted by Kerry Hospice Association. Enabling works funded by HSE in 2015 (€0.4m)
Q2 2017 Q2 2017 15 0 0.21 6.11 42.8 3.00
CHO 5: South Tipperary, Carlow, Kilkenny, Waterford, Wexford
Tipperary Town Primary Care Centre, by lease agreement Q4 2016 Q1 2017 0 0 0.30 0.30 0 0.00

Appendices
2017 Primary Care Division Operational Plan Page 76
Facility Project details Project
Completion Fully
Operational Additional
Beds Replace-
ment Beds
Capital Cost €m 2017 Implications
2017 Total WTE Rev Costs
€m
CHO 7: Kildare/West Wicklow, Dublin West, Dublin South City, Dublin South West
Junction House, Kilnamanagh/Tymon, Dublin
Primary Care Centre, by lease agreement Q3 2017 Q4 2017 0 0 0.00 0.00 0 0.00
Cashel Road/Walkinstown, Crumlin, Dublin
Primary Care Centre, by lease agreement Q2 2017 Q3 2017 0 0 0.00 0.00 0 0.00
Springfield, Tallaght, Dublin Primary Care Centre, by lease agreement (phased) Q4 2016 Q1 2017 0 0 0.60 0.60 0 0.00
Celbridge, Co. Kildare Primary Care Centre, by lease agreement Q4 2016 Q1 2017 0 0 0.00 0.00 0 0.00
Blessington, Co. Wicklow Primary Care Centre, by lease agreement Q3 2016 Q1 2017 0 0 0.15 0.15 0 0.00
CHO 8: Laois/Offaly, Longford/Westmeath, Louth/Meath
Mullingar, Co. Westmeath Primary Care Centre, by lease agreement Q2 2017 Q2 2017 0 0 0.00 0.00 0 0.00
Drogheda (North), Co. Louth Primary Care Centre, by lease agreement Q4 2017 Q1 2018 0 0 0.00 0.00 0 0.00
Tullamore, Co. Offaly Primary Care Centre, by lease agreement Q4 2017 Q1 2018 0 0 0.00 0.00 0 0.00
CHO 9: Dublin North, Dublin North Central, Dublin North West
Balbriggan, Co. Dublin Primary Care Centre, by lease agreement Q1 2017 Q1 2017 0 0 0.00 0.00 0 0.00
Portmarnock, Co. Dublin Primary Care Centre, by lease agreement Q2 2017 Q3 2017 0 0 0.00 0.00 0 0.00
Grangegorman, Dublin Primary Care Centre, to be developed on site in Grangegorman
Q1 2017 Q1 2017 0 0 2.00 13.18 0 0.00
Relocation of Eve Holdings to Grangegorman Villas (1-5). Enabling works for PCC
Q3 2017 Q3 2017 0 0 0.45 0.75 0 0.00
Totals 15 0 22.87 48.52 0 3.0