price indexes at basic heading level: within-region...
TRANSCRIPT

Price Indexes at Basic Heading Level:Within-Region Comparisons and Global Linking
Robert Hill and Miriam SteurerUniversity of Graz
World BankICP Task Force – PPP Compilation/Computation
March 13, 2018
Price Indexes at Basic Heading Level Hill – ICP Task Force – PPP Compilation/Computation 1 / 25
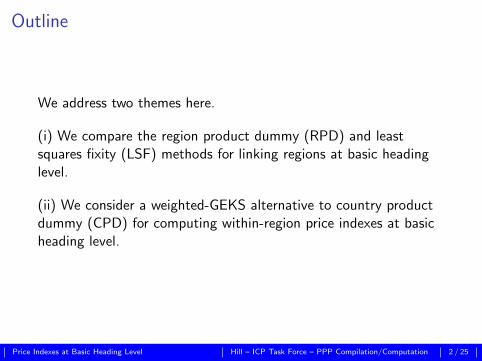
Outline
We address two themes here.
(i) We compare the region product dummy (RPD) and leastsquares fixity (LSF) methods for linking regions at basic headinglevel.
(ii) We consider a weighted-GEKS alternative to country productdummy (CPD) for computing within-region price indexes at basicheading level.
Price Indexes at Basic Heading Level Hill – ICP Task Force – PPP Compilation/Computation 2 / 25

The Region Product Dummy (RPD) Method
The RPD method estimates the following hedonic model for eachbasic heading:
y = Zβ + Rγ + ε,
where y is a vector of log prices, Z is a matrix of product dummyvariables and R is a matrix of region dummy variables.
The RPD between-region linking factors are obtained as follows:
L̂F r = exp(γ̂r ).
Price Indexes at Basic Heading Level Hill – ICP Task Force – PPP Compilation/Computation 3 / 25

Least-squares fixity (LSF)For country j in region r for each basic heading, the LSF methodlinks regions as follows:
PGlobalrj = PRegion
rj
Kr∏k=1
(PCorerk
PRegionrk
)1/Kr ,
where PRegionrj denotes a within-region r CPD comparison.
PCorerj denotes a global CPD comparison over the core products,
and Kr is the number of countries in region r .
Alternatively, the method can be expressed in terms of betweenregion linking factors. The linking factor (LF) for region r is:
LFr =Kr∏k=1
(PCorerk
PRegionrk
)1/Kr
=
∏Krk=1
(PCorerk
)1/Kr∏Krk=1
(PRegionrk
)1/Kr.
Price Indexes at Basic Heading Level Hill – ICP Task Force – PPP Compilation/Computation 4 / 25

If a country is missing from the global core list for a particularbasic heading, then it must be likewise excluded when computingthe within-region results above, so as to ensure that the geometricmeans are computed over the same list of countries.
Such countries are still included in the comparison. They just playno role in determining the between-region linking factor for thatbasic heading.
Also, the LSF method can be used irrespective of what method isused to make the within-region and global core list comparisons.These comparisons could be made using CPD, CPD-w, or weightedGEKS applied to the Jevons indexes.
Price Indexes at Basic Heading Level Hill – ICP Task Force – PPP Compilation/Computation 5 / 25

Comparing the RPD and LSF Methods Empirically
The official ICP 2011 results for most basic headings werecomputed using the RPD method.
Using CPD-w with 3:1 weights to make the within-region andglobal core list comparisons, we compute LSF linking factors forICP 2011.
We compare the LSF and official ICP 2011 linking factors for eachregion r as follows:
Diffr =N∏
n=1
(LF LSF
r
LFRPDr
)1/N
,
where n = 1, . . . ,N indexes the basic headings where the RPDmethod was used in ICP 2011.
Price Indexes at Basic Heading Level Hill – ICP Task Force – PPP Compilation/Computation 6 / 25

Table 1 : LSF Linking Factors Relative to RPD
Base South Africa Hong Kong USA Brazil Oman
Region Africa Asia E-OECD LA WA
Diffr 0.9923 1.0068 1.0000 1.0143 1.0046
Relative to Eurostat-OECD, this means that prices are lower inAfrica with LSF but higher in all other regions compared withCPD. For the case of Latin America, the average difference is 1.4percent.
Price Indexes at Basic Heading Level Hill – ICP Task Force – PPP Compilation/Computation 7 / 25

Figure 1 : Max(RPD,LSF)/Min(RPD,LSF):
Africa Asia OECD LA WA GeoMean >1.04
1101111 Rice 1.0026 1.0117 1.0000 1.0422 1.0025 1.0117
1101112 Other cereals, flour and other products1.0120 1.0126 1.0000 1.0008 1.0170 1.0085
1101113 Bread 1.0045 1.0079 1.0000 1.0030 1.0004 1.0032
1101114 Other bakery products 1.0098 1.0154 1.0000 1.0016 1.0167 1.0087
1101115 Pasta products 1.0194 1.0079 1.0000 1.0450 1.0097 1.0163
1101121 Beef and veal 1.0109 1.0331 1.0000 1.0127 1.0013 1.0115
1101122 Pork 1.0066 1.0570 1.0000 1.0017 1.1190 1.0359
1101123 Lamb, mutton and goat 1.0108 1.0623 1.0000 1.0077 1.0356 1.0230
1101124 Poultry 1.0125 1.0112 1.0000 1.0094 1.0100 1.0086
1101125 Other meats and meat preparations1.0201 1.0267 1.0000 1.0027 1.0050 1.0108
1101131 Fresh, chilled or frozen fish and seafood1.0152 1.0025 1.0000 1.0017 1.0316 1.0101
1101132 Preserved or processed fish and seafood1.0096 1.0024 1.0000 1.0030 1.0066 1.0043
1101141 Fresh milk 1.0014 1.0161 1.0000 1.0325 1.0079 1.0115
1101142 Preserved milk and other milk products1.0259 1.0254 1.0000 1.0070 1.0303 1.0176
1101143 Cheese 1.0019 1.0354 1.0000 1.0047 1.0030 1.0089
1101144 Eggs and egg-based products 1.0109 1.0620 1.0000 1.0154 1.0144 1.0203
1101151 Butter and margarine 1.0032 1.0058 1.0000 1.0058 1.0042 1.0038
1101153 Other edible oils and fats 1.0104 1.0006 1.0000 1.0070 1.0090 1.0054
1101161 Fresh or chilled fruit 1.0021 1.0017 1.0000 1.0081 1.0039 1.0032
1101162 Frozen, preserved or processed fruit and fruit-based products1.0190 1.0493 1.0000 1.0053 1.0121 1.0170
1101171 Fresh or chilled vegetables other than potatoes1.0002 1.0028 1.0000 1.0018 1.0001 1.0010
1101173 Frozen, preserved or processed vegetables and vegetable-based products1.0133 1.0097 1.0000 1.0080 1.0014 1.0065
1101181 Sugar 1.0154 1.0715 1.0000 1.0133 1.0631 1.0323
1101182 Jams, marmalades and honey 1.0129 1.0151 1.0000 1.0093 1.0065 1.0087
1101183 Confectionery, chocolate and ice cream1.0302 1.0112 1.0000 1.0002 1.0004 1.0083
1101191 Food products nec 1.0139 1.0065 1.0000 1.0158 1.0066 1.0085
1101211 Coffee, tea and cocoa 1.0022 1.0025 1.0000 1.0180 1.0023 1.0050
1101221 Mineral waters, soft drinks, fruit and vegetable juices1.0052 1.0038 1.0000 1.0020 1.0034 1.0029
1102111 Spirits 1.0002 1.0609 1.0000 1.0130 1.1288 1.0394
1102121 Wine 1.0407 1.0083 1.0000 1.0490 1.1370 1.0459 ***
1102131 Beer 1.0131 1.0276 1.0000 1.0108 1.0065 1.0116
1102211 Tobacco 1.0031 1.0309 1.0000 1.0012 1.0074 1.0085
Price Indexes at Basic Heading Level Hill – ICP Task Force – PPP Compilation/Computation 8 / 25

Figure 1 : Max(RPD,LSF)/Min(RPD,LSF)
Africa Asia OECD LA WA GeoMean
1103111 Clothing materials, other articles of clothing and clothing accessories1.0213 1.0206 1.0000 1.0159 1.0146 1.0145
1103121 Garments 1.0052 1.0021 1.0000 1.0071 1.0088 1.0046
1103141 Cleaning, repair and hire of clothing1.0220 1.0050 1.0000 1.0115 1.0004 1.0077
1103211 Shoes and other footwear 1.0312 1.0031 1.0000 1.0096 1.0112 1.0110
1103221 Repair and hire of footwear 1.0371 1.0227 1.0000 1.0698 1.0148 1.0286
1104311 Maintenance and repair of the dwelling1.0063 1.0283 1.0000 1.0194 1.0694 1.0244
1104411 Water supply 1.0027 1.0031 1.0000 1.0482 1.0133
1104511 Electricity 1.1001 1.1132 1.0000 1.0010 1.0121 1.0441 ***
1104521 Gas 1.0430 1.0094 1.0000 1.0412 1.0333 1.0252
1104531 Other fuels 1.0072 1.0285 1.0000 1.0075 1.0457 1.0176
1105111 Furniture and furnishings 1.0142 1.0326 1.0000 1.0214 1.0281 1.0192
1105121 Carpets and other floor coverings1.0372 1.0695 1.0000 1.2466 1.0123 1.0696 ***
1105211 Household textiles 1.0005 1.0193 1.0000 1.0316 1.0020 1.0106
1105311 Major household appliances whether electric or not1.0127 1.0002 1.0000 1.0086 1.0010 1.0045
1105321 Small electric household appliances1.0120 1.0037 1.0000 1.0144 1.0044 1.0069
1105331 Repair of household appliances 1.0299 1.0117 1.0000 1.0305 1.0071 1.0158
1105411 Glassware, tableware and household utensils1.0389 1.0257 1.0000 1.0169 1.0056 1.0173
1105521 Small tools and miscellaneous accessories1.0013 1.0011 1.0000 1.0057 1.0244 1.0065
1105611 Non-durable household goods 1.0114 1.0448 1.0000 1.0116 1.0018 1.0138
1105621 Domestic services 1.0571 1.0301 1.0000 1.0391 1.0038 1.0258
1105622 Household services 1.1328 1.0677 1.0000 1.2741 1.0556 1.1022 ***
1106111 Pharmaceutical products 1.0108 1.0459 1.0000 1.0098 1.0018 1.0135
1106121 Other medical products 1.0211 1.0045 1.0000 1.0089 1.0125 1.0094
1106131 Therapeutic appliances and equipment1.0141 1.0129 1.0000 1.0787 1.0199 1.0248
1106211 Medical Services 1.1100 1.1417 1.0000 1.1042 1.1092 1.0919 ***
1106231 Paramedical services 1.0583 1.1038 1.0000 1.0372 1.0818 1.0556 ***
1107111 Motor cars 1.0173 1.0367 1.0000 1.0150 1.0000 1.0137
1107131 Bicycles 1.0330 1.0318 1.0000 1.0108 1.0323 1.0215
1107221 Fuels and lubricants for personal transport equipment1.0204 1.0125 1.0000 1.0156 1.0210 1.0139
1107231 Maintenance and repair of personal transport equipemnt1.0055 1.0078 1.0000 1.0346 1.0088 1.0113
1107241 Other services in respect of personal transport equipment1.0559 1.0776 1.0000 1.0153 1.0277 1.0349
1107311 Passenger transport by railway 1.0412 1.0071 1.0000 1.6843 1.1539 1.1530 ***
Price Indexes at Basic Heading Level Hill – ICP Task Force – PPP Compilation/Computation 9 / 25

Figure 1 : Max(RPD,LSF)/Min(RPD,LSF)
Africa Asia OECD LA WA GeoMean
1107321 Passenger transport by road 1.0161 1.0110 1.0000 1.0188 1.0330 1.0157
1107331 Passenger transport by air 1.0404 1.0368 1.0000 1.0244 1.0623 1.0326
1108111 Postal services 1.0255 1.0606 1.0000 1.0269 1.0119 1.0248
1109111 Audio-visual, photographic and information processing equipment1.0006 1.0195 1.0000 1.0092 1.0015 1.0061
1109141 Recording media 1.0260 1.0237 1.0000 1.0021 1.0070 1.0117
1109151 Repair of audio-visual, photographic and information processing equipment1.0415 1.0681 1.0000 1.0224 1.0067 1.0274
1109311 Other recreational items and equipment1.0109 1.0599 1.0000 1.0127 1.0161 1.0197
1109331 Garden and pets 1.0459 1.0893 1.0000 1.0952 1.0358 1.0526 ***
1109351 Veterinary and other services for pets1.0286 1.0236 1.0000 1.0185 1.0161 1.0173
1109411 Recreational and sporting services1.0331 1.0133 1.0000 1.0075 1.0062 1.0120
1109421 Cultural services 1.0085 1.0046 1.0000 1.0109 1.0056 1.0059
1109511 Newspapers, books and stationery1.0261 1.0000 1.0000 1.0049 1.0025 1.0067
1111111 Catering services 1.0232 1.0159 1.0000 1.0061 1.0036 1.0097
1111211 Accommodation services 1.0226 1.1077 1.0000 1.0352 1.0046 1.0333
1112111 Hairdressing salons and personal grooming establishments1.0037 1.0040 1.0000 1.0027 1.0010 1.0023
1112121 Appliances, articles and products for personal care1.0006 1.0022 1.0000 1.0030 1.0056 1.0023
1112311 Jewellery, clocks and watches 1.0206 1.0593 1.0000 1.0281 1.0002 1.0214
1112321 Other personal effects 1.0355 1.0088 1.0000 1.0145 1.0224 1.0162
Geomean 1.0215 1.0280 1.0000 1.0297 1.0214 1.0200
Price Indexes at Basic Heading Level Hill – ICP Task Force – PPP Compilation/Computation 10 / 25
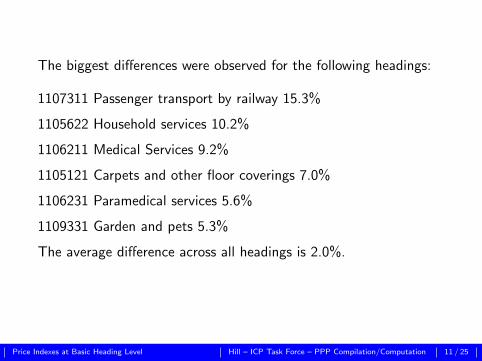
The biggest differences were observed for the following headings:
1107311 Passenger transport by railway 15.3%
1105622 Household services 10.2%
1106211 Medical Services 9.2%
1105121 Carpets and other floor coverings 7.0%
1106231 Paramedical services 5.6%
1109331 Garden and pets 5.3%
The average difference across all headings is 2.0%.
Price Indexes at Basic Heading Level Hill – ICP Task Force – PPP Compilation/Computation 11 / 25

Robustness to the Treatment of Egypt and Sudan
With the ICP 2011 data we can do an experiment and compare theimpact on the RPD and LSF linking factors of locating Egypt andSudan in Africa or Western Asia.
RPD1 and LSF1: Locate Egypt and Sudan in Africa
RPD2 and LSF2: Locate Egypt and Sudan in Western Asia
We can now check the robustness of the RPD and LSF linkingfactors LFr to the location of Egypt and Sudan as follows:
Diff RPDr =
N∏n=1
(LFRPD2
r
LFRPD1r
)1/N
, Diff LSFr =
N∏n=1
(LF LSF2
r
LF LSF1r
)1/N
,
where n = 1, . . . ,N indexes the basic headings where the RPDmethod was used in ICP 2011.
These results are not yet available.
Price Indexes at Basic Heading Level Hill – ICP Task Force – PPP Compilation/Computation 12 / 25

We can also compute equivalent versions of Figure 1:Max(RPD1,RPD2)/Min(RPD1,RPD2) andMax(LSF 1, LSF 2)/Min(LSF 1, LSF 2) for each basic heading ineach region, and the overall average.
Price Indexes at Basic Heading Level Hill – ICP Task Force – PPP Compilation/Computation 13 / 25

Another Look at the CPD Method
The CPD method estimates the following hedonic model for eachbasic heading:
y = Zβ + Dδ + ε,
where y is a vector of log prices, Z is a matrix of product dummyvariables and D is a matrix of country dummy variables.
The CPD price indexes are obtained as follows:
P̂k = exp(δ̂k).
The estimated characteristic shadow price vector and price indexvector are derived as follows:
β̂ = (ZTZ )−1ZT (y − D δ̂),
δ̂ = (DTD)−1DT (y − Z β̂).
Price Indexes at Basic Heading Level Hill – ICP Task Force – PPP Compilation/Computation 14 / 25
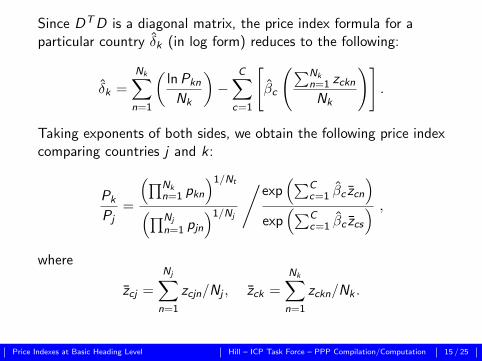
Since DTD is a diagonal matrix, the price index formula for aparticular country δ̂k (in log form) reduces to the following:
δ̂k =
Nk∑n=1
(ln Pkn
Nk
)−
C∑c=1
[β̂c
(∑Nkn=1 zckn
Nk
)].
Taking exponents of both sides, we obtain the following price indexcomparing countries j and k :
Pk
Pj=
(∏Nkn=1 pkn
)1/Nt
(∏Nj
n=1 pjn
)1/Nj
/exp
(∑Cc=1 β̂c z̄cn
)exp
(∑Cc=1 β̂c z̄cs
) ,
where
z̄cj =
Nj∑n=1
zcjn/Nj , z̄ck =
Nk∑n=1
zckn/Nk .
Price Indexes at Basic Heading Level Hill – ICP Task Force – PPP Compilation/Computation 15 / 25

The term (∏Nt
n=1 pkn)1/Nk/(∏Nj
n=1 pjn)1/Nj in the numerator abovecompares the average price of a house in the two periods.
The quality adjustment is provided by the term in thedenominator: exp(
∑Cc=1 β̂c z̄ck)/ exp(
∑Cc=1 β̂c z̄cj).
This is a quantity index that compares the price of the averagehouse in the two periods using the time-dummy averagecharacteristic prices.
The denominator can be rewritten as follows:
exp(∑C
c=1 β̂c z̄ck
)exp
(∑Cc=1 β̂c z̄cj
) =
exp(∑C
c=1 β̂c z̄ck
)exp
(∑Cc=1 β̂c z̄c
)/exp
(∑Cc=1 β̂c z̄cj
)exp
(∑Cc=1 β̂c z̄c
)
=Q̃L
X ,k
Q̃LX ,j
,
Price Indexes at Basic Heading Level Hill – ICP Task Force – PPP Compilation/Computation 16 / 25

where Q̃LXk denotes a Laspeyres-type quantity index that compares
the cost of the average product sold in country k to that sold inthe average country X .
Rearranging we obtain that:
Pk
Pj=
(∏Nkn=1 pkn
)1/Nk
(∏Nj
n=1 pjn
)1/Nj
/Q̃L
X ,k
Q̃LX ,j
.
The use of a Laspeyres-type quantity index in CPD raises thepossibility of substitution bias.
Price Indexes at Basic Heading Level Hill – ICP Task Force – PPP Compilation/Computation 17 / 25

The potential magnitude of this bias can be measured bycomputing the following index:
Pk
Pj=
(∏Nkn=1 pkn
)1/Nk
(∏Nj
n=1 pjn
)1/Nj
/Q̃P
X ,k
Q̃PX ,j
.
where
Q̃PX ,k
Q̃PX ,j
=
exp(∑C
c=1 β̂ck z̄ck
)exp
(∑Cc=1 β̂ck z̄c
)/exp
(∑Cc=1 β̂cj z̄cj
)exp
(∑Cc=1 β̂cj z̄c
)
Here β̂k denotes the vector of log prices for the products incountry k.
Price Indexes at Basic Heading Level Hill – ICP Task Force – PPP Compilation/Computation 18 / 25

For each bilateral pairing of countries j and k we can now counthow often:
(i)Q̃P
X ,k
Q̃PX ,j
<Q̃L
X ,k
Q̃LX ,j
,
versus how often
(ii)Q̃P
X ,k
Q̃PX ,j
>Q̃L
X ,k
Q̃LX ,j
.
If we observe a systematic pattern (e.g., (i) is observed significantlymore times than (ii)), then this is evidence of substitution bias.
We do not yet have any results for this comparison.
Price Indexes at Basic Heading Level Hill – ICP Task Force – PPP Compilation/Computation 19 / 25

An Alternative to CPD
Jevons price indexes can be computed between all pairs ofcountries:
PJjk =
Njk∏n=1
(pkn
pjn
)1/N
,
where n = 1, . . . ,Njk indexes the products priced by both countriesj and k .
This generates a matrix of Jevons indexes:
PJ =
1 PJ
12 · · · PJ1K
PJ21 1 · · · PJ
2K...
......
PJK1 PJ
K2 · · · 1
.
When there are gaps in the price tableau, these Jevons indexes arenot transitive.
Price Indexes at Basic Heading Level Hill – ICP Task Force – PPP Compilation/Computation 20 / 25

Transitivity can be imposed using the weighted-GEKS method,with the following weights matrix:
W =
0 N12 · · · N1K
N21 0 · · · N2K...
......
NK1 NK2 · · · 0
,
where Njk is the number of products priced by both countries j andk . By construction, W is symmetric.
Price Indexes at Basic Heading Level Hill – ICP Task Force – PPP Compilation/Computation 21 / 25

In the case where importance indicators are provided, theJevons-type indexes can be computed as follows:
PJjk =
Mjk∏m=1
(pIkm
pIjm
)3Mjk/(3Mjk+Njk ) Njk∏n=1
(pIkn
pIjn
)Njk/(3Mjk+Njk )
,
where now m = 1, . . . ,Mjk indexes the products identified asimportant in both countries j and k , and n = 1, . . . ,Njk indexesthe other products priced by both countries.
Price Indexes at Basic Heading Level Hill – ICP Task Force – PPP Compilation/Computation 22 / 25

Mjk is the number of products identified as important by bothcountries j and k .
Njk is the number of products priced by both countries j and kwhere in at least one of the two countries the product is notidentified as important.
The corresponding weights in the W matrix can now be set asfollows (assuming 3:1 relative weighting of important and otherprices):
wjk = 3Mjk + Njk .
The transitive within-region basic heading prices are nowcalculated from the Jevons indexes and weights matrix usingPrasada Rao’s weighted-GEKS method as follows:
Price Indexes at Basic Heading Level Hill – ICP Task Force – PPP Compilation/Computation 23 / 25

The Weighted-GEKS Method
minlnPGEKSjk
K∑j=1
K∑k=1
wjk
(ln PGEKS
jk − ln PJjk
)2Weighted-GEKS (see Rao 1999) needs a weights matrix:
W =
0 w12 · · · w1K
w21 0 · · · w2K
......
...wK1 wK2 · · · 0
.
The weighted-GEKS price indexes are now derived as follows:
lnP2
lnP3
...lnPK
=
∑K
j=1 w2j −w23 · · · −w2K
−w32∑K
j=1 w3j · · · −w3K
......
...
−wK2 −wK3 · · ·∑K
j=1 wKj
−1
−∑K
j=1 w2j lnPJ2j
−∑K
j=1 w3j lnPJ3j
...
−∑K
j=1 wKj lnPJKj
.
The price index for country 1, P1, is normalized to 1. In the case where wj,k = w forall j , k, the weighted-GEKS method reduces to GEKS.
Price Indexes at Basic Heading Level Hill – ICP Task Force – PPP Compilation/Computation 24 / 25

Conclusions
(i) For most basic headings differences between RPD and LSFlinking factors are small.
(ii) It will be interesting to see which out of RPD and LSF is lesssensitive to relocation of countries across regions.
(iii) CPD may be affected by substitution bias. This should bechecked empirically.
(iv) Weighted-GEKS provides an alternative to CPD. It remains tobe seen how much CPD and weighted-GEKS differ empirically.
Price Indexes at Basic Heading Level Hill – ICP Task Force – PPP Compilation/Computation 25 / 25