prey capture and the fast-start performance of northern...
TRANSCRIPT

J. exp. Biot. 155, 175-192 (1991) 175Printed in Great Britain © The Company of Biologists Limited 1991
PREY CAPTURE AND THE FAST-START PERFORMANCE OFNORTHERN PIKE ESOX LUCIUS
BY DAVID G. HARPER AND ROBERT W. BLAKE
Department of Zoology, University of British Columbia, Vancouver, V6T 2A9,Canada
Accepted 11 July 1990
Summary
Fast-start performance of northern pike Esox lucius (mean length, 0.38m)during prey capture was measured with subcutaneously implanted accelerometers.Acceleration-time plots and simultaneous high-speed cine films reveal fourbehaviours with characteristic kinematics and mechanics. The fast-start types areidentified by the number of large peaks that appear in the acceleration-time andvelocity-time data.
Comparisons of mean performance were made between each type of feedingfast-start. Type I fast-starts were of significantly shorter duration (0.084 s) anddisplacement (0.132 m) than type III (0.148 s and 0.235 m) and type IV (0.189 sand 0.306m) behaviours, and higher mean and maximum acceleration (38.6 and130.3ms"2, respectively) than type II (26.6 and 95.8ms"2), type III (22.0 and91.2ms"2) and type IV (18.0 and 66.6m s~2) behaviours. The type II behaviourswere of shorter duration (0.115 s) and displacement (0.173 m) and of higher meanacceleration than type IV fast-starts, and were also of significantly shorterduration than type III behaviours.
Prey-capture performance was compared to escapes by the same individuals.When data are combined, regardless of mechanical type, mean acceleration (37.6vs25.5ms~2), maximum acceleration (120.2 vs 95.9ms"2), mean velocity (1.90 vs1.57 ms"1) and maximum velocity (3.97 vs 3.09 ms"1) were found to be larger andduration shorter (0.108 vs 0.133s) during escapes than during prey capture. Nodifferences were found through independent comparisons of the performance offeeding and escape types II and III, but type I escapes had significantly highermean velocity (2.27 vs 1.58ms"1), maximum velocity (4.70 vs 3.12ms"1) andmean acceleration (54.7 vs 38.6 ms~2) than type II feeding behaviours.
Prey-capture performance was also related to prey size, apparent prey size(defined as the angular size of the prey on the pike's retina) and strike distance(the distance from the pike to the prey at the onset of the fast-start). Mean andmaximum acceleration increased with apparent size and decreased with strikedistance, while the duration of the event increased with strike distance anddecreased with apparent size. No relationship was found between the actual preysize and any performance parameter.
Strike distance ranged from 0.087 to 0.439 m and decreased as the apparent size
Key words: fast-starts, prey capture, accelerometry, Esox lucius.

176 D. G. HARPER AND R. W. BLAKE
increased from 2.6 to 9.9° (r2=0.75). The type I behaviour was usually employedwhen the strike distance was small and the prey appeared large. As strike distanceincreased and apparent size decreased, there was a progressive selection of typeII, then III and then IV behaviours.
Introduction
Much attention has been focused on piscivorous predator-prey interactions.Studies have investigated the behavioural (e.g. Crossman, 1959; Ware, 1971;Nursall, 1973), kinematic (e.g. Webb, 1976; Webb and Skadsen, 1980; Vinyard,1982) and energetic (e.g. Isaacs and Wick, 1973; Ware, 1975; Kerr, 1982; Harperand Blake, 1988) characteristics of these events. Others have focused on morespecific feeding characteristics. Optimal prey size (Wankowski, 1979; Schmitt andHolbrook, 1984; Harper and Blake, 1988), its relationship to optimal foraging(Werner and Hall, 1974) and handling time (Werner, 1974), underlying sensorymechanisms (Ware, 1973; Vinyard and O'Brien, 1976; O'Brien etal. 1976; Morganand Ritz, 1983) and prey response characteristics (Dill, 1973, 1974a,b; Webb,1984) have all received considerable attention.
Few, however, have focused on the kinematics and mechanics of piscivorousfeeding interactions. Studies correlating feeding and general locomotor behaviour(Webb, 1976, 1986; Webb and Skadsen, 1980; Rand and Lauder, 1981) and thespecific behaviour, suction feeding (e.g. Lauder, 1979, 1980, 1983), have beenconducted employing high-speed film to estimate performance. This is an effectivemethod of analyzing the small-scale movements observed in suction feeding, butcomprehensive, whole-body performance estimated from film is subject toconsiderable error, particularly where acceleration is concerned (Harper andBlake, 1989a,b).
This study combines accelerometry and high-speed cine film in an investigationof the prey-capture performance of a piscivorous ambush predator, the northernpike Esox lucius. It is complementary to a previous study documenting themechanics and kinematics of escapes of the same individuals (Harper and Blake,1990).
Materials and methods
The northern pike Esox lucius (N=4, mass=0.396±0.058kg, fork-length=0.378±0.019m; mean±2s.E.) were seined from Baptiste Lake in northernAlberta. Healthy adults were held for 6-12 months in 10001 circular outdoorholding tanks (2 m in diameter) which were flushed continuously with fresh waterat 15-20°C. Fast-start performance is independent of temperature over this range(Webb, 1978a). They were fed live goldfish thrice weekly until ready for use.
The experimental arena, made of glass and Plexiglas, measured2.45mxl.22mxO.47m, and was filled to a depth of approximately 0.30m. A0.02 m grid was placed on the bottom of the arena and fresh water, from the same

Fast-start performance of feeding pike 111
supply as for the outdoor holding tanks, was slowly circulated, except whilefilming. Fish were allowed 48 h to acclimate to the aquarium before experimen-tation and were not fed during that time.
Measurement of acceleration
Accelerations were measured directly with a Kistler 8616-A1000 low-impedance piezoelectric accelerometer (range ±1000g; frequency response125 kHz; cylindrical dimensions 0.0058x0.0051 m diameter; mass<0.0005kg).Acceleration-time data were stored in the mainframe memory of a Nicolet 4094digital oscilloscope, transferred to floppy disk, and later to a Commodore PC10-II.The accelerometer was calibrated in free-fall using a guillotine-like apparatus(Harper and Blake, 1990). Velocity and distance were derived from accelerationthrough integration with respect to time.
One source of error inherent with linearly directional accelerometers is thatcurved trajectories introduce tangential accelerations that are detected by theinstrument. If significant, this artefact must be accounted for by subtraction fromthe accelerometer data. For a review of artefacts arising from accelerometry and amethod for determining tangential acceleration, see Harper and Blake (1990).
Fish were quickly anaesthetized in 0.002 kg P 1 MS222 buffered with 0.004 kg I"1
sodium bicarbonate. Once anaesthetized, fish were transferred to a 'wet' tablewhere a recirculating pump continuously flushed one-third strength anaestheticover the gills. For a description of the anaesthetizing procedure, see Richardson(1985).
The accelerometer was implanted subcutaneously above the centre of mass,parallel to the centre-line of the fish, just lateral to the vertebral column. Centre ofmass was assumed to be 0.41 xfork-length (measured from the nose to the middleof the caudal fin trailing edge, Webb, 1978£>). The small mass of the accelerometer(<0.2 % of fish mass for the smallest specimen) eliminated the need to reconsiderthe location of the centre of mass after implantation. The incision was never longeror deeper than about lcm, involved no tissue removal and no significant loss ofblood. Once the accelerometer had been implanted, the incision was tightly closedusing Ethicon V-5 tapercut cardiovascular sutures. The shape of the incision andthe tight closure prevented the accelerometer from altering its orientation in thefish during experiments (Harper and Blake, 1990). The length and mass ofindividuals were recorded prior to their recovery from the anaesthetic.
Fish were then placed in a recovery tank where fresh water was flushed over thegills until normal opercular activity resumed. At this point the fish was re-introduced to the experimental arena and allowed to recover for 24 h. No deathscould be attributed to the incision or anaesthetization.
Prey capture events
Preliminary trials involved introducing one, then several, goldfish into theexperimental arena. This method was rejected, primarily because the goldfishtended to huddle in the corners of the tank, which greatly limited the performance

178 D. G. HARPER AND R. W. BLAKE
of the pike. It was also evident that performance was not inhibited by the lights,but pike were sensitive to the presence of the investigators.
A blind was erected about 3 m in front of the tank and a system of pulleys andremote controls allowed manipulation of the camera and oscilloscope. Thegoldfish were maintained in the centre of the tank by a fine thread attached to theirlower lip, which was affixed to an overhead lever. Ample slack in the threadallowed normal swimming behaviour near the centre of the tank. The tank was ofsufficient size for the walls not to interfere with the event. The goldfish ranged insize (fork-length) from 0.024 to 0.053 m.
Early observations also indicated that pike initiate strikes following suddenmovements of their prey. A gentle tug on the overhead lever (from behind theblind) elicited an escape response from the goldfish which, in turn, initiatedthe attack, thereby affording some control over the approximate start-time of theevent.
Cinematography
Forty-one feeding events were filmed with a 16 mm high-speed cine camera(Locam model 51-0002) on Kodak 7250 400 ISO cine film at 250 Hz. Fish werefilmed as if from above by mounting a 2.45 mx 1.22 m mirror at 45° over the tank.Illumination was provided by two Berkey Beam 800 spot/flood lights mounted infront of the arena and shone into the mirror. Processed films were analyzed on animage analyzer (Photographic Analysis Limited Projection Analysis Unit,ZAE76). The system includes a variable-speed projector, a ground-glass view-ing/digitizing tablet and a digitizing computer. Images of the accelerating fish weredirected onto the tablet and frame-by-frame tracings of the fish were made. Thedistance from the pike to its prey was determined from these tracings. Films weresynchronized with accelerometer records by a light beacon, triggered by theoscilloscope, placed in front of the camera.
The field of view provided by the camera allowed only half of the tank to befilmed when maximizing the image size of the pike. Since the camera was in frontof the blind, it was necessary to predetermine the view from a given orientation ofthe camera. This allowed the camera to be aligned to film the entire feeding event.
Results
Predator-prey behaviour
Pike remained stationary in the arena while the prey was secured to theoverhead lever arm. The goldfish were distressed upon introduction to the tank,but this subsided after a few seconds. The distress attracted the attention of thepike, which would orient head-on towards the prey. Goldfish movementsconsisted of small darting motions; pike tracked the prey axially, powered bymedian and paired fins.
Feeding events usually followed cessation of prey activity. Pike often movedslowly towards the goldfish, maintaining a straight-stretched posture. Occasion-

Fast-start performance of feeding pike 179
ally, sudden erections of the median fins were observed independently fromaccelerative movements. Because median fins are erected prior to acceleration aspart of the fast-start routine (Eaton et al. 1977; Webb, 1977), these actions may bestrikes aborted at a very early stage. Goldfish did attempt escape in most cases.This consisted of C-starts similar to those observed by Weihs (1973), but was rarelysuccessful; prey were usually engulfed before executing the propulsive stage oftheir escape.
Kinematics and mechanics
Films of feeding events show that E. lucius employs the preparatory, propulsiveand variable stages described by Weihs (1973). Kinematics were similar to theS-shaped patterns described by Webb and Skadsen (1980) for the tiger musky,Esox sp.
Figs 1-4 show acceleration, velocity and distance travelled over the duration ofthe behaviour for types I-IV feeding fast-starts. Velocity and distance areobtained by numerical integration of the acceleration data (Harper and Blake,1990). To compare with escape performance (Harper and Blake, 1990), it isassumed that the event terminates when the fish reaches its maximum velocity. Forall but one of the behaviours, pike reach maximum velocity at or beyond theposition of the prey. Insets are traces from simultaneous film records. Althoughthese traces are to scale, they have been realigned on the 'grid', and as such theyrepresent the orientation of the body of the fish with respect to its originalposition, not the actual distance travelled. These figures indicate that, as observedfor escapes, there is a functional relationship between the mechanics of feedingfast-starts (strikes), revealed by the accelerometer, and the kinematics of theseevents, shown by film.
The strikes of E. lucius can be categorized into four different mechanical types,based on the number of large peaks apparent in the acceleration-time andvelocity-time data. During type I strikes (Fig. 1), the fish bends into an S-shapeand makes a change in directional orientation. Maximum acceleration occurs afterthe head is oriented in the direction of the prey. The acceleration-time plot forthis behaviour is unimodal, rising to one significant peak, then declining. Thisbehaviour was only exhibited when the prey was particularly close to the pike andpositioned at an angle relative to its longitudinal axis.
Types II, III and IV strikes (Figs 2-4, respectively) involve no change indirectional orientation; pike had manoeuvred head-on towards the prey. Thesethree behaviours also differ from type I strikes in that the acceleration data tend tobe more consistent and less 'noisy'. This is probably due to the directional stability.Types II-IV vary in the number of peaks apparent in the acceleration-time andvelocity-time plots, which are the basis for the categories (i.e. type II, two peaks;type III, three peaks; type IV, four peaks). Kinematically, an S-shape is formed atthe start of each behaviour. Differences arise from the number of half-cycles of theperiodic tail motion. The frequency of this motion is relatively constant, rangingfrom about 11 to 12.5 Hz (durations of 0.08-0.09 s). The maximum acceleration is

180 D. G. HARPER AND R. W. BLAKE
.2 0.04-Q
-A
.
u*
9-
0.04Time (s)
Fig. 1. Kinematic and mechanical data for a representative type I feeding fast-start ofEsox lucius (mass=0.372kg, fork-length=0.363m), corrected for tangential acceler-ation (as are Figs 2-4). Acceleration, velocity and distance data are shown. Numberson the tracings correspond to those on the acceleration plot: the grid scale is 10cm.
characteristically found at the first peak of the type III behaviour, and at the lastpeak for both types II and IV.
Forty-one predator-prey interactions were analyzed. All fish exhibited all fourbehaviours (except for one pike which did not exhibit a type I behaviour) and thebehaviours are considered characteristic of E. lucius. Type III behaviours weremost common, occurring in 46 % of the events. Type II behaviours were exhibitedin 29 % of the events. Types I and IV strikes were less common, occurring in 15 %and 10% of the events, respectively.
The locomotor performance of E. lucius during feeding, measured by acceler-ometry, is presented in Table 1. Mean values for duration and displacement, andmean and maximum velocity and acceleration are given. Performance for eachmechanical type is included, as well as a total, combining fast-start types. Datafrom fast-start escapes (Harper and Blake, 1990), exhibited by the sameindividuals, are also presented for comparison.
The duration of the events increased from 0.084 s for type I, to 0.115 s for type

Fast-start performance of feeding pike
3
181
>
im
»1
T» 3
• T
0.04 0.CTime (s)
Fig. 2. Kinematic and mechanical data for a representative type II feeding fast-start ofEsox lucius (mass=0.377kg, fork-length=0.376 m).
II, 0.148 s for type III and 0.189 s for type IV. Displacement is greatest for type IV(0.306 m), and least for type I (0.132 m) strikes. Mean velocity varied only slightly,ranging from 1.50 ms" 1 for type II to 1.63 ms" 1 for type IV strikes. The type IVstrikes also exhibited the highest values for mean maximum velocity (3.24ms"1)and lowest values for mean (18.0ms"2) and maximum (66.6ms"2) acceleration.The latter two variables are highest for the type I strikes (38.6 and 130.3ms"2,respectively). The type II strike had the lowest mean maximum velocity(3.01ms"2).
Statistical analyses (Table 2) first employed the Student's f-test to identifydifferences between escape and feeding performance when fast-start types aretotalled, regardless of mechanical type. This indicated that the escapes incorpor-ated significantly higher mean velocity (1.90 vs 1.57ms"1; P<0.001), maximumvelocity (3.97 vs 3.09ms"1; P<0.001), mean acceleration (37.6 vs 25.5 ms"2;P<0.001) and maximum acceleration (120.2 vs 95.9ms"2; F<0.01) over a shorterduration (0.108 vs 0.133 s; P<0.05). One-way analysis of variance (ANOVA) of.individual types of feeding and escape behaviours showed that the type I escapes
of significantly higher mean velocity (2.27 vs 1.58 ms"1; P<0.005), maximum

182 D. G. HARPER AND R. W. BLAKE
0.4-
0.2-
-4T
\N ma
—
m
mm»3
4
~i i i
0.04 0.08Time (s)
0.12
Fig. 3. Kinematic and mechanical data for a representative type III feeding fast-startof Esox lucius (mass=0.377kg, fork-length=0.376m).
velocity (4.70 vs 3.12ms"1; P<0.005) and mean acceleration (54.7 vs 38.6ms~2;F<0.005) than the type I feeding behaviours.
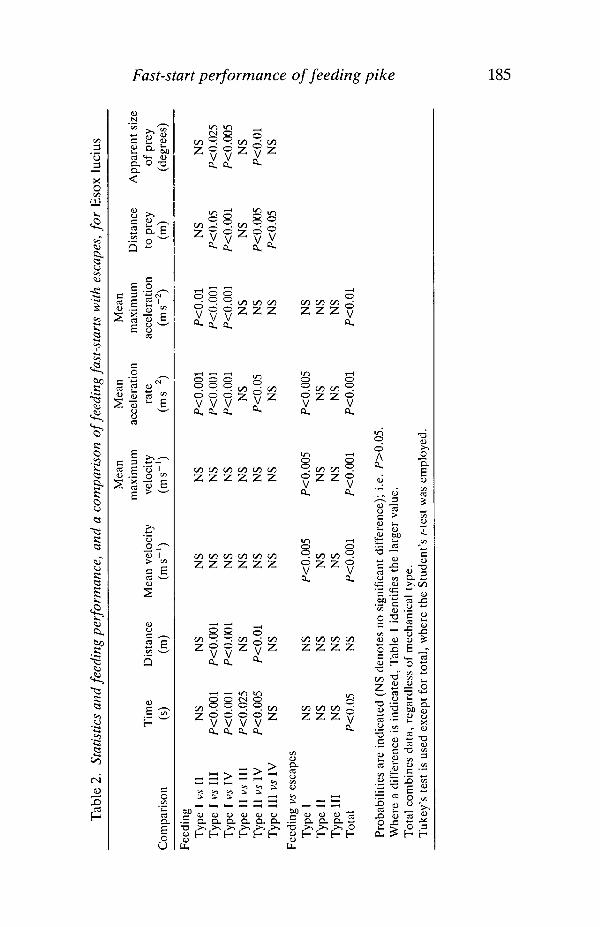
A second ANOVA was conducted on the feeding behaviours, indicating strongsignificant differences between means for duration, displacement and mean andmaximum acceleration (Table 2). Tukey's test was then used to indicate whererobust differences between means could be found, considering all possiblecomparisons.
Table 2 shows that the type I behaviour is of significantly higher mean (38.6 vs26.6ms"2; P<0.001) and maximum acceleration (130.3 vs 95.8ms~2; P<0.01)than the type II behaviour, and of significantly higher mean and maximumacceleration and shorter duration and displacement than the type III and IVbehaviours (P<0.001 for all comparisons; see Table 1 for values). The type IIbehaviour is of shorter duration than the type III (0.115 vs 0.148 s; P<0.025), andhas higher mean acceleration (26.6 vs 18.0 ms~2; F<0.005) and shorter duration(0.115 vs 0.189s; P<0.005) and displacement (0.173 vs 0.306m; P<0.01) than thetype IV behaviour. There was no significant difference in mean or maximumvelocity for any comparison.

Fast-start performance of feeding pike
7
183
0.04 0.08 0.12Time (s)
0.16
Fig. 4. Kinematic and mechanical data for a representative type IV feeding fast-startof Esox lucius (mass=0.372kg, fork-length=0.363m).
Effect of prey size and strike distance on performance
Measurements of prey size and the distance from predator to prey at the start ofthe feeding behaviour (strike distance) were related to mechanical types andperformance. Prey size was a linear measurement (fork-length); strike distancewas determined from film by measuring from the centre of a straight line bisectingthe eyes of the pike to the centre of mass of the goldfish (assumed to be about one-third of the length measured from the nose, Weihs, 1972). The relationshipbetween the two is presented in Fig. 5. The poor correlation (r2=0.06) indicatesthat these two variables act independently in the interaction. However, strikedistance does seem to be related to the type of fast-start employed. Fig. 6 supportsthis; generally, as strike distance increases, pike progressively select type I, II, IIIand IV behaviour to travel this distance.
Fig. 7 demonstrates a relationship between feeding behaviour and performance.As prey distance increases, the mean and maximum accelerations decrease, andduration increases. Velocity is not related to prey distance. Similar relationships toperformance are found as the behaviour changes from type I, to II, to III and thento IV.

Tab
le 1
. F
eedi
ng p
erfo
rman
ce o
f E
sox
luci
us d
eter
min
ed b
y ac
cele
rom
etry
Mea
n m
axim
um
Mea
n ac
cele
ratio
n M
ean
max
imum
T
otal
tim
e D
ista
nce
Mea
n ve
loci
ty
velo
city
ra
te
acce
lera
tion
N
(s)
(m)
(m s
-')
(m s
-')
(m s
-~)
(m s
-~)
Feed
ing
Typ
e I
6 0.
084
0.13
2 1.
58
3.12
38
.6
130.
3 (k
0.01
6)
(k0.
028)
(k
0.31
) (k
0.13
) (k
6.5)
(k
21.7
) T
ype
I1
12
0.11
5 0.
173
1.50
3.
01
26.6
95
.8
(k0.
017)
(k
0.02
8)
(k 0.
12)
(k0.
37)
(k1.
9)
(k7.
9)
Typ
e 11
1 19
0.
148
0.23
5 1.
60
3.11
22
.0
91.2
(k
0.02
1)
(k0.
064)
(k
0.09
) (k
0.32
) (k
2.3)
(f
9.7
) T
ype
IV
4 O
.lS9
0.30
6 1.
63
3.24
18
.0
66.6
(k
0.04
2)
(k 0.
100)
(k
0.44
) (k
1 .05
) (k
8.3)
(k
6.2)
T
otal
41
0.
133
0.20
9 1.
57
3.09
25
.5
95.9
(
f 0.
010)
(
f 0.
022)
(
f 0.
11)
(0.2
9)
(k1.
9)
(k7.
8)
Esc
ape
TY
PC 1
7
0.08
5 0.
194
2.27
4.
70
54.7
15
7.8
(kO
.005
) (f
0.04
4)
(f
0.28
) (k
0.52
) (k
7.0)
(f
37.3
) T
ype
11
11
0.11
0 0.
192
1.76
3.
69
33.2
10
7.9
(20.
013)
(k
0.03
2)
(k0.
18)
(k0.
46)
(35.
0)
(k 16
.4)
Typ
e I1
1 7
0.13
2 0.
223
1.72
3.
61
25.1
91
.4
(k0.
013)
(2
0.02
7)
(20.
31)
(k0.
68)
(k 6.
6)
(k22
.8)
Tot
al
25
0.10
8 0.
201
1.90
3.
97
37.6
12
0.2
(k 0.
010)
(k
0.02
0)
(k0.
17)
(k0.
36)
(k6.
1)
(k20
.0)
Val
ues
in b
rack
ets
indi
cate
err
or a
s k
2 S.
E.
Tot
als
com
bine
dat
a, r
egar
dles
s of
mec
hani
cal t
ype,
for
bot
h fe
edin
g an
d es
cape
(fr
om H
arpe
r an
d B
lake
, 19
90).
Tot
al t
ime
is th
e el
apse
d tim
e to
V,,,
.
Tab
le 2
. St
atis
tics
and
feed
ing
perf
orm
ance
, an
d a
com
pari
son
of fe
edin
g fa
st-s
tart
s w
ith
esca
pes,
for
Eso
x lu
cius
Mea
n M
ean
Mea
n m
axim
um
acce
lera
tion
m
axim
um
Dis
tanc
e A
ppar
ent
size
T
ime
Dis
tanc
e M
ean
velo
city
ve
loci
ty
rate
ac
cele
rati
on
to p
rey
of p
rey
2 C
ompa
riso
n (s
) (m
) (m
s-')
(m s
-l)
(m s
P2)
(m
s-~
) (m
) (d
egre
es)
X F
eedi
ng
NS
NS
NS
NS
e - T
ype
1 1:s
11
NS
NS
P<O
.OO
l P<
O.O
l T
ype
I vs
111
P<
O.OO
L P<
O.O
Ol
NS
NS
P<O
.OO
l P<
O.O
Ol
P<0.
05
P<0.
025
'% T
ype
I vs
IV
P<
O.O
01
P<O
.OO
l N
S N
S P<
O.O
Ol
P<O
.OO
l P<
O.O
Ol
P<0.
005
Typ
e I1
1)s
111
P<0.
025
NS
NS
NS
NS
NS
NS
NS
3
Typ
e 11
1)s 1
V
P<0.
005
P<0.
01
NS
NS
P<O
.O5
NS
P<O
.O05
P<
O.O
l s s
Typ
e 11
1 vs
1V
N
S N
S N
S N
S N
S N
S P<
0.05
N
S 3
0
n
Fee
ding
vs
esca
pes
TY
PC
1 N
S N
S P<
0.00
5 P<
0.00
5 P<
0.00
5 N
S %
T
ype
11
NS
NS
NS
NS
NS
NS
%
n
Typ
e 11
1 N
S N
S N
S N
S N
S N
S %
T
otal
P<
0.05
N
S P<
O.O
Ol
P<O
.OO
l P<
O.O
Ol
P<O
.Ol
3
09
Pro
babi
liti
es a
re in
dica
ted
(NS
den
otes
no
sign
ific
ant
diff
eren
ce);
i.e
. P>
0.05
. W
here
a d
iffe
rcnc
e is
ind
icat
ed,
Tab
le 1
ide
ntif
ies
the
larg
er v
alue
. T
otal
com
bine
s da
ta,
rega
rdle
ss o
f m
echa
nica
l ty
pe.
Tuk
ey's
tes
t is
use
d ex
cept
for
tot
al,
whe
re t
he S
tude
nt's
t-t
est
was
em
ploy
ed.

186 D. G. HARPER AND R. W. BLAKE
CJ
tan
dis
rike
0.4-
0.3-
0.2-
0.1-
0-
D
a D
a
•
• a
o
o
o•
D
tP
D
D
1
D
•
1
a
Da
••
•
0.02 0.03 0.04Prey length (m)
0.05 0.06
Fig. 5. Prey distance (m) upon initiation of the feeding fast-start (strike distance)related to prey length (m). No correlation was found (r2=0.06). Fast-start type isindicated for each event (type I, • ; type II, • ; type III, • ; typelV, O).
0.4 n
0.3
| 0.2'•3
0.1
i10
•a
Type I Type II Type III Type IV
Fig. 6. Mean strike distance ( • ) and apparent size (•) for the four feeding types.Errors are indicated as ±1S.E. (/V=41).
A significant relationship (^=0.75) is found when strike distance is plottedagainst apparent prey size (Fig. 8). This variable differs from actual prey size inthat it represents the angular size of the prey's image on the retina of the predator,in degrees (O'Brien et al. 1976). Previous studies indicate that fish are particularlysensitive to apparent prey size (Ware, 1973; Dill, 19746; O'Brien et al. 1976). FromFig. 8 it is evident that mechanical fast-start type is related to apparent size. Fig. 6demonstrates that, as apparent prey size decreases, pike progressively select typeI, II, III and then IV behaviour. Statistical support for this relationship is found inTable 2.

Fast-start performance of feeding pike 187
140'
<T 100'or;
E~ 80o
1 60
I 40
20'
0-
»t 160
Time
D
•0.25
•0.20 >>
•0.15
•0.10 £o
•0.05 p
0.1 0.2 0.3Strike distance (m)
0.4
Fig. 7. Relationships of mean (̂ 4mean) ar>d maximum (Amax) acceleration and eventduration (Time) to strike distance, r2: /lmean=0.59 (y= -64.1x+38.2), Amax=0A50>=-166x4-130) and time=0.50 (y=0.3&c+0.06). For clarity, individual data pointsfor event duration are not included. Fast-start type for each event are indicated (type I,• ; type II, • ; type III, • ; type IV, O).
0.4
0.3
0.2-•ci/5
0.1-
O D
D
D D
DD
4 6Apparent prey size (degrees)
10
Fig. 8. Relationship of strike distance (m) to the apparent size (degrees) of the prey, r2
for the regression line is 0.75 (y=0.034x4-4.30). Fast-start types for each event areindicated (type I, • ; type II, • ; type III, • ; type IV, O).
Fig. 9 shows the relationship between performance, mechanical type andapparent size. As apparent size increases, mean and maximum accelerationincrease, and duration decreases. Velocity is not related to apparent prey size.Similar relationships to performance are found as the mechanical type selectedchanges from IV, to III, to II and then to I.

188 D. G. HARPER AND R. W. BLAKE
140-I
120-
T loo-
£^ 80'onS 60'
§< 401
20
160 H
Time
A' ' m e a n
0.25
0.20
0.15
0.10
0.05 EH
2 4 6Apparent prey size (degrees)
10
Fig. 9. Relationships of mean (Amean) and maximum (Amax) acceleration and eventduration (Time) to the apparent size of the prey, r2: ^4mean—0.79 (}'=2.92jt+6.10),-4max=0.65 (y=7.8lx+45.0) and time=0.63 (y=-0.017x+0.240). For clarity, indi-vidual data points for event duration are not included. Fast-start types for each eventare indicated (type I, • ; type II, • ; type III, • ; type IV, O).
Discussion
Sources of error
The most significant source of error inherent in accelerometry is the tangentialerror arising from curved trajectories (Harper and Blake, 1990). Feeding fast-starttypes II-IV were not significantly affected by tangential error, owing to theirdirectional stability. However, the type I behaviours did involve tangentialaccelerations, which significantly affected the predicted displacements. Therefore,corrections to these data were made, and Figs 1-4 were corrected following theprocedure described by Harper and Blake (1990). Other possible sources of error,such as transient motion between the body of the fish and the accelerometer, andconsideration of the orientation of the instrument relative to the centre of mass,were investigated and found to involve maximum errors of less than 5 % (Harperand Blake, 1990).
Comparison to previous studies
The feeding behaviours described here are the first categorizations based onmechanical data. Film-based studies have not presented acceleration-time data,as in Figs 1-4, making comparisons to previous work, based on mechanicalcriteria, impossible. Previous studies classify fast-starts by kinematic criteria, asC- or S-starts.
Mean maximum accelerations during strikes averaged 95.9±7.8ms~2, lowerthan values recorded for escapes (120.2±20.0ms~2, Harper and Blake, 1990), butmuch higher than values previously reported from film-based studies(40ms~2±25%, Webb, 19786). Mean accelerations were of the order of those

Fast-start performance of feeding pike 189
found for chain pickerel, Esox niger, feeding fast-starts (Rand and Lauder, 1981)and tiger musky, Esox sp., escape fast-starts (Webb, 1986), and were significantlyless than those for escape fast-starts of the same individuals (Tables 1 and 2). Meandurations were significantly longer than for escapes (Tables 1 and 2), but withinthe range of previous reports (see Harper and Blake, 1990, for a summary). Themean and maximum velocities were also found to be significantly lower duringfeeding than during escapes, but higher than values previously reported (Webb,1978ft). The reason for the disparity of mean maximum accelerations between thisand other studies is probably the large degree of error inherent in evaluatingaccelerations from double-differentiated, film-generated distance-time data.Harper and Blake (1989a,£>) show that, when determined from film, maximumaccelerations incorporate errors of 35-100 %.
Types I and II feeding fast-starts were found to be kinematically different fromescape types I and II, respectively. The difference arises from the directionalstability inherent in the feeding behaviours. However, type III feeding and escapefast-starts were kinematically and mechanically similar. From Tables 1 and 2, it isevident that pike escapes are of shorter duration and of higher mean andmaximum acceleration and velocity than feeding events. This is reasonable, sincefish should maximize performance during escapes to avoid capture; failure tocapture prey is not catastrophic. However, the overwhelming similarity of thekinematics and mechanics of the type III escapes and feeding strikes (the mostcommon feeding behaviour) implies that the same neural pathways are beingemployed in both behaviours. For a review of the neural basis of behaviour seeDiDomenico and Eaton (1988).
Strike performance
Performance during feeding fast-starts appears to maximize and maintainvelocity to the point of contact with the prey. Because tail beats involve periodicaccelerations and decelerations, mean acceleration declines during longer strikes(Table 1) and, because the distance travelled is related to the number of tail beats,the pike executes a given number of tail beats to attain its prey. This does notappear to be a predetermined behaviour for directionally stable strikes (Figs 2-4).Type I strikes cannot be directly compared in this manner because of the inherentdirectional change. In general, the pike executes one full-cycle tail beat, thencontinues to add half-cycle beats until the prey is captured. Therefore, it can beconcluded that E. lucius maximizes performance, while maintaining directionalstability, throughout the feeding fast-start.
Single-event, maximum performance data are reported in Table 3. As for meanperformance, maximum performance is higher for pike escapes than for feedingstrikes. In particular, the maximum acceleration during escapes (244.9 ms~2) isconsiderably higher than during strikes (159.6 ms~2). Maximum performance dataare important because they demonstrate locomotor capability under extremeconditions. This is useful in assessing the energetic cost and efficiency of ambushpredation. Harper and Blake (1988) have shown that the strike portion of a

190 D. G. HARPER AND R. W. BLAKE
Table 3. Maximum performance for all types of feeding and escape (from Harperand Blake, 1990) exhibited by Esox lucius
FeedingType IType IIType IIIType IV
EscapeType IType IIType III
Distance(m)
0.1580.2210.3110.429
0.2130.2890.227
Maximummean
velocity(ms-1)
2.171.962.132.21
2.502.262.14
Maximumfinal
velocity(ms"1)
3.353.804.614.75
7.064.704.50
Maximummean
acceleration(ms-2)
47.731.631.630.4
80.347.435.5
Maximumacceleration
rate(ms-2)
159.6118.6136.072.9
244.9141.2130.5
piscivorous predator-prey interaction accounts for up to 80 % of the total energyexpended by the predator.
Effect of prey size and strike distance on behaviour
Strike distance is not dependent on prey size (Fig. 5), but is related to itsapparent size (Fig. 8). This relationship arises because apparent prey size is afunction of the actual size of the prey and its distance from the predator (O'Brienet al. 1976). E. lucius interprets fish of apparently smaller size as being at a greaterdistance, and initiates strikes from further away. Types III and IV fast-starts arethen employed to travel this distance. The opposite is true of apparently largerprey, where types I and II are commonly used (Fig. 6). This contradicts theprevious suggestion that fast-start type is not predetermined. Figs 6 and 8 indicatethat strike type is determined before the event is initiated, based on the apparentsize of the prey. This suggests that pike disregard actual prey size, and useapparent size to determine strike distance and feeding behaviour. This would beappropriate if available prey were of similar size, which may be true in BaptisteLake. 'Assuming' prey to be one size is an effective strategy for an ambushpredator. If the prey turns out to be smaller than expected, it is still practical tocapture it to compensate for the energy expended during the fast-start. If the preyis too large to consume, it will be too distant to capture.
Figs 7 and 9 demonstrate that acceleration performance is related to both strikedistance and apparent size. Performance is maximal for small strike distance andlarge apparent size. This is directly related to the selection of feeding behaviour(Table 2), suggesting that, if pike predetermine strike type, they also predeter-mine acceleration performance.
Feeding performance of the northern pike Esox lucius, determined by acceler-ometry, is shown to be significantly lower than escape performance by the same

Fast-start performance of feeding pike 191
individuals when duration and mean and maximum acceleration and velocity areconsidered. Displacement values, however, are similar. Four mechanical types offeeding strikes are identified; they are predetermined for use, depending on theapparent size of the prey. The relationship between prey-capture performance andthe apparent size of the prey could be further investigated by simultaneouslyoffering an individual pike a selection of prey, varying in size and distance. Thiswould complement the findings here, and also further our understanding of preyselection by an ambush predator.
We would like to thank the Natural Science and Engineering Council of Canadafor financial support and Mr H. R. Frith for his assistance.
ReferencesCROSSMAN, E. J. (1959). A predator-prey interaction in freshwater fish. J. Fish. Res. Bd Can.
16, 269-281.DIDOMENICO, R. AND EATON, R. C. (1988). Seven principles for command and the neural
causation of behaviour. Brain Behav. Evol. 31, 125-140.DILL, L. M. (1973). An avoidance learning submodel for a general predation model. Oecologia
13, 291-312.DILL, L. M. (1974a). The escape response of the zebra danio (Brachydanio rerio). I. The
stimulus for escape. Anim. Behav. 22, 711-722.DILL, L. M. (19746). The escape response of the zebra danio {Brachydanio rerio). II. The effect
of experience. Anim. Behav. 22,723-730.EATON, R. C , BOMBARDIERI, R. A. AND MEYER, D. L. (1977). The Mauthner-initiated startle
response in teleost fish. J. exp. Biol. 66, 65-81.HARPER, D. G. AND BLAKE, R. W. (1988). Energetics of piscivorous predator-prey interactions.
]. theor. Biol. 134, 59-76.HARPER, D. G. AND BLAKE, R. W. (1989a). A critical analysis of the use of high-speed film to
determine maximum accelerations offish. J. exp. Biol. 142, 465-471.HARPER, D. G. AND BLAKE, R. W. (1989/?). On the error involved in high-speed film when used
to evaluate maximum accelerations of fish. Can. J. Zool. 67, 1929-1936.HARPER, D. G. AND BLAKE, R. W. (1990). Fast-start performance of the rainbow trout Salmo
gairdneri and northern pike Esox lucius. J. exp. Biol. 150, 321-342.ISAACS, J. D. AND WICK, G. L. (1973). Optimized tactics for open-water marine predators. In
Marine Biological Association of India Special Publication dedicated to Dr N. K. Panikar.Cochin, India: S. T. Reddiar and Sons. pp. 192-199.
KERR, S. J. (1982). Estimating the energy budgets for actively predatory fishes. Can. J. Fish.aquat. Sci. 39, 371-379.
LAUDER, G. V. (1979). Feeding mechanics in primitive teleosts and in the halecomorph fishAmia calva. J. Zool., Lond. 187, 543-578.
LAUDER, G. V. (1980). Evolution of the feeding mechanism in primitive actinopterygian fishes: afunctional anatomical analysis of Polypterus, Lepisosteus, and Amia. J. Morph. 163, 283-317.
LAUDER, G. V. (1983). Prey capture hydrodynamics in fishes: experimental tests of two models./. exp. Biol. 104, 1-13.
MORGAN, W. L. AND RITZ, D. A. (1983). Sensory cues and mechanisms involved in the captureof euphausiids by the Australian salmon, Arripis trutta. J. Fish Biol. 23, 489-493.
NURSALL, J. R. (1973). Some behavioural interactions of spottail shiners (Notropis hudsonius),yellow perch (Perca flavescens), and northern pike (Esox lucius). J. Fish. Res. Bd Can. 30,1161-1178.
O'BRIEN, W. J., SLADE, N. A. AND VINYARD, G. L. (1976). Apparent size as the determinant ofprey selection by bluegill sunfish (Lepomis macrochirus). Ecology 57, 1304-1310.
RAND, D. M. AND LAUDER, G. V. (1981). Prey capture in the chain pickerel, Esox niger:correlations between feeding and locomotor behaviour. Can. J. Zool. 59, 1072-1078.

192 D. G. HARPER AND R. W. BLAKE
RICHARDSON, S. C. (1985). Effects of sampling on blood parameters in the rainbow trout. J. FishBiol. 26, 725-732.
SCHMITT, R. J. AND HOLBROOK, S. J. (1984). Gape-limitation, foraging tactics and prey selectivityof two microcarnivorous species of fish. Oecologia 63, 6-12.
VINYARD, G. L. (1982). Variable kinematics of Sacramento perch (Archoplites interruptus)capturing evasive and nonevasive prey. Can. J. Fish, aquat. Sci. 39, 208-211.
VINYARD, G. L. AND O'BRIEN, W. J. (1976). Effects of light and turbidity on the reactivedistance of bluegill (Lepomis macrochirus). J. Fish. Res. Bd Can. 33, 2845-2849.
WANKOWSKI, J. W. J. (1979). Morphological limitations, prey size selectivity, and growthresponse of juvenile Atlantic salmon, Salmo salar. J. Fish Biol. 14, 89-100.
WARE, D. M. (1971). Predation by rainbow trout {Salmo gairdneri): the effect of experience.J. Fish. Res. Bd Can. 28, 1847-1852.
WARE, D. M. (1973). Risk of epibenthic prey to predation by rainbow trout (Salmo gairdneri).J. Fish. Res. Bd Can. 30, 787-797.
WARE, D. M. (1975). Growth, metabolism, and optimal swimming speed of a pelagic fish.J. Fish. Res. Bd Can. 32, 33-41.
WEBB, P. W. (1976). The effect of size on the fast-start performance of rainbow troutS. gairdneri, and a consideration of piscivorous predator-prey interactions. J. exp. Biol. 65,157-177.
WEBB, P. W. (1977). Effects of median-fin amputation on fast-start performance of rainbowtrout (S. gairdneri). J. exp. Biol. 68, 123-135.
WEBB, P. W. (1978a). Temperature effects on acceleration of rainbow trout S. gairdneri. J. Fish.Res. Bd Can. 35, 1417-1422.
WEBB, P. W. (1978b). Fast-start performance and body form in seven species of teleost fish.J. exp. Biol. 74, 211-226.
WEBB, P. W. (1984). Chase response latencies of some teleostean piscivores. Comp. Biochem.Physiol. A 97, 45-48.
WEBB, P. W. (1986). Effect of body form and response threshold on the vulnerability of fourspecies of teleost prey attacked by largemouth bass (Micropterus salmoides). Can. J. Fish.aquat. Sci. 43, 763-771.
WEBB, P. W. AND SKADSEN, J. M. (1980). Strike tactics of Esox. Can. J. Zool. 58, 1462-1469.WEIHS, D. (1972). A hydromechanical analysis offish turning manoeuvres. Proc. R. Soc. B 182,
59-72.WEIHS, D. (1973). The mechanism of rapid starting of slender fish. Biorheology 10, 343-350.WERNER, E. E. (1974). The fish size, prey size, handling time relation in several sunfishes and
some implications. /. Fish. Res. Bd Can. 31, 1531-1536.WERNER, E. E. AND HALL, D. J. (1974). Optimal foraging and the size selection of prey by the
bluegill sunfish (Lepomis macrochirus). Ecology 55, 1042-1052.