pressure history matching for co2 storage in saline ... · pressure history matching for co2...
TRANSCRIPT
CARBON MANAGEMENT TECHNOLOGY CONFERENCE
OCTOBER 21-23, 2013• Hilton Alexandria Old Town• Alexandria, Virginia Page 1
Pressure History Matching for CO2 Storage in Saline Aquifers: Case Study for Citronelle Dome
S.Alireza Haghighat, Shahab D. Mohaghegh, Vida Gholami, Alireza Shahkarami; West Virginia University
Abstract
Carbon Capture and Storage (CCS) projects are subject to monitoring and verification programs to insure the storage
is operating safely. Among different verification techniques, Reservoir Simulation and Modeling has proved to be a
powerful tool for predicting underground storage behavior and consequently quantifying the risks associated with
CO2 storage process. Reliability of the reservoir simulation models is highly dependent on how accurately
simulation results can represent the actual field measurements. This article presents a workflow aimed at history
matching a reservoir simulation model for a CO2 storage project.
In this study a saline reservoir which is located in Citronelle Dome at Mobile County (Alabama, US) is considered
for history matching. This project is part of a CO2 storage research plan, conducted by the U.S. Department of
Energy (DOE) and some industrial partners to demonstrate viability of commercial-scale storage of CO2 captured
from an existing coal-fired power plant.
A Reservoir Simulation model for CO2 injection into the Citronelle saline aquifer was built using commercially
available software (CMG-GEM). Field measurements of CO2 injection rates are assigned as the operational
constraint to the model. In addition to the Injection rates, high frequency, real-time pressure data from two downhole
pressure gauges imbedded in an observation well (833 ft. away from the injection well) is also provided. Several
uncertain reservoir properties were tuned within reasonable ranges in order to find proper match between simulated
pressure results and actual field measurements.
Introduction
Different types of potential risks (like leakage of CO2 or brine from the target zone) are generally associated with
geological storage of CO2. Reservoir simulation and modeling in addition to implementation of appropriate
monitoring techniques are considered to be expedient tools for CO2-risk management.
Reservoir pressure/temperature measurement (by down-hole gauge) has been widely used in the oil and gas industry
for reservoir monitoring, well test analysis and history matching. In CO2 sequestration projects, real time reservoir
pressure can deliver CO2 migration/leakage indications. Meckel et al. [11] interpreted permanent down-hole gauges
(PDGs) data collected from single well at injection and above zone monitoring interval for CO2 injection at
Cranfield field. They suggested almost no inter-formational communication (vertical) at the site based on analysis of
pressure changes that were due to seven injection and nine production wells’ activities. Tao et al. [15] analyzed the
same pressure and temperature data (collected from the monitoring well at Cranfield) and concluded very small
leakage had occurred from the injection interval to the overlying formation. PDG data can also provide valuable
information for reservoir simulation models.
Reservoir models can be used for assessment of CO2 storage capacity, well injectivity, CO2 trapping mechanisms,
CO2 plume extension, and reservoir pressure build up. Sifuentes et al. [14] studied the effect of different physical
parameters on the CO2 trapping in Stuggart formation (Germany). In order to determine the contribution of each
parameter on CO2 trapping, they used reservoir simulation coupled with experimental design to perform sensitivity
analysis. Torn et al. [16] carried out almost the same study (sensitivity analysis) on Mt. Simon sandstone (USA)
CARBON MANAGEMENT TECHNOLOGY CONFERENCE
OCTOBER 21-23, 2013• Hilton Alexandria Old Town• Alexandria, Virginia Page 2
model to assess storage capacity and safety issues. Senel et al. [13] performed a reservoir simulation and uncertainty
analysis study on CO2 injection in the same formation (Mt. Simon sandstone -USA) incorporating more geophysical
and petro-physical data. They investigated the effect of uncertainty on trapping mechanisms and CO2 area of
extension by providing probabilistic estimates. Masoudi et al. [10] coupled a geo-mechanical and simulation model
in order to study feasibility and risks associated with CO2 injection in M4 Field (East Malaysia).They determined
maximum allowed reservoir pressure considering cap rock integrity for different CO2 injection scenarios.
Reservoir simulation performance must be validated by checking if the model is able to regenerate the past behavior
of a reservoir. History matching of oil and gas reservoir models are much more achievable (compared to CO2
storage models) due to availability of large amount of production or/and injection data. For CO2 storage projects
(especially in saline formations), reservoir history data are limited to injection rate in addition to down-hole
injection/observation well pressure. Mantilla et al. [9] used probabilistic history matching software (Pro-HMS)
which incorporated injection data from active (injection) and inactive (observation) wells. They implemented Pro-
HMS to a synthetic model (CO2 storage in aquifer with one/three injection and one observation wells) to obtain high
permeability streaks by use of only injection and pressure data. In another history matching attempt, Krause et al. [7]
conducted core flooding (brine/CO2) followed by numerical simulation of the experiment. They matched Simulation
results with experimental data by calculation of permeability, using porosity and capillary pressure data. Xiao et al.
[17] studied numerical simulation of CO2 /EOR and storage in a pilot-5spot pattern unit of SACROC field. Since the
target storage field had long term production/injection history, they performed history matching for five wells’ gas,
oil and water production. They also predicted reservoir performance for three enhanced oil recovery (EOR)
(injection) schemes and analyzed CO2 storage capacity considering different CO2 trapping mechanisms.
This study is one of the very few of its kind that aims to history match reservoir simulation model of CO2 injection
in Citronelle Dome (saline formation). The available field data for history matching are ten months of CO2 injection
rate as wells as pressure data coming from two gauges installed in the observation well.
Site Description and reservoir model
CO2 sequestration in the Citronelle Dome, AL, which is the third phase of Southeastern Regional Carbon
Sequestration Partnership, aims at commercial-scale storage of CO2 captured from Alabama power plant Barry
(2,657 MW coal-fired with capture rate capacity of up to 550 tons per day ). Captured CO2 is transferred through a
12 miles pipeline to the injection site which is located within Denbury onshore’s southeast Citronelle operating unit.
Saline Paluxy sandstone (inter-bedded sandstone and shale formation), which is located at depths of about 9,450 to
10,500ft (TVD) is the target injection zone. CO2 was planned to be injected at the rate of 500 tons per day for a
maximum of three years.
There are two extensive shale layers that separate Paluxy formation from a saline reservoir at Washita
Fredericksburg sand (at the top), and an oil reservoir at the Donovan sand (at the bottom). Stratigraphic horizons of
the Jurassic through Tertiary age, including the Paluxy formation was provided with structural closure by Citronelle
Dome( broad, gently dipping salt pillow)[3].Well log analysis for the injection well (D-9-7) showed 17 sand layers
as potential CO2 storage and ten out of them (most extensive and thickest ones) were selected for the injection. The
thickness of each sand body varies from 10 to 80 ft with total sand thickness of about 470 ft [5].
In order to generate reservoir simulation model, a comprehensive geological study was performed based on well log
interpretation. This model includes 51 layers vertically (Each geological layers was divided into three simulation
layers). Each layer includes 156625 grid cells with the dimension of each grid block is 133 ft by 133 ft in each XY
direction. The process of building the geological and simulation model is described in detail in previous work [4].
CARBON MANAGEMENT TECHNOLOGY CONFERENCE
OCTOBER 21-23, 2013• Hilton Alexandria Old Town• Alexandria, Virginia Page 3
History match
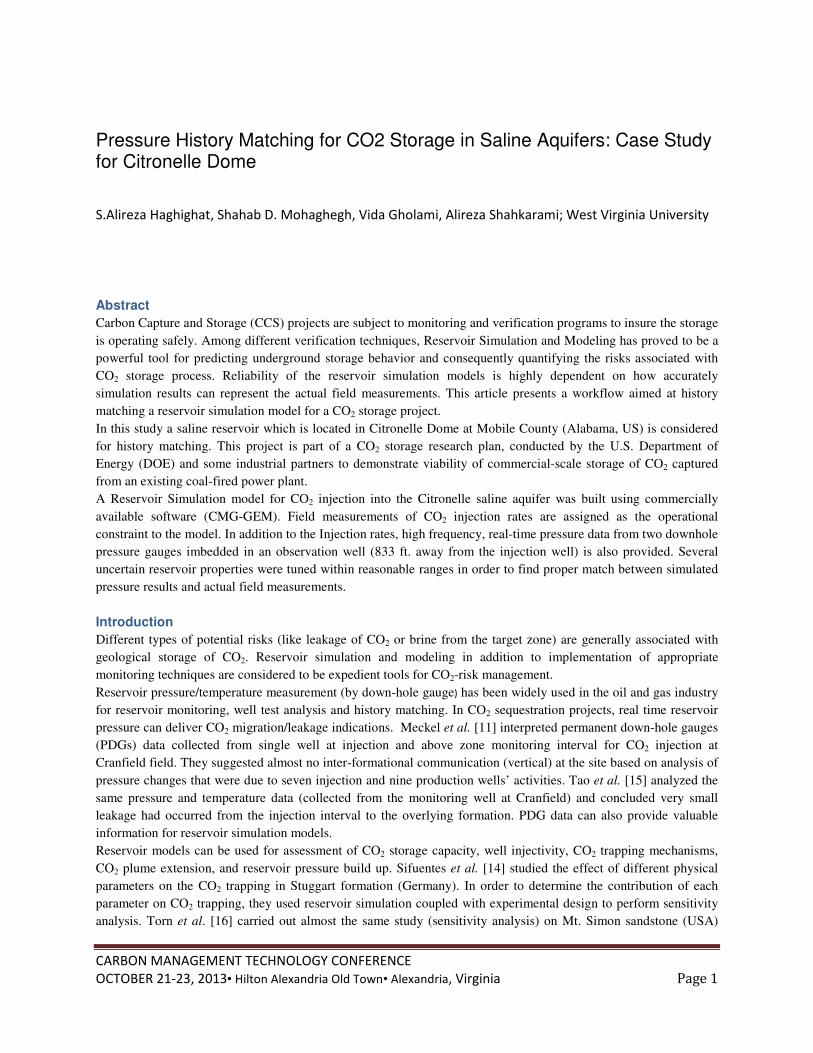
Locations of injection and observation wells are shown in Figure 1.CO2 injection started on August 20th
, 2012 with
the rate of 918 Mcf/day. After that time, the injection rate increased with an oscillating trend (because of operative
difficulties) until the end of September (2012) when it reached 9 Bcf/day (targeted rate).Then, the injection
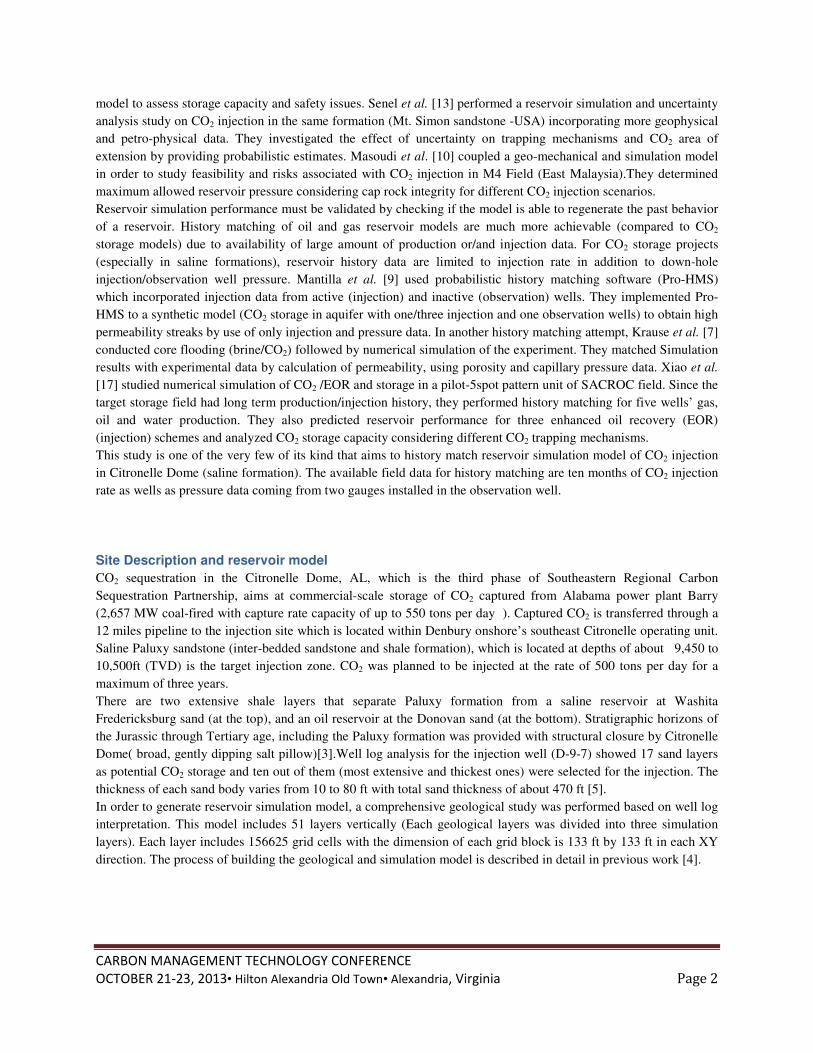
continued until August (2013) with a stable rate although periodic shut downs occurred. The daily injection rate
from the beginning up to August2013 is shown in Figure 2. These injection rates were used in the reservoir
simulation model as operational constrains.
Figure 1: Locations of the CO2 injection, observation and backup injection wells in Citronelle Dome
In the observation well (D-9-8#2) at Citronelle field (Figure1), two Pressure Down-hole Gauges (PDG-5108/5109)
are installed at different depths (9416 and 9441 ft TVD) in order to provide real time pressure and temperature
readings during and after injection period. The pressure data is available from Mid-August of 2012 until August 1rd
2013, recorded at every minute, listed in 1440 records daily. It should be mentioned that there were some gaps in the
pressure records due to onsite computer failure. Since history matching the data on a minute basis was
computationally expensive and time consuming, the pressure data was summarized by averaging over each day. The
results of actual pressure data on a daily basis are illustrated in Figure 3.
Figure 2: CO2 injection rate history Figure 3: Daily pressure data from PDGs @ observation well
Initially a base case reservoir model was developed considering reservoir properties that are summarized in Table 1.
Porosity maps for each simulation layer were acquired by interpretation of 40 well logs. In this model, operational
constrains were the actual CO2 injection rates in addition to maximum bottom-hole pressure limit of 6,300 psi. The
solubility of CO2 in the brine was not considered in the base model. Block pressure for the grids corresponding to
the PDGs were compared with the actual data. Simulated pressure data using the base model are plotted against
actual pressure history in Figure 4.

CARBON MANAGEMENT TECHNOLOGY CONFERENCE
OCTOBER 21-23, 2013• Hilton Alexandria Old Town• Alexandria, Virginia Page 4
Table 1: Reservoir parameters and properties (base model)
Parameter Value Parameter Value
Permeability (md) 460 Water density (lb/ft3) 62
Temperature (◦F) 230 Water viscosity (cp) 0.26
Salinity (ppm) 100,000 Water compressibility (1/psi) 3.2E-6
Residual gas saturation 0.35 Kv/Kh (permeability ratio) 0.1
Residual water saturation 0.6 Pressure reference@9415 ft (psi) 4393
Figure 4: Actual pressure vs. simulated pressure in the base model.
The simulation data were matching neither the start point, nor the difference between the values of two gauges.
Initial reservoir pressure was adjusted by changing the reference pressure to 4370 psi at the datum depth of 9416 ft.
Pressure gradient between the PDGs was 0.62 psi/ft while between the simulation grids was 0.43 psi/ft. Based on
this, it was concluded that the brine density should be set at a higher value in order to mimic the same pressure
gradient Brine density at the reservoir conditions can be calculated using the following equation:
( )[ ]00 1~~ ppcbrbrbr −+= ρρ
Keeping the brine compressibility unchanged, density of brine should be altered to 87 lb/ft3.
A thorough sensitivity analysis was performed to study the effect of several uncertain reservoir parameters on
pressure behavior in the observation well [4]. The results of sensitivity analysis showed that permeability (rock type)
significantly contributed to injectivity, CO2 plume extension and reservoir pressure. Using available core data(not
taken from Citronelle field) [4], porosity-permeability cross-plot was generated for the Paluxy formation (Figure 5).
Available data from the core samples taken from injection well demonstrated the dominancy of conductive rock type
in the vicinity of the injection area [5]. Also, vertical to horizontal permeability ratio was calculated to be 0.58 using
core data analysis. Modification of pressure reference, brine density and permeability in addition to setting zero
transmissibility between the sand and shale layers resulted in pressure predictions illustrated in Figure 6.

CARBON MANAGEMENT TECHNOLOGY CONFERENCE
OCTOBER 21-23, 2013• Hilton Alexandria Old Town• Alexandria, Virginia Page 5
Figure 5: Porosity-permeability cross plot Figure 6: Model’s pressure results and actual history; modified
p pressure reference, brine density and permeability
m
By Implementation of modified parameters in the model, prediction results resembled initial pressure and pressure
gradient similar to the actual data. However, model pressure predictions didn’t follow PDGs pressure trend
correctly. As shown in Figure 6, reservoir simulation results underestimated actual data during first four months
after the injection, and overestimated the rest of pressure history. Additionally, simulation pressure drawdowns
reached a stable trend much faster, compare with actual data. This behavior can be explained by the fact that higher
permeability (in the model) resulted in lowering the time for pressure drawdown to reach a steady trend. Therefore,
it was necessary to decrease the permeability in the model to adjust pressure drawdown behavior. On the other hand,
lowering the permeability led to CO2 injectivity reduction [4]. As results, reservoir model was divided into two
regions: (a) grids in the vicinity of the injection zone (20*20 grids around the injection well) and (b) grids outside
the injection zone (Figure 7). To correct model’s pressure drawdown trend, dual modification in reservoir
permeability was done by decreasing permeability in region “a” and increasing permeability in region “b”.
Figure7: Two permeability regions in the reservoir Figure8: Model’s pressure results and actual history; modified
p permeability in different reservoir regions
As shown in Figure 8, although modifications in the model’s permeability improved pressure drawdown behavior,
pressure predictions were overestimated considerably (compare with the actual PDG data). To lower pressure
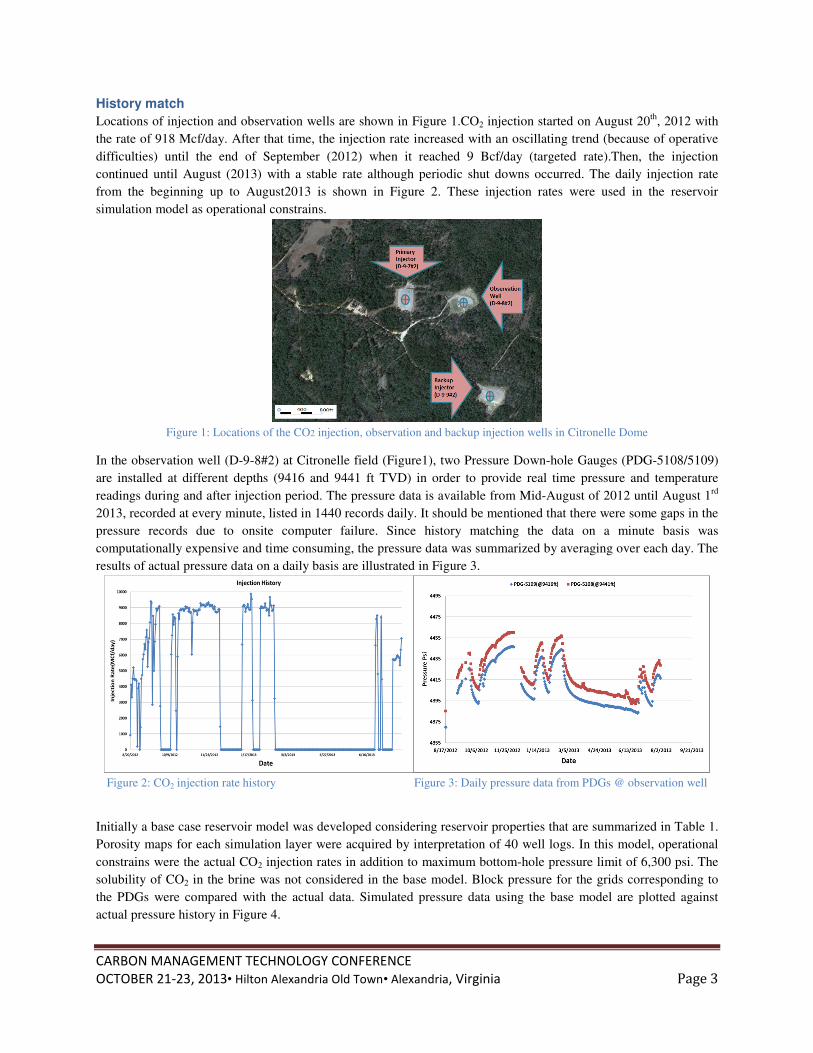
results, solubility of CO2 in the brine (aqueous phase) was incorporated in the model [1]. More importantly, volume
modifier was assigned to the grids at the east boundary of the reservoir (Figure 9). This accounted for the fact that
reservoir boundary and volume might be bigger than what was assigned to the model. To develop the geological
model, top and thickness of sand layers were picked for log data of 14 wells (crossing at injection well) and then
correlated (Figure10). Due to the limited amount of information (just two well logs) at east side of the injection well,
it was not possible to estimate the extension of the sand layer on that area. Therefore it was probable that more
reservoir volume existed outside the boundary of the geological model. Adding more volume to the reservoir (sand
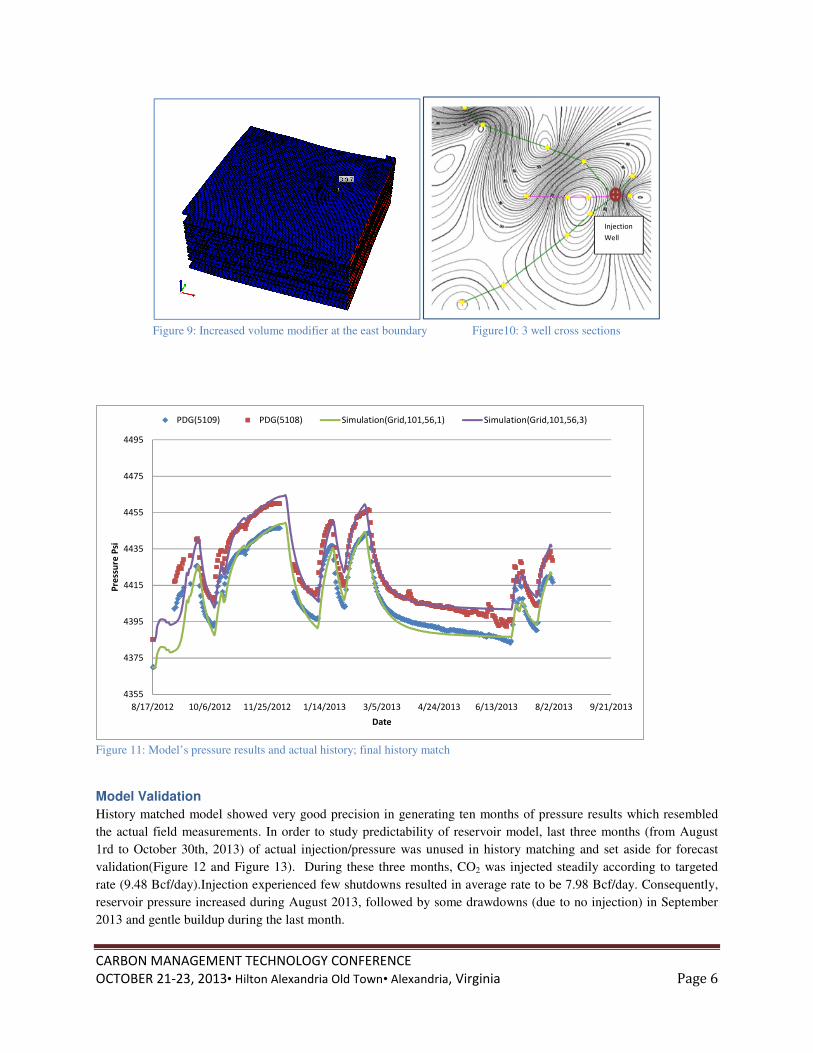
layers) resulted in lowering the pressure prediction. After activating CO2 solubility in the brine phase and tuning
“volume modifier’” a very good match between model results and actual pressure data with less than 0.001%
average error was achieved (Figure 11).
4355
4375
4395
4415
4435
4455
4475
4495
8/17/2012 10/6/2012 11/25/2012 1/14/2013 3/5/2013 4/24/2013 6/13/2013 8/2/2013 9/21/2013
Pre
ssu
re P
si
Date
PDG(5109) PDG(5108) Simulation(Grid,101,56,1) Simulation(Grid,101,56,3)
4350
4370
4390
4410
4430
4450
4470
4490
4510
4530
8/17/2012 10/6/2012 11/25/2012 1/14/2013 3/5/2013 4/24/2013 6/13/2013 8/2/2013 9/21/2013
Pre
ssu
re P
si
Date
PDG(5109) PDG(5108) Simulation(Grid,101,56,1) Simulation(Grid,101,56,3)
CARBON MANAGEMENT TECHNOLOGY CONFERENCE
OCTOBER 21-23, 2013• Hilton Alexandria Old Town• Alexandria, Virginia Page 6
Figure 9: Increased volume modifier at the east boundary Figure10: 3 well cross sections
Figure 11: Model’s pressure results and actual history; final history match
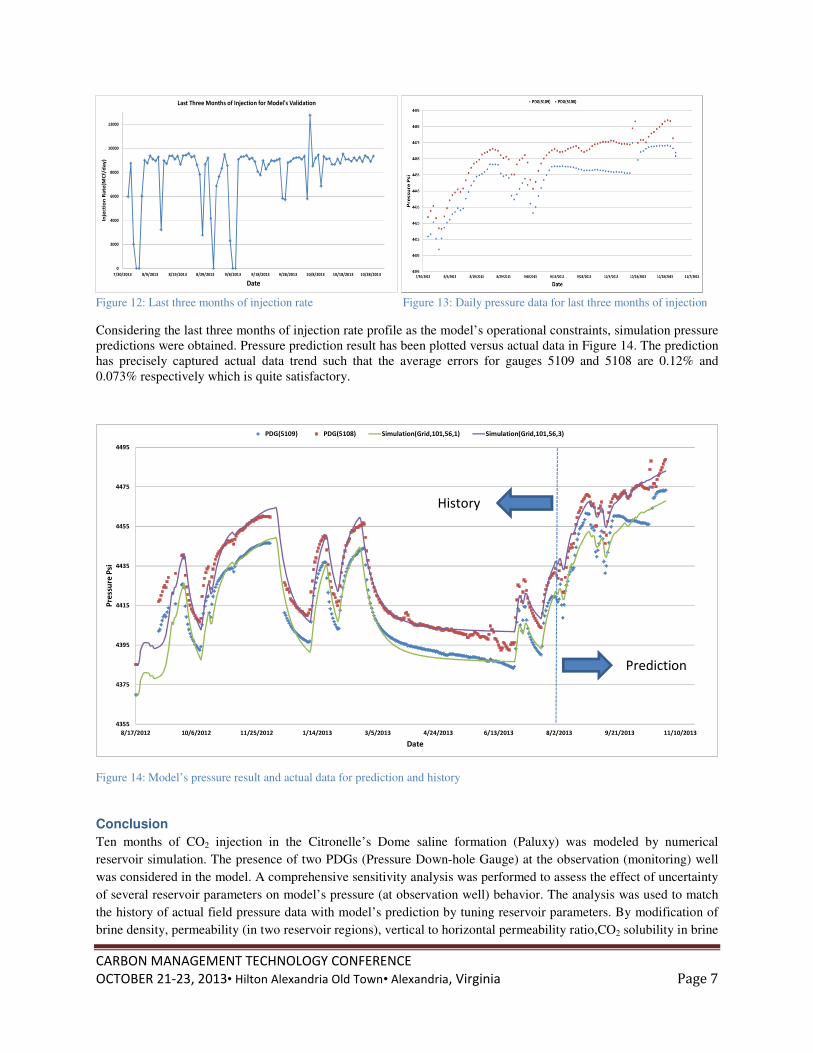
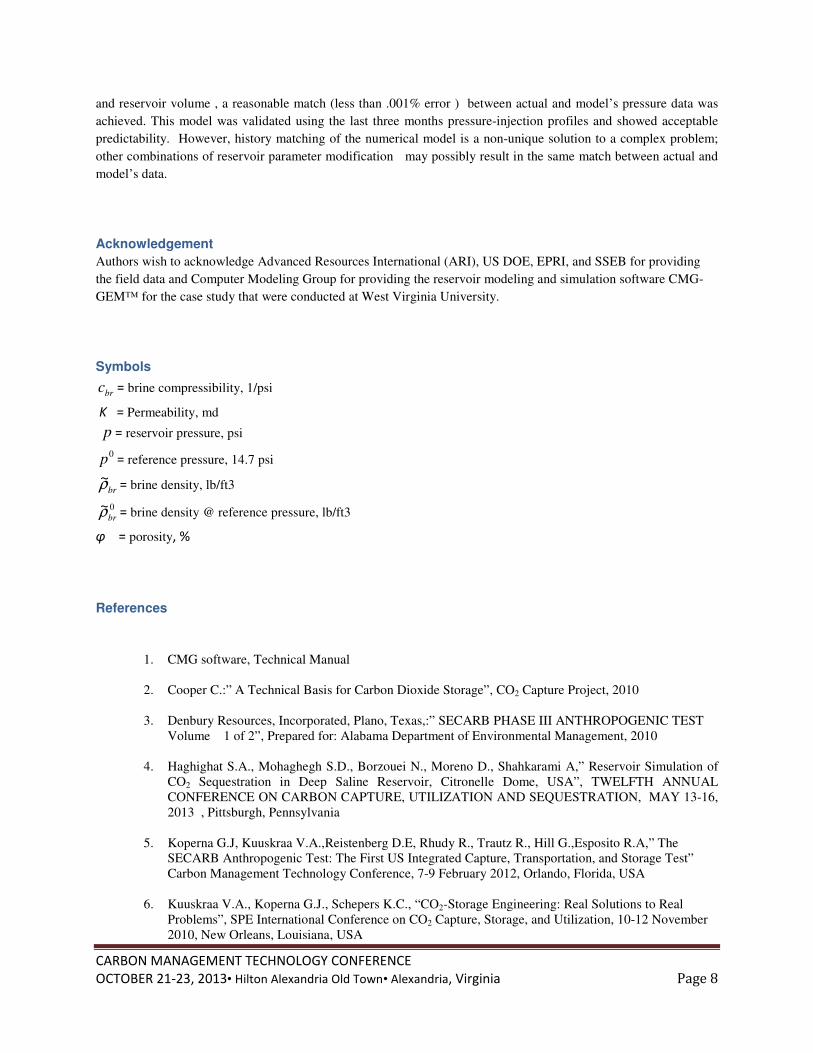
Model Validation
History matched model showed very good precision in generating ten months of pressure results which resembled
the actual field measurements. In order to study predictability of reservoir model, last three months (from August
1rd to October 30th, 2013) of actual injection/pressure was unused in history matching and set aside for forecast
validation(Figure 12 and Figure 13). During these three months, CO2 was injected steadily according to targeted
rate (9.48 Bcf/day).Injection experienced few shutdowns resulted in average rate to be 7.98 Bcf/day. Consequently,
reservoir pressure increased during August 2013, followed by some drawdowns (due to no injection) in September
2013 and gentle buildup during the last month.
4355
4375
4395
4415
4435
4455
4475
4495
8/17/2012 10/6/2012 11/25/2012 1/14/2013 3/5/2013 4/24/2013 6/13/2013 8/2/2013 9/21/2013
Pre
ssu
re P
si
Date
PDG(5109) PDG(5108) Simulation(Grid,101,56,1) Simulation(Grid,101,56,3)
Injection
Well
CARBON MANAGEMENT TECHNOLOGY CONFERENCE
OCTOBER 21-23, 2013• Hilton Alexandria Old Town• Alexandria, Virginia Page 7
Figure 12: Last three months of injection rate Figure 13: Daily pressure data for last three months of injection
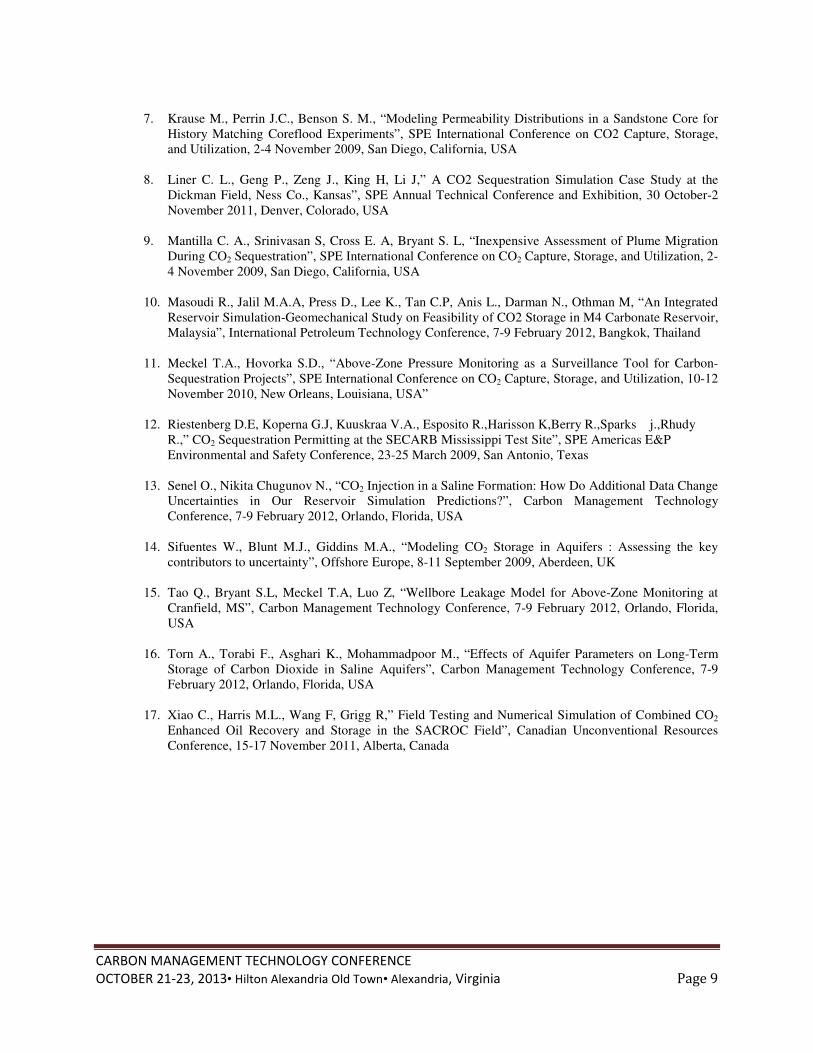
Considering the last three months of injection rate profile as the model’s operational constraints, simulation pressure
predictions were obtained. Pressure prediction result has been plotted versus actual data in Figure 14. The prediction
has precisely captured actual data trend such that the average errors for gauges 5109 and 5108 are 0.12% and
0.073% respectively which is quite satisfactory.
Figure 14: Model’s pressure result and actual data for prediction and history
Conclusion
Ten months of CO2 injection in the Citronelle’s Dome saline formation (Paluxy) was modeled by numerical
reservoir simulation. The presence of two PDGs (Pressure Down-hole Gauge) at the observation (monitoring) well
was considered in the model. A comprehensive sensitivity analysis was performed to assess the effect of uncertainty
of several reservoir parameters on model’s pressure (at observation well) behavior. The analysis was used to match
the history of actual field pressure data with model’s prediction by tuning reservoir parameters. By modification of
brine density, permeability (in two reservoir regions), vertical to horizontal permeability ratio,CO2 solubility in brine
0
2000
4000
6000
8000
10000
12000
7/30/2013 8/9/2013 8/19/2013 8/29/2013 9/8/2013 9/18/2013 9/28/2013 10/8/2013 10/18/2013 10/28/2013
Inje
cti
on
Ra
te(M
Cf/
da
y)
Date
Last Three Months of Injection for Model's Validation
4355
4375
4395
4415
4435
4455
4475
4495
8/17/2012 10/6/2012 11/25/2012 1/14/2013 3/5/2013 4/24/2013 6/13/2013 8/2/2013 9/21/2013 11/10/2013
Pre
ssu
re P
si
Date
PDG(5109) PDG(5108) Simulation(Grid,101,56,1) Simulation(Grid,101,56,3)
History
Prediction
CARBON MANAGEMENT TECHNOLOGY CONFERENCE
OCTOBER 21-23, 2013• Hilton Alexandria Old Town• Alexandria, Virginia Page 8
and reservoir volume , a reasonable match (less than .001% error ) between actual and model’s pressure data was
achieved. This model was validated using the last three months pressure-injection profiles and showed acceptable
predictability. However, history matching of the numerical model is a non-unique solution to a complex problem;
other combinations of reservoir parameter modification may possibly result in the same match between actual and
model’s data.
Acknowledgement
Authors wish to acknowledge Advanced Resources International (ARI), US DOE, EPRI, and SSEB for providing
the field data and Computer Modeling Group for providing the reservoir modeling and simulation software CMG-
GEM™ for the case study that were conducted at West Virginia University.
Symbols
brc = brine compressibility, 1/psi
K = Permeability, md
p = reservoir pressure, psi
0p = reference pressure, 14.7 psi
brρ~ = brine density, lb/ft3
0~brρ = brine density @ reference pressure, lb/ft3
φ = porosity, %
References
1. CMG software, Technical Manual
2. Cooper C.:” A Technical Basis for Carbon Dioxide Storage”, CO2 Capture Project, 2010
3. Denbury Resources, Incorporated, Plano, Texas,:” SECARB PHASE III ANTHROPOGENIC TEST
Volume 1 of 2”, Prepared for: Alabama Department of Environmental Management, 2010
4. Haghighat S.A., Mohaghegh S.D., Borzouei N., Moreno D., Shahkarami A,” Reservoir Simulation of
CO2 Sequestration in Deep Saline Reservoir, Citronelle Dome, USA”, TWELFTH ANNUAL
CONFERENCE ON CARBON CAPTURE, UTILIZATION AND SEQUESTRATION, MAY 13-16,
2013 , Pittsburgh, Pennsylvania
5. Koperna G.J, Kuuskraa V.A.,Reistenberg D.E, Rhudy R., Trautz R., Hill G.,Esposito R.A,” The
SECARB Anthropogenic Test: The First US Integrated Capture, Transportation, and Storage Test”
Carbon Management Technology Conference, 7-9 February 2012, Orlando, Florida, USA
6. Kuuskraa V.A., Koperna G.J., Schepers K.C., “CO2-Storage Engineering: Real Solutions to Real
Problems”, SPE International Conference on CO2 Capture, Storage, and Utilization, 10-12 November
2010, New Orleans, Louisiana, USA
CARBON MANAGEMENT TECHNOLOGY CONFERENCE
OCTOBER 21-23, 2013• Hilton Alexandria Old Town• Alexandria, Virginia Page 9
7. Krause M., Perrin J.C., Benson S. M., “Modeling Permeability Distributions in a Sandstone Core for
History Matching Coreflood Experiments”, SPE International Conference on CO2 Capture, Storage,
and Utilization, 2-4 November 2009, San Diego, California, USA
8. Liner C. L., Geng P., Zeng J., King H, Li J,” A CO2 Sequestration Simulation Case Study at the
Dickman Field, Ness Co., Kansas”, SPE Annual Technical Conference and Exhibition, 30 October-2
November 2011, Denver, Colorado, USA
9. Mantilla C. A., Srinivasan S, Cross E. A, Bryant S. L, “Inexpensive Assessment of Plume Migration
During CO2 Sequestration”, SPE International Conference on CO2 Capture, Storage, and Utilization, 2-
4 November 2009, San Diego, California, USA
10. Masoudi R., Jalil M.A.A, Press D., Lee K., Tan C.P, Anis L., Darman N., Othman M, “An Integrated
Reservoir Simulation-Geomechanical Study on Feasibility of CO2 Storage in M4 Carbonate Reservoir,
Malaysia”, International Petroleum Technology Conference, 7-9 February 2012, Bangkok, Thailand
11. Meckel T.A., Hovorka S.D., “Above-Zone Pressure Monitoring as a Surveillance Tool for Carbon-
Sequestration Projects”, SPE International Conference on CO2 Capture, Storage, and Utilization, 10-12
November 2010, New Orleans, Louisiana, USA”
12. Riestenberg D.E, Koperna G.J, Kuuskraa V.A., Esposito R.,Harisson K,Berry R.,Sparks j.,Rhudy
R.,” CO2 Sequestration Permitting at the SECARB Mississippi Test Site”, SPE Americas E&P
Environmental and Safety Conference, 23-25 March 2009, San Antonio, Texas
13. Senel O., Nikita Chugunov N., “CO2 Injection in a Saline Formation: How Do Additional Data Change
Uncertainties in Our Reservoir Simulation Predictions?”, Carbon Management Technology
Conference, 7-9 February 2012, Orlando, Florida, USA
14. Sifuentes W., Blunt M.J., Giddins M.A., “Modeling CO2 Storage in Aquifers : Assessing the key
contributors to uncertainty”, Offshore Europe, 8-11 September 2009, Aberdeen, UK
15. Tao Q., Bryant S.L, Meckel T.A, Luo Z, “Wellbore Leakage Model for Above-Zone Monitoring at
Cranfield, MS”, Carbon Management Technology Conference, 7-9 February 2012, Orlando, Florida,
USA
16. Torn A., Torabi F., Asghari K., Mohammadpoor M., “Effects of Aquifer Parameters on Long-Term
Storage of Carbon Dioxide in Saline Aquifers”, Carbon Management Technology Conference, 7-9
February 2012, Orlando, Florida, USA
17. Xiao C., Harris M.L., Wang F, Grigg R,” Field Testing and Numerical Simulation of Combined CO2
Enhanced Oil Recovery and Storage in the SACROC Field”, Canadian Unconventional Resources
Conference, 15-17 November 2011, Alberta, Canada