press release q3 2015 - philips“philips delivered improved results for the third quarter of 2015,...
TRANSCRIPT

Amsterdam, October 26, 2015
Third-quarter highlights
• Comparable sales up 2%, driven by North America, Asia Pacific and Central & Eastern Europe• Currency-comparable order intake up 2%, driven by 6% growth in North America• EBITA, excluding restructuring and acquisition-related charges and other items, amounted to EUR 570
million, or 9.8% of sales, compared to 9.1% of sales in Q3 2014• EBITA totaled EUR 429 million, or 7.4% of sales, compared to a loss of EUR 62 million in Q3 2014• Net income amounted to EUR 324 million, compared to a net loss of EUR 103 million in Q3 2014• Free cash flow of EUR 58 million, compared to EUR 155 million in Q3 2014• Philips provides update on Lumileds transaction• Philips Lighting separation process on track
Frans van Houten, CEO:
“Philips delivered improved results for the third quarter of 2015, confirming that our operational performance continues to strengthen,despite deteriorating macro-economic conditions in a number of markets, most notably in China.
Healthcare comparable sales and order intake increased, driven by North America. Operational results also improved year-on-year,despite the impact of China and foreign exchange headwinds. Consumer Lifestyle again delivered a strong performance, with asignificant product mix improvement driven by high growth in Health & Wellness and Personal Care. Lighting continued its trend of year-on-year performance improvement, driven by strong growth in our LED businesses, while we continue to actively manage theconventional lighting market decline.
For full-year 2015, we continue to expect modest comparable sales growth and an improvement of our operational performance.”
Accelerate! and Separation Update“Our Accelerate! program continues to drive operational improvements across the organization. In Healthcare, for example, this resultedin reduced manufacturing cycle times and inventory in our Image-Guided Therapy facility in the Netherlands. In Consumer Lifestyle, wesimplified the order fulfillment process in Spain, resulting in improved customer service. In Lighting, a new go-to-market model andcustomized offerings in Indonesia enhanced our business-to-government sales capabilities, resulting in street-lighting orders from fivemajor cities.”
Overhead cost savings amounted to EUR 33 million in the third quarter. The Design for Excellence (DfX) program generated EUR 107million of incremental procurement savings in the quarter. The End2End improvement program achieved EUR 63 million in productivitygains.
Philips is on schedule to complete the separation of the Lighting business in the first half of 2016. As previously stated, Philips isreviewing all strategic options for Philips Lighting, including an initial public offering and a private sale. The company now expects therelated separation costs to come in at the lower end of EUR 200-300 million for 2015 and remain within that range in 2016.
Update on sale of majority stake in Lumileds to GO Scale CapitalIn the course of seeking regulatory approvals regarding the sale of an 80.1% interest in Lumileds to a consortium led by GO ScaleCapital, the Committee on Foreign Investment in the United States (CFIUS) has expressed certain unforeseen concerns. Philips and GO
Q3 2015Quarterly report
Philips reports Q3 comparable sales growth of 2% toEUR 5.8 billion and an improvement in operationalresults to EUR 570 million

Scale Capital will continue to engage with CFIUS and will take all reasonable steps to address its concerns, but given these, the closingof the transaction is uncertain.
Q3 2015 Financial and Operational Overview
HealthcareHealthcare comparable sales grew 3% year-on-year and currency-comparable order intake was up 2%. Excluding restructuring andacquisition-related charges and other items, the EBITA margin increased by 30 basis points to 12.3%, driven largely by cost productivity.This was partly offset by negative currency impact, higher investments for growth initiatives, and increases in Quality & Regulatoryspend.
“We are encouraged by continued sales growth and the positive order intake across the majority of our markets. Our focus on deliveringmeaningful innovations that enhance patient care and improve efficiencies continues to pay off, for example with the introduction ofHeartModel, an ultrasound tool with anatomical intelligence, designed to enhance diagnosis and planning in cardiology.
Consumer LifestyleConsumer Lifestyle comparable sales increased by 6% year-on-year, with double-digit growth at Health & Wellness and Personal Care.The EBITA margin, excluding restructuring and acquisition-related charges and other items, increased by 190 basis points to 12.5% year-on-year.
“We delivered significant EBITA gains in Consumer Lifestyle, as well as strong growth. This resulted in market share expansion across anumber of product categories and geographies. For instance in Oral Healthcare, innovations including the Philips SonicareDiamondClean Amethyst and Philips Sonicare AirFloss Ultra saw high-double-digit growth.”
LightingLighting continued its operational improvement, with the EBITA margin, excluding restructuring and acquisition-related charges andother items, increasing by 40 basis points to 9.5% year-on-year. LED lighting comparable sales grew 24% and LED margins improved.LED sales now represent 44% of total Lighting sales, compared to 36% in Q3 2014. In line with industry trends, conventional lamps salesdeclined by 15%, resulting in an overall comparable sales decrease of 3% year-on-year.
“We are pleased with another quarter of strong performance from our LED business, which now represents close to half of Lighting sales.We continue to introduce LED innovations to customers. For example, Philips will outfit 32 Accenture offices with more than 140,000LED-based products in India. The upgrade will enable significant energy savings and create a more pleasant work environment.Simultaneously, we will continue to proactively manage the conventional lighting market decline, allowing us to deliver improvements toLighting EBITA margins.”
Innovation, Group & ServicesComparable sales increased by 15%, driven by IP Royalties and very strong growth in Philips’ emerging businesses such as DigitalPathology and Photonics. EBITA was a net cost of EUR 139 million, compared to a net cost of EUR 151 million in the third quarter of 2014.
“We are driving leadership positions in emerging business areas such as digital pathology. In Europe and Asia Pacific, leading healthinstitutions such as Germany’s largest telemedicine platform and Singapore General Hospital digitize their pathology workflows withPhilips’ IntelliSite Pathology Solutions to enhance disease diagnosis, underpinning our leadership in this field.”
Conference call and audio webcastFrans van Houten, CEO, and Abhijit Bhattacharya, CFO, will host a conference call for investors and analysts at 10:00 am CET onOctober 26, 2015 to discuss the results. A live audio webcast of the conference call will be available on the Philips Investor Relationswebsite.

Press Release Q3 2015 3
Philips GroupNet income in millions of EUR unless otherwise stated
Q3 2014 Q3 2015
Sales 5,194 5,836
EBITA (62) 429
as a % of sales (1.2)% 7.4%
EBIT (139) 342
as a % of sales (2.7)% 5.9%
Financial expenses, net (80) (100)
Income taxes 50 (8)
Results investments in associates 39 2
Net income (loss) from continuingoperations (130) 236
Discontinued operations 27 88
Net income (loss) (103) 324
Net income (loss) attributable toshareholders per common share (in EUR) -diluted (0.11) 0.34
Net income▪ Net income was EUR 324 million, compared to a loss
of EUR 103 million in Q3 2014. The increase wasmainly due to charges related to the Masimoprovision in Q3 2014 and improved operationalperformance in Q3 2015.
▪ EBITA amounted to EUR 429 million, or 7.4% of sales,compared to a loss of EUR 62 million in Q3 2014.Restructuring and acquisition-related chargesamounted to EUR 51 million, largely relating to theacquisition of Volcano, compared to EUR 78 millionin Q3 2014. EBITA also included charges of EUR 31million related to a legal matter and EUR 59 millionof charges relating to the separation of the Lightingbusiness. EBITA in Q3 2014 included charges of EUR366 million related to the provision for the Masimolitigation, EUR 49 million of mainly inventory write-downs related to the Cleveland facility, and EUR 43million of provisions for various legal matters.
▪ EBITA, excluding restructuring and acquisition-related charges and other items, was EUR 570 million,or 9.8% of sales, compared to EUR 474 million, or 9.1%of sales, in Q3 2014. Currency effects had an impacton EBITA margin of -1.6 percentage points of sales.
▪ Results from investments in associates amounted toEUR 2 million, compared to EUR 39 million in Q3 2014.The decrease was mainly due to a EUR 32 million fair-value gain related to Philips’ stake in CorindusVascular Robotics in Q3 2014.
▪ Net income from discontinued operations was EUR61 million higher year-on-year, mainly due to higherresults from Lumileds and Automotive in Q3 2015 andthe European Commission‘s Smartcard fine in Q32014.
▪ Income tax charges amounted to EUR 8 million,compared to a tax credit of EUR 50 million in Q3 2014,largely due to higher taxable earnings, partly offsetby the release of tax provisions in Q3 2015.

4 Press Release Q3 2015
Sales by sector in millions of EUR unless otherwise stated
% change
Q3 2014 Q3 2015 nomi-
nal compar-
able
Healthcare 2,234 2,627 18% 3%
Consumer Lifestyle 1,114 1,246 12% 6%
Lighting 1,705 1,830 7% (3)%
Innovation, Group &Services 141 133 (6)% 15%
Philips Group 5,194 5,836 12% 2%
Sales per geographic clusterin millions of EUR unless otherwise stated
% change
Q3 2014 Q3 2015 nomi-
nal compar-
able
Western Europe 1,326 1,435 8% 5%
North America 1,636 1,983 21% 1%
Other maturegeographies 412 444 8% 3%
Total maturegeographies 3,374 3,862 14% 3%
Growth geographies 1,820 1,974 8% 0%
Philips Group 5,194 5,836 12% 2%
Sales per sector▪ Group sales amounted to EUR 5,836 million, an
increase of 2% on a comparable basis. Group nominalsales increased by 12%, mainly due to positivecurrency effects and portfolio changes.
▪ Healthcare comparable sales grew 3% year-on-year.Imaging Systems, Healthcare Informatics, Solutions &Services and Customer Services recorded mid-single-digit growth, while Patient Care & MonitoringSolutions remained in line with Q3 2014.
▪ Consumer Lifestyle comparable sales increased by6%. Health & Wellness and Personal Care achieveddouble-digit growth, while Domestic Appliancesrecorded a low-single-digit decline.
▪ Lighting comparable sales showed a 3% declineyear-on-year. Professional Lighting Solutions posteda low-single-digit decline. Light Sources &Electronics and Consumer Luminaires recorded amid-single-digit decline.
Sales per geographic cluster▪ Comparable sales in growth geographies were in line
with Q3 2014. Growth in Central & Eastern Europe andAsia Pacific was offset by a decline in China and theMiddle East & Turkey.
▪ Comparable sales in mature geographies increased3% year-on-year. Western Europe achieved mid-single-digit growth, largely driven by the Benelux andGermany, Switzerland & Austria. Other maturegeographies posted low-single-digit growth, withstrong growth in Australia and New Zealand, partlyoffset by a low-single-digit decline in Japan. NorthAmerica also recorded low-single-digit growth.

Press Release Q3 2015 5
EBITA in millions of EUR unless otherwise stated
Q3 2014 Q3 2015
amount % amount %
Healthcare (151) (6.8)% 253 9.6%
Consumer Lifestyle 114 10.2% 156 12.5%
Lighting 126 7.4% 159 8.7%
Innovation, Group &Services (151) – (139) –
Philips Group (62) (1.2)% 429 7.4%
EBITA excluding restructuring and acquisition-relatedcharges and other itemsin millions of EUR unless otherwise stated
Q3 2014 Q3 2015
amount % amount %
Healthcare 267 12.0% 324 12.3%
Consumer Lifestyle 118 10.6% 156 12.5%
Lighting 156 9.1% 174 9.5%
Innovation, Group &Services (67) – (84) –
Philips Group 474 9.1% 570 9.8%
EBIT in millions of EUR unless otherwise stated
Q3 2014 Q3 2015
Healthcare (190) 209
Consumer Lifestyle 101 143
Lighting 105 132
Innovation, Group & Services (155) (142)
Philips Group (139) 342
as a % of sales (2.7)% 5.9%
Earnings per sector▪ Healthcare EBITA increased by EUR 404 million year-
on-year. Excluding restructuring and acquisition-related charges and other items, EBITA amounted toEUR 324 million, or 12.3% of sales, compared to EUR267 million, or 12.0% of sales, in Q3 2014. The increasewas largely driven by cost productivity, partly offsetby negative currency impacts, higher plannedexpenditure for growth initiatives, and increases inQuality & Regulatory spend, including at theCleveland site.
▪ Consumer Lifestyle EBITA increased by EUR 42million year-on-year. Excluding restructuring andacquisition-related charges, EBITA was EUR 156million, or 12.5% of sales, compared to EUR 118million, or 10.6% of sales, in Q3 2014. Theimprovement was mainly due to higher volumes,product mix and cost productivity.
▪ Lighting EBITA increased by EUR 33 million year-on-year. EBITA, excluding restructuring and acquisition-related charges, was EUR 174 million, or 9.5% of sales,compared to EUR 156 million, or 9.1% of sales, in Q32014. The increase was mainly driven by improvedcost productivity and gains on the sale of assets.
▪ Innovation, Group & Services EBITA increased by EUR12 million year-on-year. Excluding restructuring andacquisition-related charges and other items, EBITAwas a net cost of EUR 84 million, compared to a netcost of EUR 67 million in Q3 2014. The net costincrease was mainly due to investments in emergingbusiness areas and cyber security, partly offset by arelease of environmental provisions.

6 Press Release Q3 2015
Cash balance in millions of EUR
Q3 2014 Q3 2015
Beginning cash balance 1,435 1,135
Free cash flow 155 58
Net cash flow from operatingactivities 325 281
Net capital expenditures (170) (223)
Acquisitions and divestments ofbusinesses (148) (3)
Other cash flow from investingactivities 96 8
Treasury shares transactions (120) (109)
Changes in debt 236 (7)
Dividend paid (44) (45)
Other cash flow items 74 (34)
Net cash flow discontinued operations 32 22
Ending cash balance 1,716 1,025
Cash flows from operating activities in millions of EUR
325
Q3 2014
186
Q2’15
281
Q3 2015
Gross capital expenditures1) in millions of EUR
95
Q3 2014
117
Q2’15
135
Q3 2015
1) Capital expenditures on property, plant and equipment only
Cash balance▪ In Q3 2015 the cash balance decreased to EUR 1,025
million, with a free cash inflow of EUR 58 million. Thecash balance was also impacted by the use of EUR109 million in treasury shares transactions, primarilyfor the share buy-back program, and by EUR 45million related to cash dividends.
▪ In Q3 2014 the cash balance increased to EUR 1,716million, with a free cash inflow of EUR 155 million,which included an outflow of EUR 45 million in theform of a pension contribution related to the de-risking of the Dutch pension plan. The cash balancewas also impacted by a EUR 148 million outflow,mainly related to the acquisition of a 51% interest inGeneral Lighting Company (GLC) in Saudi Arabia,EUR 96 million mainly related to gains on the sale offinancial assets, the use of EUR 120 million in treasuryshares transactions, and EUR 236 million related todebt issuance.
▪ As of September 30, 2015, Philips had completed66% of the 3-year EUR 1.5 billion share buy-backprogram.
Cash flows from operating activities▪ Operating activities resulted in a cash flow of EUR 281
million, compared to EUR 325 million in Q3 2014. Anincrease in working capital was partly offset by higherearnings.
Gross capital expenditures▪ Gross capital expenditures on property, plant and
equipment were EUR 40 million above the level of Q32014, mainly due to higher investments in real estaterefurbishments.

Press Release Q3 2015 7
Inventories in millions of EUR unless otherwise stated
3,979
Q3 20141,2)
17.1%3,973
Q2’151,2)
17.0%4,011 Inventories
Q3 20151,2)
16.8%
as a % of sales
1) Sales is calculated over the preceding 12 months2) Inventories as a % of sales excludes inventories and sales related to
acquisitions, divestments and discontinued operations
Net debt and Group equityin billions of EUR unless otherwise stated
2.6
11.0
Q3 2014
19 : 81
4.5
11.5
Q2’15
28 : 72
4.5 Net debt
11.6 Group equity
Q3 2015
28 : 72 ratio
Number of employees in FTEs
106,772
Q3 20141,2)
105,917
Q2’151,2)
105,568
Q3 20151,2)
1) Number of employees excludes discontinued operations. Discontinuedoperations had 8,812 employees in Q3 2015 (Q2 2015:8,689, Q3 2014:8,489). The year-on-year increase was mainly due to the transfer ofemployees to the combined businesses of Lumileds and Automotive asit operates as a stand-alone company.
2) Number of employees includes 13,338 third-party workers in Q3 2015(Q2 2015:13,796 , Q3 2014:12,850 ).
Inventories▪ Inventory value at the end of Q3 2015 was EUR 4.0
billion as reported and amounted to 16.8% of sales.*▪ Compared to Q3 2014, inventories as a percentage of
sales decreased by 0.3 percentage points. Thedecrease was mainly driven by reductions at Lightingand Consumer Lifestyle.
Net debt and Group equity▪ The net debt position remained in line with Q2 2015
at EUR 4.5 billion.▪ Group equity increased in the quarter to EUR 11.6
billion. The increase was largely a result of net gainsrealized during the period, partly offset by currencyeffects.
Employees▪ The number of employees decreased by 1,204 year-
on-year. Reductions in headcount as a result of theindustrial footprint rationalization at Lighting andConsumer Lifestyle were partly offset by the Volcanoacquisition.
▪ The number of employees decreased by 349compared to Q2 2015. Industrial footprintrationalization at Lighting was partly offset byincreases at Domestic Appliances and ImagingSystems.
*Inventories as a % of sales excludes inventories and sales related to acquisitions, divestments and
discontinued operations

8 Press Release Q3 2015
HealthcareKey data in millions of EUR unless otherwise stated
Q3 2014 Q3 2015
Sales 2,234 2,627
Sales growth
% nominal (1)% 18%
% comparable 1% 3%
EBITA (151) 253
as a % of sales (6.8)% 9.6%
EBIT (190) 209
as a % of sales (8.5)% 8.0%
Net operating capital (NOC) 7,261 9,044
Number of employees (FTEs)1) 37,340 39,777
1) Number of employees includes 2,636 third-party workers in Q3 2015 (Q32014: 2,594).
Sales in millions of EUR
2,234
Q3 2014
2,849
Q4’14
2,261
Q1’15
2,754
Q2’15
2,627
Q3 2015
EBITA in millions of EUR unless otherwise stated
(151)
Q3 2014
(6.8)%
390
Q4’14
13.7%
65
Q1’15
2.9%
275
Q2’15
10.0%
253 EBITA
Q3 2015
9.6%
as a % of sales
Business highlights▪ Philips expanded its portfolio of care solutions for the
home with a new range of clinically proven sleep caresolutions. The Dream Family is a fully integrated,patient-centric solution featuring a connectedpositive airway pressure therapy device,complementary mask line, and engagement tools toimprove care for obstructive sleep apnea patients.
▪ Leveraging its strength in interventional cardiology,Philips signed a multi-year technology agreementwith the Catharina Hospital, the largestcardiovascular center in the Netherlands, comprisingthe equipment, software, upgrades and maintenanceservices for five interventional rooms and two hybridoperating rooms.
▪ Philips has acquired Blue Jay Consulting, a leadingprovider of consulting services to hospital emergencydepartments in the US. Blue Jay’s offeringcomplements Philips’ enterprise-wide consultingservices to help improve clinical care and operationaleffectiveness across the health continuum.
▪ Philips expanded the capabilities of its HealthSuiteDigital Platform, a secure cloud infrastructure forhealth data and devices. The company strengthenedthe collaboration with Amazon Web Services tobroaden the platform’s connectivity capabilities. Incollaboration with Radboud University MedicalCenter and Salesforce, Philips developed aprototype app that runs on the platform to enhancediabetes care.
▪ Embedding its deep clinical knowledge in softwareapplications for improved diagnosis and planning incardiology, Philips introduced HeartModel, anultrasound tool with anatomical intelligence, formore reproducible ultrasound results andstreamlined exam time and efficiencies.
Financial performance▪ Currency-comparable order intake showed low-
single-digit growth year-on-year. Imaging Systemsachieved mid-single-digit growth, and Patient Care &Monitoring Solutions posted low-single-digit growth.Healthcare Informatics, Solutions & Servicesrecorded a double-digit decline.
▪ Currency-comparable order intake in maturegeographies showed mid-single-digit growth.Western Europe achieved high-single-digit growthand North America posted mid-single-digit growth,while other mature geographies were in line with Q32014. Growth geographies recorded a mid-single-digit decline, mainly due to a double-digit decline inChina.

Press Release Q3 2015 9
EBITA excluding restructuring and acquisition-relatedcharges and other itemsin millions of EUR unless otherwise stated
267
Q3 2014
12.0%
421
Q4’14
14.8%
123
Q1’15
5.4%
296
Q2’15
10.7% 324EBITA excluding restructuringand acquisition-related chargesand other items
Q3 2015
12.3%
as a % of sales
▪ Comparable sales grew 3% year-on-year. ImagingSystems, Healthcare Informatics, Solutions &Services and Customer Services recorded mid-single-digit growth, while Patient Care & MonitoringSolutions remained in line with Q3 2014.
▪ Comparable sales in mature geographies showedmid-single-digit growth. Western Europe achieveddouble-digit growth, while North America and othermature geographies posted low-single-digit growth.Growth geographies recorded a low-single-digitdecline.
▪ EBITA amounted to EUR 253 million, or 9.6% of sales,compared to a loss of EUR 151 million in Q3 2014.EBITA in Q3 2015 included charges of EUR 31 millionrelated to a legal matter, as well as restructuring andacquisition-related charges of EUR 40 million, largelyrelating to the Volcano acquisition. In Q3 2014, EBITAincluded charges of EUR 366 million related to theprovision for the Masimo litigation and EUR 49million of mainly inventory write-downs related tothe Cleveland facility. Restructuring and acquisition-related charges in Q3 2014 amounted to EUR 3million.
▪ Excluding restructuring and acquisition-relatedcharges and other items, EBITA amounted to EUR 324million, or 12.3% of sales, compared to EUR 267million, or 12.0% of sales, in Q3 2014. The increase waslargely driven by cost productivity, partly offset bynegative currency impacts, higher plannedexpenditure for growth initiatives, and increases inQuality & Regulatory spend, including at theCleveland site.
▪ Net operating capital, excluding a currencytranslation effect of EUR 769 million, increased byEUR 1,014 million year-on-year. This increase waslargely driven by the Volcano acquisition.
▪ Inventories as a percentage of sales* increased by 0.4percentage points year-on-year, in preparation foradditional sales volume in Q4 2015.
▪ Compared to Q3 2014, the number of employeesincreased by 2,437, largely driven by the Volcanoacquisition. Compared to Q2 2015, the number ofemployees increased by 254, mainly due to increasesat Imaging Systems.
Miscellaneous▪ Restructuring and acquisition-related charges in Q4
2015 are expected to total approximately EUR 70million.
*Inventories as a % of sales excludes inventories and sales related to acquisitions, divestments and
discontinued operations

10 Press Release Q3 2015
Consumer LifestyleKey data in millions of EUR unless otherwise stated
Q3 2014 Q3 2015
Sales 1,114 1,246
Sales growth
% nominal 2% 12%
% comparable 5% 6%
EBITA 114 156
as a % of sales 10.2% 12.5%
EBIT 101 143
as a % of sales 9.1% 11.5%
Net operating capital (NOC) 1,408 1,693
Number of employees (FTEs)1) 17,472 16,763
1) Number of employees includes 4,051 third-party workers in Q3 2015 (Q32014: 3,918).
Sales in millions of EUR
1,114
Q3 2014
1,528
Q4’14
1,190
Q1’15
1,248
Q2’15
1,246
Q3 2015
EBITA in millions of EUR unless otherwise stated
114
Q3 2014
10.2%
251
Q4’14
16.4%
135
Q1’15
11.3%135
Q2’15
10.8% 156 EBITA
Q3 2015
12.5%
as a % of sales
Business highlights▪ Male Electric Shaving and Grooming delivered
double-digit growth, driven by new innovationsincluding the Philips Shaver series 7000 and 5000,Philips Beardtrimmer series 5000, and notablystrong sales in Europe, Japan and China.
▪ Further expanding category leadership and drivingmarket share, Philips Oral Healthcare delivereddouble-digit growth, with strong performanceglobally. Innovations supporting healthier teeth andgums, like the Philips Sonicare DiamondCleanAmethyst and Philips Sonicare AirFloss Pro, coupledwith digital marketing and professionalendorsement, were key drivers of performance.
▪ Philips continued to outpace the beauty devicemarket, with strong performance in Western Europe,driven by the award-winning Philips Lumea hairremoval solution, and in China and India, driven byinnovation in haircare. Strategic partnerships withbeauty retailers in Europe and China have expandeddistribution in specialist channels.
▪ At Kind + Jugend, the leading international baby andtoddler trade fair in Germany, Philips reinforced itsindustry leadership, showcasing the Philips AventuGrow Platform, a new digital parenting platformwhich supports the healthy development of babies.Globally, high-single-digit performance in thequarter was driven by infant and toddler feedingsolutions, as well as baby monitors, especially inGermany, Austria & Switzerland, Latin America andChina.
▪ Empowering consumers to take greater control oftheir health, Philips personal health programs wereannounced at IFA Berlin, one of the world’s leadingtrade shows for home appliances. Built upon thePhilips HealthSuite Digital Platform, these healthprograms mark a new era in connected care forconsumers, patients and health providers. Eachprogram comprises connected health measurementdevices, an app-based personalized program withcoaching, and secure, cloud-based data analysis.
Financial performance▪ Comparable sales increased by 6% year-on-year.
Health & Wellness and Personal Care achieveddouble-digit growth, while Domestic Appliancesrecorded a low-single-digit decline.
▪ Comparable sales in growth geographies and maturegeographies showed mid-single-digit growth. NorthAmerica and other mature geographies achievedhigh-single-digit growth, while Western Europerecorded low-single-digit growth.
▪ EBITA amounted to EUR 156 million, or 12.5% of sales,compared to EUR 114 million, or 10.2% of sales, in Q32014. Restructuring and acquisition-related chargeswere nil, compared with EUR 4 million in Q3 2014.

Press Release Q3 2015 11
EBITA excluding restructuring and acquisition-relatedcharges and other itemsin millions of EUR unless otherwise stated
118
Q3 2014
10.6%
244
Q4’14
16.0%
136
Q1’15
11.4%134
Q2’15
10.7% 156EBITA excluding restructuringand acquisition-related chargesand other items
Q3 2015
12.5%
as a % of sales
▪ Excluding restructuring and acquisition-relatedcharges, EBITA was EUR 156 million, or 12.5% of sales,compared to EUR 118 million, or 10.6% of sales, in Q32014. The improvement was mainly driven by highervolumes, product mix and cost productivity.
▪ Net operating capital, excluding a currencytranslation effect of EUR 60 million, increased by EUR225 million year-on-year. The increase was largelydriven by higher working capital.
▪ Inventories as a percentage of sales* were 1.3percentage points lower than in Q3 2014, driven byreductions in all businesses.
▪ The number of employees decreased by 709compared to Q3 2014, mainly due to reductions inAsia Pacific. Compared to Q2 2015, the number ofemployees increased by 216, largely due to seasonalworkers at Domestic Appliances.
Miscellaneous▪ Restructuring and acquisition-related charges in Q4
2015 are expected to be approximately EUR 30million.
*Inventories as a % of sales excludes inventories and sales related to acquisitions, divestments and
discontinued operations

12 Press Release Q3 2015
Lighting(Excluding the combined businesses of Lumileds and Automotive)
Key data in millions of EUR unless otherwise stated
Q3 2014 Q3 2015
Sales 1,705 1,830
Sales growth
% nominal (3)% 7%
% comparable (3)% (3)%
EBITA 126 159
as a % of sales 7.4% 8.7%
EBIT 105 132
as a % of sales 6.2% 7.2%
Net operating capital (NOC) 5,078 3,962
Number of employees (FTEs)1) 38,277 35,008
1) Number of employees includes 4,816 third-party workers in Q3 2015 (Q32014: 4,914)
Sales in millions of EUR
1,705
Q3 2014
1,975
Q4’14
1,719
Q1’15
1,836
Q2’15
1,830
Q3 2015
EBITA in millions of EUR
126
Q3 2014
7.4%
(40)
Q4’14
(2.0)%
119
Q1’15
6.9%
164
Q2’15
8.9%
159 EBITA
Q3 2015
8.7%
as a % of sales
Business highlights▪ Philips expanded its leadership in the connected
lighting business with the introduction of Philips HueLightstrip Plus, the Philips Hue wireless dimming kitand Philips Hue Bridge 2.0. The new bridge enablesPhilips Hue to interact with other Apple HomeKitdevices and become voice-controlled.
▪ In India, Philips will outfit 32 Accenture offices,including the installation of more than 140,000 LED-based products. The upgrade will enable significantenergy savings and create a more pleasant workenvironment.
▪ As part of a government program, Philips provided76,500 advanced solar street-lighting units to lightup more than 800 off-grid villages in Uttar Pradesh,India’s most populous state.
▪ Philips continues to light up iconic buildings aroundthe world with colorful and dynamic connected LEDlighting. New illuminations this quarter include theMoscow Cathedral Mosque, Europe’s largestmosque, Le Meurice hotel in Paris, the Accra Theaterin Ghana, and the Edirne Bridge in Turkey.
▪ Further expanding its technology leadership in LED,Philips introduced ColorSpark, an innovative LED-based technology that increases the brightness ofprojectors by a factor of three compared to existingLED-based solutions. It will be brought to market bymajor brands in the first quarter of 2016.
Financial performance▪ Comparable sales showed a 3% decline year-on-
year. Professional Lighting Solutions posted a low-single-digit decline. Light Sources & Electronics andConsumer Luminaires recorded a mid-single-digitdecline.
▪ Comparable sales in mature geographies showed alow-single-digit decline compared to Q3 2014.Growth geographies recorded a mid-single-digitdecline, mainly due to China and the Middle East &Turkey, partly offset by Asia Pacific.
▪ LED lighting sales grew 24% year-on-year and nowrepresent 44% of total Lighting sales, compared to36% in Q3 2014. Conventional lighting sales declined20% year-on-year, mainly due to a 15% decline inlamps sales, and now represent 56% of total Lightingsales, compared to 64% in Q3 2014.

Press Release Q3 2015 13
EBITA excluding restructuring and acquisition-relatedcharges and other itemsin millions of EUR unless otherwise stated
156
Q3 2014
9.1%178
Q4’14
9.0%
144
Q1’15
8.4%
176
Q2’15
9.6%174
EBITA excluding restructuringand acquisition-related chargesand other items
Q3 2015
9.5%
as a % of sales
▪ EBITA improved to EUR 159 million, or 8.7% of sales,compared to EUR 126 million, or 7.4% of sales, in Q32014. Restructuring and acquisition-related chargesamounted to EUR 15 million, compared to EUR 30million in Q3 2014.
▪ EBITA, excluding restructuring and acquisition-related charges, improved to EUR 174 million, or 9.5%of sales, compared to EUR 156 million, or 9.1% ofsales, in Q3 2014. The increase was mainly driven byimproved cost productivity and gains on the sale ofassets.
▪ Net operating capital, excluding a currencytranslation effect of EUR 320 million, decreased byEUR 1,436 million year-on-year. The decrease wasmainly due to the reclassification of the combinedbusinesses of Lumileds and Automotive as assetsheld for sale in Q4 2014.
▪ Inventories as a percentage of sales* decreased by0.8 percentage points year-on-year.
▪ Compared to Q3 2014, the number of employeesdecreased by 3,269, reflecting rationalization of theindustrial footprint. Compared to Q2 2015, thenumber of employees decreased by 954, mainly dueto a seasonal decrease at production sites.
Miscellaneous▪ Restructuring and acquisition-related charges in Q4
2015 are expected to total approximately EUR 50million.
*Inventories as a % of sales excludes inventories and sales related to acquisitions, divestments and
discontinued operations

14 Press Release Q3 2015
Additional information onthe combined businesses ofLumileds and AutomotiveThe combined businesses of Lumileds and Automotiveare reported as discontinued operations in theConsolidated statements of income and cash flows. Asa result, Lumileds and Automotive sales and EBITA areno longer included in the Lighting and Group results ofcontinuing operations. The applicable assets andliabilities of the combined businesses are reportedunder Assets and Liabilities classified as held for sale inthe Condensed consolidated balance sheets as perNovember 2014.
In Q3 2015, the net income of discontinued operationsattributable to the combined businesses of Lumiledsand Automotive increased to EUR 86 million from EUR38 million in Q3 2014, mainly due to the adjustment ofdepreciation and amortization charges as required byIFRS accounting rules. Net income also included a EUR10 million tax benefit largely relating to non-taxableincome.
Overhead and other indirect costs of Philips that werepreviously allocated to Lumileds and Automotive andwere not affected by the transfer to Discontinuedoperations have been allocated to Lighting and IG&S(Former net costs allocated to Lighting and IG&S).
*including a 34% interest in Lumileds’ US operations
Results of combined Lumileds and Automotive businessesin millions of EUR unless otherwise stated
Q3 2014 Q3 2015
EBITA as previously reported in Lighting 43 10
Adjustment of amortization anddepreciation following assets held forsale reclassification − 49
Disentanglement costs (8) (3)
Former net costs allocated to Lighting 1 −
Former net costs allocated to IG&S 21 22
Amortization of other intangibles addedback (8) −
EBIT of discontinued operations 49 78
Financial income and expenses − (2)
Income taxes (11) 10
Net income of discontinued operations 38 86
Number of employees (FTEs) 8,489 8,812
Press Release Q3 2015 15
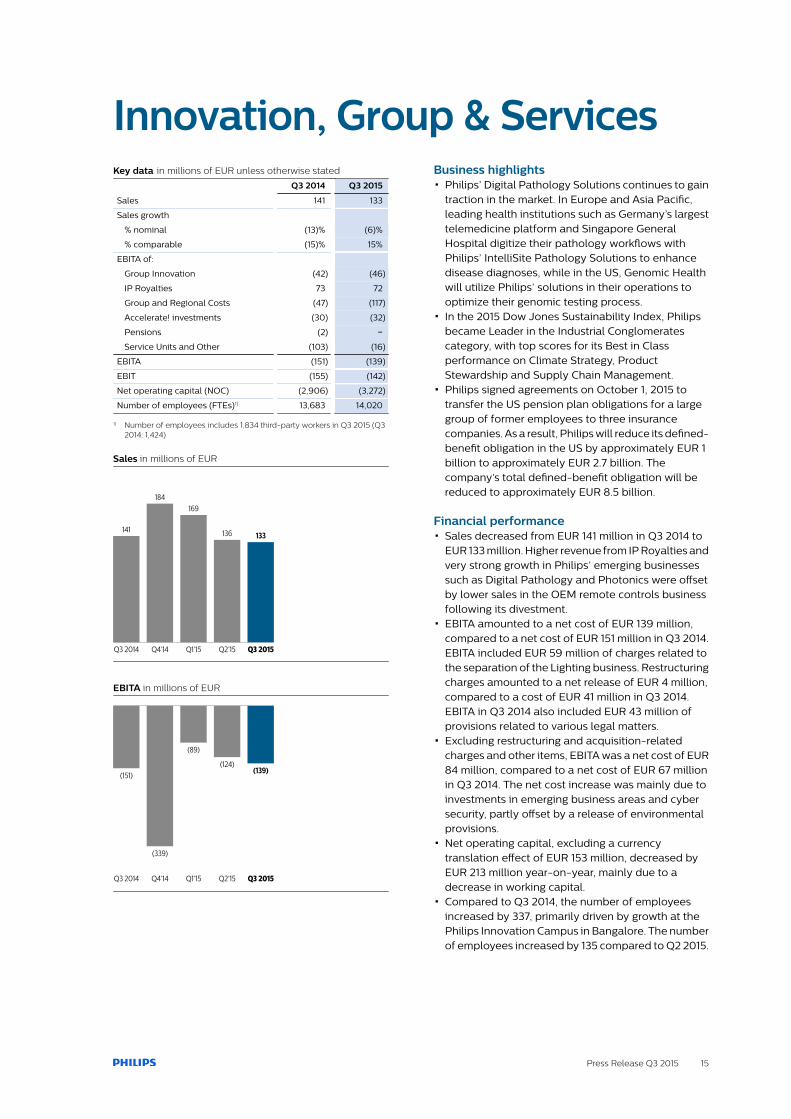
Innovation, Group & ServicesKey data in millions of EUR unless otherwise stated
Q3 2014 Q3 2015
Sales 141 133
Sales growth
% nominal (13)% (6)%
% comparable (15)% 15%
EBITA of:
Group Innovation (42) (46)
IP Royalties 73 72
Group and Regional Costs (47) (117)
Accelerate! investments (30) (32)
Pensions (2) −
Service Units and Other (103) (16)
EBITA (151) (139)
EBIT (155) (142)
Net operating capital (NOC) (2,906) (3,272)
Number of employees (FTEs)1) 13,683 14,020
1) Number of employees includes 1,834 third-party workers in Q3 2015 (Q32014: 1,424)
Sales in millions of EUR
141
Q3 2014
184
Q4’14
169
Q1’15
136
Q2’15
133
Q3 2015
EBITA in millions of EUR
(151)
Q3 2014
(339)
Q4’14
(89)
Q1’15
(124)
Q2’15
(139)
Q3 2015
Business highlights▪ Philips’ Digital Pathology Solutions continues to gain
traction in the market. In Europe and Asia Pacific,leading health institutions such as Germany’s largesttelemedicine platform and Singapore GeneralHospital digitize their pathology workflows withPhilips’ IntelliSite Pathology Solutions to enhancedisease diagnoses, while in the US, Genomic Healthwill utilize Philips’ solutions in their operations tooptimize their genomic testing process.
▪ In the 2015 Dow Jones Sustainability Index, Philipsbecame Leader in the Industrial Conglomeratescategory, with top scores for its Best in Classperformance on Climate Strategy, ProductStewardship and Supply Chain Management.
▪ Philips signed agreements on October 1, 2015 totransfer the US pension plan obligations for a largegroup of former employees to three insurancecompanies. As a result, Philips will reduce its defined-benefit obligation in the US by approximately EUR 1billion to approximately EUR 2.7 billion. Thecompany’s total defined-benefit obligation will bereduced to approximately EUR 8.5 billion.
Financial performance▪ Sales decreased from EUR 141 million in Q3 2014 to
EUR 133 million. Higher revenue from IP Royalties andvery strong growth in Philips’ emerging businessessuch as Digital Pathology and Photonics were offsetby lower sales in the OEM remote controls businessfollowing its divestment.
▪ EBITA amounted to a net cost of EUR 139 million,compared to a net cost of EUR 151 million in Q3 2014.EBITA included EUR 59 million of charges related tothe separation of the Lighting business. Restructuringcharges amounted to a net release of EUR 4 million,compared to a cost of EUR 41 million in Q3 2014.EBITA in Q3 2014 also included EUR 43 million ofprovisions related to various legal matters.
▪ Excluding restructuring and acquisition-relatedcharges and other items, EBITA was a net cost of EUR84 million, compared to a net cost of EUR 67 millionin Q3 2014. The net cost increase was mainly due toinvestments in emerging business areas and cybersecurity, partly offset by a release of environmentalprovisions.
▪ Net operating capital, excluding a currencytranslation effect of EUR 153 million, decreased byEUR 213 million year-on-year, mainly due to adecrease in working capital.
▪ Compared to Q3 2014, the number of employeesincreased by 337, primarily driven by growth at thePhilips Innovation Campus in Bangalore. The numberof employees increased by 135 compared to Q2 2015.

16 Press Release Q3 2015
EBITA excluding restructuring and acquisition-relatedcharges and other items in millions of EUR
(67)
Q3 2014
(100)
Q4’14
(76)
Q1’15
(105)
Q2’15
(84)
Q3 2015
Miscellaneous▪ Restructuring charges in Q4 2015 are expected to
total approximately EUR 20 million.▪ Charges related to the separation of the Lighting
business in Q4 2015 are estimated at approximatelyEUR 80 million.
▪ As announced on October 1, 2015, Philips expects tomake additional pension contributions ofapproximately USD 315 million (approximately EUR280 million) in cash, of which approximately USD 125million (approximately EUR 110 million) will be madein the fourth quarter of 2015 and approximately USD190 million (approximately EUR 170 million) in the firstquarter of 2016. As a result, Philips expects torecognize a non-cash pension settlement charge inthe fourth quarter of 2015 that is currently estimatedat approximately USD 45 million (approximately EUR40 million) before tax and will be reported withinEBITA.

Press Release Q3 2015 17
Forward-looking statementsForward-looking statementsThis document and the related oral presentation,including responses to questions following thepresentation, contain certain forward-lookingstatements with respect to the financial condition,results of operations and business of Philips and certainof the plans and objectives of Philips with respect tothese items. Examples of forward-looking statementsinclude statements made about the strategy, estimatesof sales growth, future EBITA, future developments inPhilips’ organic business and the completion ofacquisitions and divestments. By their nature, thesestatements involve risk and uncertainty because theyrelate to future events and circumstances and there aremany factors that could cause actual results anddevelopments to differ materially from those expressedor implied by these statements.
These factors include but are not limited to domesticand global economic and business conditions,developments within the euro zone, the successfulimplementation of Philips’ strategy and the ability torealize the benefits of this strategy, the ability todevelop and market new products, changes inlegislation, legal claims, changes in exchange andinterest rates, changes in tax rates, pension costs andactuarial assumptions, raw materials and employeecosts, the ability to identify and complete successfulacquisitions, including Volcano, and to integrate thoseacquisitions into the business, the ability to successfullyexit certain businesses or restructure the operations,the rate of technological changes, political, economicand other developments in countries where Philipsoperates, industry consolidation and competition. As aresult, Philips’ actual future results may differ materiallyfrom the plans, goals and expectations set forth in suchforward-looking statements. For a discussion of factorsthat could cause future results to differ from suchforward-looking statements, see the Risk managementchapter included in the Annual Report 2014 and the“Risk and uncertainties” section in the semi-annualfinancial report for the six months ended June 30, 2015.
Third-party market share dataStatements regarding market share, including thoseregarding Philips’ competitive position, contained inthis document are based on outside sources such asresearch institutes, industry and dealer panels incombination with management estimates. Whereinformation is not yet available to Philips, thosestatements may also be based on estimates andprojections prepared by outside sources ormanagement. Rankings are based on sales unlessotherwise stated.
Use of non-GAAP informationIn presenting and discussing the Philips Group financialposition, operating results and cash flows,management uses certain non-GAAP financialmeasures. These non-GAAP financial measures shouldnot be viewed in isolation as alternatives to theequivalent IFRS measures and should be used inconjunction with the most directly comparable IFRSmeasures. Non-GAAP financial measures do not havestandardized meaning under IFRS and therefore maynot be comparable to similar measures presented byother issuers. A reconciliation of these non-GAAPmeasures to the most directly comparable IFRSmeasures is contained in this document. Furtherinformation on non-GAAP measures can be found inthe Annual Report 2014.
Use of fair-value measurementsIn presenting the Philips Group financial position, fairvalues are used for the measurement of various itemsin accordance with the applicable accountingstandards. These fair values are based on market prices,where available, and are obtained from sources that aredeemed to be reliable. Readers are cautioned thatthese values are subject to changes over time and areonly valid at the balance sheet date. When quotedprices or observable market data are not readilyavailable, fair values are estimated using appropriatevaluation models and unobservable inputs. Such fairvalue estimates require management to makesignificant assumptions with respect to futuredevelopments, which are inherently uncertain and maytherefore deviate from actual developments. Criticalassumptions used are disclosed in the Annual Report2014. Independent valuations may have been obtainedto support management’s determination of fair values.
PresentationAll amounts are in millions of euros unless otherwisestated. All reported data is unaudited. Financialreporting is in accordance with the accounting policiesas stated in the Annual Report 2014, unless otherwisestated. The presentation of certain prior-yearinformation has been reclassified to conform to thecurrent-year presentation.
In 2014, we announced plans to establish two stand-alone companies focused on the HealthTech andLighting opportunities. The proposed separation of theLighting business impacts all businesses and marketsas well as all supporting functions and all assets andliabilities of the Group. Philips expects to complete theseparation of the Lighting business in the first half of2016. We expect to continue reporting in the existingstructure until the changes in the way we allocateresources and analyze performance in the newstructure have been completed.

18 Press Release Q3 2015
Condensed consolidated statements of income
Condensed consolidated statements of income in millions of EUR unless otherwise stated
Q3 January to September
2014 2015 2014 2015
Sales 5,194 5,836 14,855 17,149
Cost of sales (3,492) (3,414) (9,178) (10,116)
Gross margin 1,702 2,422 5,677 7,033
Selling expenses (1,245) (1,390) (3,625) (4,171)
General and administrative expenses (191) (241) (534) (679)
Research and development expenses (372) (471) (1,168) (1,390)
Impairment of goodwill (1) (3) (1)
Other business income 21 25 40 73
Other business expenses (54) (2) (63) (35)
Income (loss) from operations (139) 342 324 830
Financial income 64 12 95 71
Financial expenses (144) (112) (318) (312)
Income (loss) before taxes (219) 242 101 589
Income taxes 50 (8) (10) (87)
Income (loss) after taxes (169) 234 91 502
Results relating to investments in associates 39 2 63 24
Net income (loss) from continuing operations (130) 236 154 526
Discontinued operations - net of income tax 27 88 123 172
Net income (loss) (103) 324 277 698
Attribution of net income for the period
Net income (loss) attributable to Koninklijke Philips N.V.shareholders (104) 319 276 690
Net income attributable to non-controlling interests 1 5 1 8
Earnings per common share attributable to shareholders
Weighted average number of common shares outstanding (after deduction of treasury shares) during the period (inthousands):
- basic 922,180 923,675 911,173 915,044
- diluted 928,293 928,028 919,191 920,949
Net income (loss) attributable to shareholders per commonshare in EUR:
- basic (0.11) 0.35 0.30 0.75
- diluted (0.11) 0.34 0.30 0.75

Press Release Q3 2015 19
Condensed consolidated balance sheets
Condensed consolidated balance sheets in millions of EUR unless otherwise stated
September 28, 2014 December 31, 2014 September 30, 2015
Non-current assets:
Property, plant and equipment 2,773 2,095 2,245
Goodwill 7,048 7,158 8,245
Intangible assets excluding goodwill 3,387 3,368 3,682
Non-current receivables 188 177 182
Investments in associates 158 157 180
Other non-current financial assets 448 462 479
Non-current derivative financial assets 14 15 48
Deferred tax assets 2,064 2,460 2,730
Other non-current assets 78 69 67
Total non-current assets 16,158 15,961 17,858
Current assets:
Inventories 3,979 3,314 4,011
Other current financial assets 126 125 13
Other current assets 458 411 529
Current derivative financial assets 116 192 125
Income tax receivable 237 140 95
Receivables 5,021 4,723 4,782
Assets classified as held for sale 109 1,613 1,751
Cash and cash equivalents 1,716 1,873 1,025
Total current assets 11,762 12,391 12,331
Total assets 27,920 28,352 30,189
Equity
Shareholders’ equity 10,912 10,867 11,446
Non-controlling interests 89 101 108
Group equity 11,001 10,968 11,554
Non-current liabilities:
Long-term debt 3,584 3,712 3,973
Non-current derivative financial liabilities 422 551 613
Long-term provisions 2,249 2,500 2,398
Deferred tax liabilities 149 107 127
Other non-current liabilities 1,528 1,838 1,859
Total non-current liabilities 7,932 8,708 8,970
Current liabilities:
Short-term debt 725 392 1,574
Current derivative financial liabilities 240 306 261
Income tax payable 90 102 120
Accounts payable 3,069 2,499 2,551
Accrued liabilities 2,816 2,692 2,658
Short-term provisions 791 945 787
Liabilities directly associated with assets held for sale 3 349 377
Other current liabilities 1,253 1,391 1,337
Total current liabilities 8,987 8,676 9,665
Total liabilities and group equity 27,920 28,352 30,189

20 Press Release Q3 2015
Condensed consolidated statements of cash flows
Condensed consolidated statements of cash flows in millions of EUR
Q3 January to September
2014 2015 2014 2015
Cash flows from operating activities
Net income (loss) (103) 324 277 698
Results of discontinued operations - net of income tax (27) (88) (123) (172)
Adjustments to reconcile net income (loss) to net cash of operating activities:
Depreciation, amortization, and impairments of fixed assets 278 312 794 926
Impairment of goodwill and other non-current financial assets 1 1 18 5
Net gain on sale of assets (65) (17) (74) (63)
Interest income (9) (9) (28) (35)
Interest expense on debt, borrowings and other liabilities 60 71 168 206
Income taxes (50) 8 10 87
Results from investments in associates (41) (3) (64) (3)
Decrease (increase) in working capital: 40 (282) 91 (613)
Decrease (increase) in receivables and other current assets (301) (152) (103) 228
Increase in inventories (113) (205) (476) (596)
Increase (decrease) in accounts payable, accrued and other liabilities 454 75 670 (245)
Decrease (increase) in non-current receivables, other assets, other liabilities 92 (57) (426) (55)
Increase (decrease) in provisions 476 (32) 410 (310)
Other items (176) 200 (157) (30)
Interest paid (92) (107) (206) (236)
Interest received 8 9 27 36
Dividends received from investments in associates 19 − 33 6
Income taxes paid (86) (49) (288) (236)
Net cash provided by operating activities 325 281 462 211
Cash flows from investing activities
Net capital expenditures (170) (223) (524) (626)
Purchase of intangible assets (26) (42) (58) (97)
Expenditures on development assets (66) (74) (207) (229)
Capital expenditures on property, plant and equipment (95) (135) (284) (344)
Proceeds from sale of property, plant and equipment 17 28 25 44
Net proceeds from (used for) derivatives and current financial assets 7 2 5 (78)
Purchase of other non-current financial assets (2) (14) (74) (16)
Proceeds from other non-current financial assets 91 20 93 38
Purchase of businesses, net of cash acquired (145) − (164) (1,104)
Net proceeds (used for) from sale of interest in businesses (3) (3) (59) 61
Net cash used for investing activities (222) (218) (723) (1,725)
Cash flows from financing activities
Proceeds from issuance of short-term debt 238 14 334 1,204
Principal payments on long-term debt (21) (42) (314) (81)
Proceeds from issuance of long-term debt 19 21 45 64
Re-issuance of treasury shares 12 9 108 74
Purchase of treasury shares (132) (118) (570) (398)
Dividend paid (44) (45) (292) (298)
Net cash provided by (used for) financing activities 72 (161) (689) 565
Net cash provided by (used for) continuing operations 175 (98) (950) (949)
Cash flows from discontinued operations
Net cash provided by operating activities 32 22 56 12
Net cash provided by investing activities − – 99 –
Net cash provided by discontinued operations 32 22 155 12
Net cash provided by (used for) continuing and discontinued operations 207 (76) (795) (937)
Effect of change in exchange rates on cash and cash equivalents 74 (34) 46 89
Cash and cash equivalents at the beginning of the period 1,435 1,135 2,465 1,873
Cash and cash equivalents at the end of the period 1,716 1,025 1,716 1,025
For a number of reasons, principally the effects of translation differences, certain items in the statements of cash flows do not correspond to the differencesbetween the balance sheet amounts for the respective items.

Press Release Q3 2015 21
Condensed consolidated statement of changes in equity
Condensed consolidated statement of changes in equity in millions of EUR
com
mon sh
ares
capita
l in e
xcess
of p
ar valu
e
reta
ined e
arnin
gs
reva
luatio
n rese
rve
curre
ncy tr
anslatio
n diff
erence
s
availa
ble- f
or-sa
le fi
nancial a
ssets
cash
flow
hedges
treasu
ry sh
ares a
t cost
tota
l share
holders
’ equity
non-contro
lling in
tere
sts
Group e
quity
January to September 2015
Balance as ofDecember 31, 2014 187 2,181 8,790 13 229 27 (13) (547) 10,867 101 10,968
Total comprehensiveincome 563 (7) 523 24 26 1,129 8 1,137
Dividend distributed 3 429 (730) (298) (298)
Movement non-controllinginterest – (1) (1)
Purchase of treasuryshares (12) (385) (397) (397)
Re-issuance of treasuryshares (22) (51) 146 73 73
Share-basedcompensation plans 92 92 92
Income tax share-basedcompensation plans (20) (20) (20)
Total other equitymovements 3 479 (793) (239) (550) (1) (551)
Balance as ofSeptember 30, 2015 190 2,660 8,560 6 752 51 13 (786) 11,446 108 11,554

22 Press Release Q3 2015
Pension costs and cash flows
Specification of pension costs in millions of EUR
Q3 2014 Q3 2015
Netherlands other total Netherlands other total
Defined-benefit plans
Pensions
Current service cost 47 19 66 − 9 9
Interest expense – 14 14 – 15 15
Interest income (3) – (3) – – –
Total 44 33 77 − 24 24
of which discontinued operations − 1 1 − − −
Retiree Medical
Current service cost – 1 1 − − −
Interest expense – 3 3 – 2 2
Total – 4 4 – 2 2
Defined-contribution plans
Cost 2 33 35 56 39 95
of which discontinued operations 1 − 1 1 1 2
Specification of pension costs in millions of EUR
January to September
2014 2015
Netherlands other total Netherlands other total
Defined-benefit plans
Pensions
Current service cost 139 54 193 80 54 134
Past service cost (incl. curtailments) – – – – (2) (2)
Interest expense – 42 42 – 42 42
Interest income (8) – (8) (1) – (1)
Total 131 96 227 79 94 173
of which discontinued operations 1 2 3 1 1 2
Retiree Medical
Current service cost – 1 1 – 1 1
Interest expense – 9 9 – 8 8
Total – 10 10 – 9 9
Defined-contribution plans
Costs 6 101 107 88 121 209
of which discontinued operations 1 2 3 1 4 5
Pension cash flows in millions of EUR unless stated otherwise
Q3 January to September
2014 2015 2014 2015
Contributions and benefits paid by the Company 194 157 845 625

Press Release Q3 2015 23
Sectors
Sales and income (loss) from operations in millions of EUR unless otherwise stated
Q3 2014 Q3 2015
sales income from operations sales income from operations
as a % of sales as a % of sales
Healthcare 2,234 (190) (8.5)% 2,627 209 8.0%
Consumer Lifestyle 1,114 101 9.1% 1,246 143 11.5%
Lighting 1,705 105 6.2% 1,830 132 7.2%
Innovation, Group & Services 141 (155) – 133 (142) –
Philips Group 5,194 (139) (2.7)% 5,836 342 5.9%
Sales and income (loss) from operations in millions of EUR unless otherwise stated
January to September
2014 2015
sales income from operations sales income from operations
as a % of sales as a % of sales
Healthcare 6,337 105 1.7% 7,642 445 5.8%
Consumer Lifestyle 3,203 283 8.8% 3,684 386 10.5%
Lighting 4,894 268 5.5% 5,385 361 6.7%
Innovation, Group & Services 421 (332) – 438 (362) –
Philips Group 14,855 324 2.2% 17,149 830 4.8%

24 Press Release Q3 2015
Sectors and main countries
Sales, total assets and total liabilities excluding debt in millions of EUR
sales total assets total liabilities excluding
debt
January to September September
28, September
30, September
28, September
30,
2014 2015 2014 2015 2014 2015
Healthcare 6,337 7,642 10,924 13,067 3,588 3,970
Consumer Lifestyle 3,203 3,684 3,202 3,241 1,794 1,548
Lighting 4,894 5,385 7,537 6,049 2,438 2,068
Innovation, Group & Services 421 438 6,148 6,081 4,787 5,125
Sector totals 27,811 28,438 12,607 12,711
Assets classified as held for sale 109 1,751 3 377
Philips Group 14,855 17,149 27,920 30,189 12,610 13,088
Sales and tangible and intangible assets in millions of EUR
sales tangible and intangible assets1)
January to September September 28, September 30,
2014 2015 2014 2015
Netherlands 410 461 908 962
United States 4,330 5,352 7,719 9,061
China 1,683 1,964 1,122 1,177
Germany 925 947 282 160
Japan 665 716 403 412
India 484 595 131 132
France 572 560 73 48
Other countries 5,786 6,554 2,570 2,220
Philips Group 14,855 17,149 13,208 14,172
1) Includes property, plant and equipment, intangible assets excluding goodwill, and goodwill

Press Release Q3 2015 25
Reconciliation of non-GAAP performance measures
Certain non-GAAP financial measures are presented when discussing the Philips Group’s performance. In the followingtables, reconciliations to the most directly comparable IFRS measures are presented.
Sales growth composition in %
Q3 January to September
comparablegrowth
currencyeffects
consolid- ation changes
nominalgrowth
comparablegrowth
currencyeffects
consolid-ation changes
nominalgrowth
2015 versus 2014
Healthcare 2.6 11.2 3.8 17.6 4.0 13.2 3.4 20.6
Consumer Lifestyle 5.5 6.3 0.0 11.8 6.0 9.0 0.0 15.0
Lighting (2.8) 8.2 1.9 7.3 (3.0) 9.9 3.1 10.0
IG&S 14.9 2.0 (22.6) (5.7) 11.8 2.6 (10.4) 4.0
Philips Group 1.7 9.0 1.7 12.4 2.3 10.9 2.2 15.4
EBITA excluding restructuring and acquisition-related charges and other items to Income from operations (or EBIT) in millions of EUR
Q3 January to September
PhilipsGroup Healthcare
ConsumerLifestyle Lighting
Innovation,Group &Services
PhilipsGroup Healthcare
ConsumerLifestyle Lighting
Innovation,Group &Services
2015
EBITA excludingrestructuring andacquisition-relatedcharges and otheritems 570 324 156 174 (84) 1,398 743 426 494 (265)
Other items (90) (31) (59) (156) (59) (97)
Restructuring andacquisition-relatedcharges (51) (40) (15) 4 (133) (91) (52) 10
EBITA (or Adjustedincome fromoperations) 429 253 156 159 (139) 1,109 593 426 442 (352)
Amortization ofintangibles1) (86) (44) (13) (26) (3) (278) (148) (40) (80) (10)
Impairment ofgoodwill (1) (1) (1) (1)
Income fromoperations (or EBIT) 342 209 143 132 (142) 830 445 386 361 (362)
2014
EBITA excludingrestructuring andacquisition-relatedcharges and otheritems 474 267 118 156 (67) 1,172 664 327 415 (234)
Other items (458) (415) (43) (458) (415) (43)
Restructuring andacquisition-relatedcharges (78) (3) (4) (30) (41) (155) (23) (5) (82) (45)
EBITA (or Adjustedincome fromoperations) (62) (151) 114 126 (151) 559 226 322 333 (322)
Amortization ofintangibles1) (77) (39) (13) (21) (4) (232) (120) (39) (63) (10)
Impairment ofgoodwill (3) (1) (2)
Income fromoperations (or EBIT) (139) (190) 101 105 (155) 324 105 283 268 (332)
1) Excluding amortization of software and product development

26 Press Release Q3 2015
Reconciliation of non-GAAP performance measures (continued)
Net operating capital to total assets in millions of EUR
Philips Group Healthcare Consumer
Lifestyle Lighting IG&S
September 30, 2015
Net operating capital (NOC) 11,427 9,044 1,693 3,962 (3,272)
Exclude liabilities comprised in NOC:
- payables/liabilities 9,399 3,001 1,318 1,526 3,554
- intercompany accounts – 113 40 90 (243)
- provisions 3,185 856 190 452 1,687
Include assets not comprised in NOC:
- investments in associates 180 53 – 19 108
- other current financial assets 13 13
- other non-current financial assets 479 479
- deferred tax assets 2,730 2,730
- cash and cash equivalents 1,025 1,025
Total assets excluding assets classified as held for sale 28,438 13,067 3,241 6,049 6,081
Assets classified as held for sale 1,751
Total assets 30,189
December 31, 2014
Net operating capital (NOC) 8,838 7,565 1,353 3,638 (3,718)
Exclude liabilities comprised in NOC:
- payables/liabilities 9,379 2,711 1,411 1,422 3,835
- intercompany accounts – 125 65 129 (319)
- provisions 3,445 793 220 530 1,902
Include assets not comprised in NOC:
- investments in associates 157 80 – 20 57
- other current financial assets 125 125
- other non-current financial assets 462 462
- deferred tax assets 2,460 2,460
- cash and cash equivalents 1,873 1,873
Total assets excluding assets classified as held for sale 26,739 11,274 3,049 5,739 6,677
Assets classified as held for sale 1,613
Total assets 28,352
September 28, 2014
Net operating capital (NOC) 10,841 7,261 1,408 5,078 (2,906)
Exclude liabilities comprised in NOC:
- payables/liabilities 9,418 2,760 1,542 1,924 3,192
- intercompany accounts – 122 66 92 (280)
- provisions 3,040 706 186 422 1,726
Include assets not comprised in NOC:
- investments in associates 158 75 – 21 62
- other current financial assets 126 126
- other non-current financial assets 448 448
- deferred tax assets 2,064 2,064
- cash and cash equivalents 1,716 1,716
Total assets excluding assets classified as held for sale 27,811 10,924 3,202 7,537 6,148
Assets classified as held for sale 109
Total assets 27,920

Press Release Q3 2015 27
Reconciliation of non-GAAP performance measures (continued)
Composition of net debt to group equity in millions of EUR unless otherwise stated
September 28, December 31, September 30,
2014 2014 2015
Long-term debt 3,584 3,712 3,973
Short-term debt 725 392 1,574
Total debt 4,309 4,104 5,547
Cash and cash equivalents 1,716 1,873 1,025
Net debt (total debt less cash and cash equivalents) 2,593 2,231 4,522
Shareholders’ equity 10,912 10,867 11,446
Non-controlling interests 89 101 108
Group equity 11,001 10,968 11,554
Net debt and group equity 13,594 13,199 16,076
Net debt divided by net debt and group equity (in %) 19% 17% 28%
Group equity divided by net debt and group equity (in %) 81% 83% 72%
Composition of cash flows in millions of EUR
Q3 January to September
2014 2015 2014 2015
Cash flows provided by operating activities 325 281 462 211
Cash flows used for investing activities (222) (218) (723) (1,725)
Cash flows before financing activities 103 63 (261) (1,514)
Cash flows provided by operating activities 325 281 462 211
Net capital expenditures: (170) (223) (524) (626)
Purchase of intangible assets (26) (42) (58) (97)
Expenditures on development assets (66) (74) (207) (229)
Capital expenditures on property, plant and equipment (95) (135) (284) (344)
Proceeds from sale of property, plant and equipment 17 28 25 44
Free cash flows 155 58 (62) (415)
28 Press Release Q3 2015
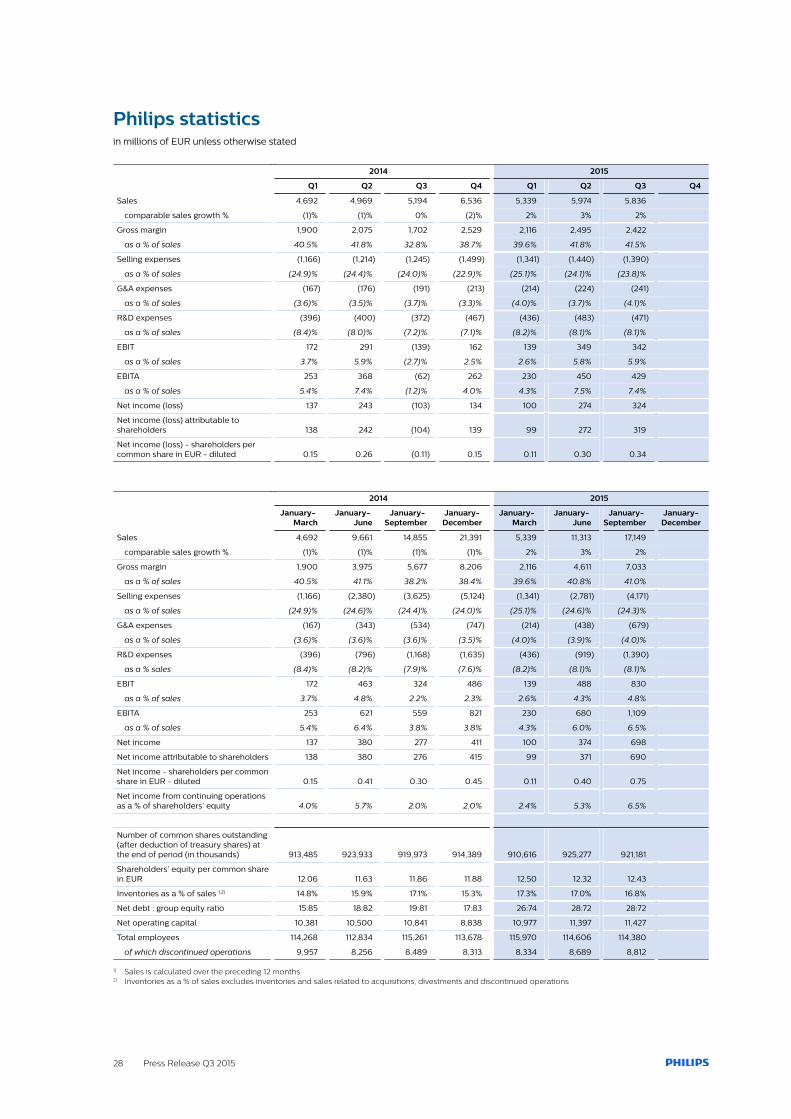
Philips statisticsin millions of EUR unless otherwise stated
2014 2015
Q1 Q2 Q3 Q4 Q1 Q2 Q3 Q4
Sales 4,692 4,969 5,194 6,536 5,339 5,974 5,836
comparable sales growth % (1)% (1)% 0% (2)% 2% 3% 2%
Gross margin 1,900 2,075 1,702 2,529 2,116 2,495 2,422
as a % of sales 40.5% 41.8% 32.8% 38.7% 39.6% 41.8% 41.5%
Selling expenses (1,166) (1,214) (1,245) (1,499) (1,341) (1,440) (1,390)
as a % of sales (24.9)% (24.4)% (24.0)% (22.9)% (25.1)% (24.1)% (23.8)%
G&A expenses (167) (176) (191) (213) (214) (224) (241)
as a % of sales (3.6)% (3.5)% (3.7)% (3.3)% (4.0)% (3.7)% (4.1)%
R&D expenses (396) (400) (372) (467) (436) (483) (471)
as a % of sales (8.4)% (8.0)% (7.2)% (7.1)% (8.2)% (8.1)% (8.1)%
EBIT 172 291 (139) 162 139 349 342
as a % of sales 3.7% 5.9% (2.7)% 2.5% 2.6% 5.8% 5.9%
EBITA 253 368 (62) 262 230 450 429
as a % of sales 5.4% 7.4% (1.2)% 4.0% 4.3% 7.5% 7.4%
Net income (loss) 137 243 (103) 134 100 274 324
Net income (loss) attributable toshareholders 138 242 (104) 139 99 272 319
Net income (loss) - shareholders percommon share in EUR - diluted 0.15 0.26 (0.11) 0.15 0.11 0.30 0.34
2014 2015
January- March
January- June
January- September
January- December
January- March
January- June
January- September
January- December
Sales 4,692 9,661 14,855 21,391 5,339 11,313 17,149
comparable sales growth % (1)% (1)% (1)% (1)% 2% 3% 2%
Gross margin 1,900 3,975 5,677 8,206 2,116 4,611 7,033
as a % of sales 40.5% 41.1% 38.2% 38.4% 39.6% 40.8% 41.0%
Selling expenses (1,166) (2,380) (3,625) (5,124) (1,341) (2,781) (4,171)
as a % of sales (24.9)% (24.6)% (24.4)% (24.0)% (25.1)% (24.6)% (24.3)%
G&A expenses (167) (343) (534) (747) (214) (438) (679)
as a % of sales (3.6)% (3.6)% (3.6)% (3.5)% (4.0)% (3.9)% (4.0)%
R&D expenses (396) (796) (1,168) (1,635) (436) (919) (1,390)
as a % sales (8.4)% (8.2)% (7.9)% (7.6)% (8.2)% (8.1)% (8.1)%
EBIT 172 463 324 486 139 488 830
as a % of sales 3.7% 4.8% 2.2% 2.3% 2.6% 4.3% 4.8%
EBITA 253 621 559 821 230 680 1,109
as a % of sales 5.4% 6.4% 3.8% 3.8% 4.3% 6.0% 6.5%
Net income 137 380 277 411 100 374 698
Net income attributable to shareholders 138 380 276 415 99 371 690
Net income - shareholders per commonshare in EUR - diluted 0.15 0.41 0.30 0.45 0.11 0.40 0.75
Net income from continuing operationsas a % of shareholders’ equity 4.0% 5.7% 2.0% 2.0% 2.4% 5.3% 6.5%
Number of common shares outstanding(after deduction of treasury shares) atthe end of period (in thousands) 913,485 923,933 919,973 914,389 910,616 925,277 921,181
Shareholders’ equity per common sharein EUR 12.06 11.63 11.86 11.88 12.50 12.32 12.43
Inventories as a % of sales 1,2) 14.8% 15.9% 17.1% 15.3% 17.3% 17.0% 16.8%
Net debt : group equity ratio 15:85 18:82 19:81 17:83 26:74 28:72 28:72
Net operating capital 10,381 10,500 10,841 8,838 10,977 11,397 11,427
Total employees 114,268 112,834 115,261 113,678 115,970 114,606 114,380
of which discontinued operations 9,957 8,256 8,489 8,313 8,334 8,689 8,812
1) Sales is calculated over the preceding 12 months2) Inventories as a % of sales excludes inventories and sales related to acquisitions, divestments and discontinued operations

http://www.philips.com/investorrelations© 2015 Koninklijke Philips N.V. All rights reserved.