press briefing on household debt, with focus on student debt · pdf filepress briefing on...
TRANSCRIPT
Press Briefing on Household Debt, with Focus on Student Debt April 3, 2017
Raji Chakrabarti, Andrew Haughwout, Donghoon Lee, Joelle Scally, Wilbert van der Klaauw
The views expressed here are those of the presenters and do not necessarily represent those of the Federal Reserve Bank of New York or the Federal Reserve System.
2
Overview of Household Debt
Recent Trends in Student Loan Borrowing, Delinquency and Repayment
Relationship between Homeownership, Student Debt and Educational Attainment
Roadmap for Today’s Presentation

for internal use only
Overview of Household Debt
4
0
3
6
9
12
15Mortgage HE Revolving Auto Loan Credit Card Student Loan Other
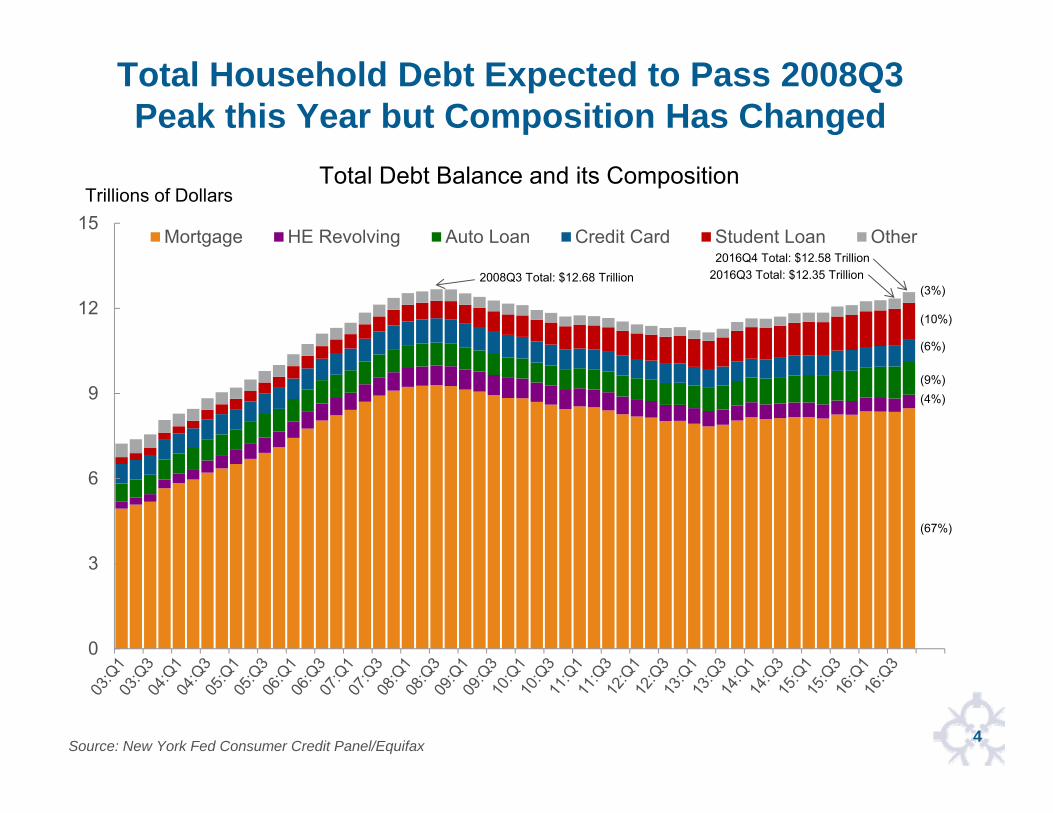
Trillions of DollarsTotal Debt Balance and its Composition
2016Q4 Total: $12.58 Trillion2016Q3 Total: $12.35 Trillion
(3%)
(10%)
(6%)
(9%)(4%)
(67%)
2008Q3 Total: $12.68 Trillion
Total Household Debt Expected to Pass 2008Q3 Peak this Year but Composition Has Changed
Source: New York Fed Consumer Credit Panel/Equifax
5
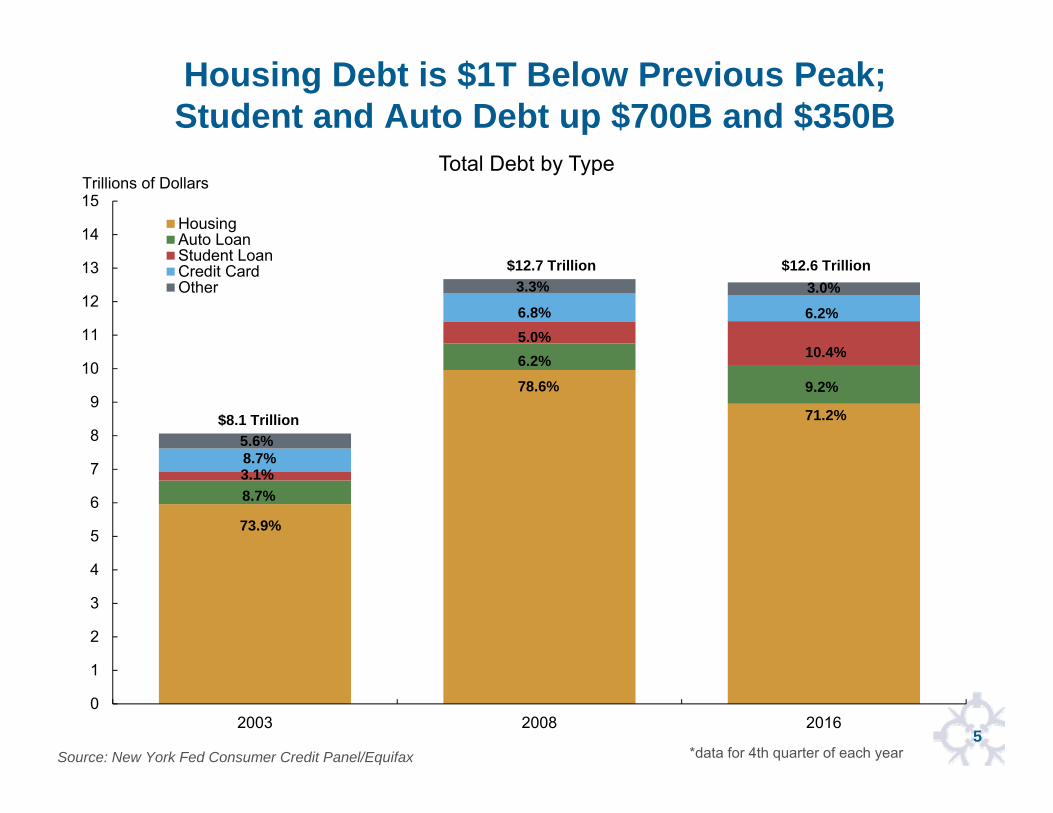
Housing Debt is $1T Below Previous Peak; Student and Auto Debt up $700B and $350B
Source: New York Fed Consumer Credit Panel/Equifax
0
1
2
3
4
5
6
7
8
9
10
11
12
13
14
15
2003 2008 2016
Total Debt by Type
HousingAuto LoanStudent LoanCredit CardOther
Trillions of Dollars
73.9%
8.7%3.1%8.7%
78.6%
6.2%5.0%6.8%
71.2%
9.2%
10.4%
6.2%
$8.1 Trillion
$12.7 Trillion $12.6 Trillion
5.6%
3.3% 3.0%
*data for 4th quarter of each year
6
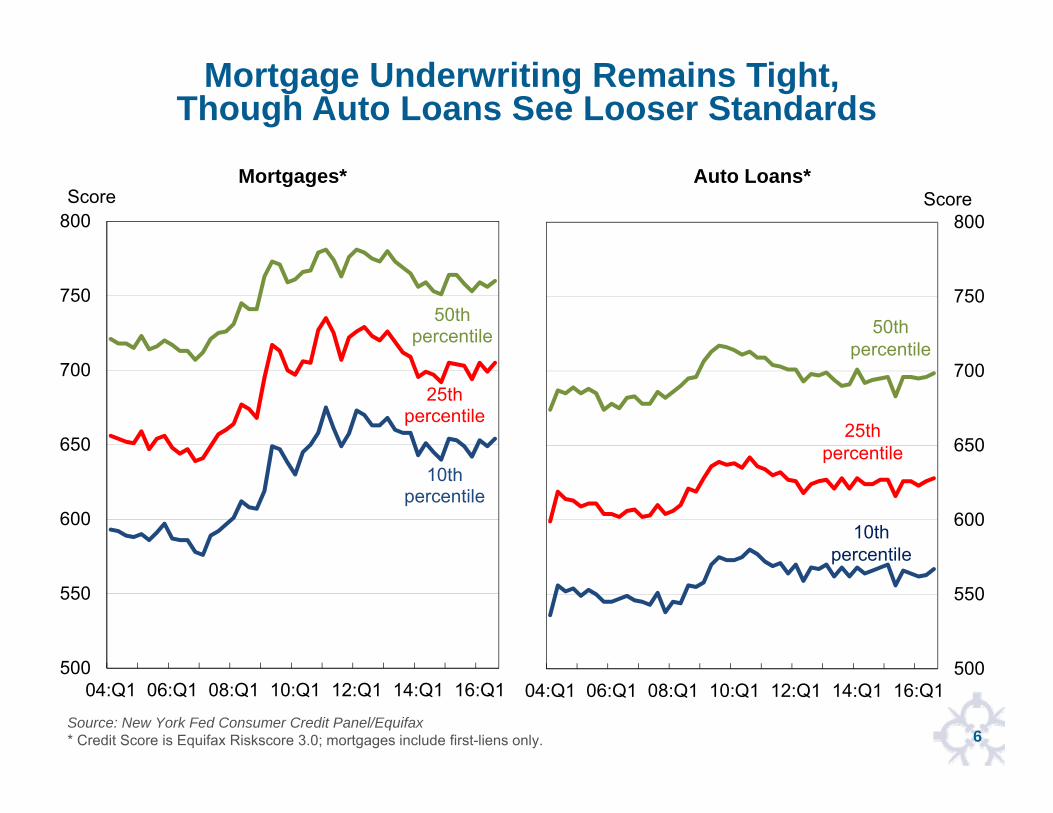
Mortgage Underwriting Remains Tight, Though Auto Loans See Looser Standards
50th percentile
25th percentile
10th percentile
500
550
600
650
700
750
800
04:Q1 06:Q1 08:Q1 10:Q1 12:Q1 14:Q1 16:Q1
Mortgages*Score
500
550
600
650
700
750
800
04:Q1 06:Q1 08:Q1 10:Q1 12:Q1 14:Q1 16:Q1
Auto Loans*Score
50thpercentile
25thpercentile
10thpercentile
Source: New York Fed Consumer Credit Panel/Equifax* Credit Score is Equifax Riskscore 3.0; mortgages include first-liens only.
7
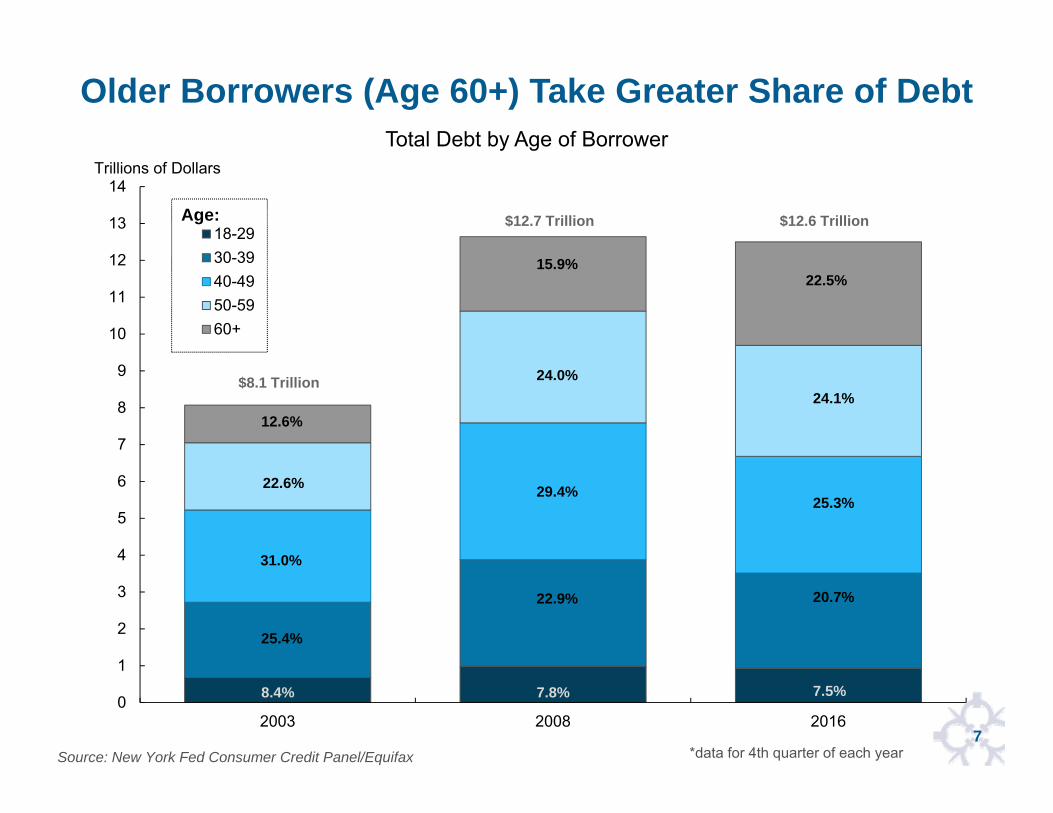
Older Borrowers (Age 60+) Take Greater Share of Debt
Source: New York Fed Consumer Credit Panel/Equifax
0
1
2
3
4
5
6
7
8
9
10
11
12
13
14
2003 2008 2016
Total Debt by Age of Borrower
18-2930-3940-4950-5960+
Trillions of Dollars
Age:
$8.1 Trillion
$12.7 Trillion $12.6 Trillion
22.6%
31.0%
25.4%
8.4%
12.6%
24.0%
29.4%
22.9%
7.8%
24.1%
25.3%
20.7%
7.5%
15.9%22.5%
*data for 4th quarter of each year
8
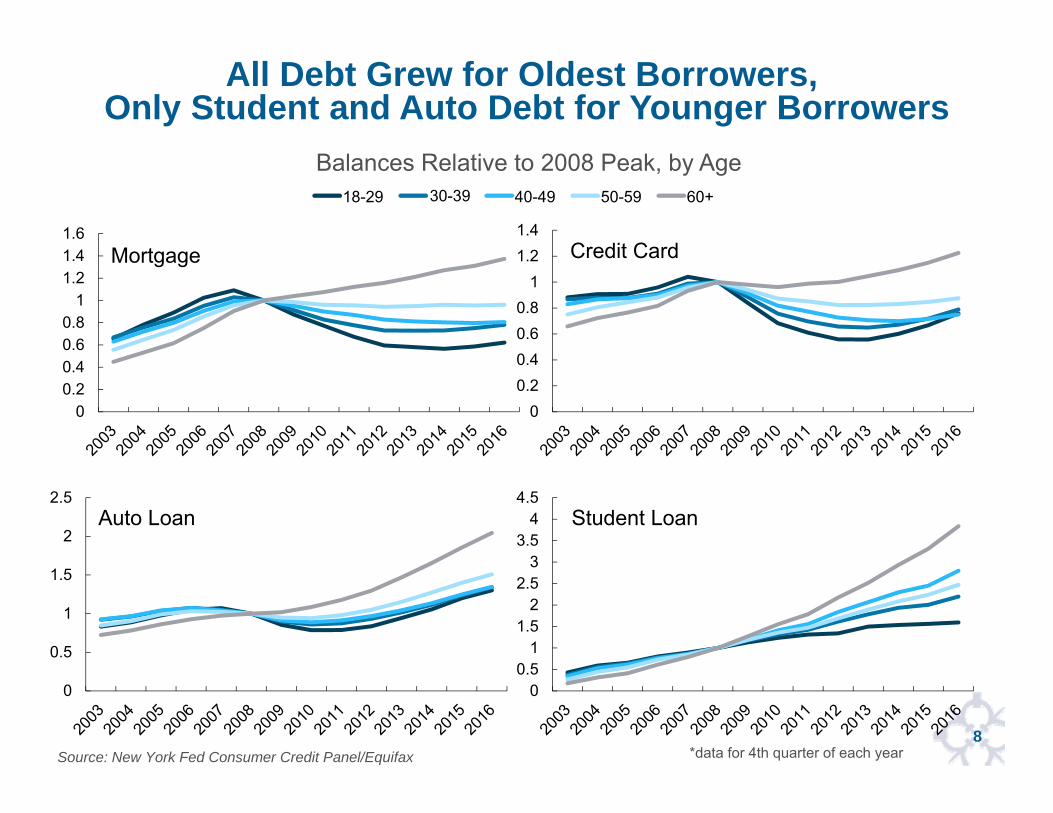
All Debt Grew for Oldest Borrowers, Only Student and Auto Debt for Younger Borrowers
Source: New York Fed Consumer Credit Panel/Equifax
00.20.40.60.8
11.21.41.6
Mortgage
00.20.40.60.8
11.21.4
Credit Card
0
0.5
1
1.5
2
2.5Auto Loan
00.5
11.5
22.5
33.5
44.5
Student Loan
Balances Relative to 2008 Peak, by Age18-29 40-49 50-59 60+30-39
*data for 4th quarter of each year
9
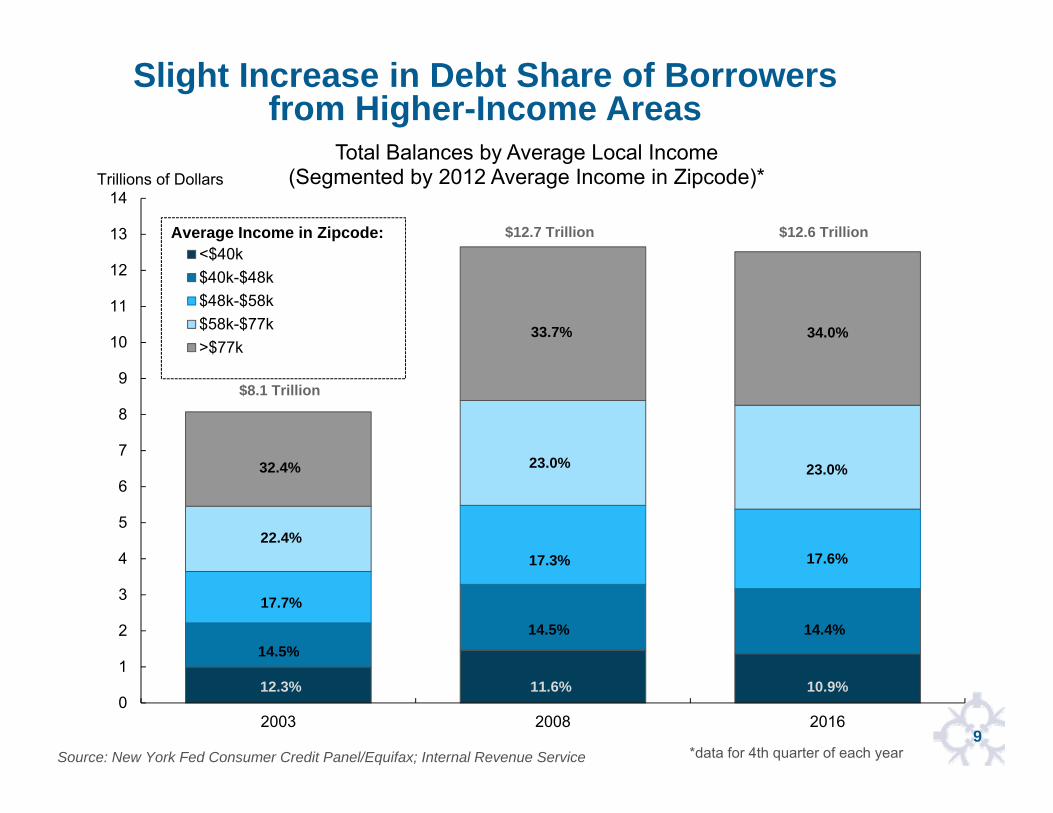
Slight Increase in Debt Share of Borrowers from Higher-Income Areas
Source: New York Fed Consumer Credit Panel/Equifax; Internal Revenue Service
0
1
2
3
4
5
6
7
8
9
10
11
12
13
14
2003 2008 2016
Total Balances by Average Local Income (Segmented by 2012 Average Income in Zipcode)*
<$40k$40k-$48k$48k-$58k$58k-$77k>$77k
Trillions of Dollars
Average Income in Zipcode:
22.4%
17.7%
14.5%
12.3%
32.4%
33.7%
23.0%
17.3%
14.5%
11.6%
34.0%
23.0%
17.6%
14.4%
10.9%
$8.1 Trillion
$12.7 Trillion $12.6 Trillion
*data for 4th quarter of each year
10
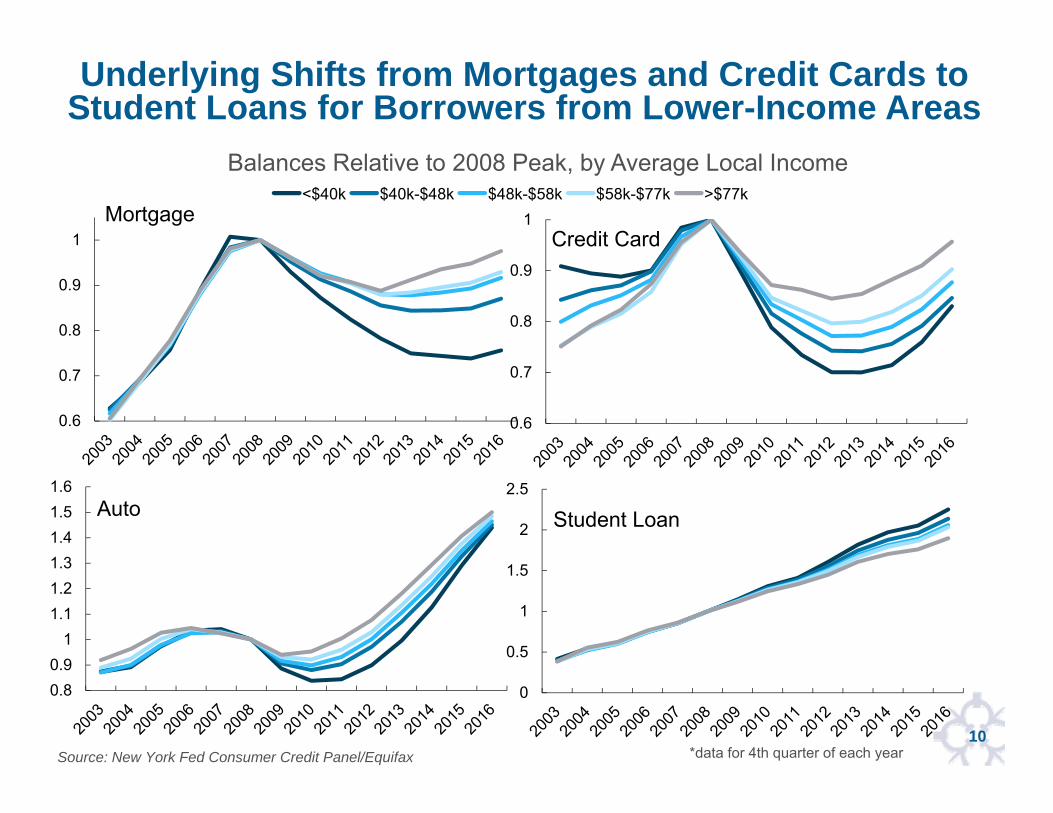
Underlying Shifts from Mortgages and Credit Cards toStudent Loans for Borrowers from Lower-Income Areas
Source: New York Fed Consumer Credit Panel/Equifax
0.6
0.7
0.8
0.9
1Mortgage
0.6
0.7
0.8
0.9
1Credit Card
0.80.9
11.11.21.31.41.51.6
Auto
0
0.5
1
1.5
2
2.5
Student Loan
<$40k $40k-$48k $48k-$58k $58k-$77k >$77k
Balances Relative to 2008 Peak, by Average Local Income
*data for 4th quarter of each year
11
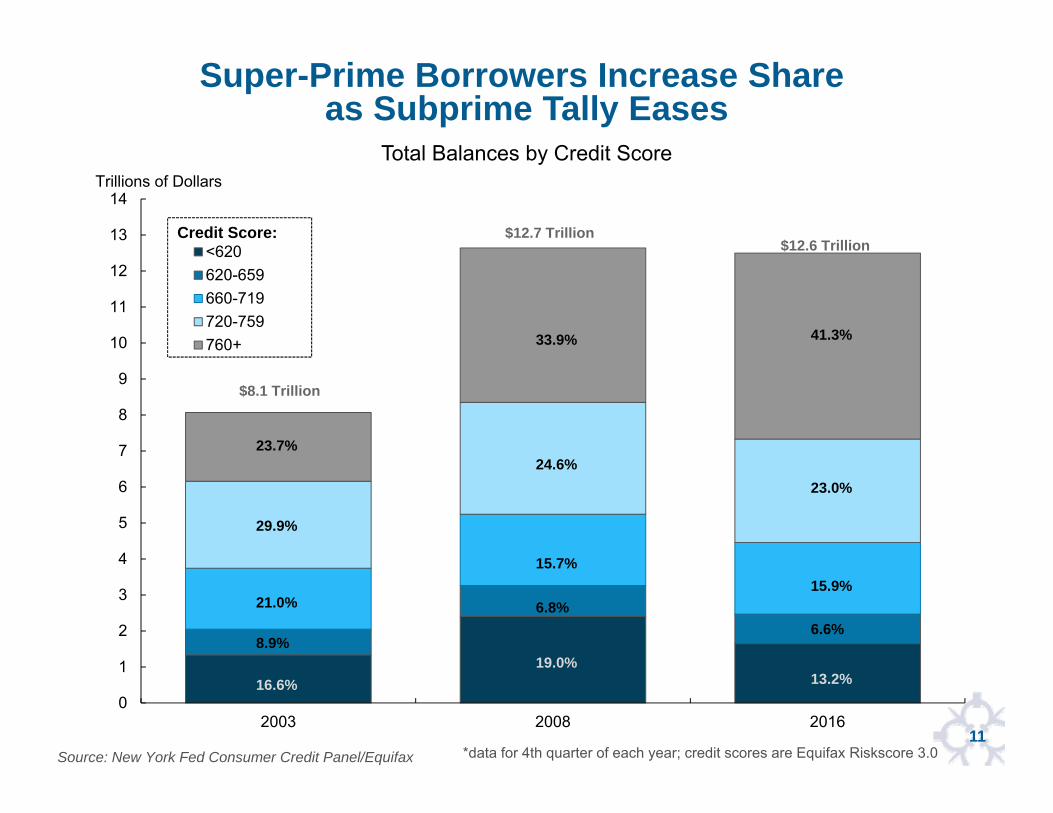
Super-Prime Borrowers Increase Share as Subprime Tally Eases
Source: New York Fed Consumer Credit Panel/Equifax
0
1
2
3
4
5
6
7
8
9
10
11
12
13
14
2003 2008 2016
Total Balances by Credit Score
<620620-659660-719720-759760+
Credit Score:
23.7%
29.9%
21.0%
8.9%
16.6%
33.9%
24.6%
15.7%
6.8%
19.0%
41.3%
23.0%
15.9%
6.6%
13.2%
$12.6 Trillion
Trillions of Dollars
$8.1 Trillion
$12.7 Trillion
*data for 4th quarter of each year; credit scores are Equifax Riskscore 3.0
12
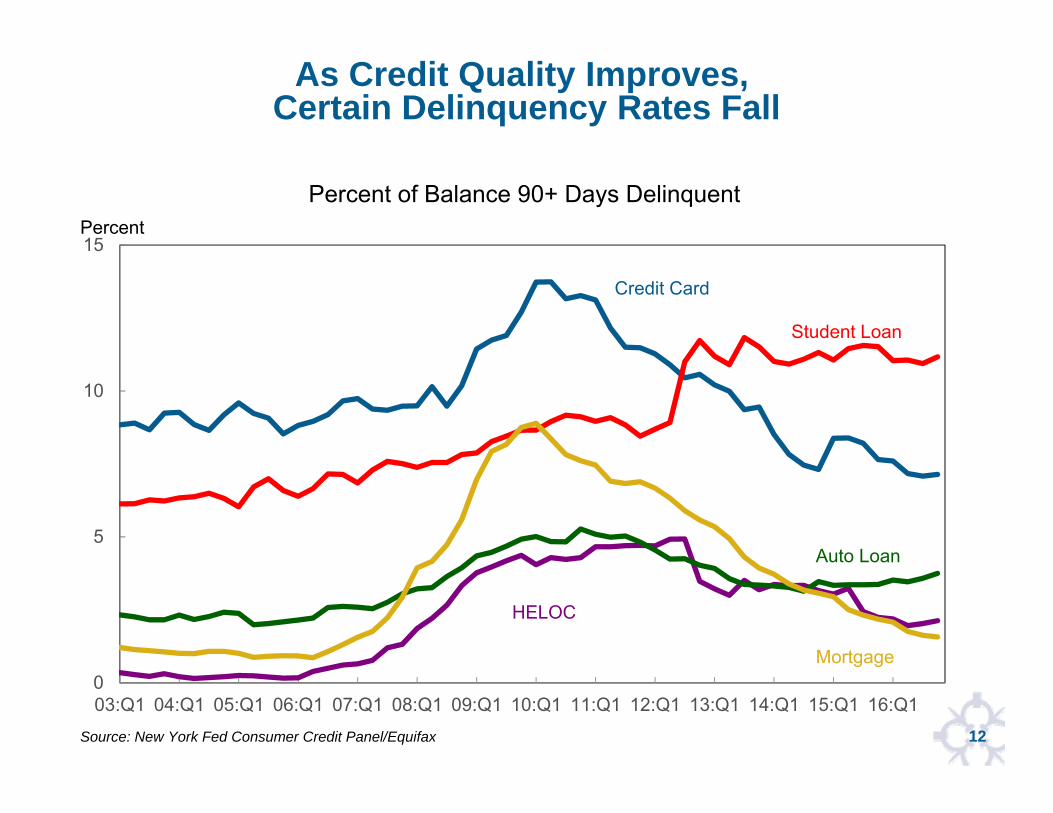
As Credit Quality Improves, Certain Delinquency Rates Fall
0
5
10
15
03:Q1 04:Q1 05:Q1 06:Q1 07:Q1 08:Q1 09:Q1 10:Q1 11:Q1 12:Q1 13:Q1 14:Q1 15:Q1 16:Q1
Credit Card
Mortgage
Auto Loan
HELOC
Percent of Balance 90+ Days DelinquentPercent
Source: New York Fed Consumer Credit Panel/Equifax
Student Loan
13
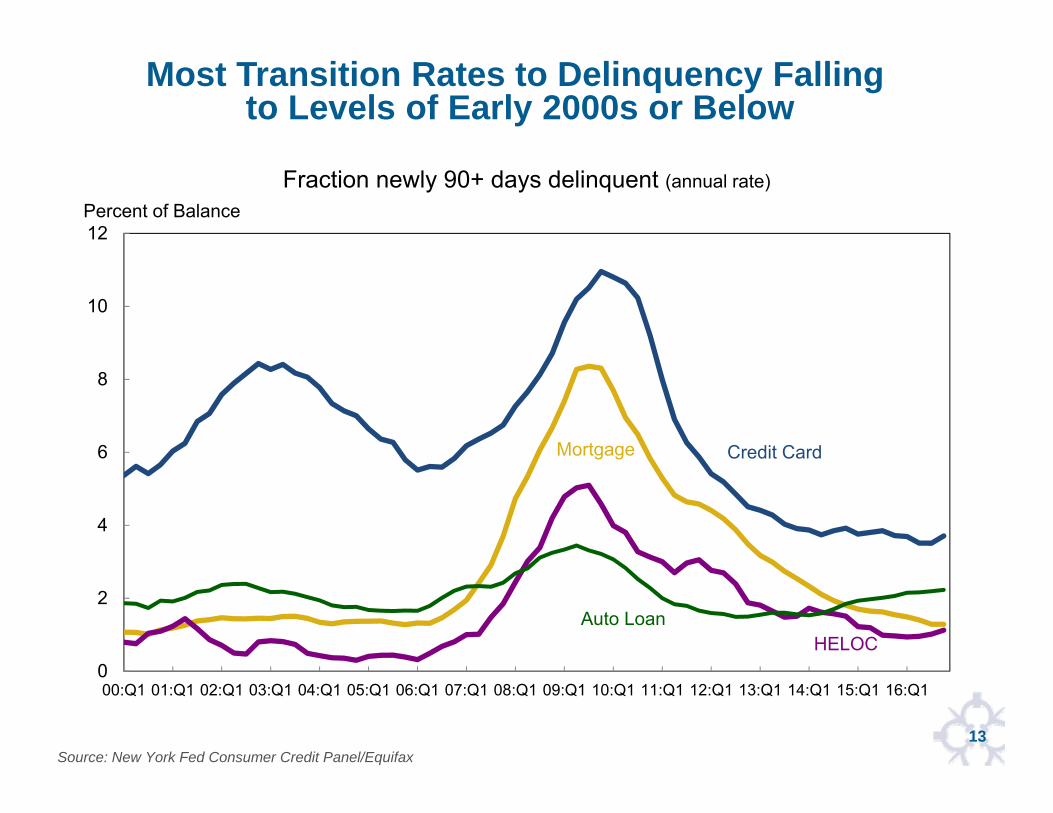
Most Transition Rates to Delinquency Falling to Levels of Early 2000s or Below
Source: New York Fed Consumer Credit Panel/Equifax
0
2
4
6
8
10
12
00:Q1 01:Q1 02:Q1 03:Q1 04:Q1 05:Q1 06:Q1 07:Q1 08:Q1 09:Q1 10:Q1 11:Q1 12:Q1 13:Q1 14:Q1 15:Q1 16:Q1
Credit CardMortgage
Auto Loan
Fraction newly 90+ days delinquent (annual rate)Percent of Balance
HELOC
14
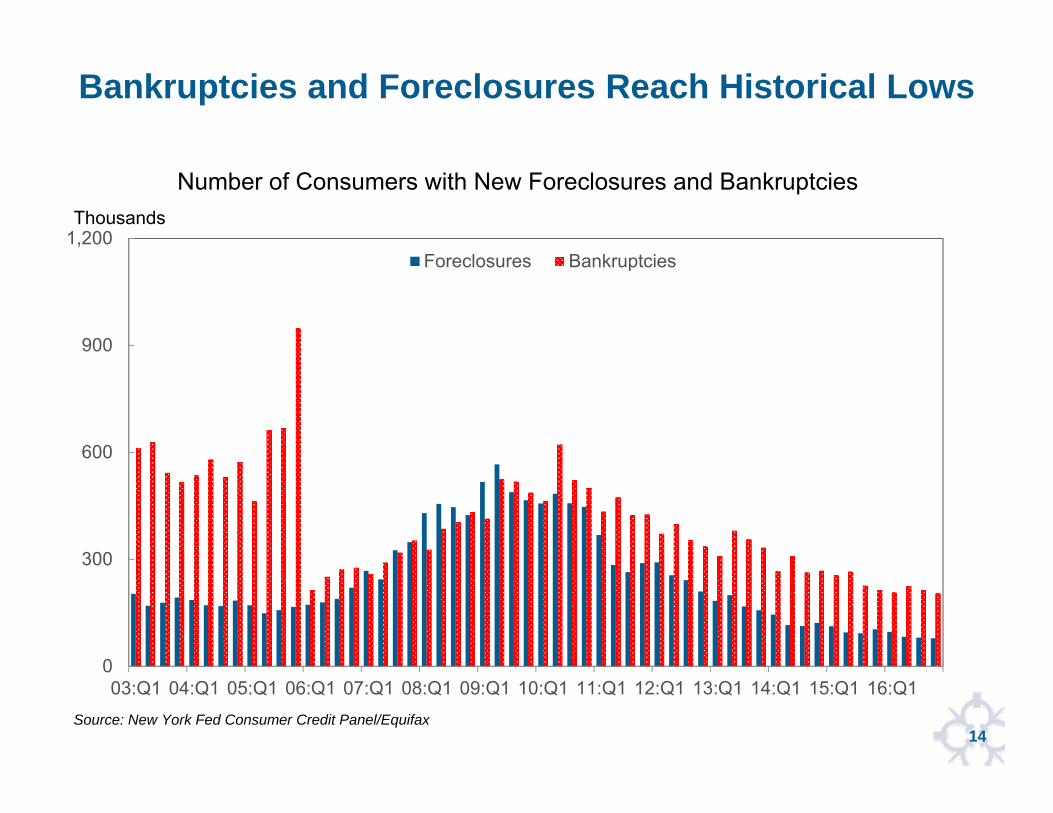
Bankruptcies and Foreclosures Reach Historical Lows
0
300
600
900
1,200
03:Q1 04:Q1 05:Q1 06:Q1 07:Q1 08:Q1 09:Q1 10:Q1 11:Q1 12:Q1 13:Q1 14:Q1 15:Q1 16:Q1
Foreclosures Bankruptcies
Thousands
Number of Consumers with New Foreclosures and Bankruptcies
Source: New York Fed Consumer Credit Panel/Equifax
15
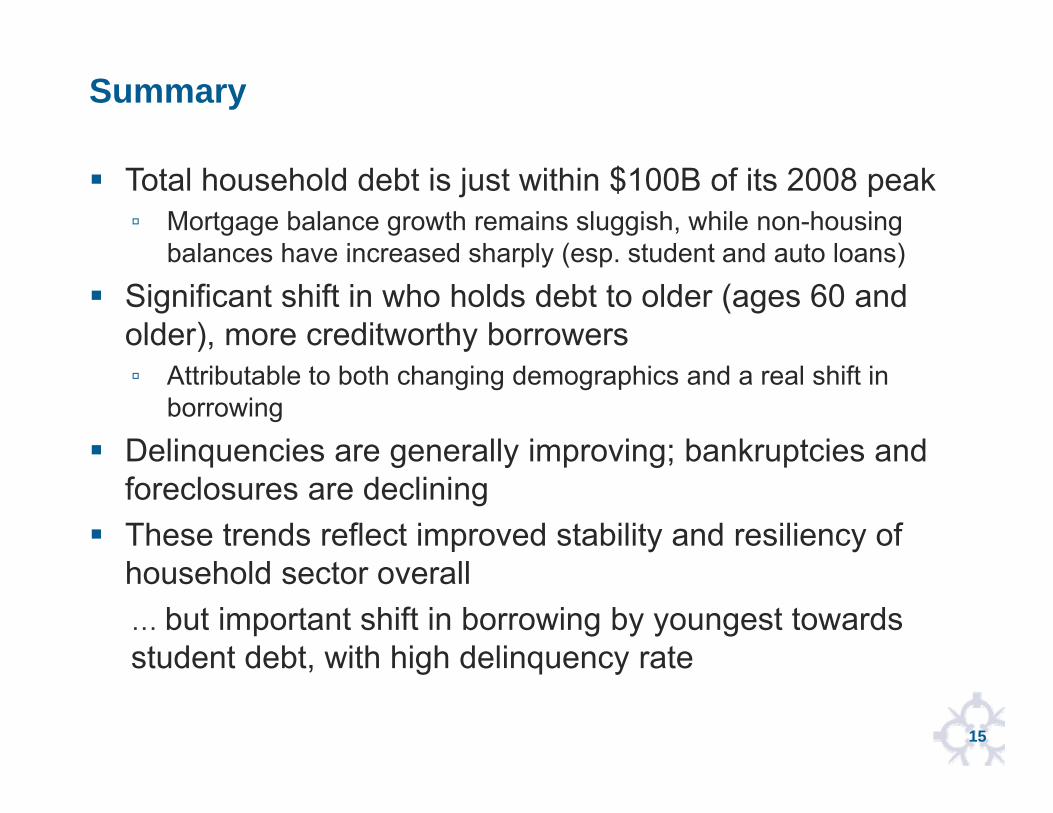
Total household debt is just within $100B of its 2008 peak▫ Mortgage balance growth remains sluggish, while non-housing
balances have increased sharply (esp. student and auto loans)
Significant shift in who holds debt to older (ages 60 and older), more creditworthy borrowers▫ Attributable to both changing demographics and a real shift in
borrowing
Delinquencies are generally improving; bankruptcies and foreclosures are declining
These trends reflect improved stability and resiliency of household sector overall… but important shift in borrowing by youngest towards student debt, with high delinquency rate
Summary
for internal use only
Recent Trends in Student Loan Borrowing,Delinquency and Repayment
17
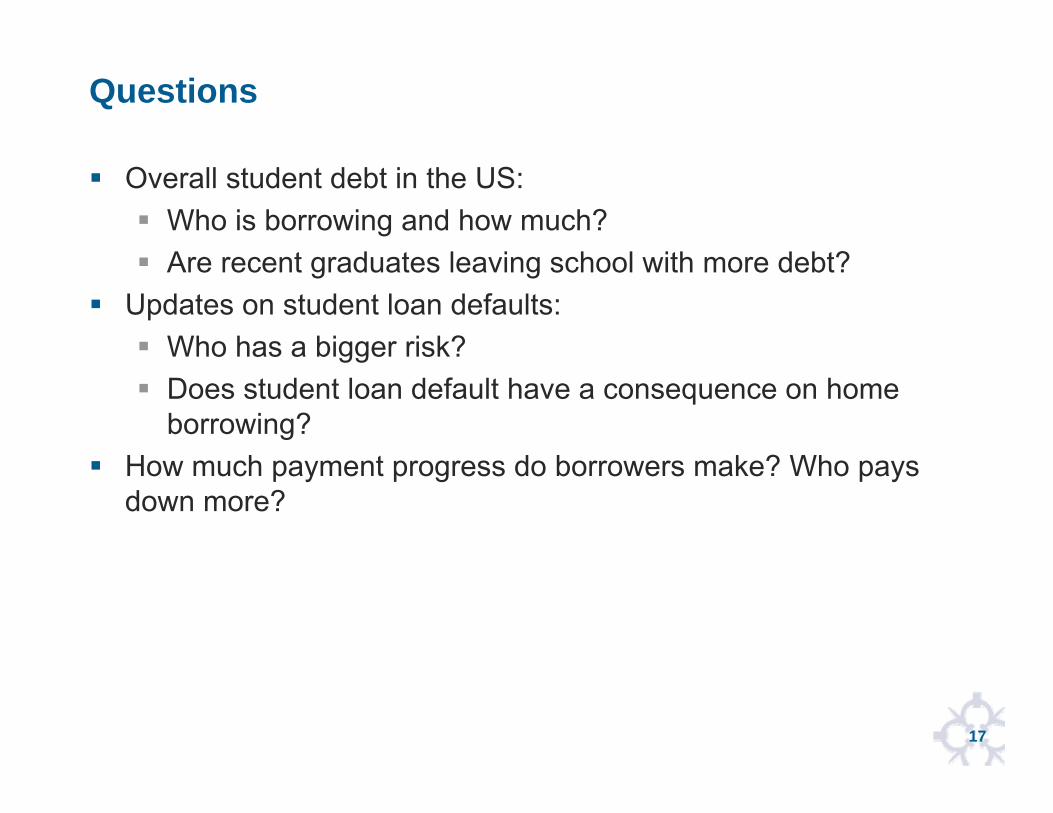
Questions
Overall student debt in the US: Who is borrowing and how much? Are recent graduates leaving school with more debt?
Updates on student loan defaults: Who has a bigger risk? Does student loan default have a consequence on home
borrowing? How much payment progress do borrowers make? Who pays
down more?

for internal use only
Student Loan Balances
19
0
200
400
600
800
1,000
1,200
1,400
2004 2005 2006 2007 2008 2009 2010 2011 2012 2013 2014 2015 2016
Total student debt by age group
up to 2930 to 3940 to 4950 to 5960+
Billions of Dollars
Age:
Source: New York Fed Consumer Credit Panel/Equifax
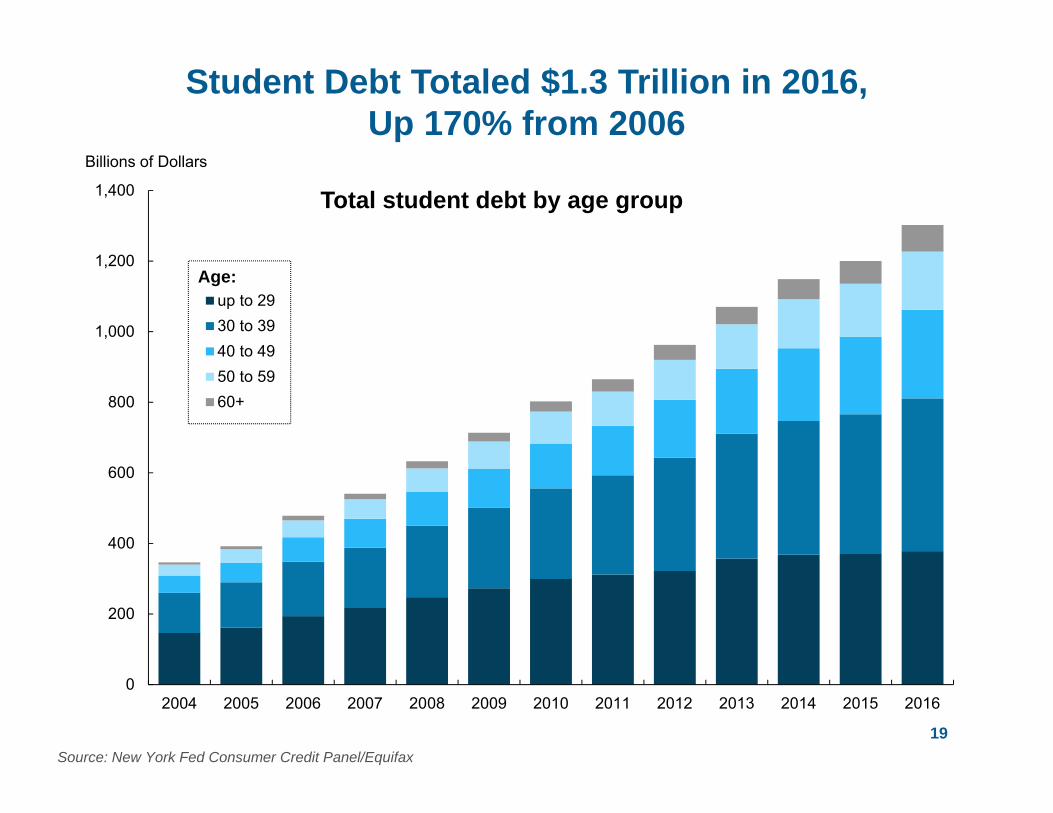
Student Debt Totaled $1.3 Trillion in 2016, Up 170% from 2006
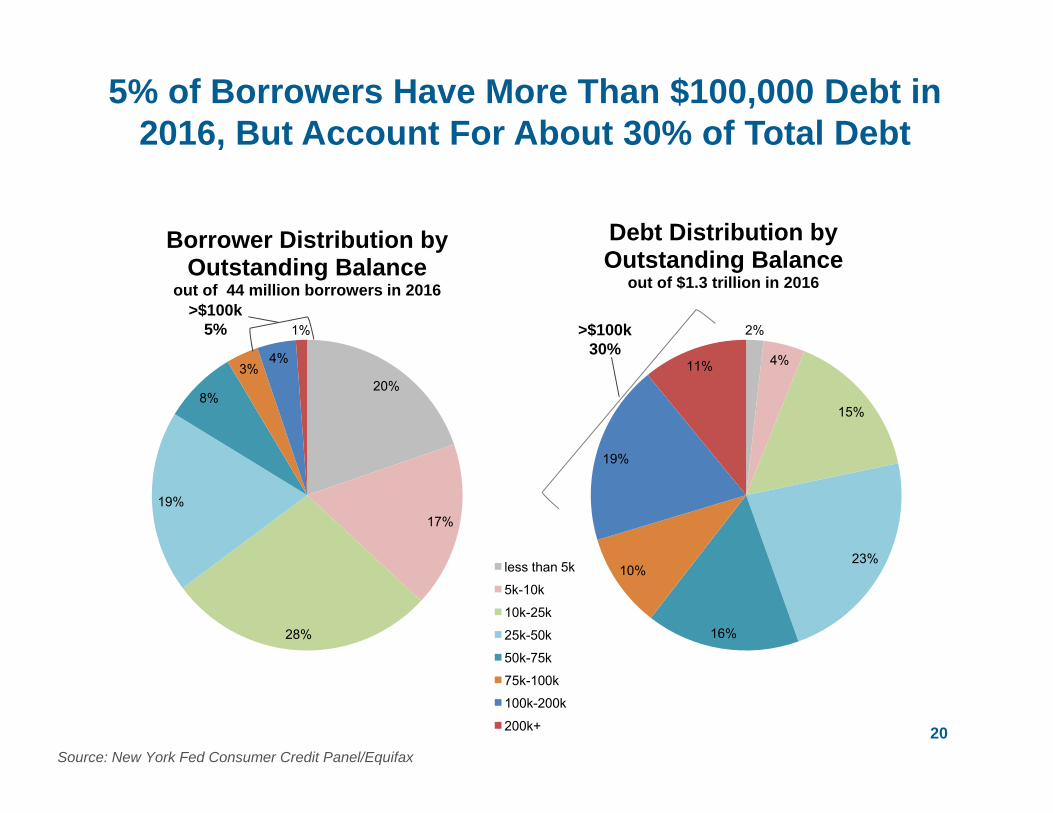
5% of Borrowers Have More Than $100,000 Debt in 2016, But Account For About 30% of Total Debt
20Source: New York Fed Consumer Credit Panel/Equifax
20%
17%
28%
19%
8%
3%4%
1%
Borrower Distribution by Outstanding Balance
out of 44 million borrowers in 2016>$100k
5% 2%
4%
15%
23%
16%
10%
19%
11%
Debt Distribution by Outstanding Balance
out of $1.3 trillion in 2016
>$100k30%
less than 5k
5k-10k
10k-25k
25k-50k
50k-75k
75k-100k
100k-200k
200k+
21
$0
$5,000
$10,000
$15,000
$20,000
$25,000
$30,000
$35,000
$40,000
0
1
2
3
4
5
2005 2006 2007 2008 2009 2010 2011 2012 2013 2014 2015
Borrower Cohorts and Balances at School Leaving
borrowers school-leaving balance
Millions of Borrowers Balance
Source: New York Fed Consumer Credit Panel/Equifax
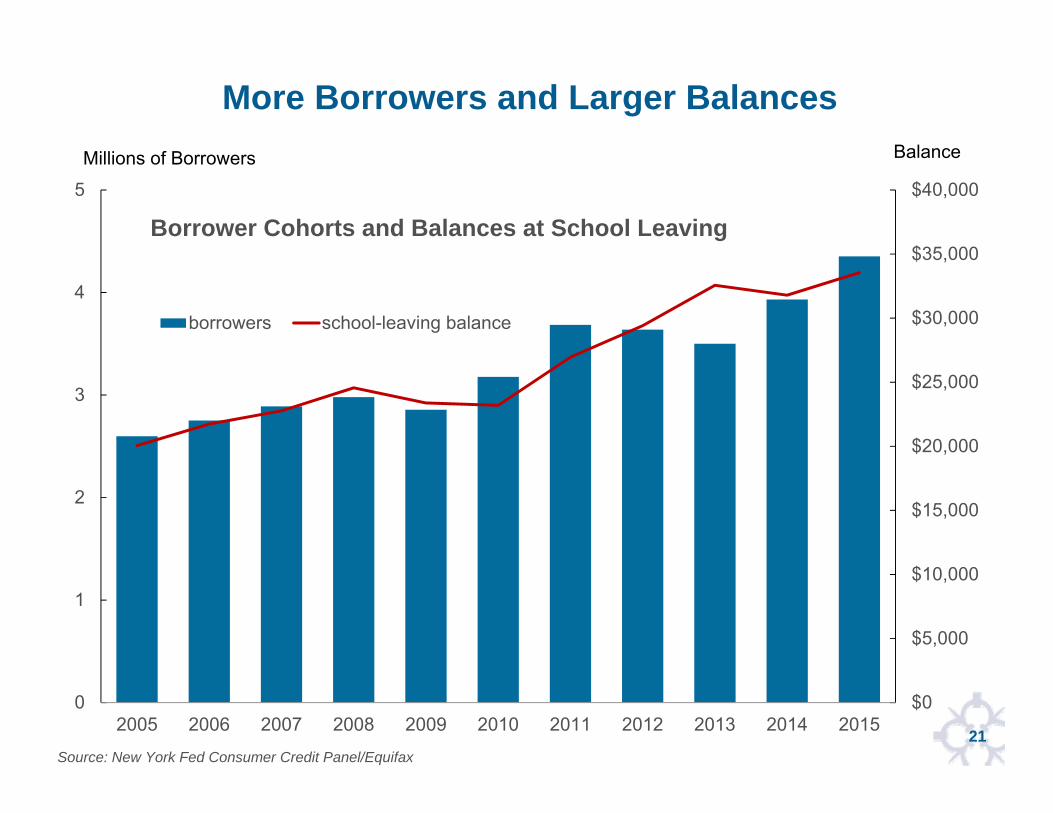
More Borrowers and Larger Balances
22
Student Debt Overview
Student debt was $1.3 trillion at the end of 2016, an increase of about 170% from 2006.
Aggregate student debt is increasing because: More students are taking out loans Loans are for larger amounts Repayment rates have slowed down
About 5% of the borrowers have more than $100,000 debt in 2016, but they account for about 30% of the total debt.
Recent graduates with student loans leave school with about $34,000, up nearly 70% from 10 years ago.

for internal use only
Student Loan Defaults
24
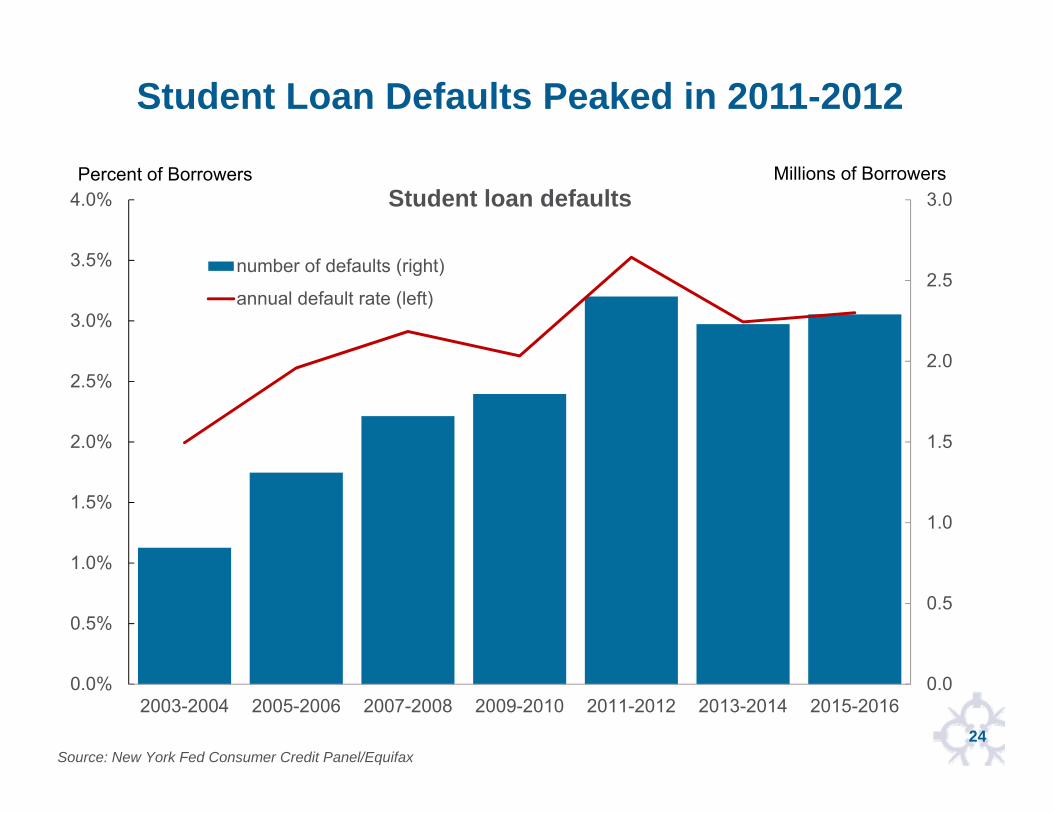
Student Loan Defaults Peaked in 2011-2012
Source: New York Fed Consumer Credit Panel/Equifax
0.0
0.5
1.0
1.5
2.0
2.5
3.0
0.0%
0.5%
1.0%
1.5%
2.0%
2.5%
3.0%
3.5%
4.0%
2003-2004 2005-2006 2007-2008 2009-2010 2011-2012 2013-2014 2015-2016
Student loan defaults
number of defaults (right)
annual default rate (left)
Millions of BorrowersPercent of Borrowers
25
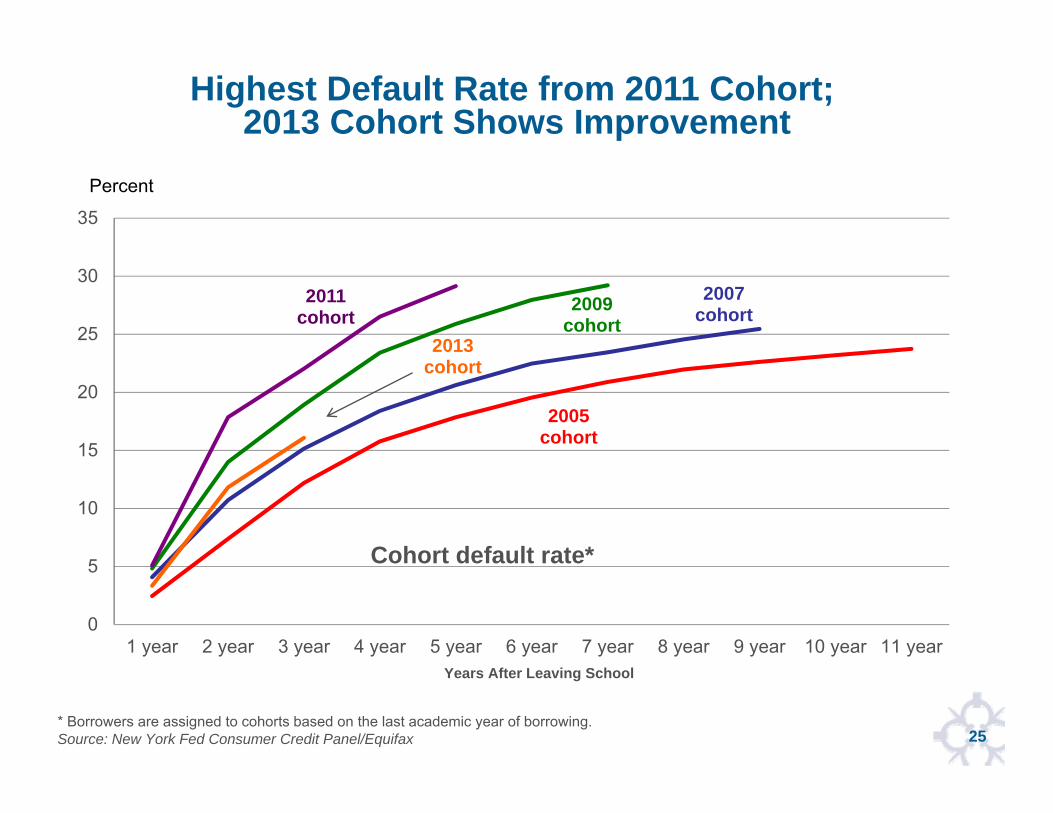
Highest Default Rate from 2011 Cohort; 2013 Cohort Shows Improvement
* Borrowers are assigned to cohorts based on the last academic year of borrowing. Source: New York Fed Consumer Credit Panel/Equifax
2005cohort
2007cohort2009
cohort2011
cohort2013
cohort
0
5
10
15
20
25
30
35
1 year 2 year 3 year 4 year 5 year 6 year 7 year 8 year 9 year 10 year 11 year
Cohort default rate*
Percent
Years After Leaving School
26
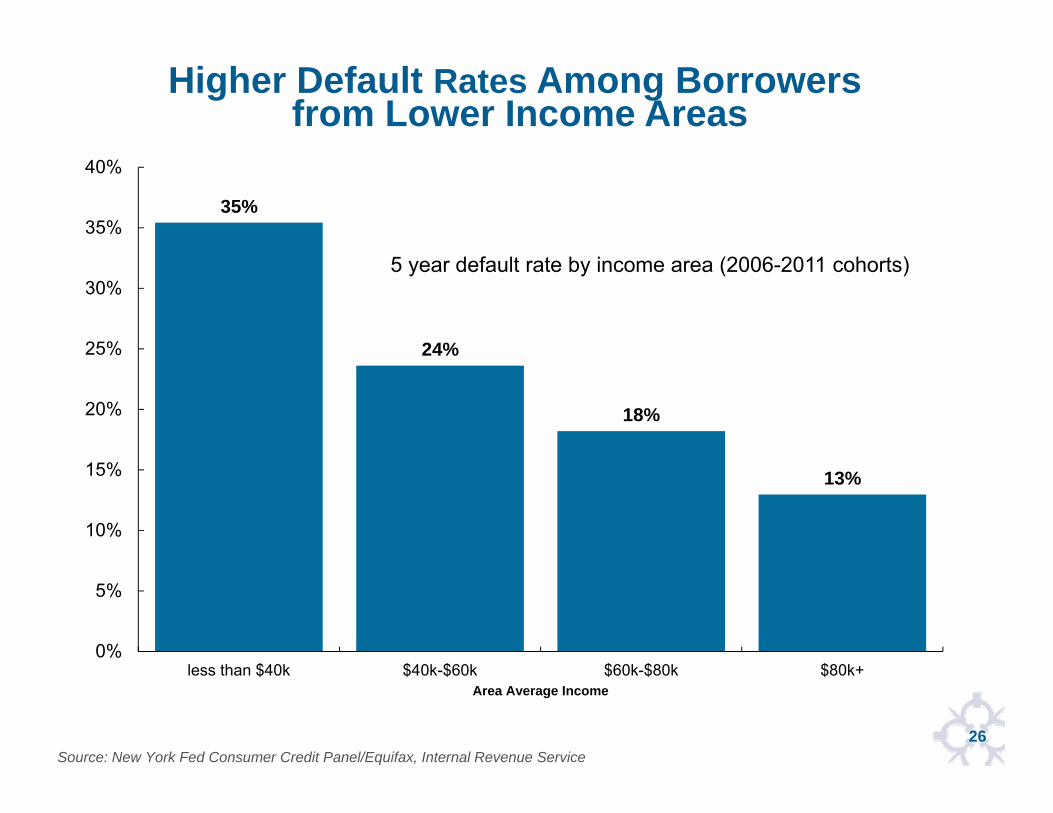
Higher Default Rates Among Borrowers from Lower Income Areas
Source: New York Fed Consumer Credit Panel/Equifax, Internal Revenue Service
35%
24%
18%
13%
0%
5%
10%
15%
20%
25%
30%
35%
40%
less than $40k $40k-$60k $60k-$80k $80k+Area Average Income
5 year default rate by income area (2006-2011 cohorts)
27
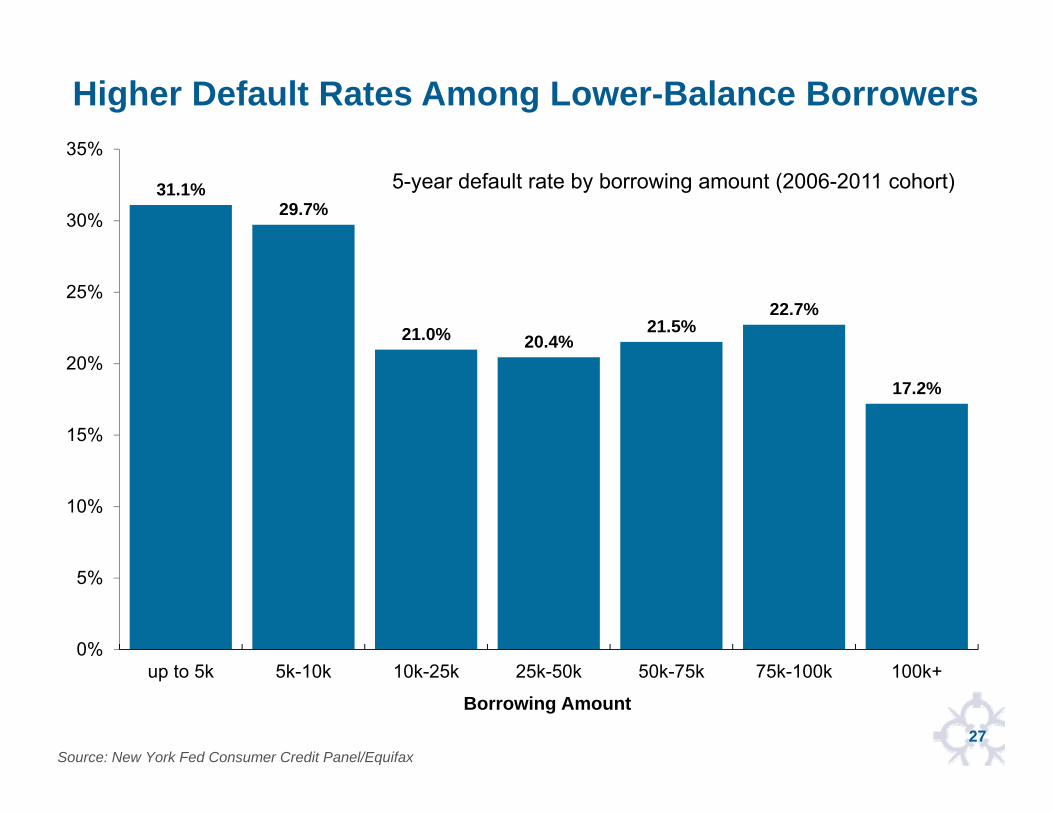
Higher Default Rates Among Lower-Balance Borrowers
Source: New York Fed Consumer Credit Panel/Equifax
31.1%29.7%
21.0% 20.4%21.5%
22.7%
17.2%
0%
5%
10%
15%
20%
25%
30%
35%
up to 5k 5k-10k 10k-25k 25k-50k 50k-75k 75k-100k 100k+
Borrowing Amount
5-year default rate by borrowing amount (2006-2011 cohort)
28
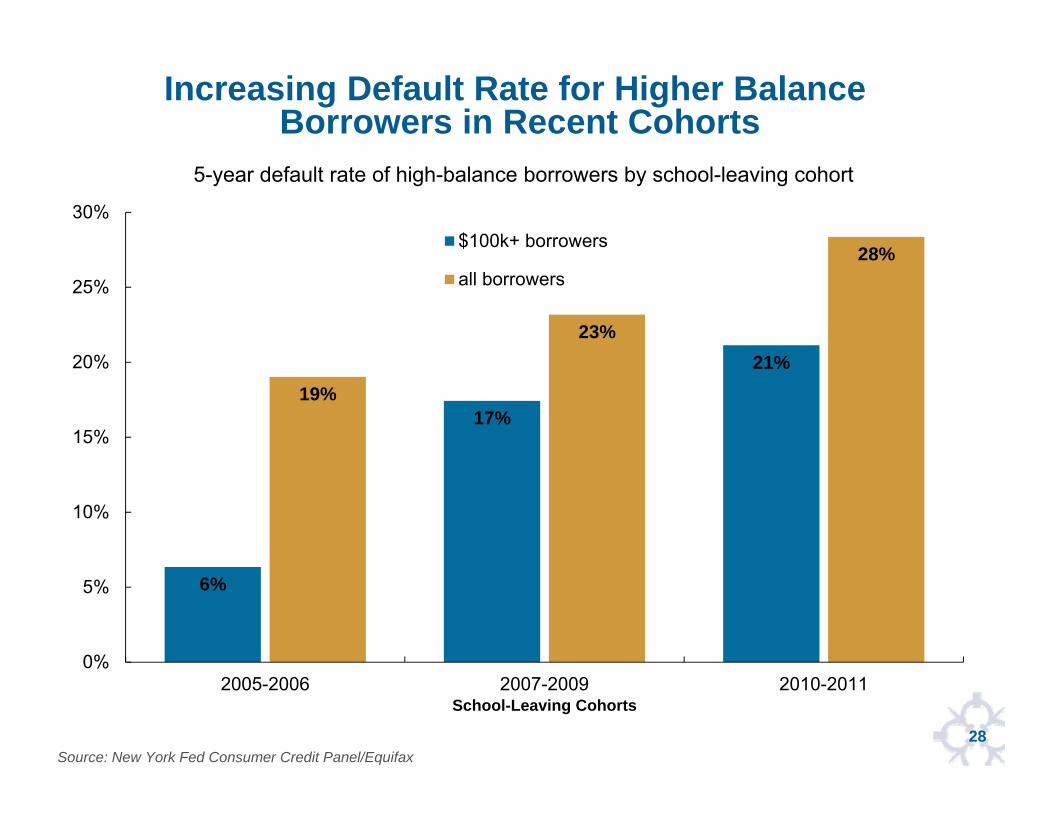
Increasing Default Rate for Higher Balance Borrowers in Recent Cohorts
Source: New York Fed Consumer Credit Panel/Equifax
6%
17%
21%19%
23%
28%
0%
5%
10%
15%
20%
25%
30%
2005-2006 2007-2009 2010-2011School-Leaving Cohorts
5-year default rate of high-balance borrowers by school-leaving cohort
$100k+ borrowers
all borrowers
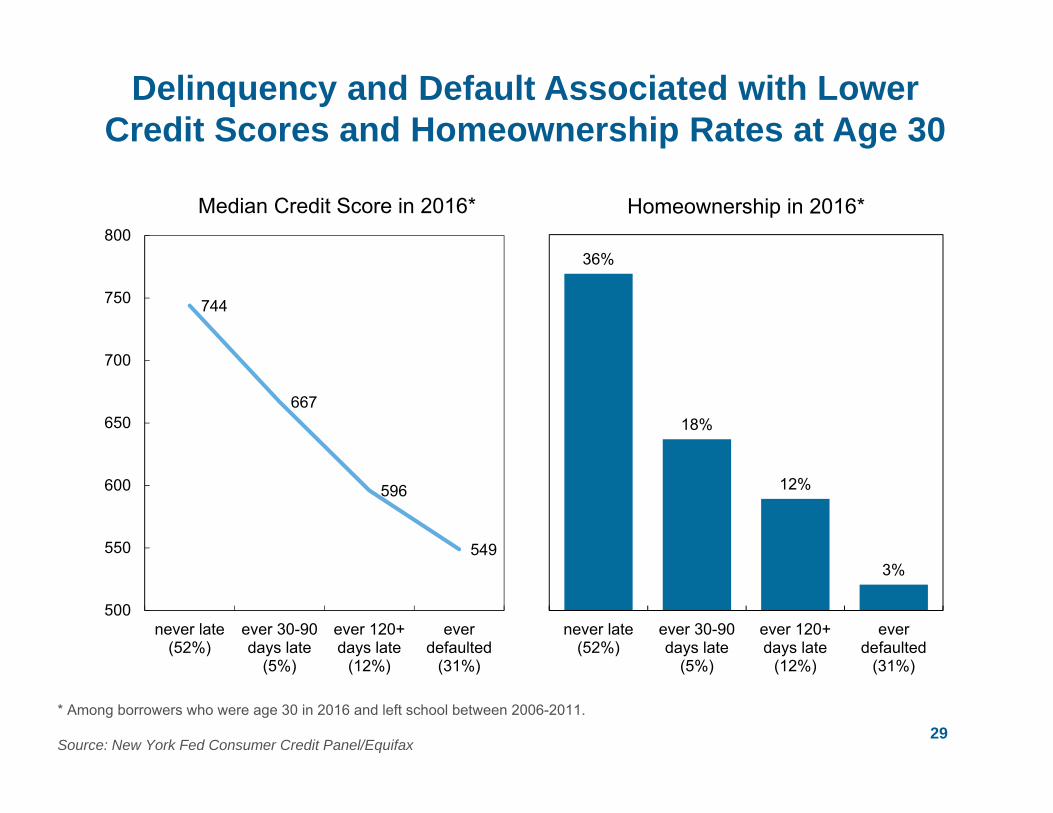
Delinquency and Default Associated with Lower Credit Scores and Homeownership Rates at Age 30
29
744
667
596
549
500
550
600
650
700
750
800
never late(52%)
ever 30-90days late
(5%)
ever 120+days late
(12%)
everdefaulted
(31%)
Median Credit Score in 2016*
36%
18%
12%
3%
never late(52%)
ever 30-90days late
(5%)
ever 120+days late
(12%)
everdefaulted
(31%)
Homeownership in 2016*
* Among borrowers who were age 30 in 2016 and left school between 2006-2011.
Source: New York Fed Consumer Credit Panel/Equifax
30
Student Debt Defaults
Student loan default rates increased until 2012 and have stabilized since 2013.
About 30% of the borrowers have defaulted among 2009-2011 graduates, but more recent cohorts have performed better so far.
Those with higher student debt are now much more likely to default than in the past.
Borrowers from lower income areas default more.
for internal use only
Student Loan Repayment Success
32
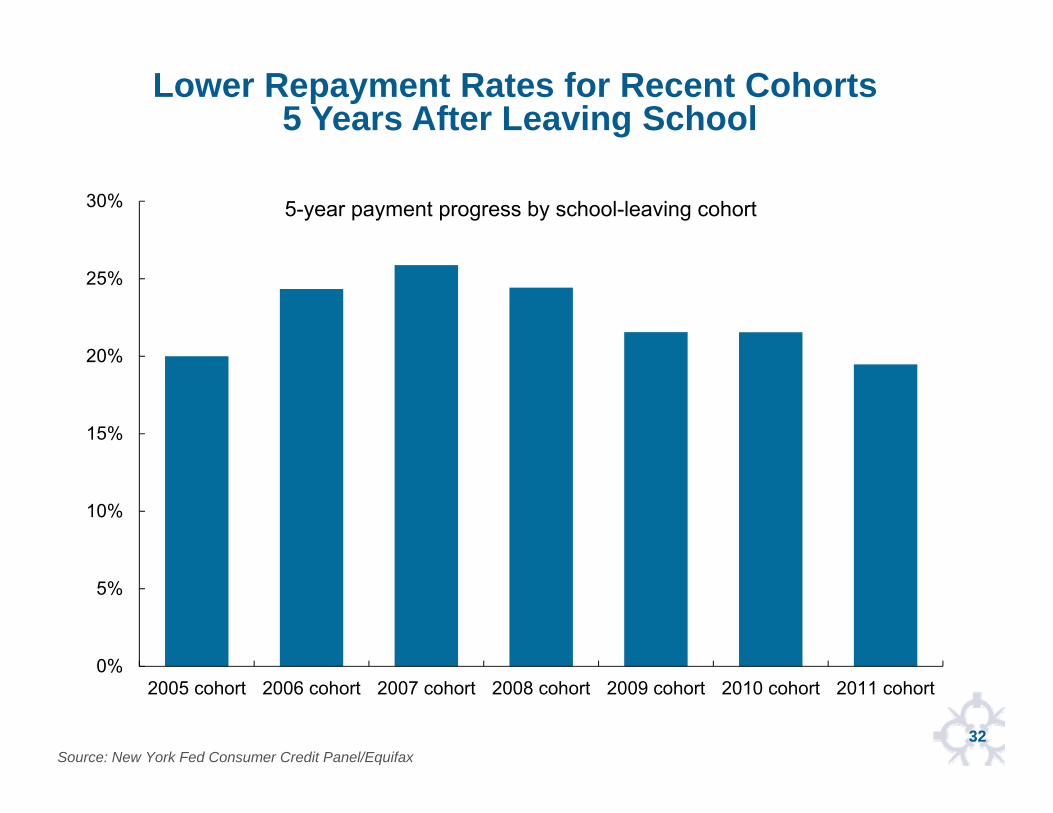
Lower Repayment Rates for Recent Cohorts 5 Years After Leaving School
Source: New York Fed Consumer Credit Panel/Equifax
0%
5%
10%
15%
20%
25%
30%
2005 cohort 2006 cohort 2007 cohort 2008 cohort 2009 cohort 2010 cohort 2011 cohort
5-year payment progress by school-leaving cohort
33
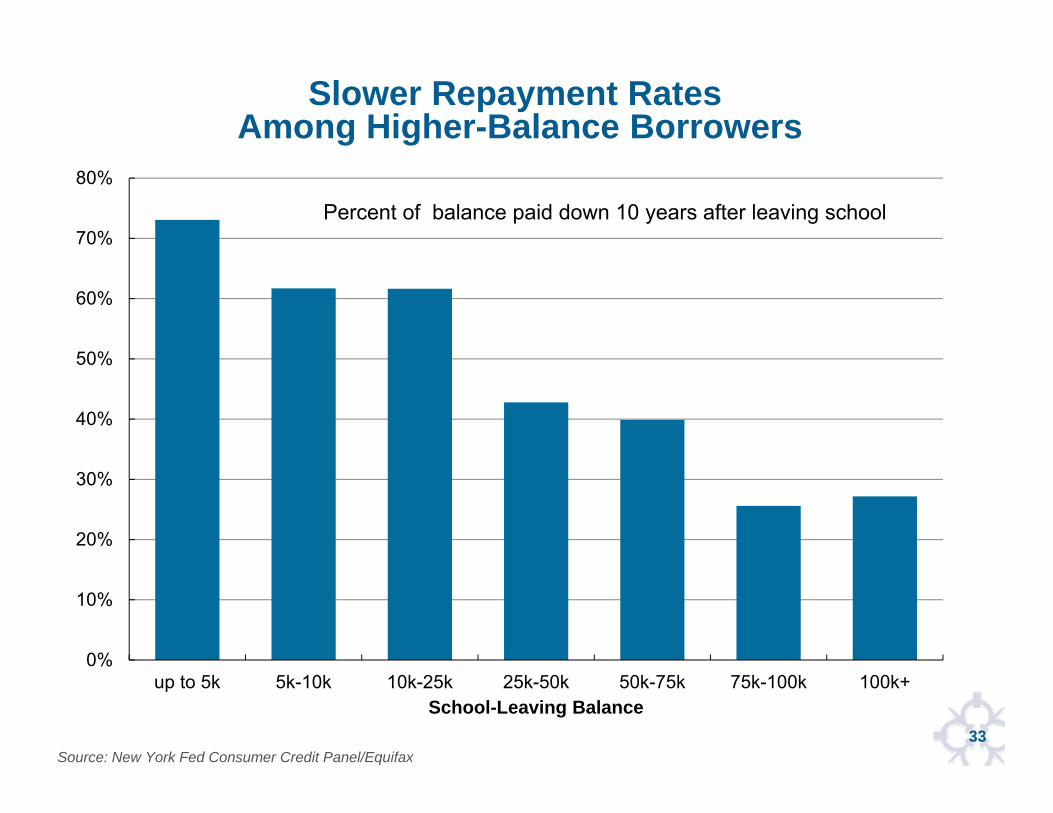
Slower Repayment Rates Among Higher-Balance Borrowers
Source: New York Fed Consumer Credit Panel/Equifax
0%
10%
20%
30%
40%
50%
60%
70%
80%
up to 5k 5k-10k 10k-25k 25k-50k 50k-75k 75k-100k 100k+School-Leaving Balance
Percent of balance paid down 10 years after leaving school
34
Payment progress
Payment progress is slower among those who borrowed more. Payment progress is slower for more recent graduates due to
higher borrowing amounts and higher default rates. Participation in new accommodative payment plans such as Income Based Repayment might account for the slow progress as well.
High rates of student loan defaults and delinquencies are associated with slower payment progress as well.
35
Summary
Three factors pushing up aggregate student loan balances are higher borrowing amounts, increasing participation among students, and slower repayment.
Defaults peaked among those who left school in 2011 and appear to have improved for later cohorts, but the longer-term performance remains to be seen.
Payment progress continues to decline due to higher burden of student debt.
for internal use only
Homeownership, Student Debt and Educational Attainment
37
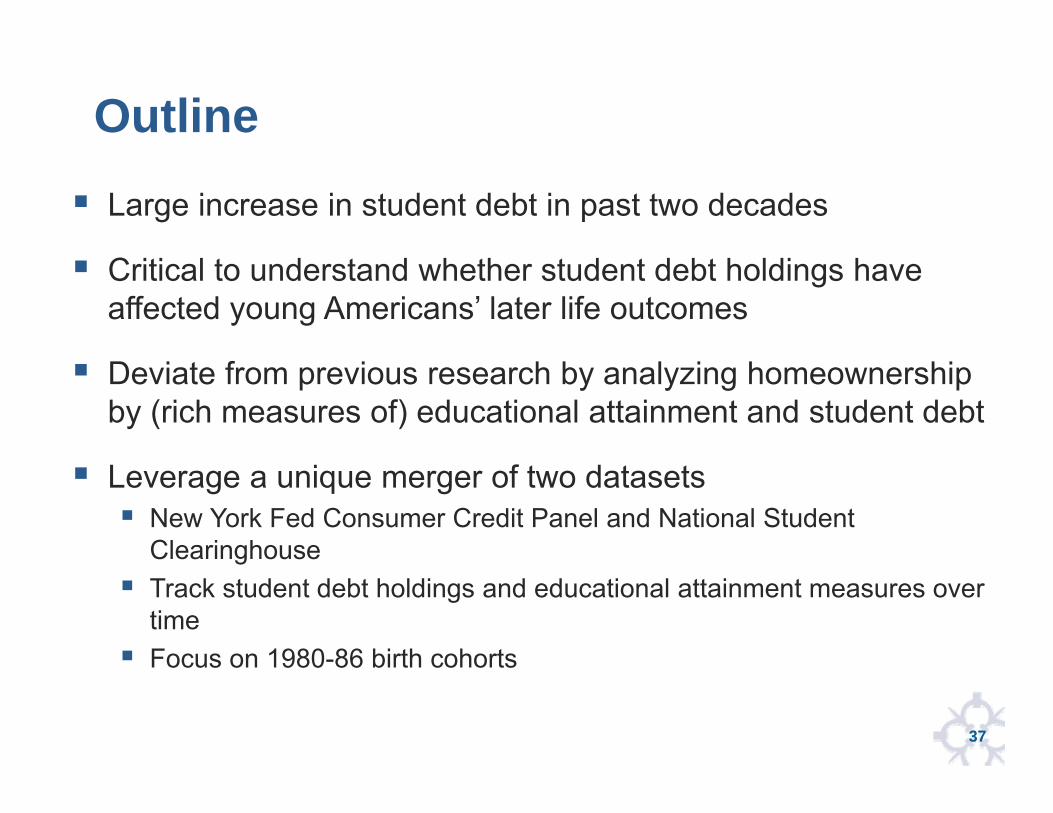
Outline
Large increase in student debt in past two decades
Critical to understand whether student debt holdings have affected young Americans’ later life outcomes
Deviate from previous research by analyzing homeownership by (rich measures of) educational attainment and student debt
Leverage a unique merger of two datasets New York Fed Consumer Credit Panel and National Student
Clearinghouse Track student debt holdings and educational attainment measures over
time Focus on 1980-86 birth cohorts
38
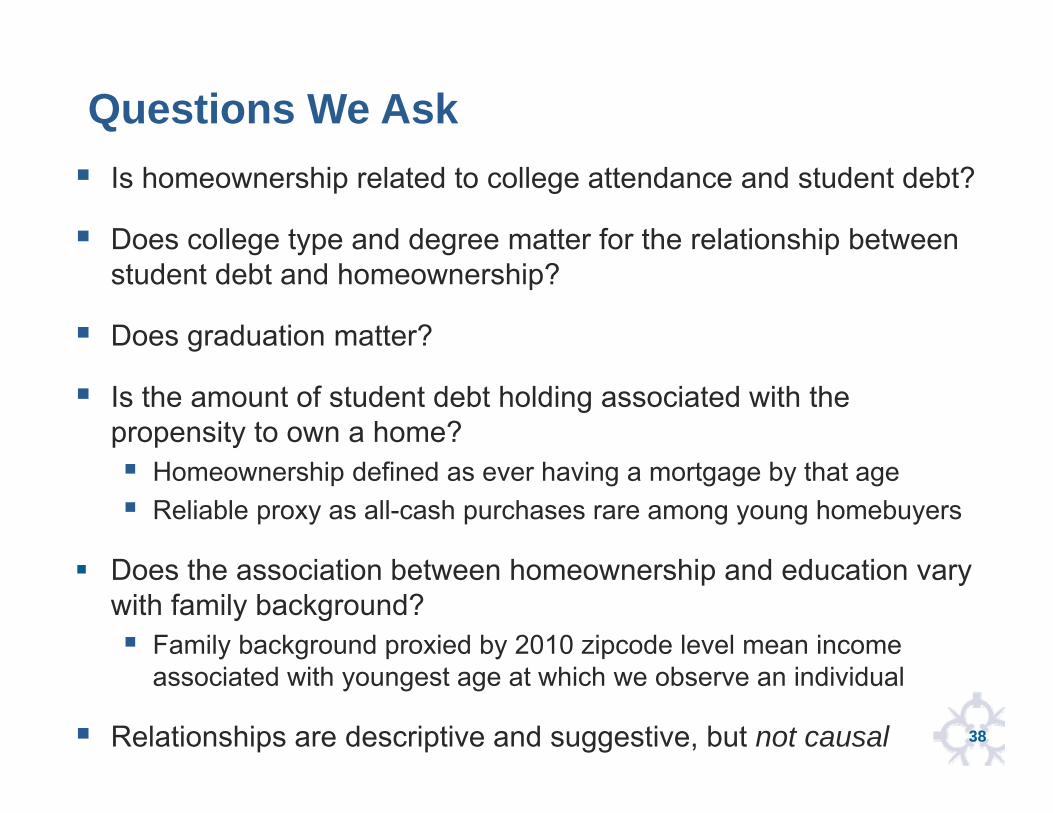
Questions We Ask Is homeownership related to college attendance and student debt?
Does college type and degree matter for the relationship between student debt and homeownership?
Does graduation matter?
Is the amount of student debt holding associated with the propensity to own a home? Homeownership defined as ever having a mortgage by that age Reliable proxy as all-cash purchases rare among young homebuyers
Does the association between homeownership and education vary with family background? Family background proxied by 2010 zipcode level mean income
associated with youngest age at which we observe an individual
Relationships are descriptive and suggestive, but not causal
39
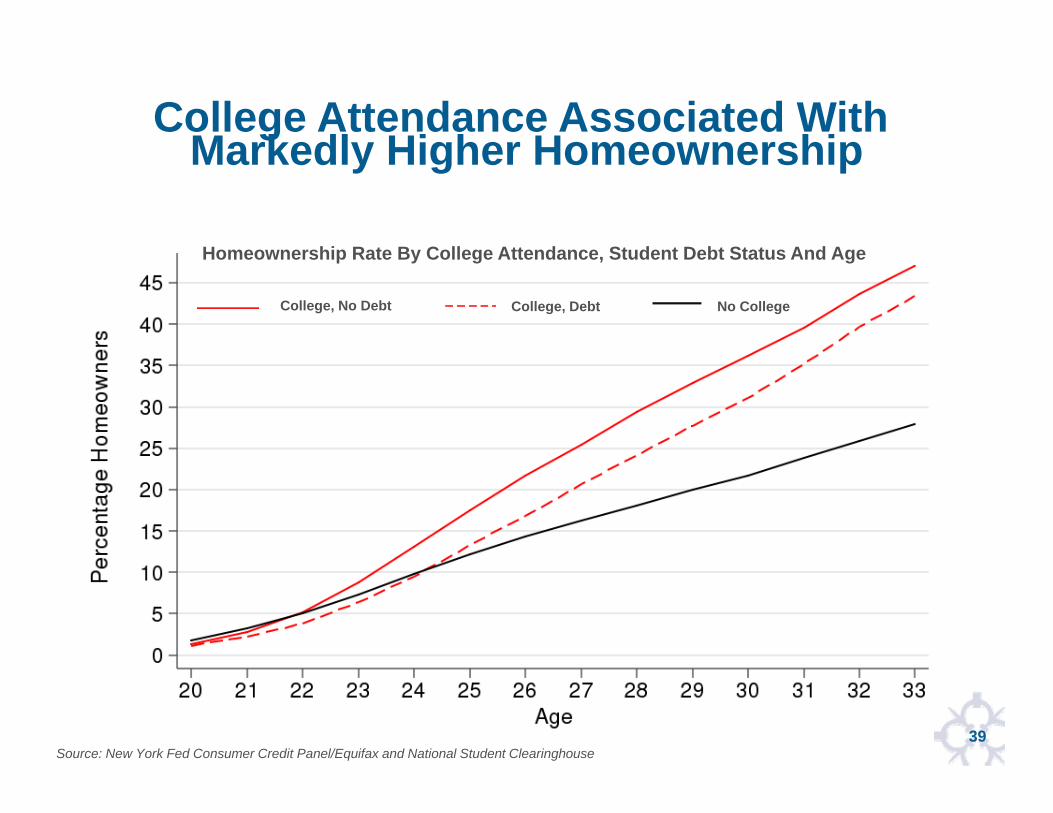
College Attendance Associated With Markedly Higher Homeownership
Homeownership Rate By College Attendance, Student Debt Status And Age
College, No Debt College, Debt No College
Source: New York Fed Consumer Credit Panel/Equifax and National Student Clearinghouse
40
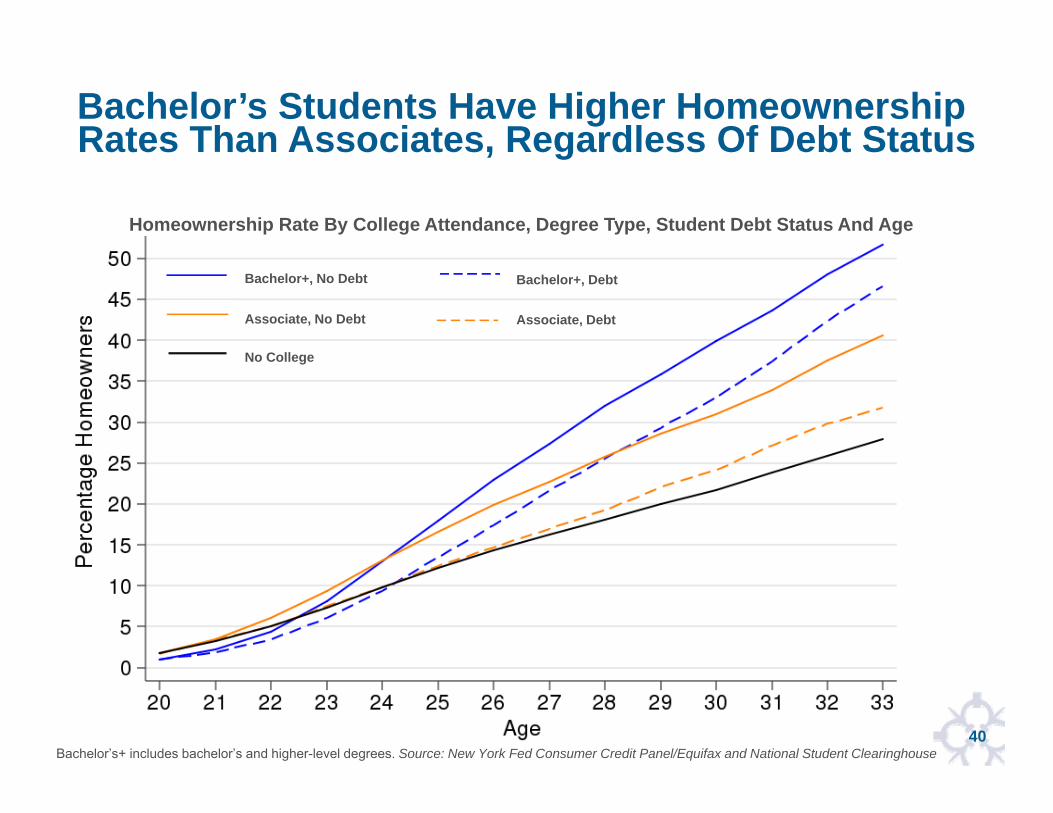
Bachelor’s Students Have Higher Homeownership Rates Than Associates, Regardless Of Debt Status
Homeownership Rate By College Attendance, Degree Type, Student Debt Status And Age
Bachelor+, No Debt Bachelor+, Debt
Associate, No Debt Associate, Debt
No College
Bachelor’s+ includes bachelor’s and higher-level degrees. Source: New York Fed Consumer Credit Panel/Equifax and National Student Clearinghouse
41
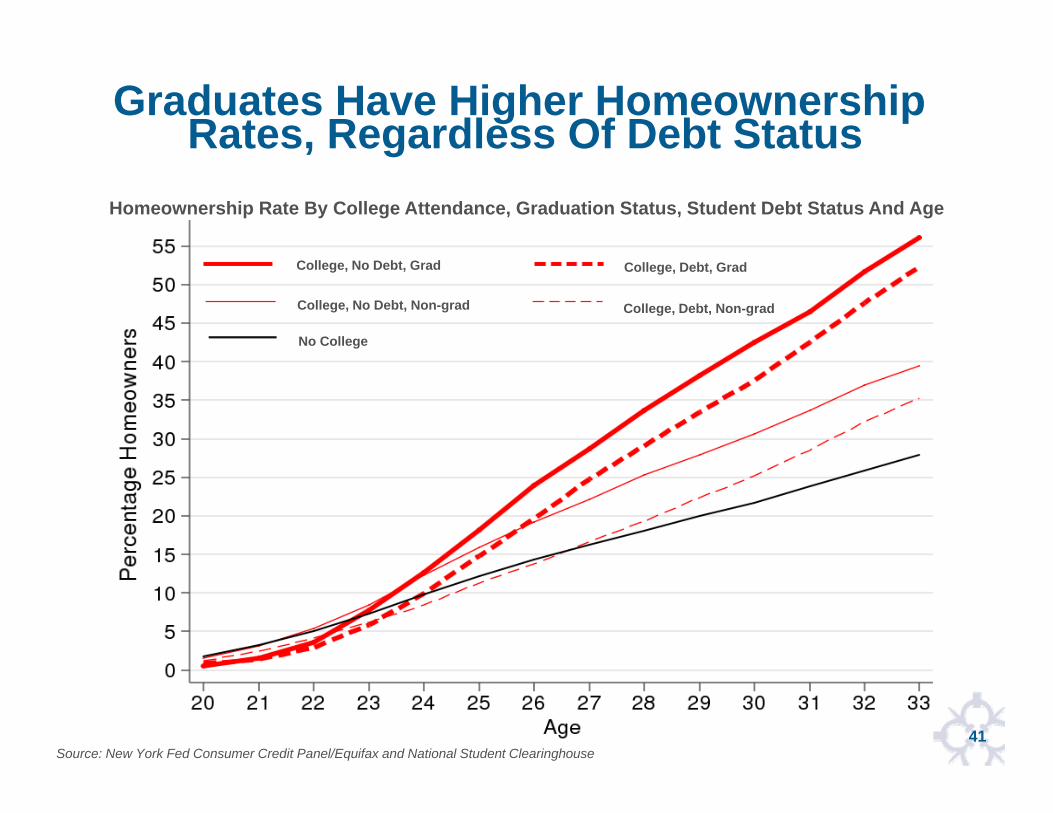
Graduates Have Higher Homeownership Rates, Regardless Of Debt Status
Homeownership Rate By College Attendance, Graduation Status, Student Debt Status And Age
College, No Debt, Grad College, Debt, Grad
College, No Debt, Non-grad College, Debt, Non-grad
No College
Source: New York Fed Consumer Credit Panel/Equifax and National Student Clearinghouse
42
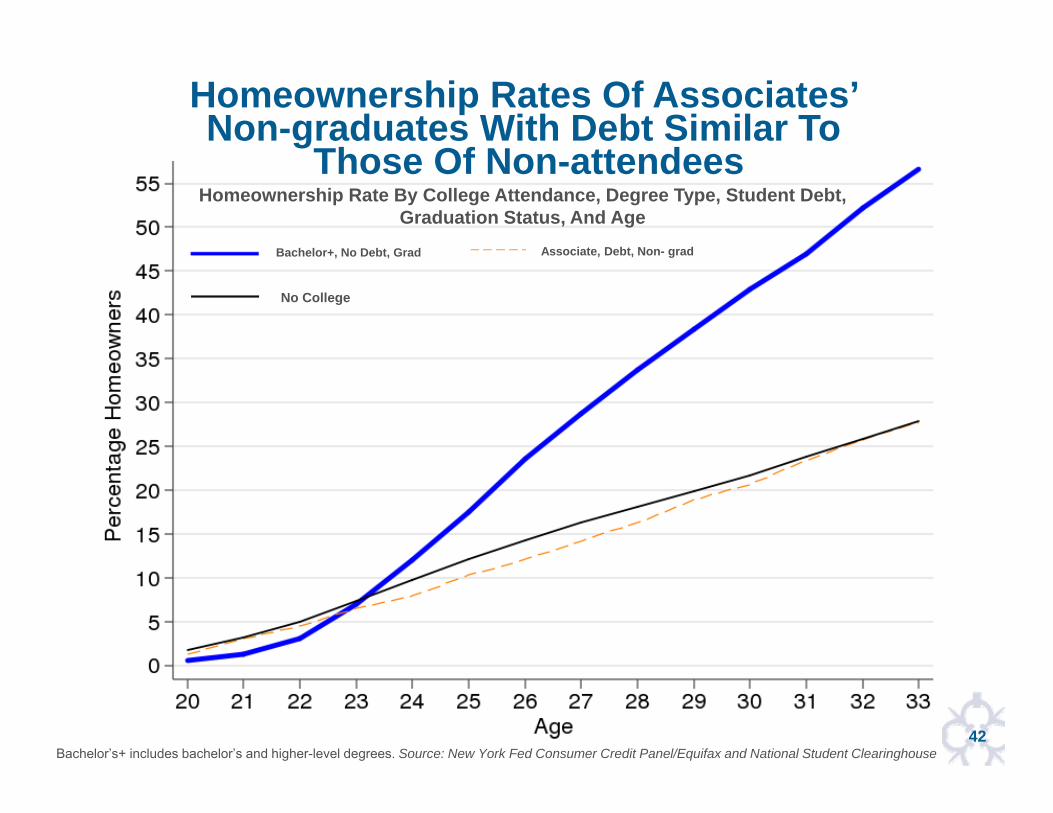
Homeownership Rate By College Attendance, Degree Type, Student Debt, Graduation Status, And Age
Bachelor+, No Debt, Grad Associate, Debt, Non- grad
No College
Homeownership Rates Of Associates’ Non-graduates With Debt Similar To
Those Of Non-attendees
Bachelor’s+ includes bachelor’s and higher-level degrees. Source: New York Fed Consumer Credit Panel/Equifax and National Student Clearinghouse
43
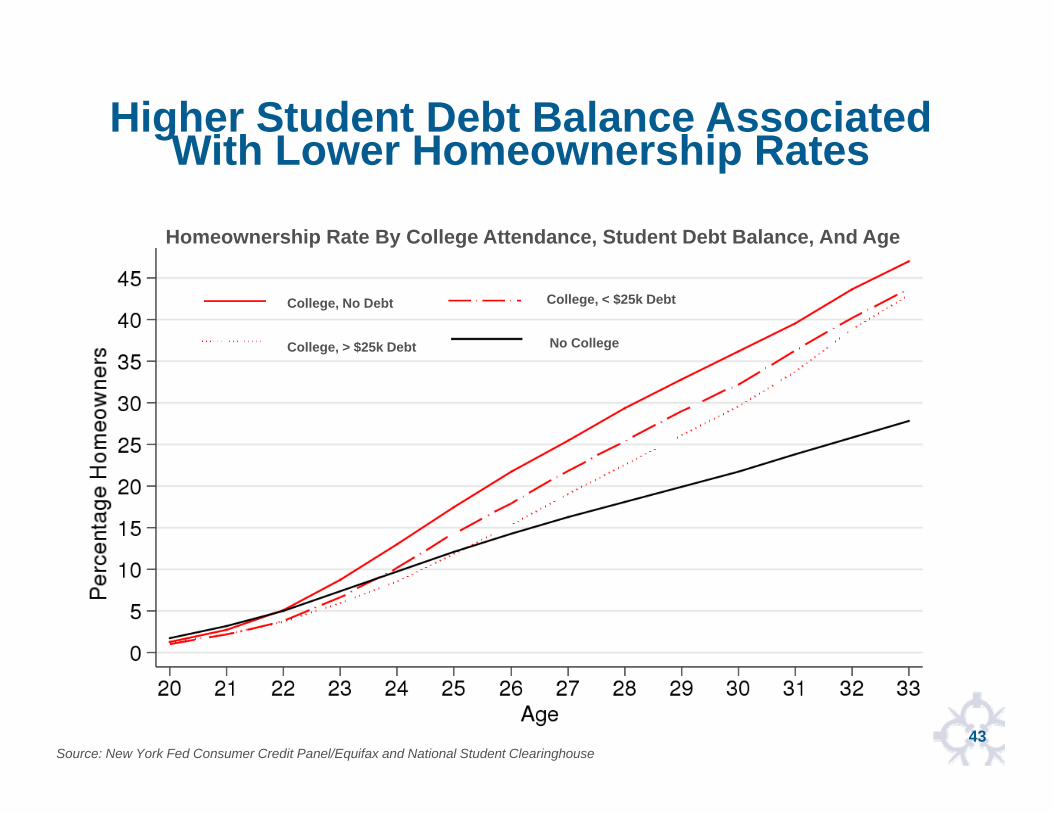
College, > $25k Debt
Higher Student Debt Balance Associated With Lower Homeownership Rates
Homeownership Rate By College Attendance, Student Debt Balance, And Age
College, No Debt
No College
College, < $25k Debt
Source: New York Fed Consumer Credit Panel/Equifax and National Student Clearinghouse

44
College Attendance Appears To Mitigate The Importance Of Family Background
Homeownership Rate By College Attendance, Family Income, And Age
College, Above Mean Income College, Below Mean Income
No College, Above Mean Income
No College, Below Mean Income
Family background proxied by 2010 zip code-level mean income where an individual resided at the youngest age we observe. Mean income is $55,000. Source: New York Fed Consumer Credit Panel/Equifax and National Student Clearinghouse
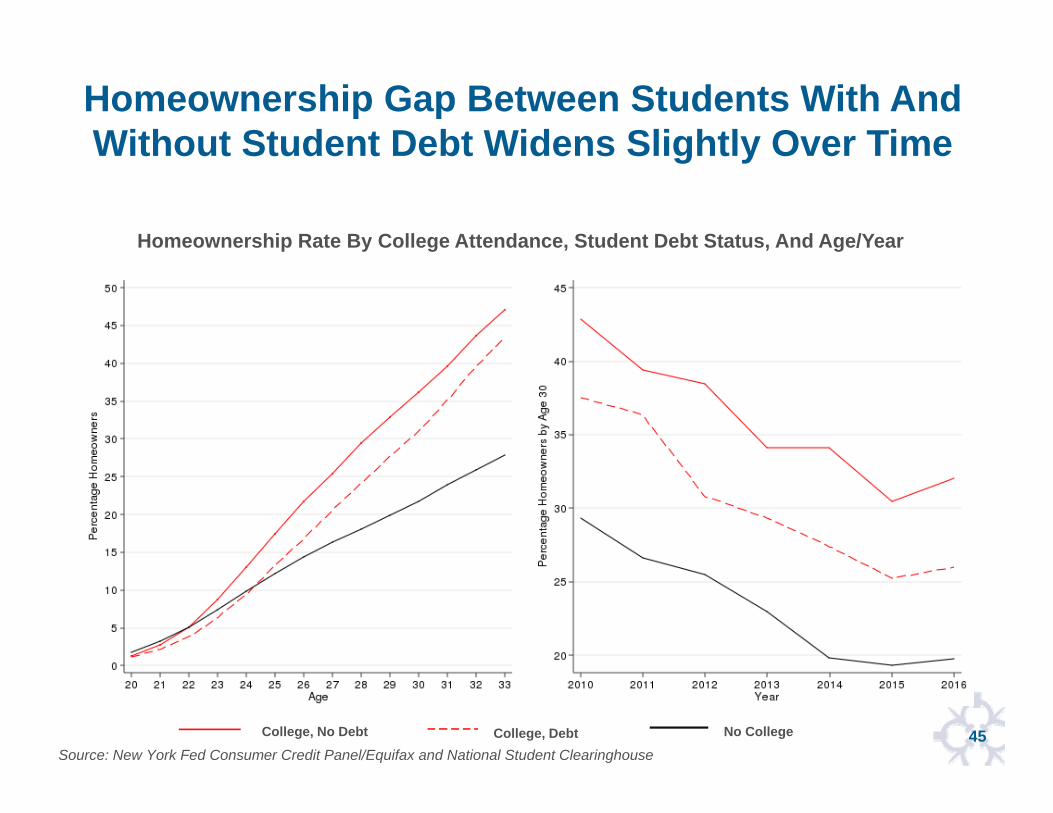
45
Homeownership Rate By College Attendance, Student Debt Status, And Age/Year
College, No Debt College, Debt No College
Homeownership Gap Between Students With And Without Student Debt Widens Slightly Over Time
Source: New York Fed Consumer Credit Panel/Equifax and National Student Clearinghouse
46
Key Takeaways College education associated with markedly higher
homeownership rate, regardless of debt status
Homeownership rates for Bachelors’ higher than Associates’ regardless of debt status
Lowest homeownership rates for those who do not go to college and gap widens over time
Graduates have significantly higher homeownership rates than non-graduates, regardless of debt status
At each degree/completion level, students with debt have lower homeownership rates
Higher debt balance associated with lower home ownership rates
College education appears to mitigate importance of family background
47
While the total level of household debt has nearly returned to the 2008 peak, debt types and borrower profiles have changed. Debt growth is now driven by non-housing sectors, and debt
is held by older, more creditworthy borrowers. Student debt has expanded significantly because of higher
levels of borrowing and slower rates of repayment. Student debt defaults peaked with the 2011 cohort and have
improved somewhat since. However, payment progress has declined.
College attendance is associated with significantly higher homeownership rates regardless of debt status. Yet, student debt appears to dampen homeownership rates among those with the same level of education.
College attendance appears to mitigate the impact of economic background on homeownership rates.
Summary
48
Appendix
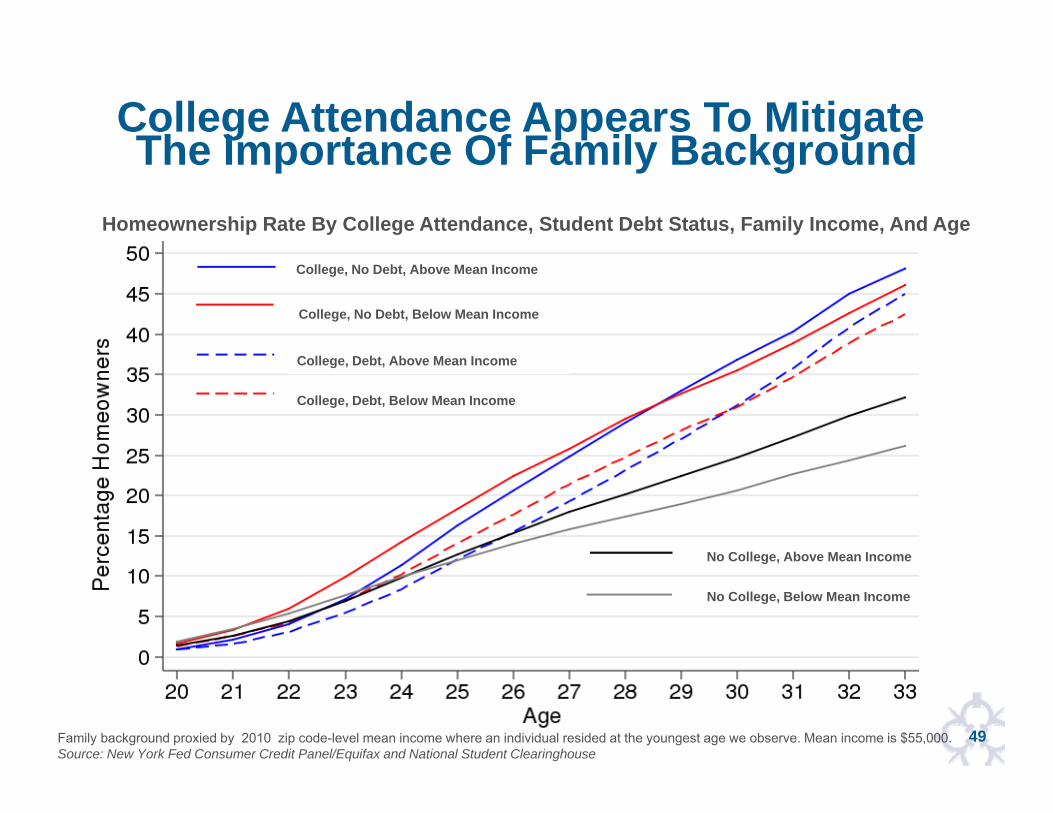
49
Homeownership Rate By College Attendance, Student Debt Status, Family Income, And Age
College, No Debt, Above Mean Income
College, No Debt, Below Mean Income
College, Debt, Above Mean Income
College, Debt, Below Mean Income
No College, Above Mean Income
No College, Below Mean Income
College Attendance Appears To Mitigate The Importance Of Family Background
Family background proxied by 2010 zip code-level mean income where an individual resided at the youngest age we observe. Mean income is $55,000. Source: New York Fed Consumer Credit Panel/Equifax and National Student Clearinghouse
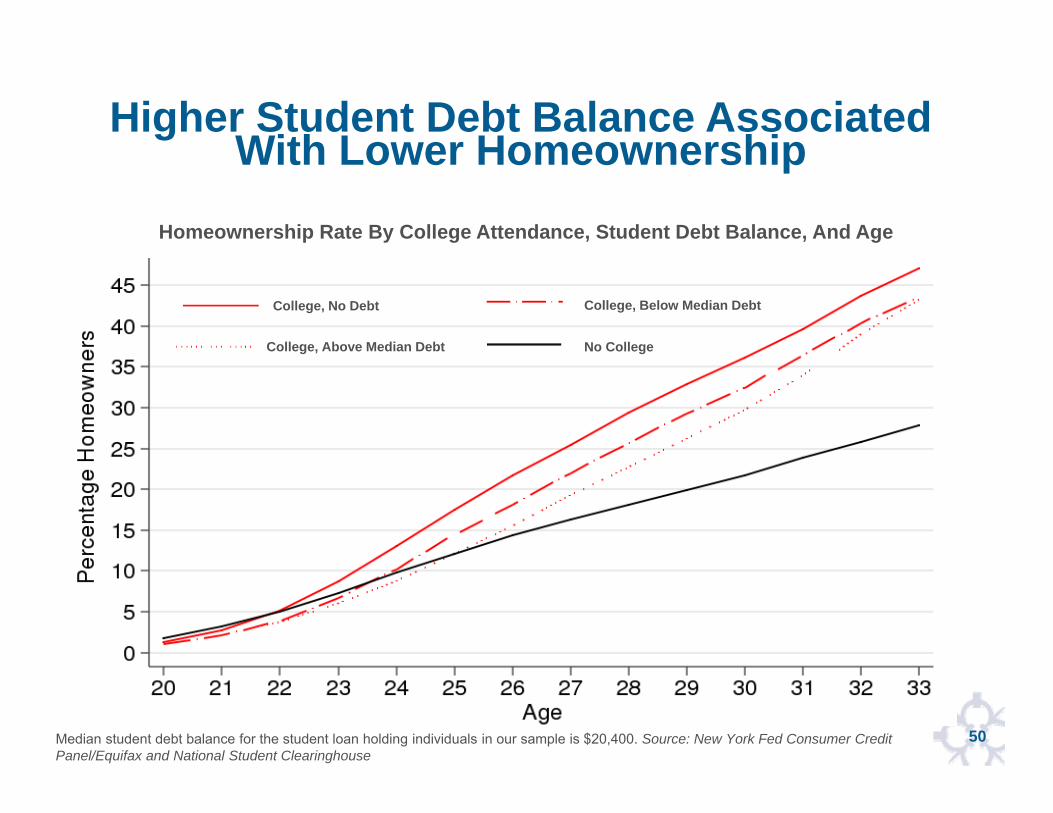
50
College, Above Median Debt
Homeownership Rate By College Attendance, Student Debt Balance, And Age
College, Below Median Debt
No College
College, No Debt
Higher Student Debt Balance Associated With Lower Homeownership
Median student debt balance for the student loan holding individuals in our sample is $20,400. Source: New York Fed Consumer Credit Panel/Equifax and National Student Clearinghouse
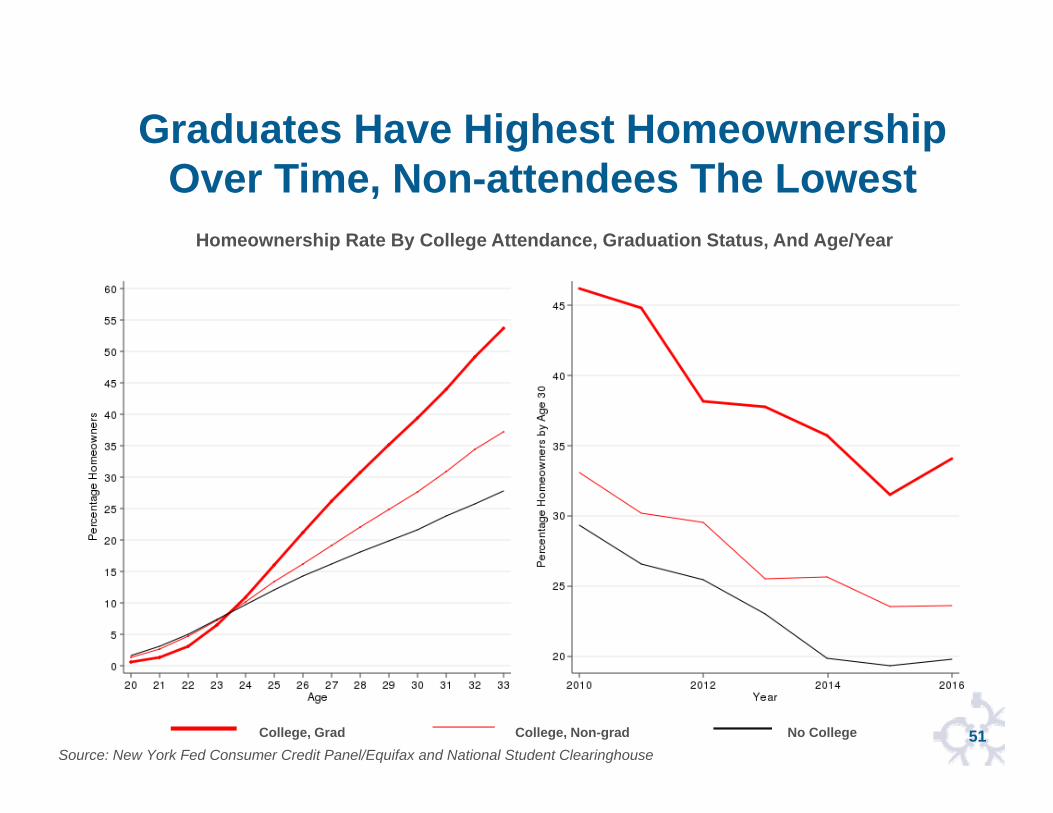
51
Homeownership Rate By College Attendance, Graduation Status, And Age/Year
College, Grad College, Non-grad No CollegeSource: New York Fed Consumer Credit Panel/Equifax and National Student Clearinghouse
Graduates Have Highest Homeownership Over Time, Non-attendees The Lowest

52
Homeownership Rate By College Attendance, Family Income, And Year
College, Above Mean Income College, Below Mean Income
No College, Above Mean Income No College, Below Mean Income Family background proxied by 2010 zip code-level mean income where an individual resided at the youngest age we observe.Sources: FRBNY Consumer Credit Panel/Equifax and National Student Clearinghouse
College Attendance Appears To Mitigate The Importance Of Family Background
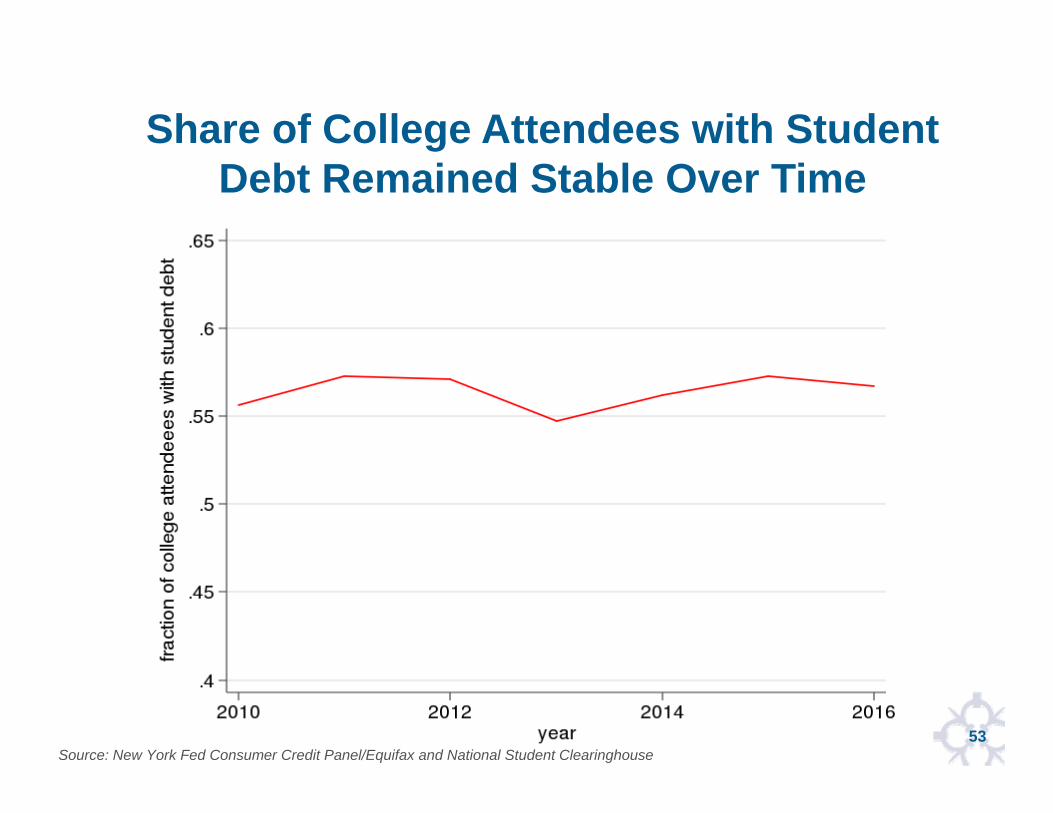
53
Share of College Attendees with Student Debt Remained Stable Over Time
Source: New York Fed Consumer Credit Panel/Equifax and National Student Clearinghouse
54
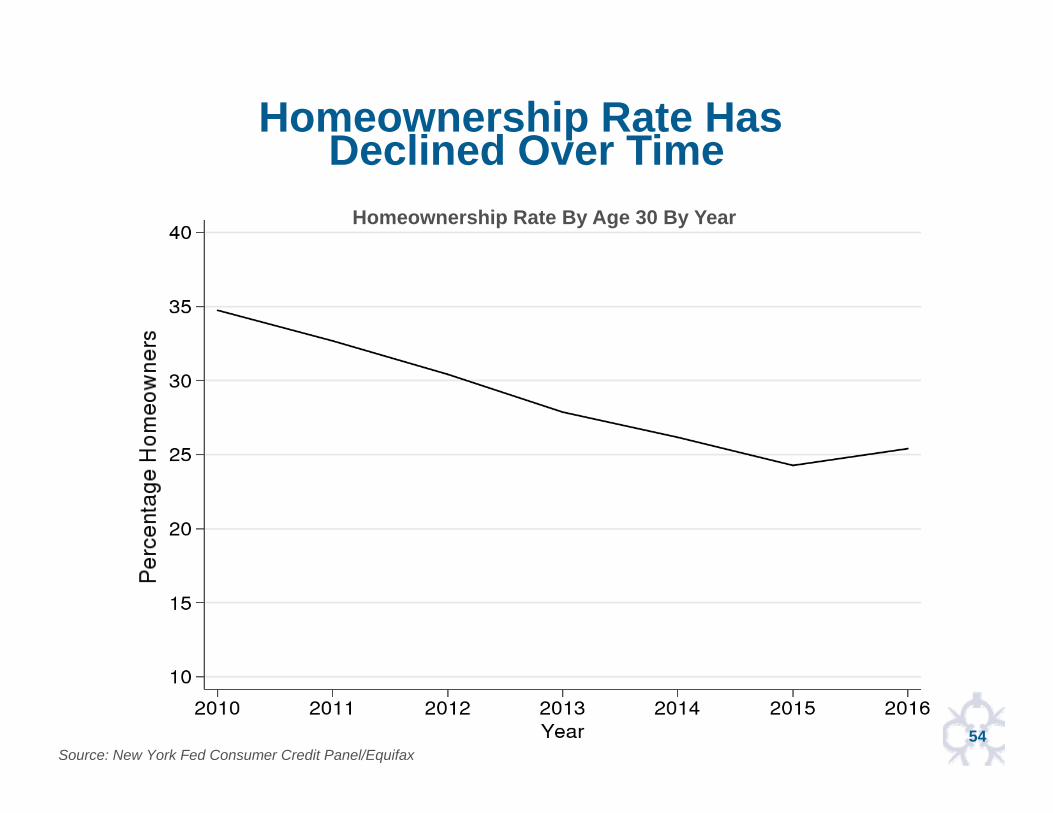
Homeownership Rate Has Declined Over Time
Homeownership Rate By Age 30 By Year
Source: New York Fed Consumer Credit Panel/Equifax
55
Variable Definitions Homeownership defined as ever having a mortgage by that age
Student debt status based on whether an individual held student debt between ages 27 and 30 to capture recent exposure to debt
We categorize as college attendees those who entered college by age 25.
Degree program is based on the highest degree program entered by age 25
College graduates are those who graduated at or before age 30