cba household debt trends (25 july 2013)
TRANSCRIPT
7/27/2019 CBA Household Debt Trends (25 July 2013)
http://slidepdf.com/reader/full/cba-household-debt-trends-25-july-2013 1/9
Global Markets Research
Issues
25 July 2013
Michael Workman Senior Economist T. +612 9118 1019 E. [email protected] Mousina Economist T. +612 9118 6394 E. [email protected]
mportant Disclosures and analyst certifications regarding subject companies are in the Disclosure and Disclaimer Appendix of this document and atww.research.commbank.com.au. This report is published, approved and distributed by Commonwealth Bank of Australia ABN 48 123 123 124 AFSL 234945.
Household debt trends
Australian households have housing debt levels that are high by international standards.
But income and asset characteristics of relevant households suggest that they can service the debt comfortably.
Housing loans make up the largest component of household debt while housing is generally the largest asset.
In the past few years Australian households have become more cautious about committing to higher housing debt andcontinue to save slightly more than 10% of their income, the highest level since the 1980s.
The current period of low interest rates has seen households maintaining debt repayment schedules and consolidatingtheir balance sheets. Gradually rising housing prices should enhance their net asset positions.
Australian household debt ratios are relatively high by international standards. But there are important economic and legaldifferences between housing markets that can sustain marked variations in housing prices. In Australia, it is also importantto understand the economic and social characteristics of the households that have the debt.
This note uses the considerable amount of research into household financial positions (published by the ABS, the RBA andother groups like the Melbourne Institute’s 2012 Household Income and Labour Dynamics in Australia (HILDA) report) whichprovide extensive insights into these household characteristics. The data and the surveys show that household debt hasincreased steadily over 2002-2010, primarily due to growth in housing-related debt.
But the data and the surveys also indicate that the households who carry the most debt typically have stablecharacteristics. On average, these households are couples with good health, high educational attainment, relatively highand stable incomes and in a prime age category. On balance, Australian households are in a good position to service theirhousing and other debt. The net asset positions of the households are also important in judging their capacity to cope with
adverse economic developments.
One of the more interesting recent trends is that households have also increased their housing debt prepayments over2012 and 2013, by leaving their repayments unchanged while interest rates fell. It is in line with the inclination to reducehousing and credit card debt since the GFC. Combined, these more cautionary shifts provide households with an importantbuffer to any negative economic shocks.
Some commentary on Australian household balance sheet positions conveys the impression that household debt levels aretoo high, leaving many households with unmanageable debt servicing commitments. The general line is that a significantnumber of households are at risk of financial ruin if their economic circumstances, like employment, change adversely. Thesurveys, and the experience of the past few decades, does not, in our view, support those lines of argument. Theexperience of the post-Global Financial Crisis (GFC) period was a “stress test” that indicated the ability of Australianhouseholds to cope well with adverse economic developments.
Some of the commentary on Australian house prices, especially from offshore based groups, argues that there is a housingprice “bubble” in Australia which will eventually burst and replicate the downward path of US and UK house prices throughthe 2008 to 2011 post-GFC period. In our view, the US and UK housing market outcomes reflected the severe recessionsand the housing demand/supply imbalances that hit the two economies after the GFC. Fortunately, through good luck andgood management, Australia did not have a recession and the most important influence on the housing market’s outcomes,the unemployment rate, peaked at just under 6%. That was significantly below the peaks reached in the US and UK wherethe rates are moving lower but are still around 8%.

7/27/2019 CBA Household Debt Trends (25 July 2013)
http://slidepdf.com/reader/full/cba-household-debt-trends-25-july-2013 2/9
7/27/2019 CBA Household Debt Trends (25 July 2013)
http://slidepdf.com/reader/full/cba-household-debt-trends-25-july-2013 3/9
Global Markets Research | Economics: Issues
3
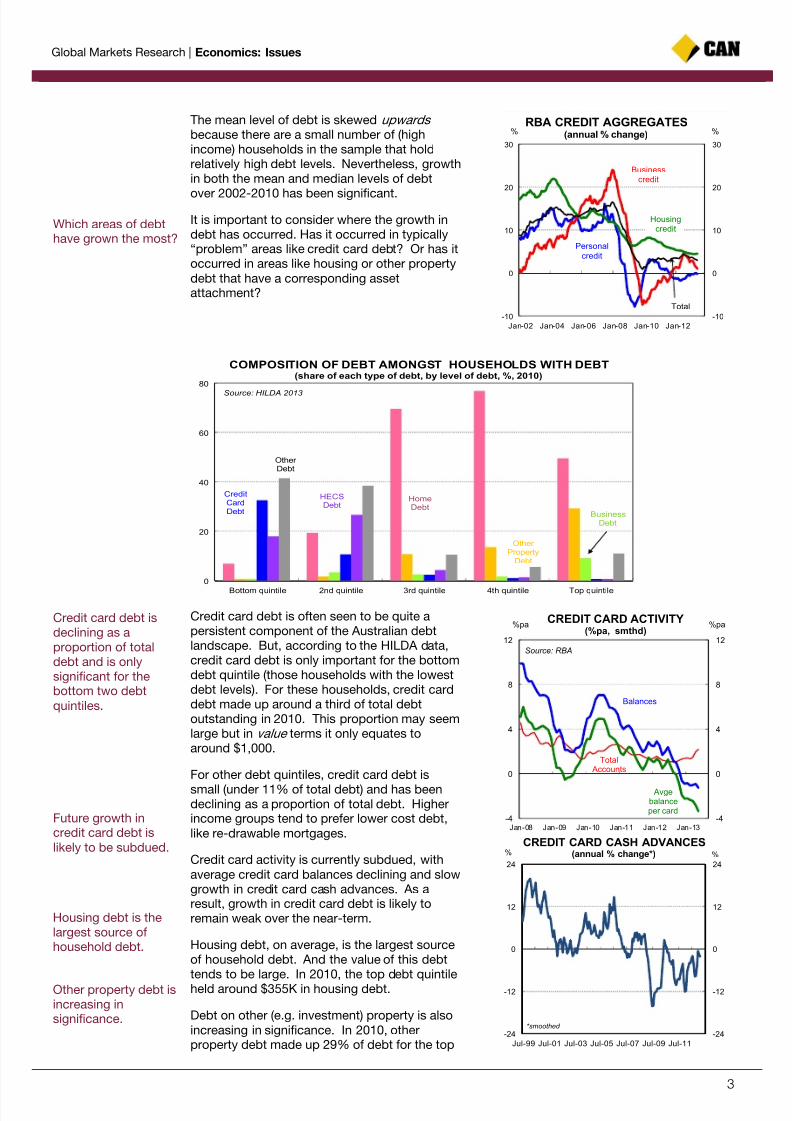
The mean level of debt is skewed upwards because there are a small number of (highincome) households in the sample that holdrelatively high debt levels. Nevertheless, growthin both the mean and median levels of debt
over 2002-2010 has been significant.
It is important to consider where the growth indebt has occurred. Has it occurred in typically“problem” areas like credit card debt? Or has itoccurred in areas like housing or other propertydebt that have a corresponding assetattachment?
Credit card debt is often seen to be quite apersistent component of the Australian debtlandscape. But, according to the HILDA data,credit card debt is only important for the bottomdebt quintile (those households with the lowestdebt levels). For these households, credit carddebt made up around a third of total debtoutstanding in 2010. This proportion may seemlarge but in value terms it only equates toaround $1,000.
For other debt quintiles, credit card debt is
small (under 11% of total debt) and has beendeclining as a proportion of total debt. Higherincome groups tend to prefer lower cost debt,like re-drawable mortgages.
Credit card activity is currently subdued, withaverage credit card balances declining and slowgrowth in credit card cash advances. As aresult, growth in credit card debt is likely toremain weak over the near-term.
Housing debt, on average, is the largest sourceof household debt. And the value of this debttends to be large. In 2010, the top debt quintileheld around $355K in housing debt.
Debt on other (e.g. investment) property is alsoincreasing in significance. In 2010, otherproperty debt made up 29% of debt for the top
-10
0
10
20
30
-10
0
10
20
30
Jan-02 Jan-04 Jan-06 Jan-08 Jan-10 Jan-12
RBA CREDIT AGGREGATES(annual % change)% %
Housingcredit
Personalcredit
Businesscredit
Total
0
20
40
60
80
Bottom quintile 2nd quintile 3rd quintile 4th quintile Top quintile
COMPOSITION OF DEBT AMONGST HOUSEHOLDS WITH DEBT(share of each type of debt, by level of debt, %, 2010)
HomeDebt
Other Property
Debt
BusinessDebt
CreditCardDebt
HECSDebt
Other Debt
Source: HILDA 2013
-4
0
4
8
12
-4
0
4
8
12
Jan-08 Jan-09 Jan-10 Jan-11 Jan-12 Jan-13
CREDIT CARD ACTIVITY(%pa, smthd)
Balances
Avgebalanceper card
Total Accounts
Source: RBA
%pa %pa
-24
-12
0
12
24
-24
-12
0
12
24
Jul-99 Jul-01 Jul-03 Jul-05 Jul-07 Jul-09 Jul-11
CREDIT CARD CASH ADVANCES(annual % change*)% %
*smoothed
Which areas of debthave grown the most?
Credit card debt isdeclining as aproportion of totaldebt and is onlysignificant for thebottom two debtquintiles.
Future growth incredit card debt islikely to be subdued.
Housing debt is thelargest source ofhousehold debt.
Other property debt isincreasing insignificance.
7/27/2019 CBA Household Debt Trends (25 July 2013)
http://slidepdf.com/reader/full/cba-household-debt-trends-25-july-2013 4/9
Global Markets Research | Economics: Issues
4
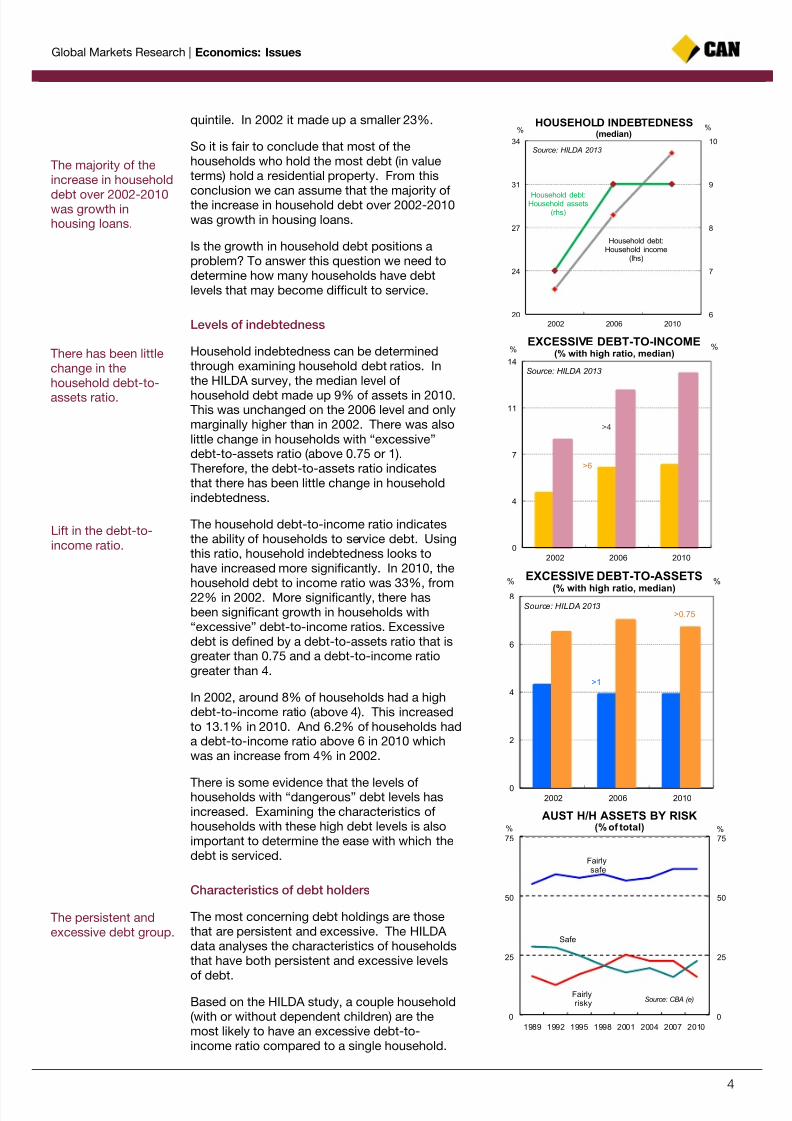
quintile. In 2002 it made up a smaller 23%.
So it is fair to conclude that most of thehouseholds who hold the most debt (in valueterms) hold a residential property. From this
conclusion we can assume that the majority ofthe increase in household debt over 2002-2010was growth in housing loans.
Is the growth in household debt positions aproblem? To answer this question we need todetermine how many households have debtlevels that may become difficult to service.
Levels of indebtedness
Household indebtedness can be determinedthrough examining household debt ratios. Inthe HILDA survey, the median level of
household debt made up 9% of assets in 2010.This was unchanged on the 2006 level and onlymarginally higher than in 2002. There was alsolittle change in households with “excessive”debt-to-assets ratio (above 0.75 or 1).Therefore, the debt-to-assets ratio indicatesthat there has been little change in householdindebtedness.
The household debt-to-income ratio indicatesthe ability of households to service debt. Usingthis ratio, household indebtedness looks tohave increased more significantly. In 2010, the
household debt to income ratio was 33%, from22% in 2002. More significantly, there hasbeen significant growth in households with“excessive” debt-to-income ratios. Excessivedebt is defined by a debt-to-assets ratio that isgreater than 0.75 and a debt-to-income ratiogreater than 4.
In 2002, around 8% of households had a highdebt-to-income ratio (above 4). This increasedto 13.1% in 2010. And 6.2% of households hada debt-to-income ratio above 6 in 2010 whichwas an increase from 4% in 2002.
There is some evidence that the levels ofhouseholds with “dangerous” debt levels hasincreased. Examining the characteristics ofhouseholds with these high debt levels is alsoimportant to determine the ease with which thedebt is serviced.
Characteristics of debt holders
The most concerning debt holdings are thosethat are persistent and excessive. The HILDA data analyses the characteristics of householdsthat have both persistent and excessive levelsof debt.
Based on the HILDA study, a couple household(with or without dependent children) are themost likely to have an excessive debt-to-income ratio compared to a single household.
6
7
8
9
10
20
24
27
31
34
2002 2006 2010
HOUSEHOLD INDEBTEDNESS(median)
%
Source: HILDA 2013
Household debt:Household assets
(rhs)
Household debt:Household income
(lhs)
%
0
4
7
11
14
2002 2006 2010
EXCESSIVE DEBT-TO-INCOME(% with high ratio, median)
%
Source: HILDA 2013
>4
>6
%
0
2
4
6
8
2002 2006 2010
EXCESSIVE DEBT-TO-ASSETS
(% with high ratio, median)
%
Source: HILDA 2013>0.75
>1
%
0
25
50
75
0
25
50
75
1989 1992 1995 1998 2001 2004 2007 2010
AUST H/H ASSETS BY RISK(% of total)% %
Fairlyrisky
Fairlysafe
Safe
Source: CBA (e)
The majority of theincrease in household
debt over 2002-2010was growth inhousing loans.
There has been littlechange in thehousehold debt-to-assets ratio.
Lift in the debt-to-income ratio.
The persistent andexcessive debt group.
7/27/2019 CBA Household Debt Trends (25 July 2013)
http://slidepdf.com/reader/full/cba-household-debt-trends-25-july-2013 5/9
Global Markets Research | Economics: Issues
5
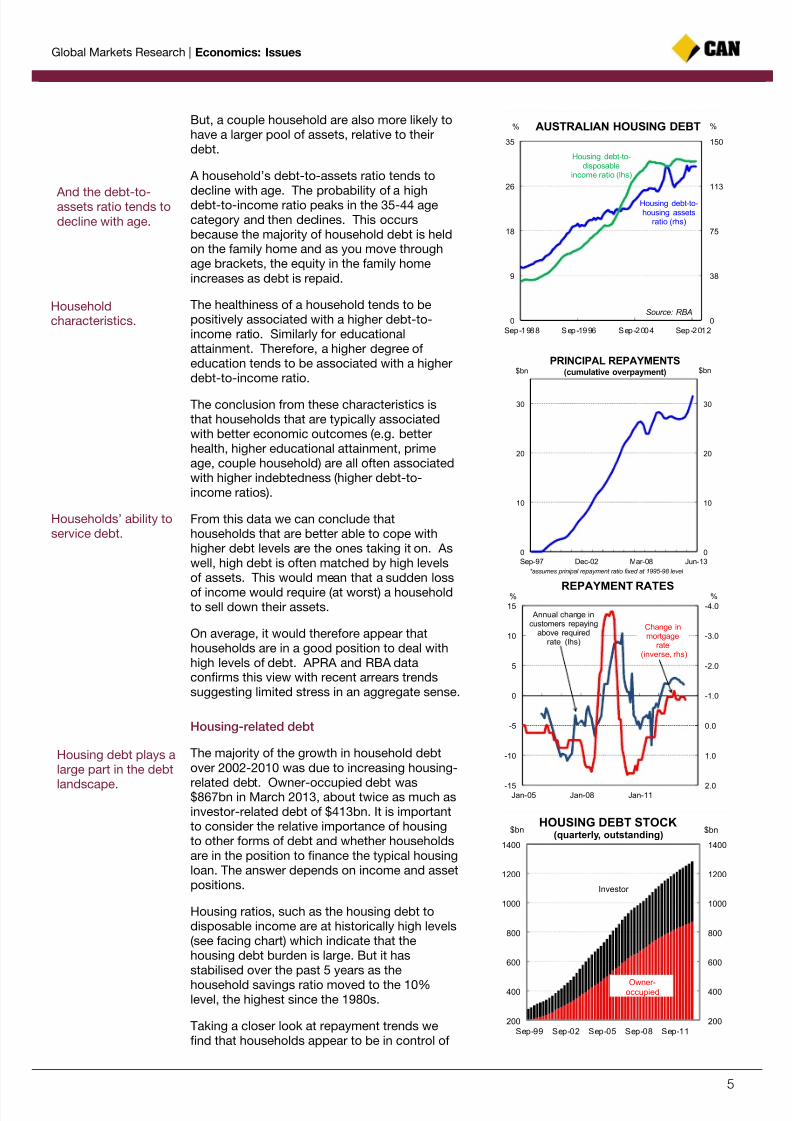
But, a couple household are also more likely tohave a larger pool of assets, relative to theirdebt.
A household’s debt-to-assets ratio tends to
decline with age. The probability of a highdebt-to-income ratio peaks in the 35-44 agecategory and then declines. This occursbecause the majority of household debt is heldon the family home and as you move throughage brackets, the equity in the family homeincreases as debt is repaid.
The healthiness of a household tends to bepositively associated with a higher debt-to-income ratio. Similarly for educationalattainment. Therefore, a higher degree ofeducation tends to be associated with a higherdebt-to-income ratio.
The conclusion from these characteristics isthat households that are typically associatedwith better economic outcomes (e.g. betterhealth, higher educational attainment, primeage, couple household) are all often associatedwith higher indebtedness (higher debt-to-income ratios).
From this data we can conclude thathouseholds that are better able to cope withhigher debt levels are the ones taking it on. Aswell, high debt is often matched by high levelsof assets. This would mean that a sudden loss
of income would require (at worst) a householdto sell down their assets.
On average, it would therefore appear thathouseholds are in a good position to deal withhigh levels of debt. APRA and RBA dataconfirms this view with recent arrears trendssuggesting limited stress in an aggregate sense.
Housing-related debt
The majority of the growth in household debtover 2002-2010 was due to increasing housing-
related debt. Owner-occupied debt was$867bn in March 2013, about twice as much asinvestor-related debt of $413bn. It is importantto consider the relative importance of housingto other forms of debt and whether householdsare in the position to finance the typical housingloan. The answer depends on income and assetpositions.
Housing ratios, such as the housing debt todisposable income are at historically high levels(see facing chart) which indicate that thehousing debt burden is large. But it hasstabilised over the past 5 years as the
household savings ratio moved to the 10%level, the highest since the 1980s.
Taking a closer look at repayment trends wefind that households appear to be in control of
0
38
75
113
150
0
9
18
26
35
Sep-1988 Sep-1996 Sep-2004 Sep-2012
AUSTRALIAN HOUSING DEBT
Housing debt-to-housing assets
ratio (rhs)
Housing debt-to-disposable
income ratio (lhs)
%%
Source: RBA
0
10
20
30
0
10
20
30
Sep-97 Dec-02 Mar-08 Jun-13
PRINCIPAL REPAYMENTS(cumulative overpayment)$bn $bn
*assumes prinipal repayment ratio fixed at 1995-98 level
-4.0
-3.0
-2.0
-1.0
0.0
1.0
2.0-15
-10
-5
0
5
10
15
Jan-05 Jan-08 Jan-11
REPAYMENT RATES% %
Change inmortgage
rate(inverse, rhs)
Annual change incustomers repaying
above requiredrate (lhs)
200
400
600
800
1000
1200
1400
200
400
600
800
1000
1200
1400
Sep-99 Sep-02 Sep-05 Sep-08 Sep-11
HOUSING DEBT STOCK(quarterly, outstanding)
Owner-occupied
Investor
$bn $bn
And the debt-to-assets ratio tends todecline with age.
Householdcharacteristics.
Households’ ability toservice debt.
Housing debt plays alarge part in the debt
landscape.
7/27/2019 CBA Household Debt Trends (25 July 2013)
http://slidepdf.com/reader/full/cba-household-debt-trends-25-july-2013 6/9
Global Markets Research | Economics: Issues
6
these relatively large debt positions. They havetaken advantage of lower interest rates toprepay debt, reducing the average term ofmortgages and lifting their net equity positions.
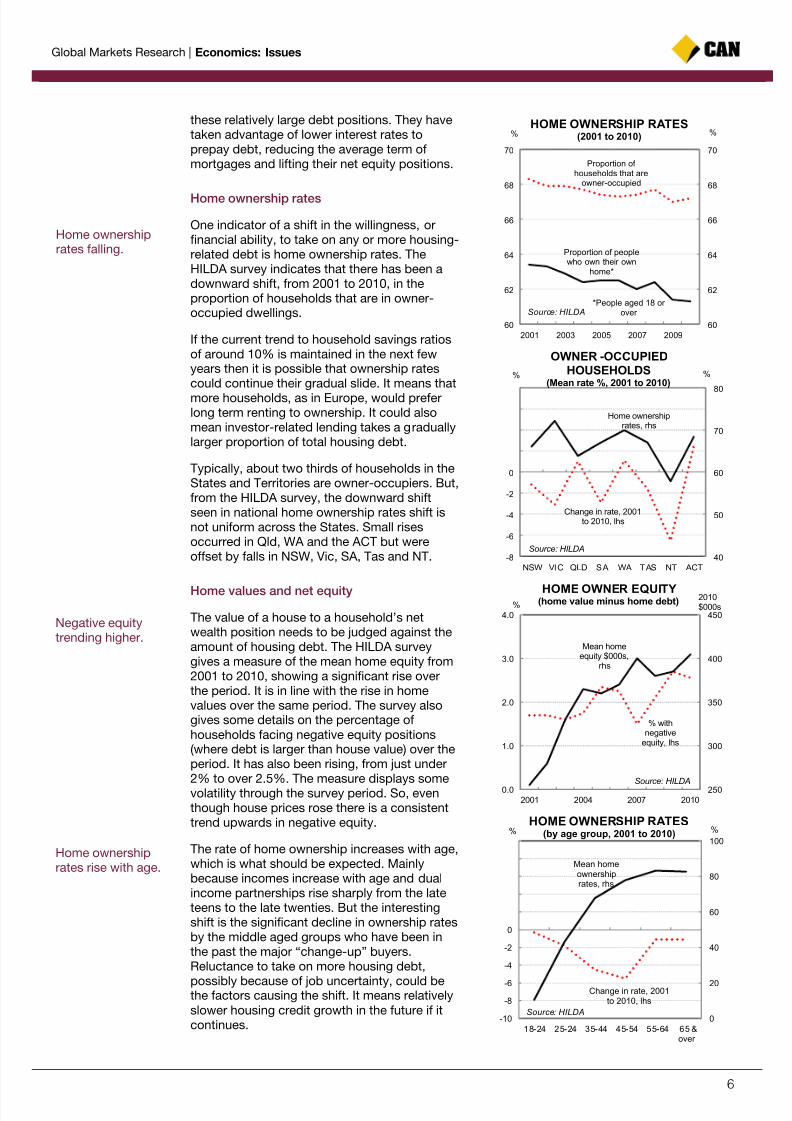
Home ownership rates
One indicator of a shift in the willingness, orfinancial ability, to take on any or more housing-related debt is home ownership rates. TheHILDA survey indicates that there has been adownward shift, from 2001 to 2010, in theproportion of households that are in owner-occupied dwellings.
If the current trend to household savings ratiosof around 10% is maintained in the next fewyears then it is possible that ownership ratescould continue their gradual slide. It means thatmore households, as in Europe, would preferlong term renting to ownership. It could alsomean investor-related lending takes a graduallylarger proportion of total housing debt.
Typically, about two thirds of households in theStates and Territories are owner-occupiers. But,from the HILDA survey, the downward shiftseen in national home ownership rates shift isnot uniform across the States. Small risesoccurred in Qld, WA and the ACT but wereoffset by falls in NSW, Vic, SA, Tas and NT.
Home values and net equity
The value of a house to a household’s netwealth position needs to be judged against theamount of housing debt. The HILDA surveygives a measure of the mean home equity from2001 to 2010, showing a significant rise overthe period. It is in line with the rise in homevalues over the same period. The survey alsogives some details on the percentage ofhouseholds facing negative equity positions(where debt is larger than house value) over theperiod. It has also been rising, from just under2% to over 2.5%. The measure displays somevolatility through the survey period. So, eventhough house prices rose there is a consistenttrend upwards in negative equity.
The rate of home ownership increases with age,which is what should be expected. Mainlybecause incomes increase with age and dualincome partnerships rise sharply from the lateteens to the late twenties. But the interestingshift is the significant decline in ownership ratesby the middle aged groups who have been inthe past the major “change-up” buyers.Reluctance to take on more housing debt,
possibly because of job uncertainty, could bethe factors causing the shift. It means relativelyslower housing credit growth in the future if itcontinues.
60
62
64
66
68
70
60
62
64
66
68
70
2001 2003 2005 2007 2009
HOME OWNERSHIP RATES(2001 to 2010)
Proportion of households that are
owner-occupied
*People aged 18 or over
% %
Source: HILDA
Proportion of peoplewho own their own
home*
40
50
60
70
80
-8
-6
-4
-2
0
2
4
6
8
NSW VIC QLD SA WA TAS NT ACT
OWNER -OCCUPIED
HOUSEHOLDS(Mean rate %, 2001 to 2010)
Home ownershiprates, rhs
Change in rate, 2001to 2010, lhs
% %
Source: HILDA
250
300
350
400
450
0.0
1.0
2.0
3.0
4.0
2001 2004 2007 2010
HOME OWNER EQUITY(home value minus home debt)
Mean homeequity $000s,
rhs
% withnegative
equity, lhs
%2010$000s
Source: HILDA
0
20
40
60
80
100
-10
-8
-6
-4
-2
0
2
4
6
8
10
18-24 25-24 35-44 45-54 55-64 65 &over
HOME OWNERSHIP RATES(by age group, 2001 to 2010)
Mean homeownershiprates, rhs
Change in rate, 2001to 2010, lhs
% %
Source: HILDA
Home ownershiprates falling.
Negative equitytrending higher.
Home ownershiprates rise with age.
7/27/2019 CBA Household Debt Trends (25 July 2013)
http://slidepdf.com/reader/full/cba-household-debt-trends-25-july-2013 7/9
Global Markets Research | Economics: Issues
7
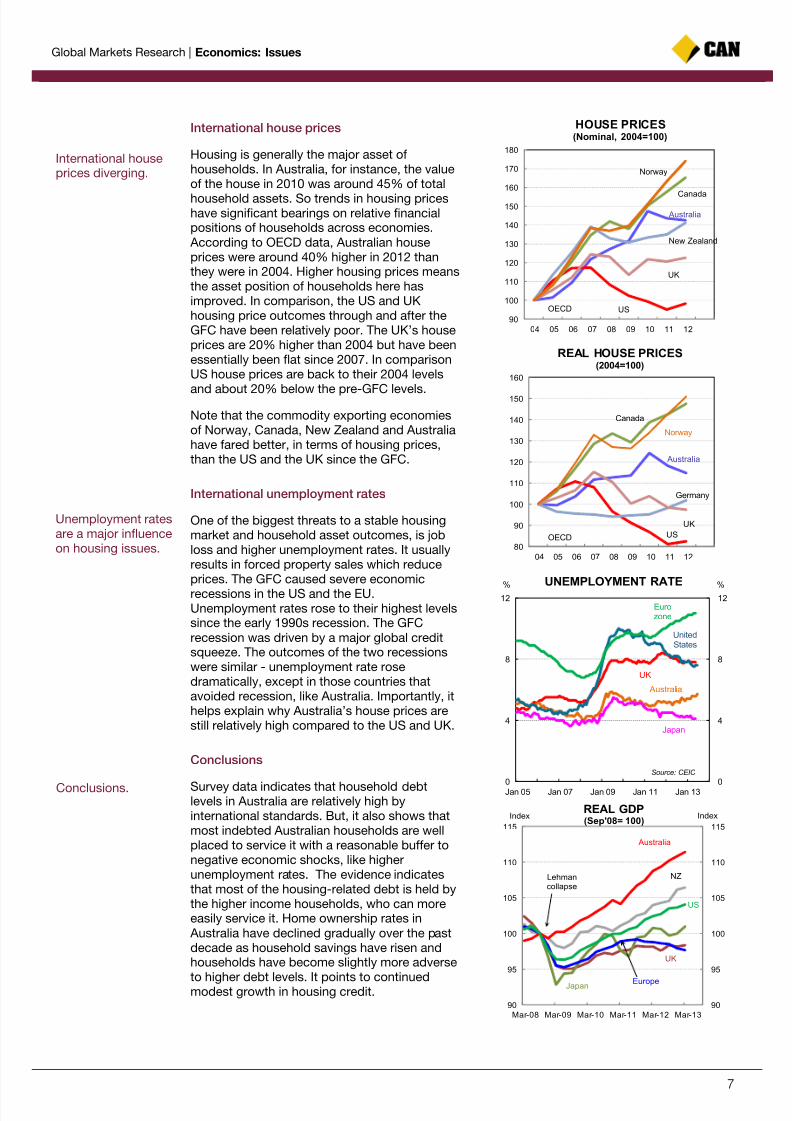
International house prices
Housing is generally the major asset ofhouseholds. In Australia, for instance, the valueof the house in 2010 was around 45% of total
household assets. So trends in housing priceshave significant bearings on relative financialpositions of households across economies. According to OECD data, Australian houseprices were around 40% higher in 2012 thanthey were in 2004. Higher housing prices meansthe asset position of households here hasimproved. In comparison, the US and UKhousing price outcomes through and after theGFC have been relatively poor. The UK’s houseprices are 20% higher than 2004 but have beenessentially been flat since 2007. In comparisonUS house prices are back to their 2004 levels
and about 20% below the pre-GFC levels.
Note that the commodity exporting economiesof Norway, Canada, New Zealand and Australiahave fared better, in terms of housing prices,than the US and the UK since the GFC.
International unemployment rates
One of the biggest threats to a stable housingmarket and household asset outcomes, is jobloss and higher unemployment rates. It usuallyresults in forced property sales which reduceprices. The GFC caused severe economic
recessions in the US and the EU.Unemployment rates rose to their highest levelssince the early 1990s recession. The GFCrecession was driven by a major global creditsqueeze. The outcomes of the two recessionswere similar - unemployment rate rosedramatically, except in those countries thatavoided recession, like Australia. Importantly, ithelps explain why Australia’s house prices arestill relatively high compared to the US and UK.
Conclusions
Survey data indicates that household debtlevels in Australia are relatively high byinternational standards. But, it also shows thatmost indebted Australian households are wellplaced to service it with a reasonable buffer tonegative economic shocks, like higherunemployment rates. The evidence indicatesthat most of the housing-related debt is held bythe higher income households, who can moreeasily service it. Home ownership rates in Australia have declined gradually over the pastdecade as household savings have risen andhouseholds have become slightly more adverse
to higher debt levels. It points to continuedmodest growth in housing credit.
90
100
110
120
130
140
150
160
170
180
04 05 06 07 08 09 10 11 12
HOUSE PRICES(Nominal, 2004=100)
New Zealand
Canada
Australia
UK
USOECD
Norway
80
90
100
110
120
130
140
150
160
04 05 06 07 08 09 10 11 12
REAL HOUSE PRICES(2004=100)
Germany
Canada
Australia
UK
USOECD
Norway
0
4
8
12
0
4
8
12
Jan 05 Jan 07 Jan 09 Jan 11 Jan 13
%%
UK
Eurozone
Source: CEIC
UNEMPLOYMENT RATE
UnitedStates
Japan
Australia
90
95
100
105
110
115
90
95
100
105
110
115
Mar-08 Mar-09 Mar-10 Mar-11 Mar-12 Mar-13
REAL GDP(Sep'08= 100)
Index Index
Japan
US
Australia
Europe
UK
NZLehmancollapse
International houseprices diverging.
Unemployment ratesare a major influenceon housing issues.
Conclusions.
7/27/2019 CBA Household Debt Trends (25 July 2013)
http://slidepdf.com/reader/full/cba-household-debt-trends-25-july-2013 8/9
Global Markets Research | Economics: Issues
8
Please view our website at www.research.commbank.com.au. The Commonwealth Bank of Australia ABN 48 123 123 124 AFSL 234945 ("the Bank") and itssubsidiaries, including Commonwealth Securities Limited ABN 60 067 254 399 AFSL 238814 ("CommSec"), Commonwealth Australia Securities LLC, CBA Europe Ltdand Global Markets Research, are domestic or foreign entities or business areas of the Commonwealth Bank Group of Companies (CBGOC). CBGOC and theirdirectors, employees and representatives are referred to in this Appendix as “the Group”. This report is published solely for informational purposes and is not to beconstrued as a solicitation or an offer to buy any securities or financial instruments. This report has been prepared without taking account of the objectives, financialsituation and capacity to bear loss, knowledge, experience or needs of any specific person who may receive this report. No member of the Group does, or is requiredto, assess the appropriateness or suitability of the report for recipients who therefore do not benefit from any regulatory protections in this regard. All recipients
should, before acting on the information in this report, consider the appropriateness and suitability of the information, having regard to their own objectives, financialsituation and needs, and, if necessary seek the appropriate professional, foreign exchange or financial advice regarding the content of this report. We believe that theinformation in this report is correct and any opinions, conclusions or recommendations are reasonably held or made, based on the information available at the time ofits compilation, but no representation or warranty, either expressed or implied, is made or provided as to accuracy, reliability or completeness of any statement madein this report. Any opinions, conclusions or recommendations set forth in this report are subject to change without notice and may differ or be contrary to the opinions,conclusions or recommendations expressed elsewhere by the Group. We are under no obligation to, and do not, update or keep current the information contained inthis report. The Group does not accept any liability for any loss or damage arising out of the use of all or any part of this report. Any valuations, projections andforecasts contained in this report are based on a number of assumptions and estimates and are subject to contingencies and uncertainties. Different assumptions andestimates could result in materially different results. The Group does not represent or warrant that any of these valuations, projections or forecasts, or any of theunderlying assumptions or estimates, will be met. Past performance is not a reliable indicator of future performance. The Group has provided, provides, or seeks toprovide, investment banking, capital markets and/or other services, including financial services, to the companies described in the report and their associates. Thisreport is not directed to, or intended for distribution to or use by, any person or entity who is a citizen or resident of or located in any locality, state, country or other
jurisdiction where such distribution, publication, availability or use would be contrary to law or regulation or which would subject any entity within the Group to anyregistration or licensing requirement within such jurisdiction. All material presented in this report, unless specifically indicated otherwise, is under copyright to theGroup. None of the material, nor its content, nor any copy of it, may be altered in any way, transmitted to, copied or distributed to any other party, without the priorwritten permission of the appropriate entity within the Group. In the case of certain products, the Bank or one of its related bodies corporate is or may be the onlymarket maker. The Group, its agents, associates and clients have or have had long or short positions in the securities or other financial instruments referred to herein,and may at any time make purchases and/or sales in such interests or securities as principal or agent, including selling to or buying from clients on a principal basisand may engage in transactions in a manner inconsistent with this report.
US Investors: If you would like to speak to someone regarding the subject securities described in this report, please contact Commonwealth Australia Securities LLC(the “US Broker-Dealer”), a broker-dealer registered under the U.S. Securities Exchange Act of 1934 (the “Exchange Act”) and a member of the Financial IndustryRegulatory Authority (“FINRA”) at 1 (212) 336-7737. This report was prepared, approved and published by Global Markets Research, a division of CommonwealthBank of Australia ABN 48 123 123 124 AFSL 234945 ("the Bank") and distributed in the U.S. by the US Broker-Dealer. The Bank is not registered as a broker-dealerunder the Exchange Act and is not a member of FINRA or any U.S. self-regulatory organization. Commonwealth Australia Securities LLC (“US Broker-Dealer”) is awholly owned, but non-guaranteed, subsidiary of the Bank, organized under the laws of the State of Delaware, USA, with limited liability. The US Broker-Dealer is notauthorized to engage in the underwriting of securities and does not make markets or otherwise engage in any trading in the securities of the subject companiesdescribed in our research reports. The US Broker-Dealer is the distributor of this research report in the United States under Rule 15a-6 of the Exchange Act andaccepts responsibility for its content. Global Markets Research and the US Broker-Dealer are affiliates under common control. Computation of 1% beneficialownership is based upon the methodology used to compute ownership under Section 13(d) of the Exchange Act. The securities discussed in this research report maynot be eligible for sale in all States or countries, and such securities may not be suitable for all types of investors. Offers and sales of securities discussed in thisresearch report, and the distribution of this report, may be made only in States and countries where such securities are exempt from registration or qualification orhave been so registered or qualified for offer and sale, and in accordance with applicable broker-dealer and agent/salesman registration or licensing requirements. Thepreparer of this research report is employed by Global Markets Research and is not registered or qualified as a research analyst, representative, or associated personunder the rules of FINRA, the New York Stock Exchange, Inc., any other U.S. self-regulatory organization, or the laws, rules or regulations of any State.
European Investors: This report is published, approved and distributed in the UK by the Bank and by CBA Europe Ltd (“CBAE”). The Bank and CBAE are bothregistered in England (No. BR250 and 05687023 respectively) and authorised and regulated in the UK by the Financial Services Authority (“FSA”). This report does not
purport to be a complete statement or summary. For the purpose of the FSA rules, this report and related services are not intended for retail customers and are notavailable to them. The products and services referred to in this report may put your capital at risk. Investments, persons, matters and services referred to in this reportmay not be regulated by the FSA. CBAE can clarify where FSA regulations apply.
Singapore Investors: This report is distributed in Singapore by Commonwealth Bank of Australia, Singapore Branch (company number F03137W) and is madeavailable only for persons who are Accredited Investors as defined in the Singapore Securities and Futures Act and the Financial Advisers Act. It has not beenprepared for, and must not be distributed to or replicated in any form, to anyone who is not an Accredited Investor.
Hong Kong Investors: This report was prepared, approved and published by the Bank, and distributed in Hong Kong by the Bank's Hong Kong Branch. The HongKong Branch is a registered institution with the Hong Kong Monetary Authority to carry out the Type 1 (Dealing in securities) and Type 4 (Advising on securities)regulated activities under the Securities and Futures Ordinance. Investors should understand the risks in investments and that prices do go up as well as down, and insome cases may even become worthless. Research report on collective investment schemes which have not been authorized by the Securities and FuturesCommission is not directed to, or intended for distribution in Hong Kong.
All investors: Analyst Certification and Disclaimer: Each research analyst, primarily responsible for the content of this research report, in whole or in part, certifies thatwith respect to each security or issuer that the analyst covered in this report: (1) all of the views expressed accurately reflect his or her personal views about thosesecurities or issuers; and (2) no part of his or her compensation was, is, or will be, directly or indirectly, related to the specific recommendations or views expressed bythat research analyst in the report. The analyst(s) responsible for the preparation of this report may interact with trading desk personnel, sales personnel and otherconstituencies for the purpose of gathering, synthesizing, and interpreting market information. Directors or employees of the Group may serve or may have served as
officers or directors of the subject company of this report. The compensation of analysts who prepared this report is determined exclusively by research managementand senior management (not including investment banking). No inducement has been or will be received by the Group from the subject of this report or its associatesto undertake the research or make the recommendations. The research staff responsible for this report receive a salary and a bonus that is dependent on a number offactors including their performance and the overall financial performance of the Group, including its profits derived from investment banking, sales and tradingrevenue.
Unless agreed separately, we do not charge any fees for any information provided in this presentation. You may be charged fees in relation to the financial products orother services the Bank provides, these are set out in the relevant Financial Services Guide (FSG) and relevant Product Disclosure Statements (PDS). Our employeesreceive a salary and do not receive any commissions or fees. However, they may be eligible for a bonus payment from us based on a number of factors relating totheir overall performance during the year. These factors include the level of revenue they generate, meeting client service standards and reaching individual salesportfolio targets. Our employees may also receive benefits such as tickets to sporting and cultural events, corporate promotional merchandise and other similarbenefits. If you have a complaint, the Bank’s dispute resolution process can be accessed on 132221.
Unless otherwise noted, all data is sourced from Australian Bureau of Statistics material (www.abs.gov.au).
7/27/2019 CBA Household Debt Trends (25 July 2013)
http://slidepdf.com/reader/full/cba-household-debt-trends-25-july-2013 9/9
Global Markets Research | Economics: Issues
9
Research
Commodities Telephone Email Address
Luke Mathews
Lachlan Shaw
Vivek Dhar
Agri Commodities
Mining & Energy Commodities
Mining & Energy Commodities
+612 9118 1098
+613 9675 8618
+613 9675 6183
Economics Telephone Email Address
Michael Blythe
Michael Workman
John Peters
Gareth Aird
Diana Mousina
Chief Economist
Senior Economist
Senior Economist
Economist
Economist
+612 9118 1101
+612 9118 1019
+612 9117 0112
+612 9118 1100
+612 9118 6394
Fixed Income Telephone Email Address
Adam Donaldson
Scott Rundell
Philip Brown
Alex StanleyTariq Chotani
Tally Dewan
Kevin Ward
Head of Debt Research
Chief Credit Strategist
Fixed Income Quantitative Strategist
Interest Rate StrategistCredit Research Analyst
Credit Research Analyst
Database Manager
+612 9118 1095
+612 9303 1577
+612 9118 1090
+612 9118 1125+612 9280 8058
+612 9118 1105
+612 9118 1960
[email protected]@cba.com.au
Foreign Exchange and International Economics Telephone Email Address
Richard Grace
Joseph Capurso
Peter Dragicevich
Andy Ji
Chris Tennent-Brown
Martin McMahon
Chief Currency Strategist & Head of International Economics
Currency Strategist
Currency Strategist
Asian Currency Strategist
FX Economist
Economist Europe
+612 9117 0080
+612 9118 1106
+612 9118 1107
+65 6349 7056
+612 9117 1378
+44 20 7710 3918
Delivery Channels & Publications Telephone Email Address
Monica Eley
Ai-Quynh Mac
Internet/Intranet
Information Services
+612 9118 1097
+612 9118 1102
New Zealand Telephone Email Address
Nick Tuffley
Jane Turner
Christina Leung
Daniel Smith
ASB Chief Economist
Economist
Economist
Economist
+649 301 5659
+649 301 5660
+649 301 5661
+649 301 5853
Sales
Institutional Telephone Equities Telephone
Syd FX
Fixed Income
Japan Desk
Melb
Lon FX
Debt & Derivatives
Credit
HK
SingNY
+612 9117 0190
+612 9117 0341
+612 9117 0020
+612 9117 0025
+613 9675 6815
+613 9675 7495
+613 9675 6618
+613 9675 7757
+44 20 7329 6266
+44 20 7329 6444
+44 20 7329 6609
+852 2844 7539
+65 6349 7074+1212 336 7750
Syd
Asia
Lon/Eu
NY
+612 9118 1446
+613 9675 6967
+44 20 7710 3573
+1212 336 7749
Corporate Telephone
NSW
VIC
SA/NT
WA
QLD
NZ
Metals Desk
Agri Desk
+612 9117 0377
+612 9675 7737
+618 8463 9011
+618 9215 8201
+617 3015 4525
+64 9375 5738
+612 9117 0069
+612 9117 0145