presents writing effective monitoring plans is needed to properly interpret your data. this workbook...
TRANSCRIPT
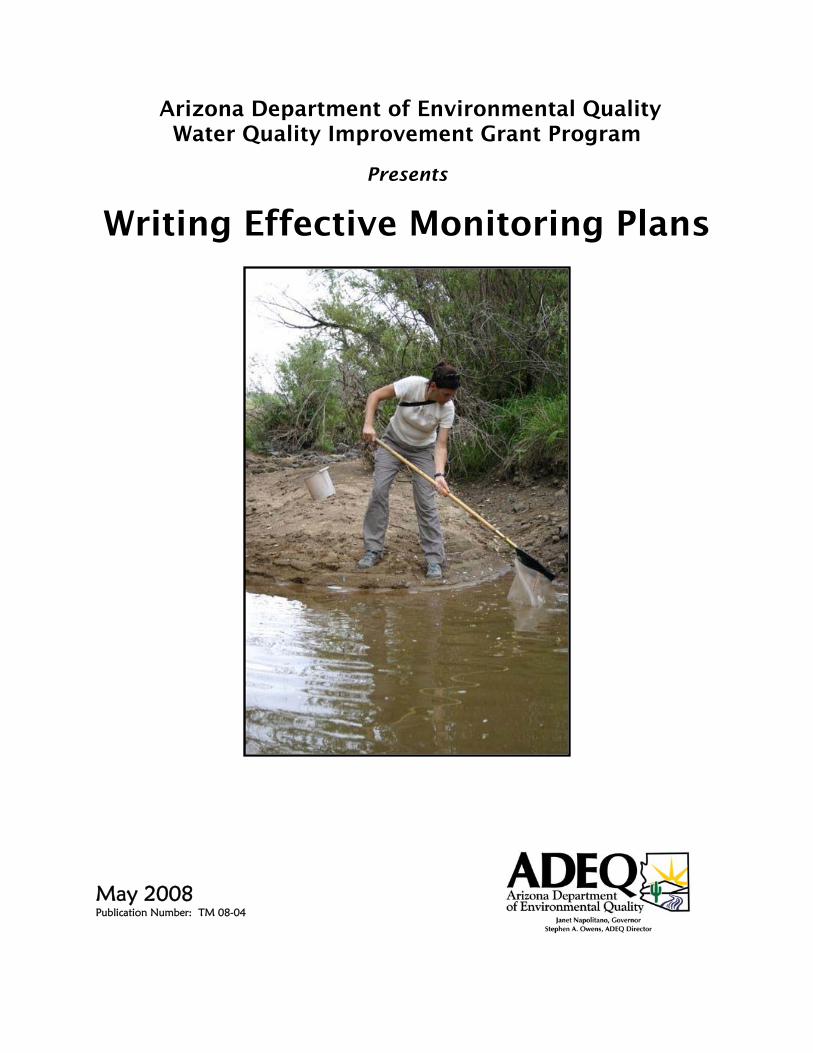
Arizona Department of Environmental Quality Water Quality Improvement Grant Program
Presents
Writing Effective Monitoring Plans
May 2008 Publication Number: TM 08-04

2
Preface Use of this Document This workbook was developed to support monitoring conducted by volunteer groups, land owners, and state, federal, or tribes for the Water Quality Improvement Grant Program (Environmental Protection Agency Clean Water Act Section 319 Grants). An electronic copy of this manual can be downloaded at the Arizona Department of Environmental Quality (ADEQ) Water Quality Improvement Grant Program website: http://www.azdeq.gov/environ/water/watershed/fin.html. It was developed to be used to fulfill grant application requirements, such as those established in ADEQ’s Water Quality Improvement Grant Manual, which can also be downloaded at that site. Grant projects include monitoring components to measure project effectiveness. Monitoring is also collected to locate project sites and reference conditions. If scientifically collected data are to be collected and interpreted a “sample analysis and quality assurance plan” (SAP/QAP) must be developed. An abbreviated monitoring plan and associated documentation must be submitted with the application, and a full SAP/QAP would be required if the grant is awarded. To develop this workbook, ADEQ used EPA’s guidance for preparing a Quality Assurance Project Plan (QAPP) reduced the technical jargon, and adjusted the text to focus more on the intended use of the data. (Start your planning with the end in mind.) EPA’s guidance can be downloaded at http://www.epa.gov/QUALITY/qapps.html. To identify projects and determine project effectiveness, a wide variety of environmental data is being collected. This includes but is not limited to: samples and field measurements of: water, sediment/soil, air pollutants, macroinvertebrates, riparian or lake vegetation, and geomorphological/habitat data (riparian, channel, and stream bank conditions). A monitoring plan is normally needed when collecting this data. Although written for the grant community, the concepts apply to a wide variety of monitoring plans. However, specific requirements for other programs are not address in this workbook. For example, monitoring to fulfill a permit requirement usually has stated specific minimum pollutants, frequency of monitoring, and site locations that must be included in the monitoring project. This workbook will provide a good starting point for these sample plans and may help you determine whether additional monitoring is needed to properly interpret your data. This workbook does not provide monitoring protocol information. A manual of field monitoring procedures used by ADEQ staff can be downloaded at: http://www.azdeq.gov/environ/water/assessment/monitoring.html. EPA’s guidance for volunteer monitoring can be downloaded at http://www.epa.gov/volunteer.
3
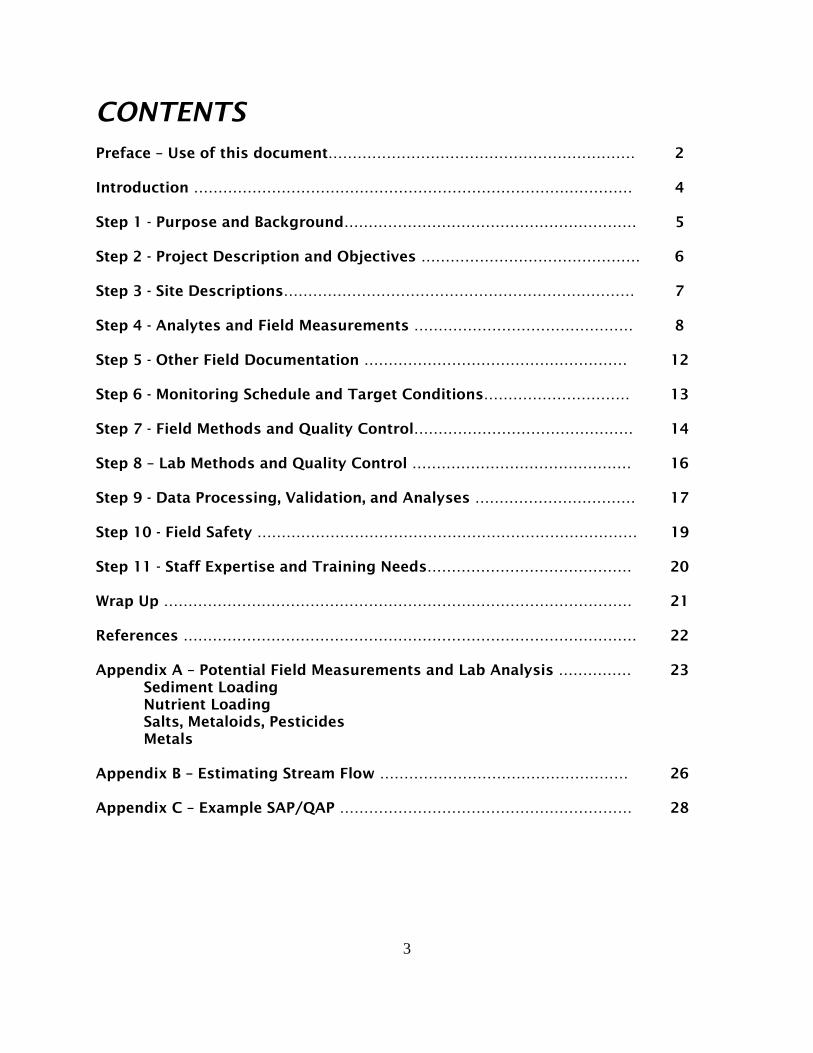
CONTENTS Preface – Use of this document……………………………………………………… 2 Introduction ……………………………………………………………………………… 4 Step 1 - Purpose and Background…………………………………………………… 5 Step 2 - Project Description and Objectives ……………………………………… 6 Step 3 - Site Descriptions……………………………………………………………… 7 Step 4 - Analytes and Field Measurements ……………………………………… 8 Step 5 - Other Field Documentation ……………………………………………… 12 Step 6 - Monitoring Schedule and Target Conditions………………………… 13 Step 7 - Field Methods and Quality Control……………………………………… 14 Step 8 – Lab Methods and Quality Control ……………………………………… 16 Step 9 - Data Processing, Validation, and Analyses …………………………… 17 Step 10 - Field Safety …………………………………………………………………… 19 Step 11 - Staff Expertise and Training Needs…………………………………… 20 Wrap Up …………………………………………………………………………………… 21 References ………………………………………………………………………………… 22 Appendix A – Potential Field Measurements and Lab Analysis …………… 23 Sediment Loading Nutrient Loading Salts, Metaloids, Pesticides Metals Appendix B – Estimating Stream Flow …………………………………………… 26 Appendix C – Example SAP/QAP …………………………………………………… 28
4
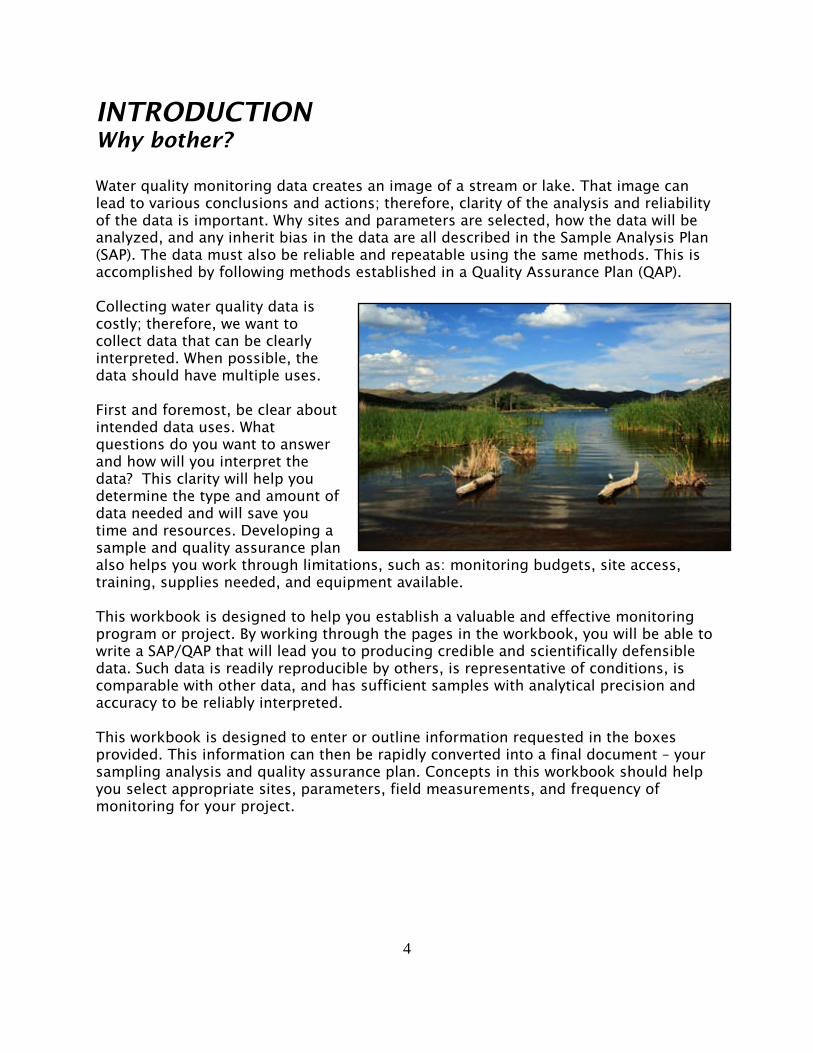
INTRODUCTION Why bother? Water quality monitoring data creates an image of a stream or lake. That image can lead to various conclusions and actions; therefore, clarity of the analysis and reliability of the data is important. Why sites and parameters are selected, how the data will be analyzed, and any inherit bias in the data are all described in the Sample Analysis Plan (SAP). The data must also be reliable and repeatable using the same methods. This is accomplished by following methods established in a Quality Assurance Plan (QAP). Collecting water quality data is costly; therefore, we want to collect data that can be clearly interpreted. When possible, the data should have multiple uses. First and foremost, be clear about intended data uses. What questions do you want to answer and how will you interpret the data? This clarity will help you determine the type and amount of data needed and will save you time and resources. Developing a sample and quality assurance plan also helps you work through limitations, such as: monitoring budgets, site access, training, supplies needed, and equipment available. This workbook is designed to help you establish a valuable and effective monitoring program or project. By working through the pages in the workbook, you will be able to write a SAP/QAP that will lead you to producing credible and scientifically defensible data. Such data is readily reproducible by others, is representative of conditions, is comparable with other data, and has sufficient samples with analytical precision and accuracy to be reliably interpreted. This workbook is designed to enter or outline information requested in the boxes provided. This information can then be rapidly converted into a final document – your sampling analysis and quality assurance plan. Concepts in this workbook should help you select appropriate sites, parameters, field measurements, and frequency of monitoring for your project.

5
STEP ONE: Purpose and Background
Describe the water quality concern, its historic context, and monitoring purposes. • What is already known (sources, activities, land uses, changes in the watershed)? • Past efforts to control the issue or concern (what and when)? • Who might be concerned with the outcome of data analyses (land owners, an agency, an
interest group)? • What decisions might be based on the data analysis and who would make those
decisions? • Past monitoring - who, parameters, where, frequency? What will the proposed
monitoring add? • Who is sponsoring this monitoring and why? Is there a mandate to monitor?
Your monitoring purpose and background information. Add pictures and maps. (Change box size as needed)

6
STEP TWO: Objectives and Project Description Briefly describe the project. Be clear about the desired outcomes and products. Be specific about the type, amount, and quality of data needed. Ask yourself:
• What should the monitoring accomplish (desired outcomes)? (Hint: Writing a report is not an outcome.)
• What questions need to be answered and what information is needed to support a decision?
• What type of analysis do you intend to do? How much data is needed? What standards may apply to the data? Will you compare data collected before to after a project or upstream and downstream of a project? What statistics will be used?
• Who else might use the results and what data and meta-data do they need? • What level of accuracy is needed
Describe the project and monitoring objectives (change box size as needed)

7
STEP THREE: Site Descriptions Provide monitoring site information. Indicate why each site was selected. Include geographic coordinates (latitude/longitude) and attach a topographic map showing monitoring sites, improvement projects, critical sites, reference sites, and other relevant information. In selecting the number and location of sites consider:
• Critical or Key sites – Locations with measurable degradation. These are critical to locate to be able to evaluate project effectiveness.
• Reference sites – Sites showing target conditions for improvements. Reference sites sometimes have to be located in a comparable drainage area.
• Access to the site – Physical access, safety concerns and land owner’s permission • Screening or targeted concerns -- Random selection of sites within a drainage area will
support making general statements about water quality. Targeted monitoring is needed to evaluate effectiveness or impacts from specific discharges.
• Bracketing sites – Data from sites above and below an improvement project or potential source can determine the effectiveness of a project or impacts from a source.
• Flow –The amount and type of flow (perennial, intermittent, or ephemeral) will limit applicable monitoring methods
• Representativeness – More that one site may be necessary to represent larger and more complex lakes and stream reaches. Structures and hydrological conditions (e.g., bridges, dams, tributary inflows, discharges) will affect water quality results.
Provide monitoring site information (change box size as needed)
8
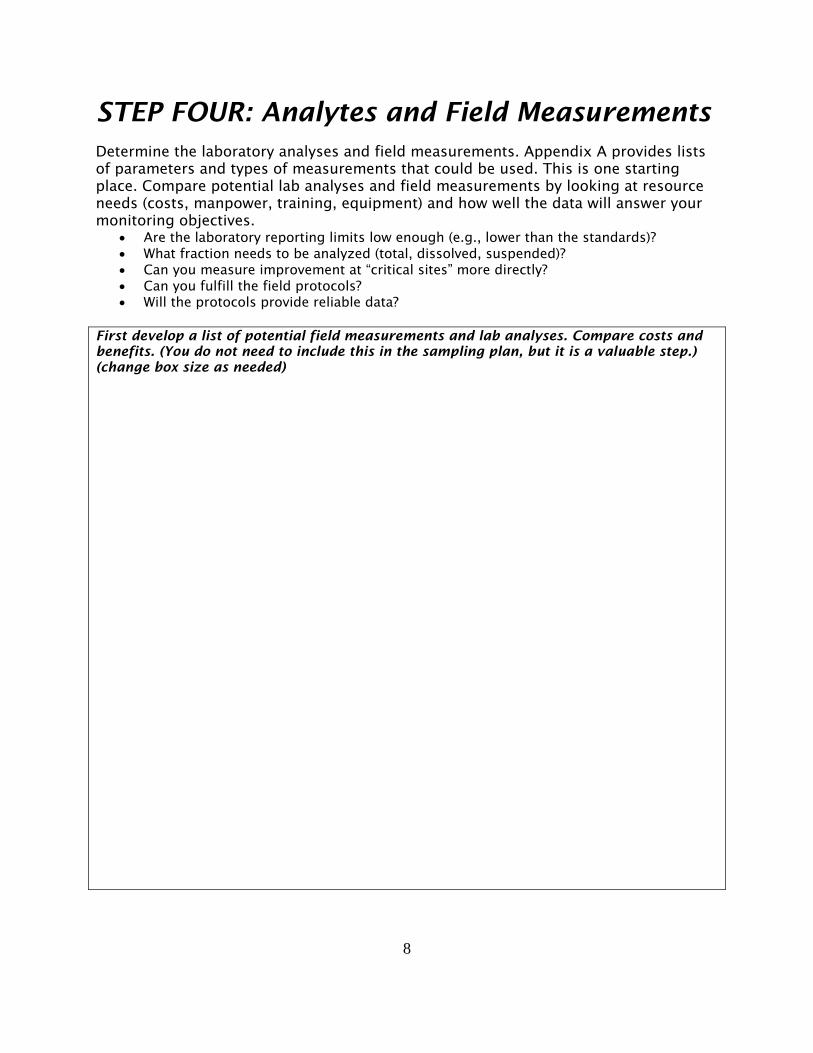
STEP FOUR: Analytes and Field Measurements Determine the laboratory analyses and field measurements. Appendix A provides lists of parameters and types of measurements that could be used. This is one starting place. Compare potential lab analyses and field measurements by looking at resource needs (costs, manpower, training, equipment) and how well the data will answer your monitoring objectives.
• Are the laboratory reporting limits low enough (e.g., lower than the standards)? • What fraction needs to be analyzed (total, dissolved, suspended)? • Can you measure improvement at “critical sites” more directly? • Can you fulfill the field protocols? • Will the protocols provide reliable data?
First develop a list of potential field measurements and lab analyses. Compare costs and benefits. (You do not need to include this in the sampling plan, but it is a valuable step.) (change box size as needed)

9
Select the best field measurements and/or lab analyses. Explain why each was selected and how results for each will be interpreted (change box size as needed)
Provide a table or series of tables showing information about each parameter or field measurement: equipment, holding times, detection limits, standards, etc.
Example Lab Samples Table Parameter (fraction)
Container Preservation Holding Time
Lab Method Lab Reporting Limit
Applicable Standard * or Other Criteria
Phosphorus (t) 500 ml plastic bottle
Cool H2SO4 to pH <2 28 days
EPA 360.1 0.05 mg/L 1.0 mg/L*
Arsenic (t) 500 ml plastic bottle
HNO3 to pH <2 6 months
EPA 200.7 5 µg/L 50 µg/L* (30 µg/L)#
Mercury (d) 500 ml plastic bottle
HNO3 to pH <2 6 months
EPA 245.2 0.2 µg/L 0.01 µg/L*
Total Kjeldahl nitrogen (TKN) (t)
500 ml plastic bottle
Cool H2SO4 to pH <2 28 days
EPA 351.1 0.05 mg/L
Nitrate/nitrite 500 ml plastic bottle
Cool H2SO4 to pH <2 28 days
EPA 300.0 0.01 mg/L
3 mg/L* (Combining
TKN and N02/NO3
results)
Suspended sediment concentration
500 ml plastic bottle
Cool 10 days
(Need to add info here) 10 mg/L 80 mg/L* (geometric
mean of minimum of 4
samples at normal flow)
Macroinvertebrates Kick nets One liter bottles with preservative
99% isopropynol or ethanol
Taxonomy – genus level for insects
Index of Bio Integrity > 50
*Arizona Surface Water Quality Standards. # Proposed Arsenic standard is 30 μg/L (full body contact) ## ADEQ has a proposed biocriteria for Aquatic and Wildlife Warmwater of 50

10
Example Field Samples Table Parameter
Equipment Equipment Accuracy
and Range Comments Applicable Standard *
or Other Criteria Flow Marsh-McBirney
Flow Meter +/- 2% of reading Range 0.05 to 19.99 cfs
Calibrate <24 hours No standards
Dissolved oxygen (DO) +/- 0.2 mg/L Calibrate <24 hours 6.0 mg/L * Percent saturation DO Calibrate <24 hours (If =/>90% saturation,
low DO is accepted)* pH +/- 0.2 mg/L Calibrate <24 hours >6.5 and <9.0 * Total dissolved solids (TDS)
Hydrolab
Calibrate <24 hours 1000 mg/L (for crop production)
E. coli bacteria Colilert <1 – 2490 CFU/100 ml Holding time < 6 hours, will plate
sample and incubate using field generator
245 CFU*
Bottom Deposits Ruler and measuring tape
Standard to be adopted in 2007
Habitat and vegetation Forms Have field sheets and trained staff
Part of biocriteria protocols
*Arizona Surface Water Quality Standards
Flow Data The importance of flow data for interpreting water quality data in streams cannot be over emphasized. If a flow meter is not available, flow may be estimated using recognized methods (see Appendix B).
List your lab sample and field sample information (change table size as needed)
Lab Samples Table Parameter (fraction)
Container Preservation Holding Time
Lab Method Lab Reporting Limit
Applicable Standard *
Or Other Criteria

11
Example Field Samples Table
Parameter
Equipment Equipment Accuracy and Range
Comments Applicable Standard * or Other Criteria
Develop a check list of the equipment and supplies needed in the field (e.g., ice, coolers, sample bottles, chain of custody forms, field notebook, flow meter, Hydrolab, Colilert equipment, generator, reagents, safety equipment, repair tools, etc.). Field Check List (change box size as needed)

12
STEP FIVE: Other Field Documentation Identify information that will need to be tracked during the project to properly interpret the results. Provide examples of field forms. To facilitate data tracking, you may want to codify common entries. At a minimum you need to track:
• Hydrologic conditions; • Weather conditions (recent past and current); • Activities and land uses; • Equipment issues; • Protocol modifications; • Stream flow or maximum lake depth; • Sample depth, if a lake sample; and • Sample ID, date, and time collected.
Describe the supporting data that will be collected (change box size as needed)

13
STEP SIX: Schedule and Target Conditions Describe the when and how often samples be collected. Will monitoring be targeting specific conditions? Consider the following when scheduling monitoring:
• Critical conditions – Conditions when exceedances have occurred in the past (e.g., low flows, high flows, summer season, certain locations). Samples need to be collected during these conditions to determine effectiveness of watershed improvements.
• If characterizing a watershed, sample during a variety of conditions. Be sure to represent seasons and variation in flow. If monitoring a lake, sample various lake depths.
• Consider safety and potential conditions at the site if sudden torrential rain events. • Do the sampling protocols or standards establish a peak season or minimum number of
samples? For example, biocriteria samples must be collected in the spring, in riffle or runs (not pools), and at least 4 weeks after a bankfull flood event.
Describe the monitoring schedule and target conditions (change box size as needed)

14
STEP SEVEN: Field Protocols Field methods – Reference or describe field protocols for collecting the samples -- how each type of sample is to be collected. Do not repeat information provided in other documents, reference them. A field manual that describes protocols, equipment calibration, quality control and quality assurance procedures (next section) and other details is strongly recommended and should be taken into the field. Lab methods – These were identified in Step 4 Describe standard operating procedures (SOPs) or field methods. Cite reference documents (change box size as needed)
15
STEP EIGHT: Quality Assurance and Control An important part of the sampling plan is the Quality Assurance Plan (QAP), which describes the system used to determine whether the data meets the requirements of your project in terms of precision, accuracy, representativeness, completeness, and comparability. Quality control (QC) procedures, the routine activities used to identify and correct errors, are also included in the QAP. Field Quality Assurance – At a minimum, the quality assurance section of the plan should include the following information concerning quality assurance: (Reference existing applicable documents rather than restating information.)
• Equipment testing, inspection, and maintenance • Sample identification -- Methods to label samples. Indicate what will be on the
label. • Tracking samples -- Procedures for tracking samples to be delivered to a laboratory
for analysis. Include any chain-of-custody forms or written procedures. • Quality control samples – These samples help identify when and how
contamination might occur. Usually, one in ten samples is a split or duplicate. They are used to determine whether to accept or reject all or a portion of the data. (A general rule is that variation in duplicates or splits should not exceed 10%.) o Duplicate – Two samples taken at the same time and site that are analyzed in an
identical manner. o Split – A sample that is divided into two or more sub-samples and analyzed by
different analysts or laboratories. o Field Blank – A “clean” sample (e.g., distilled water) that is analyzed with the
other samples to detect contaminants introduced during the monitoring process.
Describe how often QC samples will be collected and the routine inspection, calibration, and maintenance of field equipment. Identify what spare parts and replacement equipment will be on hand. (Change box size as needed)
16
Laboratory Quality Assurance – Laboratory analysis should be conducted by a laboratory certified by ADHS, a federal lab, or other laboratory approved by ADEQ, which have Quality Assurance Plans. Simply reference these plans. If the laboratory is not certified, you will need to include the following information that is normally found in a quality assurance plan:
• The number and type of quality control samples (field blanks, travel blanks, equipment blanks, method blanks, and more);
• Procedures for testing inspecting and maintaining lab equipment and facilities; • Training and safety; • Calibration of laboratory equipment; and • Sample equipment decontamination and waste disposal procedures.
If a certified or federal laboratory, provide the laboratory name and address and the date the plan was created or last revised. Provide contact information for a point of contact at the laboratory If not a certified lab, provide the quality assurance information indicated in the paragraph above this box. (change box size as needed)
17
STEP NINE: Data Processing, Quality Assurance, and Analyses Data Processing -- Trace the path your data will take from field collection and lab analyses to data storage and use. Describe methods for recording information concerning the site and the sample visit (field logbooks, field forms, photographs, site sketches) and that will unite critical field information with laboratory analyses. Provide examples of forms, spreadsheets, or checklists to be used. Reference documents where appropriate.
• How will you track your field and laboratory data and comments? • Who will do data entry?
Describe the data tracking system (change box size as needed)
Data Quality Assurance -- Describe how data validity will be determined (accuracy, completeness, representativeness).
• How you will determine whether data is accepted or rejected? • How will duplicate, split, and blank results be used to qualify the data? • Who is responsible for data validation before data use or distribution? • What will happen if data validity issues occur?
Describe data review and validation procedures (change box size as needed)
18
Data Analysis - Building on information in STEP 2 (Objectives), provide information concerning data analysis methods.
• What statistical analyses will be used? • What level of change will determine success or failure? • What standards will be applied?
Describe data analyses methods (change box size as needed)
Reports - Describe the intended frequency, content, and distribution of reports.
• If standards are exceeded, who will be notified? • Will standard exceedances result in verification monitoring?
Describe intended reports (change box size as needed)

19
STEP TEN: Field Safety Provide a field safety plan, identifying the location and telephone number of the nearest medical center(s). At a minimum field teams should always carry a well equipped first aid kit, adequate water, and vehicle repair equipment. Field teams should be given field safety training. Describe the field safety plan (change box size as needed)

20
STEP ELEVEN: Staff Expertise and Training Needs
Identify training needs based on the training and experience of monitoring staff and volunteers. Include field safety training. Describe how training will be obtained.
Be sure that monitoring staff are familiar with the monitoring protocols, the sample plan, and the quality assurance plan. All field monitoring staff should have a copy of applicable protocols and sample plans. Describe training needs (change box size as needed)
If monitoring will be accomplished by non-professional staff, how will oversight by professional monitoring entities be provided? Describe strategy to provide support and appraisal of any non-professional field work (change box size as needed)

21
Wrap Up Careful thought given to preparing and implementing a thorough monitoring plan will help ensure the development of credible and scientifically defensible data. Such data can answer important questions concerning water quality and the effectiveness of our efforts to maintain high quality surface water and reduce pollutant loadings. A “Sampling Analysis and Quality Assurance Plan” documents the purpose of the monitoring, field and lab methods that will be followed, and methods that will be used to track and analyze the data. It functions as a written agreement; therefore, it needs to be signed and dated by responsible parties and distributed to all involved.

22
Example Monitoring Plan – An example monitoring plan is provided in Appendix C. The monitoring purpose and complexity of the field measurements and lab analyses will dictate the level of detail required. The example is only for monitoring bacteria for one season at a few sites. (The original submittal was modified and simplified as an example for this manual.)
Your plan is not limited to the information requested in this manual, nor are you limited to the types of monitoring suggested in Appendix A. Use the sample plan development process to determine the most efficient use of your time and resources that in the end will answer your questions.
REFERENCES
ADEQ, 2005. A Manual of Procedures for the Sampling of Surface Waters (streams). Download from ADEQ’s website at: http://www.azdeq.gov/environ/water/assessment/download/sampling.pdf
EPA, 1996. The Volunteer Monitor’s Guide to Quality Assurance Project Plans. Download from EPA’s website at: http://www.epa.gov/owow/monitoring/volunteer/qappcovr.htm
EPA, 2006. Volunteer Lakes Monitoring: A Methods Manual. Download from EPA’s website at: http://www.epa.gov/owow/monitoring/lakevm.html

23
Appendix A Potential Field Measurements and Lab Analysis Based on Pollutant Sources This is not a comprehensive list, just a starting point. Other measurements or analyses may be appropriate due to types of discharge or to help characterize the water quality (e.g., anions and cations, TDS). These are suggested due to ease of monitoring, standards or clear criteria for interpreting data, monitoring costs, and use in Arizona. This appendix does not apply to compliance monitoring for permitted facilities.
SEDIMENT LOADING
MEASUREMENT
METHOD EQUIPMENT, PROTOCOLS, LAB COSTS
STANDARDS OR EVALUATION CRITERIA
COMMENTS
Habitat Evaluation Field sample sheets
Used to determine if Index of Biointegrity is applicable and to complete bioassessment.
Macroinvertebrate Community Based Bioassessments
Nets, sample bottles with preservative. High lab costs. ADEQ’s protocols.
Proposed biocriteria to be adopted in 2007. Must use ADEQ protocols to apply Index of Biointegrity (standards).
Collect samples only in spring, riffle area, wadeable, perennial streams with appropriate habitat. Requires associated habitat evaluation. ADEQ to establish screening level Bioassessment Protocols (2007).
Percent Fines 50 foot measuring tape, and ruler
Proposed standard to be adopted in 2007. Must use ADEQ protocols to apply standards.
Collect samples in perennial, wadeable stream reaches. Collect generally once every five years. If not meeting standards may need to repeat to confirm problem.
Riparian Area Condition
Field sheets, training, auditing for consistency
No standards. BLM/USFS “Proper Functioning Condition of Riparian Areas” provides evaluation criteria
Requires a team of people trained in this type of evaluation.
Suspended Sediment Concentration (SSC)
Sample bottles. Moderate lab costs
Geometric mean of 4 samples = 80 mg/L [Standard change proposed: 25 mg/L if coldwater fishery]
Applies during normal flow, but not during or immediately after rain events. Does not apply in lakes.
Turbidity
Turbidity meter or lab No standards or criteria Rule of thumb – A. Less than 10% change if
upstream is 10 NTU or higher.
Use above and below a potential discharge during rain event. Field equipment accuracy (2.0 NTU) should be considered.
24
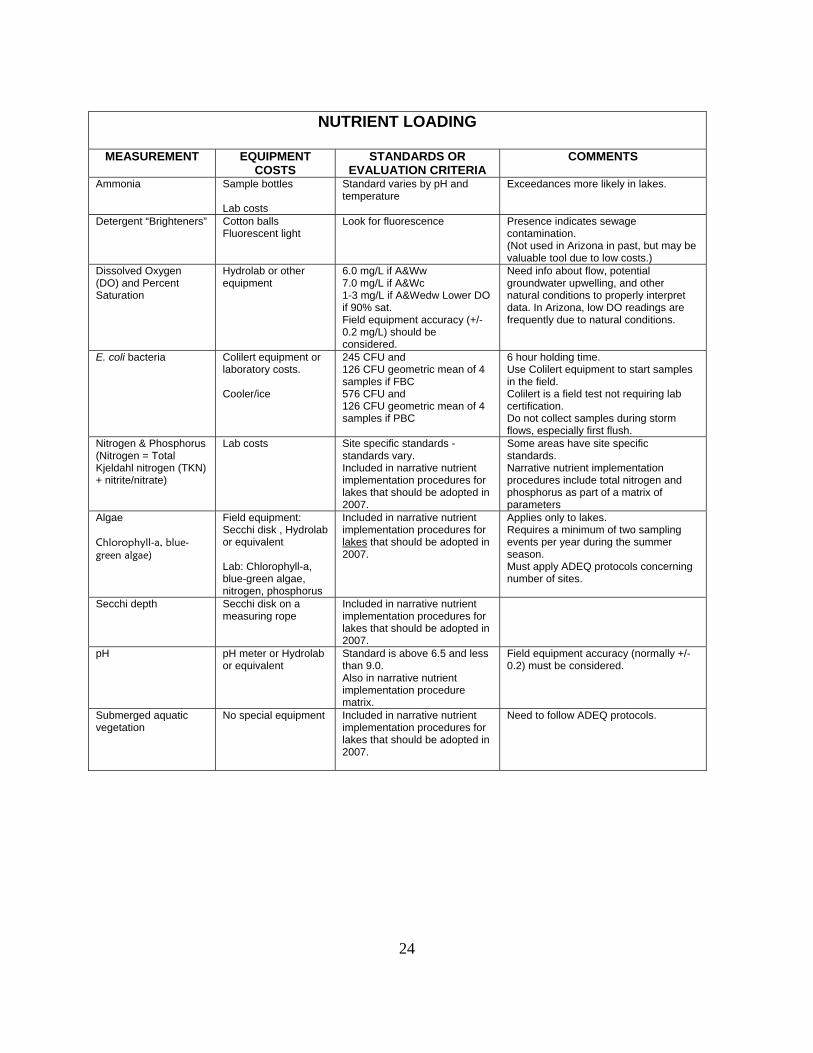
NUTRIENT LOADING
MEASUREMENT EQUIPMENT
COSTS STANDARDS OR
EVALUATION CRITERIA COMMENTS
Ammonia Sample bottles Lab costs
Standard varies by pH and temperature
Exceedances more likely in lakes.
Detergent “Brighteners” Cotton balls Fluorescent light
Look for fluorescence
Presence indicates sewage contamination. (Not used in Arizona in past, but may be valuable tool due to low costs.)
Dissolved Oxygen (DO) and Percent Saturation
Hydrolab or other equipment
6.0 mg/L if A&Ww 7.0 mg/L if A&Wc 1-3 mg/L if A&Wedw Lower DO if 90% sat. Field equipment accuracy (+/- 0.2 mg/L) should be considered.
Need info about flow, potential groundwater upwelling, and other natural conditions to properly interpret data. In Arizona, low DO readings are frequently due to natural conditions.
E. coli bacteria Colilert equipment or laboratory costs. Cooler/ice
245 CFU and 126 CFU geometric mean of 4 samples if FBC 576 CFU and 126 CFU geometric mean of 4 samples if PBC
6 hour holding time. Use Colilert equipment to start samples in the field. Colilert is a field test not requiring lab certification. Do not collect samples during storm flows, especially first flush.
Nitrogen & Phosphorus (Nitrogen = Total Kjeldahl nitrogen (TKN) + nitrite/nitrate)
Lab costs Site specific standards - standards vary. Included in narrative nutrient implementation procedures for lakes that should be adopted in 2007.
Some areas have site specific standards. Narrative nutrient implementation procedures include total nitrogen and phosphorus as part of a matrix of parameters
Algae Chlorophyll-a, blue-green algae)
Field equipment: Secchi disk , Hydrolab or equivalent Lab: Chlorophyll-a, blue-green algae, nitrogen, phosphorus
Included in narrative nutrient implementation procedures for lakes that should be adopted in 2007.
Applies only to lakes. Requires a minimum of two sampling events per year during the summer season. Must apply ADEQ protocols concerning number of sites.
Secchi depth Secchi disk on a measuring rope
Included in narrative nutrient implementation procedures for lakes that should be adopted in 2007.
pH pH meter or Hydrolab or equivalent
Standard is above 6.5 and less than 9.0. Also in narrative nutrient implementation procedure matrix.
Field equipment accuracy (normally +/- 0.2) must be considered.
Submerged aquatic vegetation
No special equipment Included in narrative nutrient implementation procedures for lakes that should be adopted in 2007.
Need to follow ADEQ protocols.

25
SALTS, METALOIDS, PESTICIDES
MEASUREMENT EQUIPMENT,
COSTS STANDARDS OR
EVALUATION CRITERIA COMMENTS
Selenium (total)
Sample bottles Cooler with ice Lab costs
2 µg/L chronic A&W 20 µg/L acute A&W 20 µg/L AgI 33 µg/L A&We 50 µg/L DWS, AgL, & A&Wedw 10,300 µg/L FC 42,000 µg/L FBC/PBC
Lab reporting limits need to be below 0.2 µg/L.
pH pH meter, Hydrolab (etc)
Standard is above 6.5 and less than 9.0.
Field equipment accuracy (normally +/- 0.2) must be considered.
Total Dissolved Solids Hydrolab or lab Standards only on Colorado River at specific sites
Compare upstream/downstream samples.
Pesticides In water or fish tissue
Shocker and nets Special permit for collection. Expensive lab costs.
Standards in water. Other criteria for fish tissue from US Fish and Wildlife Service and National Science Foundation.
METALS
MEASUREMENT EQUIPMENT,
COSTS STANDARDS OR
EVALUATION CRITERIA COMMENTS
Mercury Total, dissolved, and methylmercury in fish tissue
Equipment and special permits required to collect fish. Expensive lab costs
Standards vary by designated use and fraction. 0.01 µg/L dissolved mercury - chronic A&W Fish tissue standard to be adopted in 2007
Mercury becomes methylmercury and attaches to tissue. Not likely to detect in water samples. Need to use “clean hands” techniques for dissolved mercury samples.
Metals (Cadmium, copper, zinc, selenium) Both total and dissolved fractions
Sample bottles Preservatives, Cooler and ice Lab costs
Standards vary by designated uses. Several dissolved metal standards are dependent on hardness at time.
Lab reporting limits need to be below standards. Must collect hardness to determine standard. Consider critical conditions and locations (when and where exceedances occurred).
pH pH meter, Hydrolab (etc)
Standard is above 6.5 and less than 9.0.
Note field equipment accuracy (normally +/- 0.2).
Selenium (total)
Sample bottles and preservative Cooler and ice Lab costs
3 µg/L chronic A&W 20 µg/L acute A&W 20 µg/L AgI 33 µg/L A&We 50 µg/L DWS, AgL, & A&Wedw 10,300 µg/L FC 42,000 µg/L FBC/PBC
Lab reporting limits need to be below 0.2 µg/L.
Total Dissolved Solids Hydrolab or Sample bottles, Cooler/ice and lab costs.
Standards only on Colorado River at specific sites
Compare upstream/downstream samples.
Note: Volunteers should not monitor around mines, even historic mining operations, due to potentially hazardous toxic substances and property right issues.

26
Appendix B Estimating Stream Flow
Float Method
When a flow meter is not available, stream discharge can be accurately estimated using a float and measuring the average depth and width of the stream.
Equipment: A measuring tape, a timer, 5-10 floats. For floats, use an orange peel, a water-soaked block of wood, or other natural material that sinks at least halfway into the water, is visible from shore, not influenced by wind, and is expendable and non-polluting.
1. Measure and mark two points along the length of the channel, at least two or three channel widths apart, at the channel cross-section.
2. Observer #1 tosses the float into the channel above the marker and calls out when it crosses the upstream point.
3. Observer #2 starts the timer based on the upstream observers signal, and when the float passes the downstream point stops the timer and records the time.
4. Repeat the procedure 5 to 10 times, tossing the floats a different distance from the bank to obtain an average of velocities.
5. Convert into velocity by dividing the distance in feet by speed in seconds. (Example: 20 feet / 10 seconds = 2 ft/sec.)
6. Determine the mean velocity at the surface (sum of velocities / number of measurements).
7. Convert the velocity at the surface to a velocity at mid depth by multiplying the mean surface velocity by a coefficient of 0.85. (Example: mean velocity 3.2 ft/sec X 0.85 = 2.72 ft/sec.) (This is not done when flows are mere trickles.)
8. Estimate the cross-sectional area of the stream by measuring the stream width and the average depth in feet. Calculate the average depth from depths measured at 1- to 2-foot intervals. (Example: Width 8.3 feet x average depth 0.54 feet = 4.15 ft2.) If unsafe wading conditions, record the velocity and return to the site under favorable conditions.
9. Calculate the discharge in cubic feet per second (cfs) by multiplying the velocity (ft/sec) by the cross-sectional area (ft2). (Example: 2.72 ft/sec x 4.15 ft2 = 11.29 cfs.) Record this on a field sheet with date, time, and location.

27
USGS Staff Gauge Method
At sites located near or next to a US Geological Survey (USGS) gauging station, a discharge measurement can be made by recording the time of day and the staff gauge height. On the USGS web page (waterdata.usgs.bov/nwis/), find the gauging station and determine the discharge from the table provided.
Volumetric Measurement Method
For small discharges a volumetric measurement is the most accurate method. In this method, simply measure the time required to fill a container of known volume.
Volumetric measurements are usually made where the flow is concentrated in a narrow stream, or the stream can be concentrated or diverted into a container. For example: v-notch weir or other artificial control structure where all the flow is confined into a notch.
28
Appendix C Example SAP/QAP
MONITORING THE SANTA CRUZ RIVER AT
TUMACACORI NATIONAL HISTORICAL PARK
Effective (Date)
Prepared by
(Agency)

29
APPROVALS
The following staff of the National Park Service, Tumacacori National Historical Park, attests that this Sampling Analysis Plan and Quality Assurance Plan accurately documents the monitoring activities conducted by their staff and FOSCR volunteers on the Santa Cruz River in the park. The elements of this plan will be followed when collecting and analyzing surface water quality samples. (Name) Resource Program Manager National Historical Park Signed: ________________________ Date _________________ (Name) Superintendent Tumacacori National Historical Park Signed: _________________________ Date _________________ Distribution list: (Names)

30
Table of Contents
Page number
Approvals X History and Purpose X Monitoring Objectives and Project Description X Site Description X
Map of sites
Analytes and Field Measurements X Other Field Documentation X Monitoring Schedule and Target Conditions X
Field Methods and Quality Control X
Laboratory Analytical Methods and Quality Control X Data Processing, Quality Assurance, and Analysis X Data Use, Notifications, Data Reports, Recipients X Staff Expertise and Training X Field Safety X Project Organization X References X
31
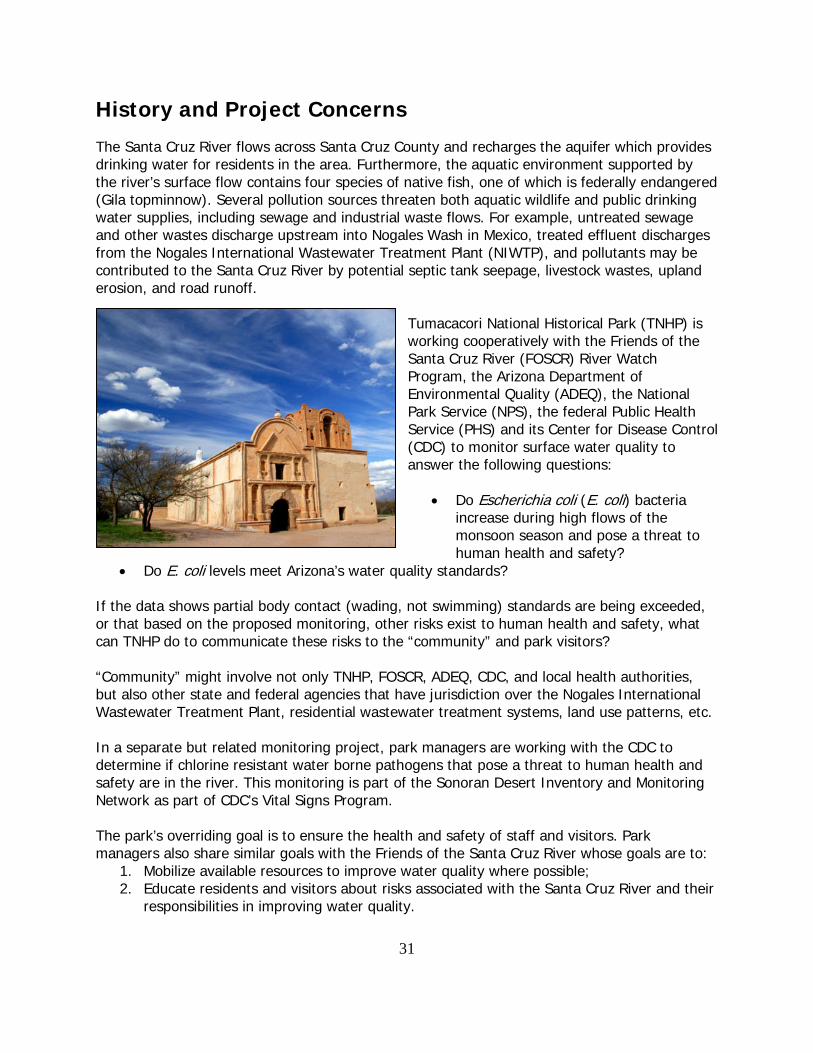
History and Project Concerns The Santa Cruz River flows across Santa Cruz County and recharges the aquifer which provides drinking water for residents in the area. Furthermore, the aquatic environment supported by the river’s surface flow contains four species of native fish, one of which is federally endangered (Gila topminnow). Several pollution sources threaten both aquatic wildlife and public drinking water supplies, including sewage and industrial waste flows. For example, untreated sewage and other wastes discharge upstream into Nogales Wash in Mexico, treated effluent discharges from the Nogales International Wastewater Treatment Plant (NIWTP), and pollutants may be contributed to the Santa Cruz River by potential septic tank seepage, livestock wastes, upland erosion, and road runoff.
Tumacacori National Historical Park (TNHP) is working cooperatively with the Friends of the Santa Cruz River (FOSCR) River Watch Program, the Arizona Department of Environmental Quality (ADEQ), the National Park Service (NPS), the federal Public Health Service (PHS) and its Center for Disease Control (CDC) to monitor surface water quality to answer the following questions:
• Do Escherichia coli (E. coli) bacteria increase during high flows of the monsoon season and pose a threat to human health and safety?
• Do E. coli levels meet Arizona’s water quality standards? If the data shows partial body contact (wading, not swimming) standards are being exceeded, or that based on the proposed monitoring, other risks exist to human health and safety, what can TNHP do to communicate these risks to the “community” and park visitors? “Community” might involve not only TNHP, FOSCR, ADEQ, CDC, and local health authorities, but also other state and federal agencies that have jurisdiction over the Nogales International Wastewater Treatment Plant, residential wastewater treatment systems, land use patterns, etc. In a separate but related monitoring project, park managers are working with the CDC to determine if chlorine resistant water borne pathogens that pose a threat to human health and safety are in the river. This monitoring is part of the Sonoran Desert Inventory and Monitoring Network as part of CDC’s Vital Signs Program. The park’s overriding goal is to ensure the health and safety of staff and visitors. Park managers also share similar goals with the Friends of the Santa Cruz River whose goals are to:
1. Mobilize available resources to improve water quality where possible; 2. Educate residents and visitors about risks associated with the Santa Cruz River and their
responsibilities in improving water quality.

32
Controlling Pollutant Sources - The Nogales International Wastewater Treatment Plant, situated six miles north of the city of Nogales, Arizona, discharges approximately 14 million gallons per day of secondary treated effluent into the Santa Cruz River. This discharge provides perennial flow to what would normally be an ephemeral segment of the Santa Cruz River (ephemeral since groundwater pumping increases in the 1950’s). Some of the water quality concerns raised in this segment of the Santa Cruz River include:
• Possible toxic impacts of the treated effluent discharge to aquatic life and possible effects on other wildlife (e.g. mule and white-tailed deer, javelina, and waterfowl) [A study conducted by the US Fish and Wildlife Service (King, et al., 1999).]
• Although the effluent dominated stream below the wastewater treatment plant is designated as non-swimming (partial body contact), wading and other full body contact recreation activities are common in the Tumacacori and Amado segments. Any flowing water is a magnet for recreation in this low desert area.
• Because ground water is the primary source of drinking water in this area, the community would like to ensure that nitrate concentrations and other contaminants do not increase in the ground water due to effluent discharges upstream.
• Studies have shown that some pathogens found in effluent may be resistant to the chlorination treatment.
• Levels of E. coli may increase during major runoff events. Runoff from untreated sources (e.g., livestock grazing and untreated sewage in Nogales Wash in Mexico) may be reaching the Santa Cruz River and impacting water quality within the park.
• The International Boundary and Water Commission has been working with the United States Environmental Protection Agency (EPA), ADEQ, and federal and state counterparts in Mexico to upgrade the Nogales International Wastewater Treatment Plant (NIWTP) as well as the deteriorated infrastructure in Mexico. The NIWTP upgrade has begun. However, more funding is needed to repair the bi-national sewage pipe infrastructure and stop pollution flows from the Nogales Wash and its tributaries.
Continued monitoring is essential to document the impacts of both the upgrade and continuing pollution sources.

33
Project Description and Monitoring Objectives Bacteria samples will be collected to monitor Escherichia coli (E. coli) during the monsoon season when there are high flows in the river at the Tumacacori National Historic Park. Bacteria samples will be collected two times a day on two days per week during the monsoon season of July through mid-September. Additional samples will be tested by CDC to assess the presence of chlorine resistant water borne pathogens. Both sets of data will be submitted to ADEQ ambient monitoring program to be used to:
• Determine if E. coli levels increase during increased runoff or time of year;
• Determine exceedances of E. coli standards applicable to this stream reach;
• Provide additional data on E. coli contamination from wastewater and other watershed sources;
• Provide additional information to characterize water quality conditions for local citizens and governmental agencies concerned about the safety of recreational uses in these surface waters;
• Provide additional information about effluent dependent waters in arid environments (e.g., extent of flow, contaminants of concern); and
• Provide data for determining future physical, chemical, and biological water quality standards for this segment of the Santa Cruz River.
CDC Vital Signs Monitoring

34
Site Description Samples will be collected at two locations (Map 1) within the boundaries of TNHP. The rational for selecting these locations is provided below:
• Santa Cruz River at Santa Gertrudis Lane -- This site is at the upstream boundary of TNHP. It is approximately 8 miles downstream (north) of the wastewater treatment plant and has been sampled for conventional field parameters (but not E. coli bacteria) for several years by the Friends of the Santa Cruz River.
• Santa Cruz River at Tumacacori Foot Bridge -- This site is within TNHP. It is being monitored as part of the NPS Sonoran Desert Inventory and Monitoring Network.
Santa Cruz River near Tumacacori

35
Map 1 - Proposed Monitoring Sites at Tumacacori National Historic Park
36
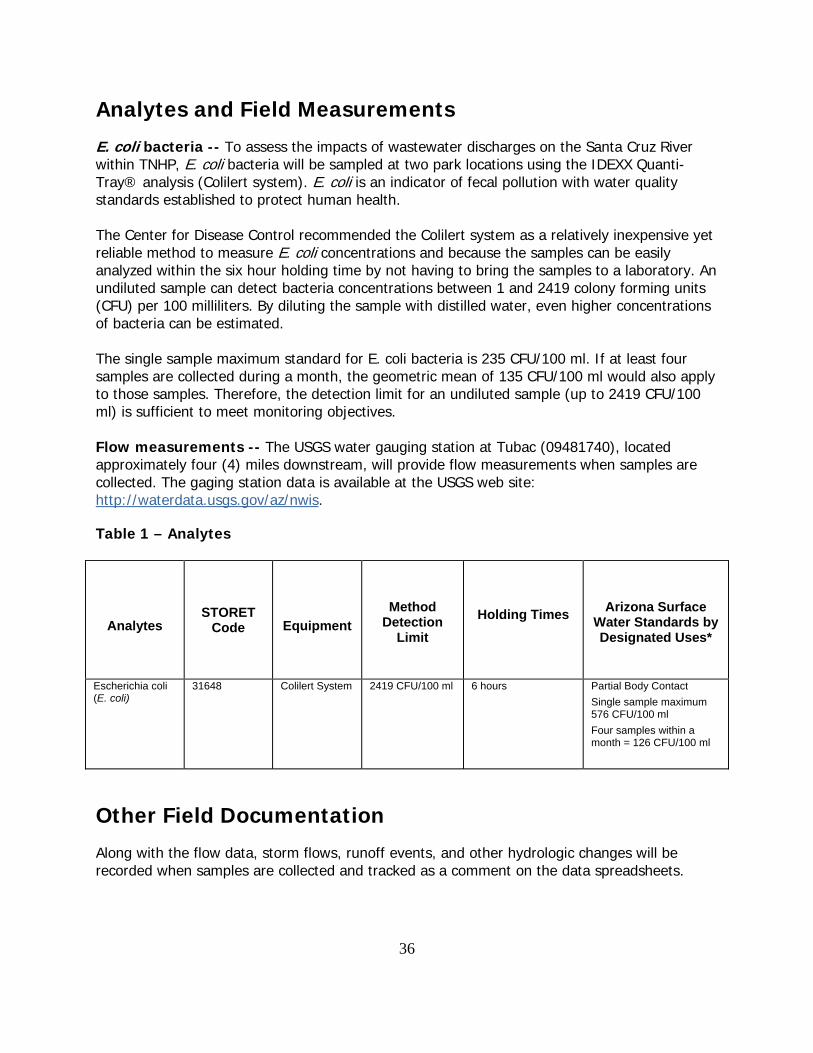
Analytes and Field Measurements E. coli bacteria -- To assess the impacts of wastewater discharges on the Santa Cruz River within TNHP, E. coli bacteria will be sampled at two park locations using the IDEXX Quanti-Tray® analysis (Colilert system). E. coli is an indicator of fecal pollution with water quality standards established to protect human health. The Center for Disease Control recommended the Colilert system as a relatively inexpensive yet reliable method to measure E. coli concentrations and because the samples can be easily analyzed within the six hour holding time by not having to bring the samples to a laboratory. An undiluted sample can detect bacteria concentrations between 1 and 2419 colony forming units (CFU) per 100 milliliters. By diluting the sample with distilled water, even higher concentrations of bacteria can be estimated. The single sample maximum standard for E. coli bacteria is 235 CFU/100 ml. If at least four samples are collected during a month, the geometric mean of 135 CFU/100 ml would also apply to those samples. Therefore, the detection limit for an undiluted sample (up to 2419 CFU/100 ml) is sufficient to meet monitoring objectives. Flow measurements -- The USGS water gauging station at Tubac (09481740), located approximately four (4) miles downstream, will provide flow measurements when samples are collected. The gaging station data is available at the USGS web site: http://waterdata.usgs.gov/az/nwis. Table 1 – Analytes
Analytes
STORET Code
Equipment
Method
Detection Limit
Holding Times
Arizona Surface
Water Standards by Designated Uses*
Escherichia coli (E. coli)
31648
Colilert System 2419 CFU/100 ml
6 hours
Partial Body Contact Single sample maximum 576 CFU/100 ml Four samples within a month = 126 CFU/100 ml
Other Field Documentation Along with the flow data, storm flows, runoff events, and other hydrologic changes will be recorded when samples are collected and tracked as a comment on the data spreadsheets.

37
Monitoring Frequency and Conditions E. coli bacteria samples will be collected during the following conditions at the two sites: Santa Gertrudis Lane
• To determine baseline variability, samples will be collected twice a day for three weeks prior to the monsoon season in 2007. This sampling phase will begin on June 13 and continue through July 4, 2007.
• During the monsoon season (July, August, and September 2007), samples will be collected after flood events two or more times per day.
• During base flow conditions (July, August, and September 2007) samples will be collected morning and afternoon two days per week.
Tumacacori Foot Bridge
• During the monsoon season (July, August, and September 2007), samples will be collected during and after flood events once a day.
• During base flow conditions (July, August, and September 2007) samples will be collected morning and afternoon two days per week.
TABLE 2 - Monitoring Frequency and Types of Samples
Site Name
Designated Uses
Analytes
Frequency Monitored
Santa Cruz at Santa Gertrudis Lane A&Wedw, PBC, AgL
Bacteria – E. coli
a. Baseline conditions – Twice a day for three weeks. b. Monsoon impacts – After flood events, two or more times per day c. Base flow conditions – Twice a day two days a week.
Santa Cruz at Tumacacori Foot Bridge A&Wedw, PBC, AgL
Bacteria – E. Coli a. Monsoon impacts – During and after flood events once a day. b. Base flow conditions – Twice a day, two days a week.
TNHP may extend this monitoring if interpretation of the results shows a need for additional samples. Sonoran Desert Inventory Additional water samples will be collected every Tuesday for the Sonoran Desert Inventory at the Tumacacori Foot Bridge during the summer of 2007, starting June 26 and continuing through the end of the monsoon season. These samples will test for the presence of chlorine resistant water borne pathogens. Samples will be collected, handled, and analyzed according to CDC protocols. Laboratory analysis will occur at the CDC laboratory in Atlanta, Georgia. Dr. Vincent Hill is the principal investigator. Results will be made available to ADEQ and other interested parties.

38
Field and Analytical Methods, Training, and Quality Control Field methods were chosen to assure that the samples collected are representative of water quality conditions at the time of sampling and to assure that collection methods are reproducible. Based on this training provided by the National Park Service personnel on the use of the Colilert System and written directions provided with the Colilert System, Tumacacori Park staff has developed written protocols for the collection and processing of E. coli samples (Appendix A). The CDC has also provided training on the collection and processing of samples being sent to their laboratory for analysis. Sampling will be conducted by park staff and FOSCR volunteers that have been trained by the Resource Manager. The E. coli sampling project is the responsibility of the park Resource Manager. Highlights from the procedures manual include:
• E. coli bacteria samples will be processed within 60 minutes of collection. • Sample trays will be carefully identified. • Time of the sample collection and time of processing will be recorded. • Samples will be incubated for 24 hours and “read” by comparing the results to the chart
provided with the Colilert System. • Results will be recorded using the lab data recording sheet is in Appendix B. • The Resource Manager is responsible for training and supervision of the sampling
project, and for record keeping (i.e. sample time, sample dates, and results). • All sampling and lab equipment is stored in the small lab set up in the park’s
maintenance building. Quality Assurance and Control Samples – Samples collected twice a day for three weeks prior to the beginning of the monsoon season will be used to training staff and to provide information on the daily variability of the readings. If the maximum detection limit is exceeded (>2419 CFU/100 ml), then further samples will be diluted. Duplicate samples will be collected and analyzed every 10th sampling event. The difference in results will be evaluated to determine whether field protocols are providing representative and reproducible results. Results from the Colilert system will be compared to data collected by ADEQ, FOSCR and SODN for quality control.

39
Data Processing, Validation, Analysis, and Reports The park Resource Manager will provide oversight of data tracking, data validation, data analysis, and data reports. Staff members responsible for sample collection and processing are also required to record data that includes sample number, time, and results on the data sheets provided in the park lab. It is the responsibility of the Resource Manager to review the sheets. Data will be recorded on spreadsheets or in a database that is compatible with ADEQ’s database, so that the data can be easily loaded and shared. Samples collected twice a day for three weeks prior to the beginning of the monsoon season will be used to train staff and to provide information on the daily variability of the readings. This ‘baseline’ data will be compared to data collected during the monsoon season. Coordination with ADEQ and Santa Cruz County Health Department - Hans Huth, a hydrologist with ADEQ, will review the data, look for exceedances, and validate the data according to the procedures in ADEQ’s Data Entry Manual (Draft November 2006). If Hans identifies exceedances of bacterial standards, he will work with TNHP to notify the Santa Cruz County Health Department. All data will be provided to ADEQ, NPS PHS, and SODN for further review, validation, analysis, and interpretation. It is anticipated that this data is will be used by ADEQ to support Arizona’s water quality assessment reports and impaired waters identification process. Evaluation of flow conditions – Data analysis will consider whether stream flow conditions can be used to predict bacterial exceedances by comparing the E. coli data collected during three hydrological conditions:
• Base line conditions; • During flood flows; and • During base flow.
Data analysis will also consider whether other readily available information can be used to predict elevated E. coli concentration (e.g., time of day, day of week, stream flow)
Field Safety Latex gloves, rubber waders, and antibacterial soap will be provided to minimize bacterial contamination of staff sampling these effluent dependent sites. Monitoring staff will need to stay alert for any signs of flash floods. If possible, a cell phone will be available in the field for emergency use. The nearest hospital emergency room and emergency numbers include:
• Carondelet Holy Cross Hospital, 1230 Target Range Road, Nogales Arizona (520) 287-2771.
• Fire (520) 394-2091 • Police (Santa Cruz County Sheriff) (520) 394-2410 • Ambulance (520) 394-2410 • 911

40
References ADEQ. 1992. Field Procedures Manual for Volunteers Participating in the Santa Cruz River
Intensive Study B 1992 - 1993. Prepared by Melinda Longsworth and Lin Lawson in the Southern Regional Office. Tucson, Arizona. 34 pp.
ADEQ. 1995. Upper Santa Cruz River Intensive Survey: A Volunteer Driven Study of the Water
Quality and Biology of an Effluent Dominated Desert Grassland Stream in Southeast Arizona. Prepared by Lin Lawson. Tucson, AZ. 70 pp.
ADEQ. 1996. Fixed Station Network Procedures Manual for Surface Water Quality Monitoring
(revised) Hydrologic Support and Assessment Section. TM-96-1. Phoenix. Bolin Laboratories. 1995 and subsequent revisions. Quality Assurance Manual. Phoenix, Arizona. King, Kirke A., Brenda J. Zaun, and Anthony L. Velasco. 1999. Contaminants as a Limiting
Factor of Fish and Wildlife Populations in the Santa Cruz River, Arizona. USFWS. 57 pp. Nogales International Wastewater Treatment Plant Laboratory. 1995 and subsequent revisions.
Quality Assurance Manual. Rio Rico, Arizona.
41
Appendix A. Field Protocols Colilert Test The Colilert System is used for the simultaneous detection and confirmation of total coliform and E. coli bacteria in water. Colilert uses nutrient indicators that produce color and/or fluorescence when metabolized by total coliform and E. coli bacteria. When the reagent is added to the sample and incubated, these bacteria can be detected down to 1 CFU/100ml within 24 hours.
A. General Test Procedure
• Carefully separate one Snap Pack from the strip, taking care not to accidentally open adjacent pack.
• Tap the Snap Pack to ensure that all of the Colilert powder is in the bottom part of the pack.
• Open one pack by snapping back the top at the score-line. • Add the reagent to the water sample in a sterile, transparent, non-fluorescent vessel. • Aseptically cap and seal the vessel. • Shake until dissolved. • Pour the sample reagent mix directly into the tray avoiding contact with the foil tab,
and then seal the tray according to Colilert instructions. • Incubate for 24 hours at 35°C ±0.5°C. • Read the results at 24 hours. Compare each results against the comparator
dispensed into an identical vessel. o If no yellow color is observed, the test is negative. o If the sample has a yellow color equal to or greater than the comparator, the
presence of total coliform is confirmed. o If color is not uniform, mix by inversion then recheck. o If the sample is yellow, but lighter than the comparator, it may be incubated
an additional 4 hours (but no more than 28 hours total). If the sample is coliform positive, the color will intensify. If it does not intensify, the sample is negative.
o If yellow is observed, check vessel for fluorescence by placing a 6 watt 365 nm UV light within 5 inches of the sample in a dark environment. Be sure the light is facing away from your eyes and toward the vessel.
If fluorescence is greater or equal to the fluorescence of the comparator, the presence of E. coli is confirmed.
If fluorescent, shigella-type organisms are present. • Count and record the results:
o Count the number of large and small wells that are yellow and record on lab sheet.
o Count the number of large and small wells that show fluorescence and record on lab sheet.
o Use Colilert tables to determine Most Probable Number of colony forming units (CFU)
For 1:1 dilution (no dilution), use MPN from table;
42
For 10:1 dilutions, multiply MPN from table by 10 For 100:1 dilutions, multiply MPN from table by 100 For 1000:1 dilutions, multiply MPN from table by 1000
o When multiple dilutions are used, report the MPN from the smallest dilution where not all wells are positive.
• If an inoculated Colilert sample is inadvertently incubated over 28 hours, the following guidelines apply:
o Lack of yellow is a VALID NEGATIVE TEST. o A yellow color after 28 hours is not a valid and should be repeated or
verified. • Some water samples containing humic materials may have an innate color. • If a water sample has some background color, compare inoculated Colilert sample to
a control blank of the same water sample. • Use sterile water, not buffered water for making dilutions. Colilert is already
buffered. • Always add Colilert to the proper volume of diluted sample after making dilutions. • Colilert is a primary water test. Colilert performance characteristics do not apply to
samples altered by any pre-enrichment or concentration.
B. Quality Control Procedure
The following quality control procedures will be conducted on each sample set: • Inoculate sterile water (100 ml) with the Quanti-Cult or American Type Culture
Collection (ATCC) bacteria listed below. • Follow the above test procedure, and compare test results to the expected results
below.
Quanti-Cult Organism ATCC # Expected Result E. coli 25922 or 11775 yellow, fluorescent Klebsiella pneumoniae 31488 yellow, not fluorescent Pseudomonas aeruginosa 10145 or 27853 clear, not fluorescent
C. Water Testing Steps
STEP 1: Collect samples using a sealed plastic bottle. Fill sample bottle to line – avoid collecting sediment, and do not take samples in eddies or slow moving areas. STEP 2: Calibrate the incubator, making sure it is 35º C. If not, adjust and wait 3O minutes. Recheck until stable. STEP 3: Turn on the tray sealer. Tray cannot be inserted until both the amber and green lights are on. STEP 4: Wash hands. STEP 5: Dilute samples if past samples have exceeded maximum detection limit. • 1:1 dilution (Maximum of 2,419 CFU/100 ml)
o Use normal test procedures • 10:1 dilution (Maximum 24,190 CFU/100 ml)
o Aseptically, pipette out 10 milliliters from a sterile water sample bottle o Pipette 10 milliliters from original sample bottle into sterile water sample bottle

43
o Then use normal test procedures • 100:1 dilution (Max MPN 241,900)
o Aseptically, pipette out 1 ml from a sterile water sample bottle o Pipette 1 ml from original sample bottle into sterile water sample bottle o Then use normal test procedures
• 1000:1 dilution (Max MPN 2,419,000) o Aseptically, pipette out 0.1 ml from a sterile water sample bottle o Pipette 0.1 ml from original sample bottle into sterile water sample bottle o Then use normal test procedures
STEP 6: Prepare a Snap Pack. • Separate one Snap Pack from the strip taking care not to accidentally open adjacent
packs. • Tap the Snap Pack to ensure that all of the Colilert powder is in the bottom part of
the pack. • Open one pack by snapping back the top at the score-line. • Add the reagent to the water sample in a sterile, transparent, non-fluorescent
vessel. • Aseptically cap and seal the vessel. • Shake until dissolved.
STEP 7: Add sample mix to the trays • Pour the sample reagent mix directly into the tray, avoiding contact with the foil tab. • To open tray squeeze open with hand and pour. Try not to place water bottle lip on
tab when pouring water into tray. Flick small wells to remove bubbles. STEP 8: Seal the tray. • Place the tray with seal up and plastic square wells inserted on top of rubber insert
on seal machine. Make sure tray is firmly inset into rubber insert. • Push tray and rubber insert until you feel the machine catch and pull. Tray will come
out of the back in 15 seconds. If it gets stuck, press reverse once only and pull out tray and redo.
STEP 9: Label and incubate • Label the tray with a small number (sample number from lab sheet) in a corner of
the tray. • Do not write on wells. • Place sealed tray in incubator, make sure set to 35C. • Each tray must incubate for 24 hours. • After 24 hours remove tray. Look to see how many wells are yellow.
o Compare the sample tray with the red comparator tray. o Use a sharpie to mark which wells are more yellow than the comparator
tray. o Use the Lab sheet to record the # of yellow wells. o First count the number of large wells, then write this number at the top
(numerator) of the square on the lab sheet. o Count the number of small wells and write that number in the denominator
or bottom of the divided square on the lab sheet. • If the sample is yellow, but lighter than the comparator, it may be incubated an
additional 4 hours (but no more than 28 hours total). If the sample is coliform positive, the color will intensify. If it does not intensify, the sample is negative.
44
• If an inoculated Colilert sample is inadvertently incubated over 28 hours, the following guidelines apply:
o Lack of yellow is a VALID NEGATIVE TEST. o A yellow color after 28 hours is NOT VALID and should be repeated or
verified. STEP 10: Look for florescence.
• Turn off lights or go in dark room and hold UV light within 5 inches of sample tray and count number of wells that are both yellow and fluorescent (only count the ones you marked as yellow in STEP 8).
• Write the number of large wells that are both yellow and fluorescent at the top of the box for fluorescent counts, and number of small wells that are both yellow and fluorescent in the bottom (denominator).
STEP 11: Enumeration • Use the Tables to determine MPN (Most Probable Number of bacteria) • Record the number on the lab sheet.
STEP 12: Clean up. • The tray needs to be put into a plastic garbage bag and boiled for 30 minutes
and disposed of the tray. • When done with the tray sealer, turn it off. • Keep incubator on. • Will need to check incubator temperature three times per day.