presented by brad witt stopping noise-induced hearing loss
TRANSCRIPT

Presented by Brad Witt
STOPPING NOISE-INDUCED HEARING LOSS

STOPPING NOISE-INDUCED HEARING LOSS
NIOSH Safe-In-Sound Award Recipient
▪ “Measurable achievements in reducing or eliminating noise-induced hearing loss”
▪ 2011 industrial recipient: Shaw Industries Group Plant WM
▪ Elimination of noise-induced hearing loss
(see www.safeinsound.us)

and off the job.
NOISE AND ACOUSTICS
Hazardous noise exposures are cumulative
on the job ..…
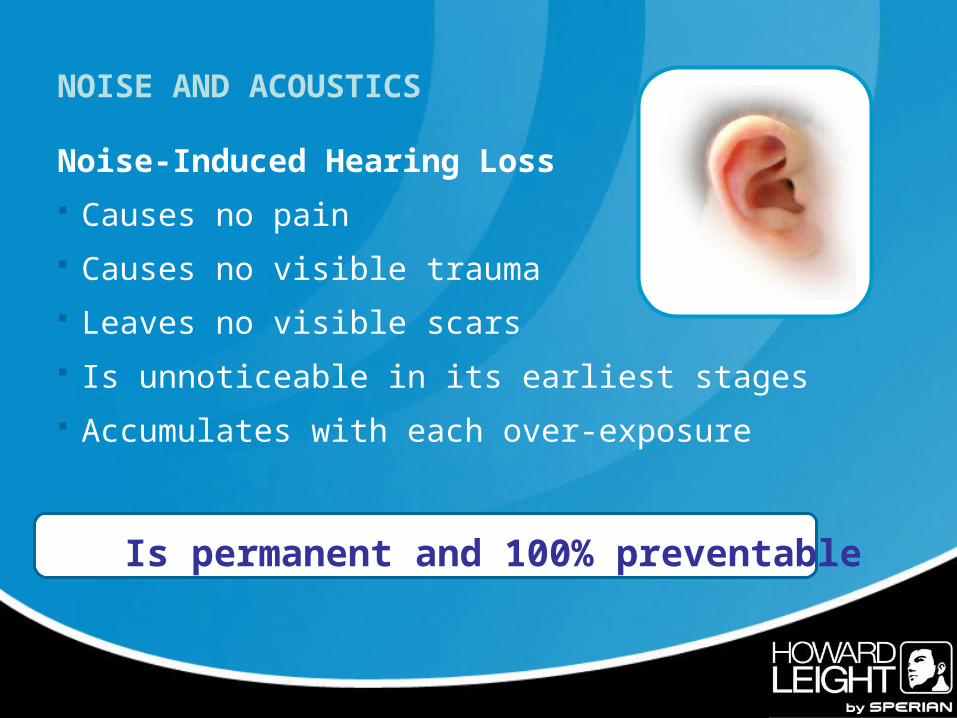
NOISE AND ACOUSTICS
Noise-Induced Hearing Loss
Causes no pain
Causes no visible trauma
Leaves no visible scars
Is unnoticeable in its earliest stages
Accumulates with each over-exposure
Is permanent and 100% preventable

NOISE AND ACOUSTICS
Noise-induced hearing loss
is the most common
permanent and preventable
occupational injury in the world.~ World Health Organization
1997 Report on Occupational Noise

NOISE AND ACOUSTICS
NON-OCCUPATIONAL
► 140 dB
Immediate physical damage
► 120 dB
Pain threshold
► 85 dB
OSHA Action Level
Hearing damage possible
► 60 dB
Comfortable noise level

NOISE AND ACOUSTICS
The decibel scale is a logarithmic scale, not a linear scale
If the noise source is doubled 83 dB
The noise level only goes up 3 dB 86 dB
Small increases in decibel level 89 dB
Represent enormous increases in noise level and risk
92 dB

NOISE AND ACOUSTICS
95 dB
92 dB
89dB
86dB
83dB

NOISE AND ACOUSTICS Sound Level Meter vs. Noise Dosimeter
Sound is measured immediately in a specific area
Sound is ‘averaged’ throughout the day for a sample employee or job
“Area Sampling” “Personal Sampling”
photos courtesy of Quest Technologies

NOISE AND ACOUSTICS ~ Hierarchy of Controls
ADMINISTRATIVE CONTROLS
• Rotate Workers
• Extended Breaks
•2nd/3rd Shift
ENGINEERING CONTROLS
• Buy Quiet
• Vibration Pads
• Enclosures
• Barriers
• Isolation
PERSONAL PROTECTIVE EQUIPMENT


EVALUATING NOISE REDUCTION
How much noise is reaching the ear of the worker ?
That is completely unknown …
Noise Level = 100 dB
Noise Reduction Rating = 30 dB
(55 – 104 dB)

Which ear is protected?
0 dB 0 dB33 dB

EVALUATING NOISE REDUCTIONThe Noise Reduction Rating (NRR)
A laboratory estimate of the
amount of attenuation achievable
by most users when properly fit
A population-based rating …
some users will get more
attenuation, some will get less
The NRR is only a population estimate,not a predictor of individual attenuation.

EVALUATING NOISE REDUCTIONDeveloping the NRR
10 human subjects tested in a
simulated industrial room
Tested with ears open / occluded at
nine frequencies
Each subject tested 3x
NRR calculated to be population
average
A test subject in the Howard Leight Acoustical Lab, San Diego, CA, accredited
by the National Voluntary Laboratory Accreditation Program (NVLAP)

NOISE LEVEL
NRRSAFE NOISE=_

NOISE LEVEL
? HUMAN FACTOR
? SAFE
NOISE =_

EVALUATING NOISE REDUCTIONReal-World Protection May Not Equal NRR
From Kevin Michael, PhD and Cindy Bloyer “Hearing Protector Attenuation Measurement on the End-User”
192 users of a flanged multiple-use 27 dB earplug
Retraining and refitting resulted
in an average
14 dB 14 dB improvementimprovement
in attenuation for this group
Real user
attenuatio
n
0 – 38 dB
30
20
10
0
-10
Att
enu
atio
n in
dB 40
50Multiple-Use Earplug Rated for 27 dB
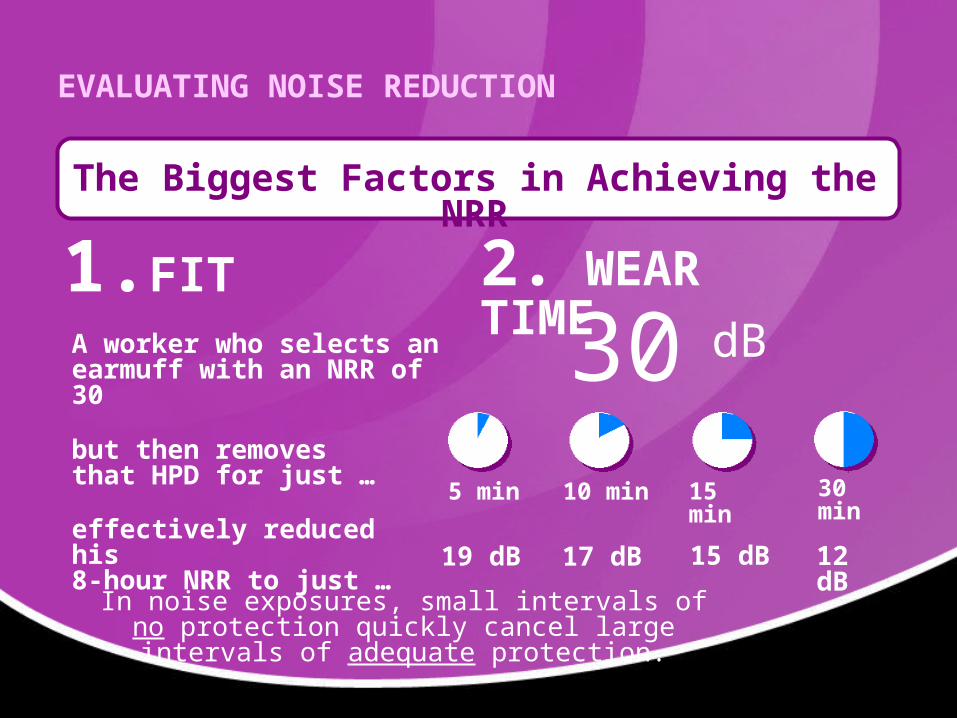
EVALUATING NOISE REDUCTION
The Biggest Factors in Achieving the NRR
1.FIT 2. WEAR TIME
A worker who selects an earmuff with an NRR of 30
effectively reduced his 8-hour NRR to just …
but then removes that HPD for just …
30 dB
5 min 10 min 30 min15 min
19 dB 17 dB 15 dB 12 dB
In noise exposures, small intervals of no protection quickly cancel large intervals of adequate protection.

EVALUATING NOISE REDUCTION
100 dB
90 dB
80 dB
70 dB
60 dB
0 1 2 3 4 5 6 7 8
8-Hour Workday
30 dB = 1000x
20 dB = 100x
10 dB = 10x
3 dB = 2x

EVALUATING NOISE REDUCTIONThe Hazards of Overprotection Choosing a protector with an NRR higher than necessary may
result in overprotection Verbal communication may be hindered Warning alarms, telephones, machine noises may not be heard
-85
-80
-75
-70
Worker Exposure at the Ear With Protectors
dB Insufficient Protection
Optimal Protection
Acceptable Protection
Acceptable Protection
Over Protection

EVALUATING NOISE REDUCTIONThe Noise Reduction Rating (NRR)
Current NRR Label Mock-up of New Label
80th %
Minimally-trained
20th %
Proficient Users

REDUCING COSTS & CLAIMSREDUCING COSTS & CLAIMS

REDUCING CLAIMS
Lagging Indicators vs Leading Indicators

Fit Testing
REDUCING CLAIMS
In-Ear Dosimetry
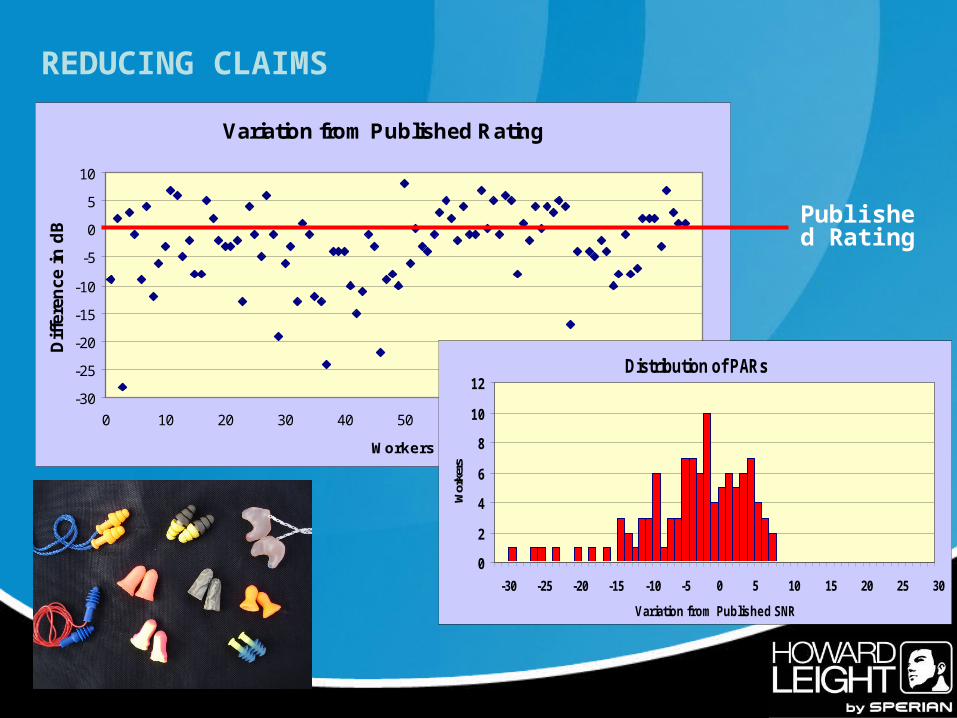
Variation from Published Rating
-30
-25
-20
-15
-10
-5
0
5
10
0 10 20 30 40 50 60 70 80 90 100
Workers
Dif
fere
nce
in
dB
Published Rating
Distribution of PARs
0
2
4
6
8
10
12
Variation from Published SNR
Wor
kers
REDUCING CLAIMS

Personal Factors
Gender
Age
Years in Noise
Ear Canal Size
Familiarity
Model of Earplug
Program Factors
# Group Trainings
# Personal Trainings
Distribution of PARs
0
2
4
6
8
10
12
Variation from Published NRR
Wor
kers
REDUCING CLAIMS
What predicts a good fit?

Difference on 2nd / 3rd Test
-30
-25
-20
-15
-10
-5
0
5
10
Subjects
Va
ria
tio
n f
rom
NR
R Published Rating
Trying a second earplug often improves attenuation
REDUCING CLAIMS

FIT TESTING
Complete Check
● 5 freqs in each ear
● Best for new users, reliability checks
● ↑ accuracy, ↑ test time
Quick Check
● 1 critical freq in each ear
● ↓ accuracy, ↓ test time
● Can use with severe hrg loss
ReportMode
● Individual
● Historical
● Results by freq
Fit Training
● Videos

Fit Testing
REDUCING CLAIMS
In-Ear Dosimetry

In-ear dosimetry measures actual noise dose, with and without protection
Alerts when worker approaches safe limits
Only metric to measure and prevent further progression of occupational hearing loss

IN-EAR DOSIMETRY
Dosimeter records …
• Good fit
• Bad fit
• No fit
Indicator lights give immediate feedback of noise level and dose

IN-EAR DOSIMETRY

Research > Alcoa Intalco Works
Mean Hearing Threshold (2k, 3k, 4kHz): 2000 – 2007 (N = 46)
Employees using continuous in-ear dosimetry starting in 2005
Mean hearing threshold (2,3, and 4 kHz) Employees using continuous ESP starting in 2005
2000 - 2007 (N=46)
0
5
10
15
20
25
30
35
40
45
50
2000 2001 2002 2003 2004 2005 2006 2007
Year of test
Mean
HTL
3,4,6
kHz
ESP Introduced trend line

REDUCING CLAIMS
In practice, identifying a shift in hearing is not a preventive action ….
It is documentation of a hearing loss after the fact.
0 2 4 6 8 10 12 14 16
Months
How soon will an employee suffering NIHL be re-fit / re-trained ?
“Best case scenario” per annual audiometric testing
In-ear dosimetry “worst case” scenario …
1 Day • Audiometric test • Retest • Notification

PROS- Estimate Measure
- NRR obsolete
- Eliminates need for de-ratings
- Medico-legal cases
- Delineates non-occupational
- Eliminates double protection
- Provides employee feedback
CONS - Cost
- Time Investment
- Not standardized
REDUCING CLAIMS

REDUCING CLAIMS
Off-job + On-job = ShiftOff-job + On-job = Shift

CASE STUDIES - CARPET MILL
NIOSH Safe-In-Sound Award Recipient
1. Engineering controlsBrought noise levels down to 100-104 dBA.
2. Annual fit-testing and training Documented successful reduction of noise exposures under the hearing protector below 85 dBA for all employees.
3. End result: reduction of STS to zero in the most recent years of annual audiometric testing.

CASE STUDIES – MILITARY INSTALLATION
U.S. Navy
▪ 60 sailors experienced in earplug use- command-issued standard foam earplug
OR- a second earplug of their choosing
▪ Prior to testing with the “variety” earplug, sailors received brief training (less than one minute in duration) by someone modeling the correct fit of that style of earplug.
▪ Despite no prior experience with the “variety” earplug, 45 of the 60 sailors (75%) achieved higher attenuation with the variety earplug over the command-issued earplug.
Median attenuation for ‘variety’ earplugs = 18 dBMedian attenuation for command-issued earplugs = 9 dB

CASE STUDIES - AEROSPACE
14087
35 12 3
197
110
7563 60
0
50
100
150
200
250
300
350
1st Test 42% pass
2nd Test 44% pass
3rd Test 32% pass
4th Test 16% pass
5th Test 5% pass
Nu
mb
er o
f E
mp
loye
es
Did not meet 15 dB criterion
Met 15 dB criterion
Fit-Testing / 1:1 Training
for 337 noise-exposed workers

Pre-Test
1. Which type of hearing protectors do you normally use on the job?
2. How would you rate your ability to fit your earplugs?
Post-Test
1. After this fit-test, are you better able to fit your earplugs?
2. Did you change your choice of earplugs as a result of the fit-test?
- Yes, 63%No, 37% -
- Yes, 93%Not sure, 1% -
No, 6% -
Poor, 1% -
Okay, 36% -
- Good, 51%Don’t know how, 2% -
Expert, 10% -
- Earplugs, 76%Earmuffs, 8% -
Don’t normally use on-the-job, 16% -
CASE STUDIES - AEROSPACE

Hearing Loss Due To
Noise Exposure Is …
Painless
Permanent
Progressive
… and very Preventable!
