presentation to the maryland association of counties 2015 winter conference january 9, 2015
TRANSCRIPT

Presentation to the Maryland Association of Counties
2015 Winter ConferenceJanuary 9, 2015
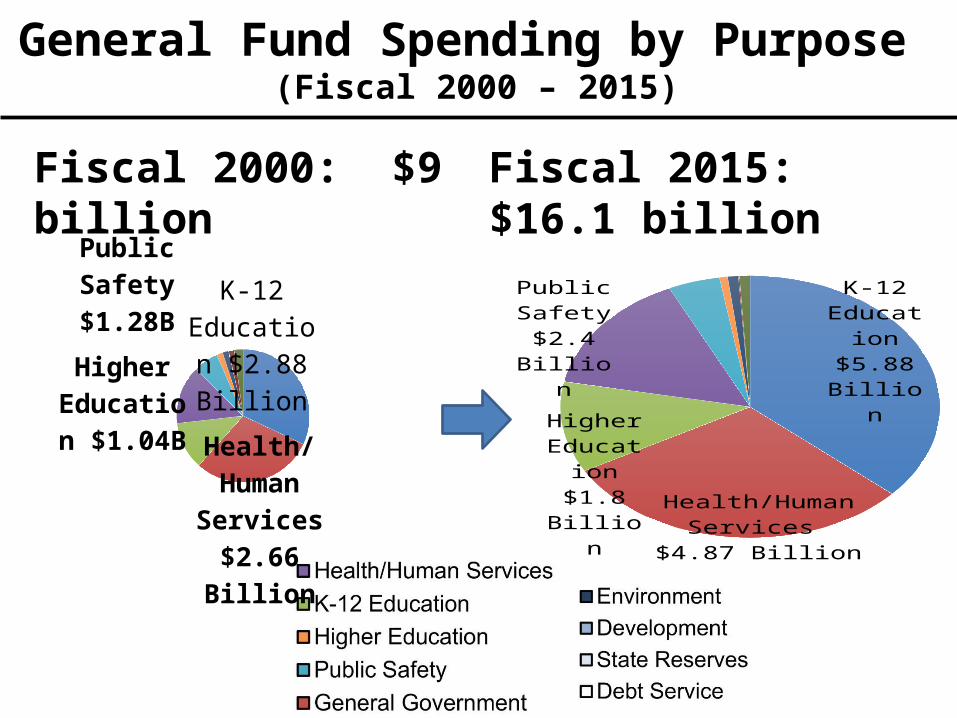
General Fund Spending by Purpose (Fiscal 2000 – 2015)
Fiscal 2015: $16.1 billion
K-12 Educa-
tion $2.88 Billion
Health/Hu-man Services $2.66 Billion
Higher Educa-
tion $1.04B
Public Safety $1.28B
Fiscal 2000: $9 billion
K-12 Ed-ucation
$5.88 Bil-lion
Health/Human Services
$4.87 Billion
Higher Educa-
tion $1.8 Billion
Public Safety
$2.4 Bil-lion

3
Total State Aid by Governmental Entity ($ in millions)
Fiscal 2015: $7.6 billion in State support to Local Government
FY 2000 FY 2010 FY 2014
Public Schools $2,210.8 $4,747.3 $5,208.9
Libraries 28.9 48.8 50.2
Community College 125.3 226.9 243.3
Local Health 48.4 37.3 40.0
County/Municipal 616.4 397.2 533.7
Subtotal $3,029.7 $5,457.5 $6,076.1
Retirement $420.5 $803.4 $916.5
Total $3,450.3 $6,260.9 $6,992.6
FY 2000 FY 2010 FY 2014$0.0
$1.0
$2.0
$3.0
$4.0
$5.0
$6.0
$7.0
$8.0
Public Schools LibrariesCommunity College Local HealthCounty/Municipal Retirement
$ i
n B
illi
on
s
Source: Department of Legislative Services
4
• In Fiscal 2000, 37% of the State’s General Fund went directly to local government.
• Today, 47% of the State’s General Fund goes directly to local government.
STATE AID TO LOCALS CONTINUES TO GROW

5
State Aid to Local Governments Per Capita Allocation – Fiscal 2014

State Education Aid Per Pupil• State aid per pupil has increased every year since fiscal 2002
and has exceeded local funding since fiscal 2010, reversing Maryland’s historical funding pattern. Below are local school system per pupil revenues by source:
FY 2002
FY 2003
FY 2004
FY 2005
FY 2006
FY 2007
FY 2008
FY 2009
FY 2010
FY 2011
FY 2012
FY 2013
$0
$2,500
$5,000
$7,500
$10,000
$12,500
$15,000
$17,500
$4,671 $4,801 $4,991 $5,271 $5,587 $6,078 $6,383 $6,685 $6,587 $6,572 $6,501 $6,721
$3,432 $3,682 $3,903 $4,302 $4,794$5,416
$6,309 $6,579 $6,715 $6,941 $6,997 $7,040$8,614 $9,037 $9,435
$10,196$11,004
$12,146$13,375$13,926$14,172$14,573$14,259
Local State Federal$14,46
3

The State provides 48% of all K-12 operating funds, while counties provide 46%
County % State % Local County % State % LocalCaroline 72% 20% Frederick 49% 47%Wicomico 70% 21% Carroll 46% 49%Baltimore City 70% 18% Queen Anne's 45% 54%Allegany 67% 24% Calvert 45% 51%Somerset 64% 24% Baltimore 45% 49%Washington 61% 33% Garrett 45% 47%Dorchester 59% 30% Anne Arundel 37% 58%Cecil 57% 37% Kent 36% 56%Prince George's 57% 36% Howard 35% 62%Charles 51% 44% Montgomery 33% 64%St. Mary's 50% 40% Talbot 28% 66%Harford 49% 50% Worcester 23% 70%
Statewide 48% 46%

Public School Construction• The State pays at least 50% of eligible costs of school
construction and renovation projects, even if the calculation results in a State contribution of less than 50%.
• The cost-share formula is based on factors including wealth and ability to pay and is recalculated every three years.
• Since FY04, the State has invested $3.5 billion in school construction statewide.
• Funding increased from $117 million in FY 2004 to $250 million in FY 2006, and has exceeded the $250 million target recommended by the Kopp Commission each year since ($319 million in FY 2015).

The State Pays on Average 64% of Eligible School Construction Costs
* FY16-18 estimates subject to BPW approval
County % State % Local County % State % Local
Somerset 100% 0% Carroll 59% 41%Wicomico 97% 3% St. Mary's 58% 42%Baltimore City 93% 7% Howard 55% 45%Allegany 83% 17% Calvert 53% 47%Caroline 80% 20% Baltimore 52% 48%Dorchester 76% 24% Anne Arundel 50% 50%Washington 71% 29% Garrett 50% 50%Frederick 64% 36% Kent 50% 50%Cecil 63% 37% Montgomery 50% 50%Harford 63% 37% Queen Anne's 50% 50%Prince George's 63% 37% Talbot 50% 50%Charles 61% 39% Worcester 50% 50%
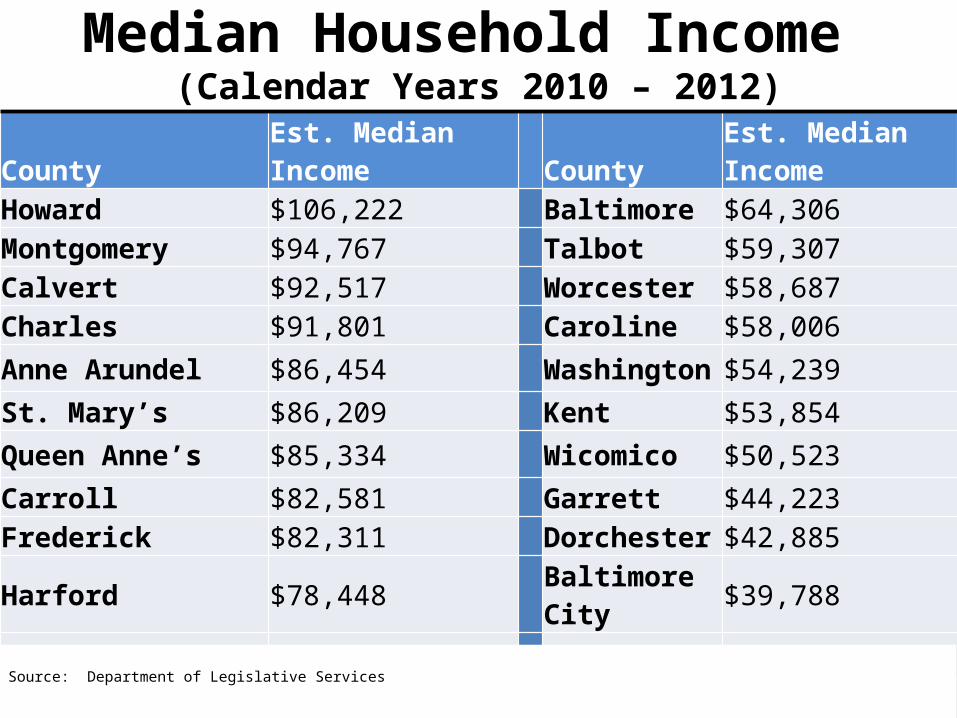
Median Household Income (Calendar Years 2010 – 2012)
County Est. Median Income County Est. Median IncomeHoward $106,222 Baltimore $64,306Montgomery $94,767 Talbot $59,307Calvert $92,517 Worcester $58,687Charles $91,801 Caroline $58,006Anne Arundel $86,454 Washington $54,239St. Mary’s $86,209 Kent $53,854Queen Anne’s $85,334 Wicomico $50,523Carroll $82,581 Garrett $44,223Frederick $82,311 Dorchester $42,885Harford $78,448 Baltimore City $39,788
Prince George’s $72,254 Allegany $39,166State of Maryland $71,707 (1st in U.S.) Somerset $37,733Cecil $64,763
Source: Department of Legislative Services

Demographic Indicators
-11-
Montgomery17%
Prince George's
15%
Baltimore14%
Baltimore City10%
Anne Arundel9%
Howard5%
Harford4%
Frederick4%
Carroll3%
Charles3%
Washington3%
St. Mary's2%
Rest of MD11%
Maryland Population by County (2013)
Source: Department of Legislative Services

Percentage Change in Population 2010 – 2012
-12-Source: Department of Legislative Services

-13-