presentation to portfolio committee on public enterprises...
TRANSCRIPT

4 May 2010
Presentation to Portfolio Committee on Public Enterprises
Eskom Funding Model & World Bank Loan
4/05/2010
2010/05/05 2
Agenda
Electricity Demand Forecasts
Objective, Scope and Approach
Funding Model
Funding Solutions
World Bank Loan Details
Overall Conclusions
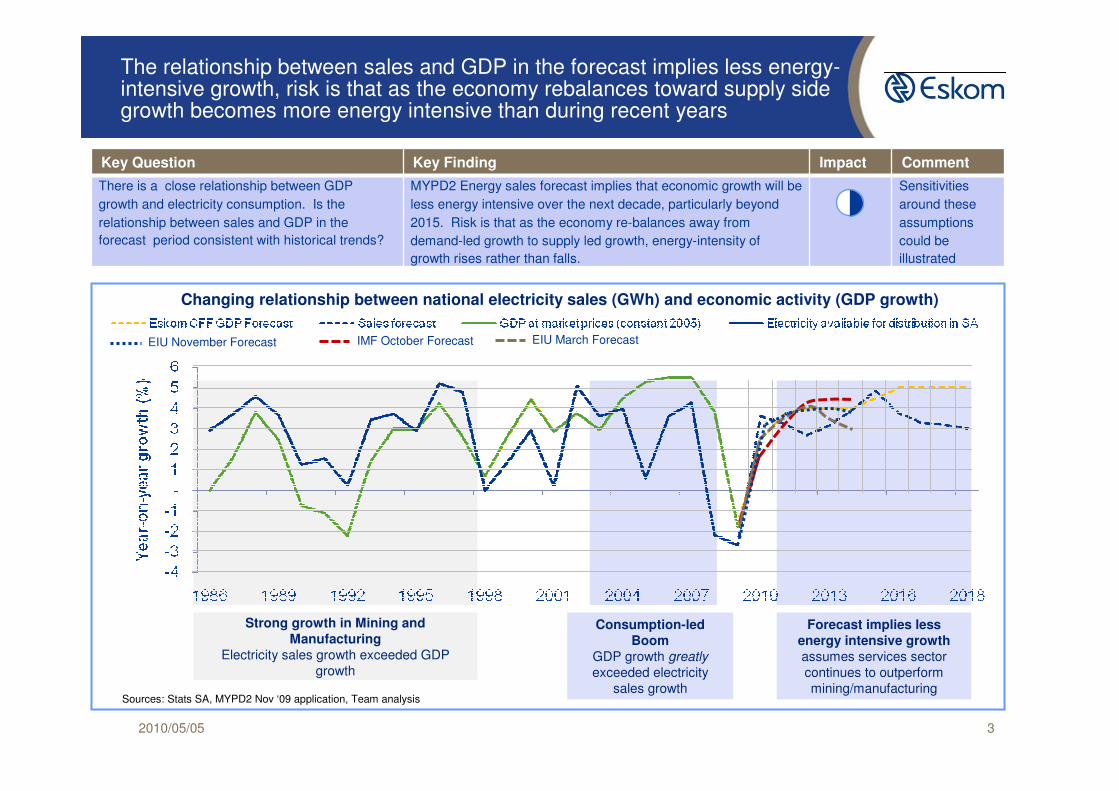
The relationship between sales and GDP in the forecast implies less energy-intensive growth, risk is that as the economy rebalances toward supply side growth becomes more energy intensive than during recent years
2010/05/05 3
Consumption-led
Boom
GDP growth greatly
exceeded electricity sales growth
Key Question Key Finding Impact Comment
There is a close relationship between GDP
growth and electricity consumption. Is the
relationship between sales and GDP in the
forecast period consistent with historical trends?
MYPD2 Energy sales forecast implies that economic growth will be
less energy intensive over the next decade, particularly beyond
2015. Risk is that as the economy re-balances away from
demand-led growth to supply led growth, energy-intensity of
growth rises rather than falls.
Sensitivities
around these
assumptions
could be
illustrated
Changing relationship between national electricity sales (GWh) and economic activity (GDP growth)
Sources: Stats SA, MYPD2 Nov ‘09 application, Team analysis
Strong growth in Mining and
Manufacturing
Electricity sales growth exceeded GDP growth
Forecast implies less
energy intensive growth
assumes services sector continues to outperformmining/manufacturing
EIU November Forecast IMF October Forecast EIU March Forecast

Actual and estimated sales revenue
2010/05/05 4
TOTAL ESKOM ELECTRICITY SALES (GWH) - to end of MYPD2
Actual
2006
Actual
2007
Actual
2008
Actual
2009
F/cast
2010 Est 2011 Est 2012 Est 2013
207,921 218,120 224,366 214,850 218,590 228,266 233,400 237,932
4.9% 2.9% -4.2% 1.7% 4.4% 2.2% 1.9%
SA National Treasury GDP growth (real) forecasts
(calendar) 2.3% 3.2% 3.6%

2010/05/05 5
South Africa needs to create 50GW1 of new electricity capacity by 2028, requiring a faster build rate than ever before
Incremental installed capacity, MW
1 Including 10GW needed to replace decommissioned capacity, and 5GW of DSM (embedded in planned)2 Historical figures do not include capacity to replace decommissioning
• Huge Eskom-driven investment, with clear objective to provide abundant cheap power
• Excess capacity -more than 10 GW mothballed
• Under-investment, despite warnings of looming crisis
• IPPs did not deliver as intended
• Significant capacity returned to service through de-mothballing
• Future capacity needs require a massive build programme
- Huge funding and skills requirements
- Complex context involving multiple objectives, technologies and stakeholders
1996-2000
3 4583 6592 167
1986-1990
9 957
1981-1985
7 367
1991-1995
1976-1980
7 107
1971-1975
2026-2028
11 009
5 879
2021-2025
16 576
11 428
2017-2020
8 18414 560
8 104
2011-2017
14 720
2006-2010
3 382
2001-2005
Planned net increment (incl.DSM)
Planned to replace decommissioning
Actual installed2
713
Committed
by Eskom
Not
committed
by Eskom
Agenda
2010/05/05 6
Electricity Demand Forecasts
NERSA Hearing
Funding Model
Funding Solutions
World Bank Loan Details
Overall Conclusions
Background
2010/05/05 7
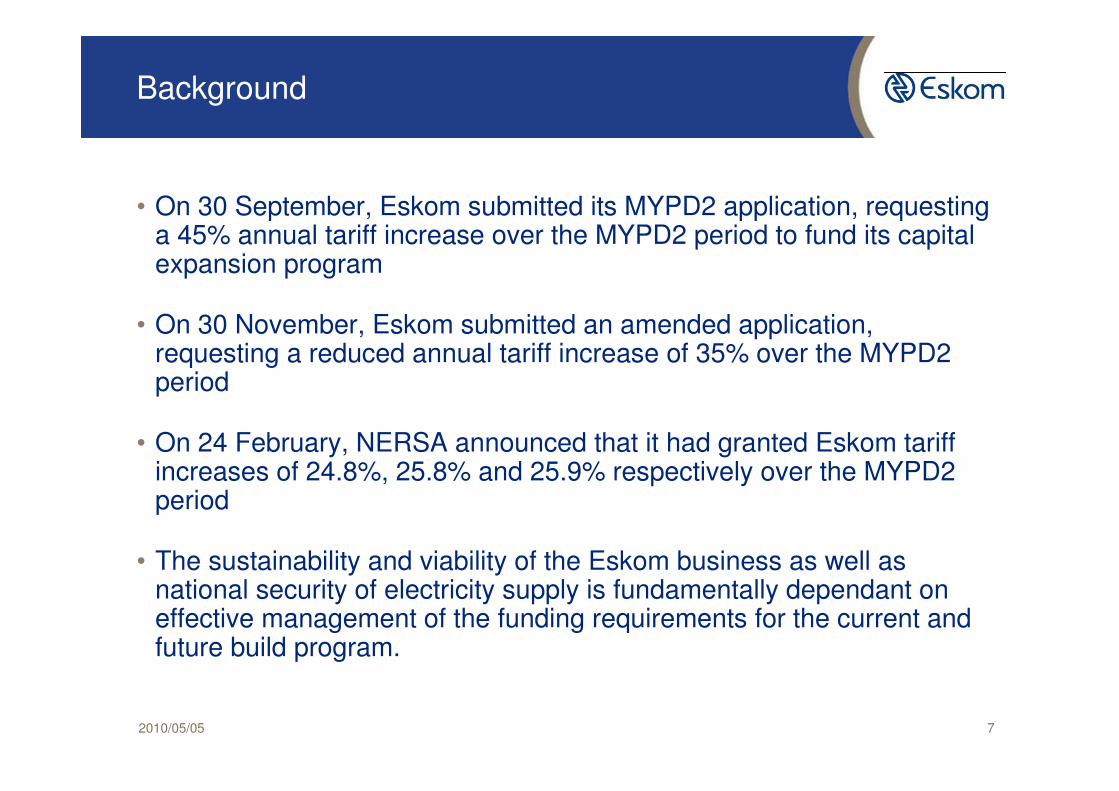
• On 30 September, Eskom submitted its MYPD2 application, requesting a 45% annual tariff increase over the MYPD2 period to fund its capital expansion program
• On 30 November, Eskom submitted an amended application, requesting a reduced annual tariff increase of 35% over the MYPD2 period
• On 24 February, NERSA announced that it had granted Eskom tariffincreases of 24.8%, 25.8% and 25.9% respectively over the MYPD2 period
• The sustainability and viability of the Eskom business as well as national security of electricity supply is fundamentally dependant on effective management of the funding requirements for the current and future build program.
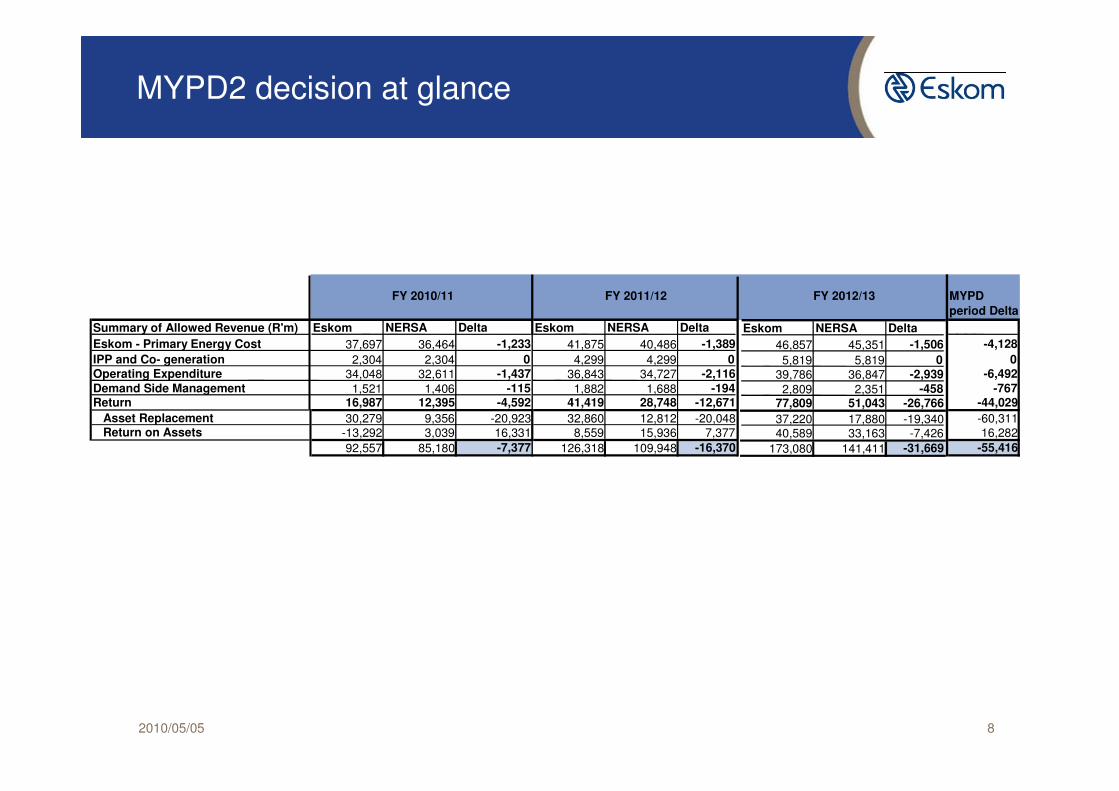
MYPD2 decision at glance
2010/05/05 8
MYPD
period Delta
Summary of Allowed Revenue (R'm) Eskom NERSA Delta Eskom NERSA Delta Eskom NERSA Delta
Eskom - Primary Energy Cost 37,697 36,464 -1,233 41,875 40,486 -1,389 46,857 45,351 -1,506 -4,128
IPP and Co- generation 2,304 2,304 0 4,299 4,299 0 5,819 5,819 0 0Operating Expenditure 34,048 32,611 -1,437 36,843 34,727 -2,116 39,786 36,847 -2,939 -6,492
Demand Side Management 1,521 1,406 -115 1,882 1,688 -194 2,809 2,351 -458 -767Return 16,987 12,395 -4,592 41,419 28,748 -12,671 77,809 51,043 -26,766 -44,029
Asset Replacement 30,279 9,356 -20,923 32,860 12,812 -20,048 37,220 17,880 -19,340 -60,311Return on Assets -13,292 3,039 16,331 8,559 15,936 7,377 40,589 33,163 -7,426 16,282
92,557 85,180 -7,377 126,318 109,948 -16,370 173,080 141,411 -31,669 -55,416
FY 2010/11 FY 2011/12 FY 2012/13
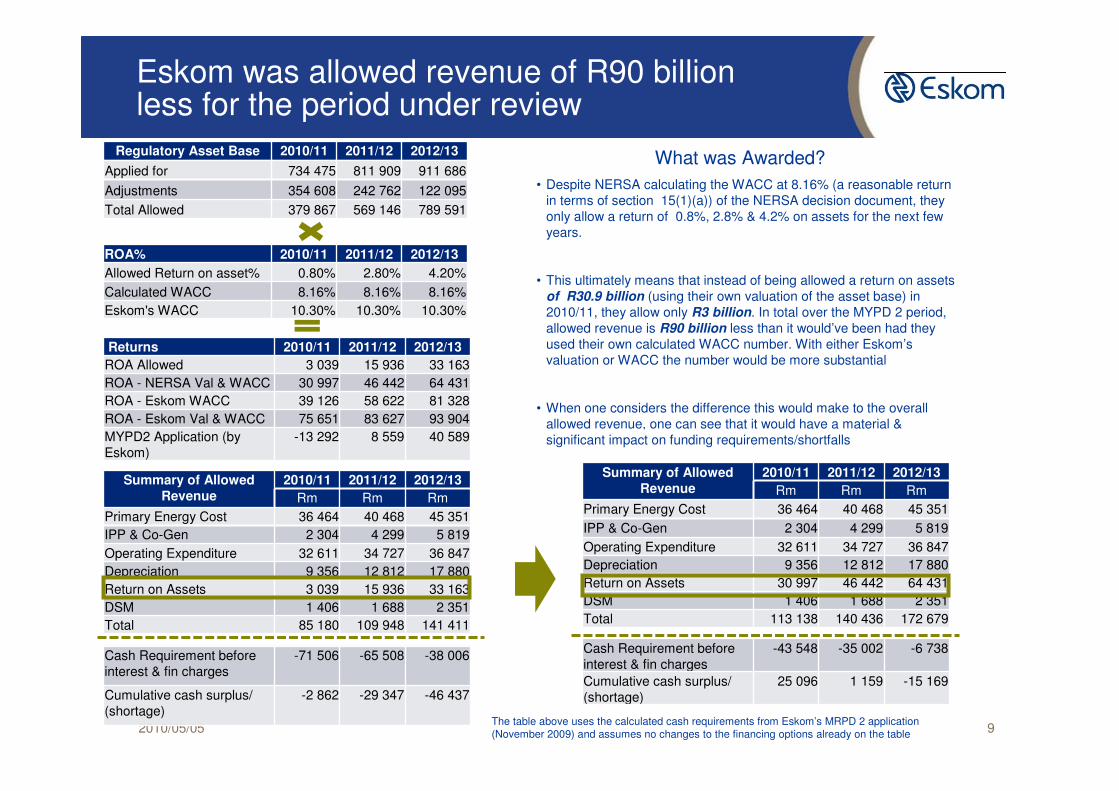
Eskom was allowed revenue of R90 billion less for the period under review
2010/05/05 92010/05/05
• Despite NERSA calculating the WACC at 8.16% (a reasonable returnin terms of section 15(1)(a)) of the NERSA decision document, they only allow a return of 0.8%, 2.8% & 4.2% on assets for the next few years.
• This ultimately means that instead of being allowed a return on assets of R30.9 billion (using their own valuation of the asset base) in 2010/11, they allow only R3 billion. In total over the MYPD 2 period, allowed revenue is R90 billion less than it would’ve been had they used their own calculated WACC number. With either Eskom’svaluation or WACC the number would be more substantial
• When one considers the difference this would make to the overallallowed revenue, one can see that it would have a material & significant impact on funding requirements/shortfalls
What was Awarded?
ROA% 2010/11 2011/12 2012/13
Allowed Return on asset% 0.80% 2.80% 4.20%
Calculated WACC 8.16% 8.16% 8.16%
Eskom's WACC 10.30% 10.30% 10.30%
Regulatory Asset Base 2010/11 2011/12 2012/13
Applied for 734 475 811 909 911 686
Adjustments 354 608 242 762 122 095
Total Allowed 379 867 569 146 789 591
Summary of Allowed
Revenue
2010/11 2011/12 2012/13
Rm Rm Rm
Primary Energy Cost 36 464 40 468 45 351
IPP & Co-Gen 2 304 4 299 5 819
Operating Expenditure 32 611 34 727 36 847
Depreciation 9 356 12 812 17 880
Return on Assets 3 039 15 936 33 163
DSM 1 406 1 688 2 351
Total 85 180 109 948 141 411
Summary of Allowed
Revenue
2010/11 2011/12 2012/13
Rm Rm Rm
Primary Energy Cost 36 464 40 468 45 351
IPP & Co-Gen 2 304 4 299 5 819
Operating Expenditure 32 611 34 727 36 847
Depreciation 9 356 12 812 17 880
Return on Assets 30 997 46 442 64 431
DSM 1 406 1 688 2 351
Total 113 138 140 436 172 679
Cash Requirement before interest & fin charges
-71 506 -65 508 -38 006
Cumulative cash surplus/ (shortage)
-2 862 -29 347 -46 437
Cash Requirement before interest & fin charges
-43 548 -35 002 -6 738
Cumulative cash surplus/ (shortage)
25 096 1 159 -15 169
The table above uses the calculated cash requirements from Eskom’s MRPD 2 application (November 2009) and assumes no changes to the financing options already on the table
Returns 2010/11 2011/12 2012/13
ROA Allowed 3 039 15 936 33 163
ROA - NERSA Val & WACC 30 997 46 442 64 431
ROA - Eskom WACC 39 126 58 622 81 328
ROA - Eskom Val & WACC 75 651 83 627 93 904
MYPD2 Application (by Eskom)
-13 292 8 559 40 589
Agenda
2010/05/05 10
Electricity Demand Forecasts
Objective, Scope and Approach
Funding Model
Funding Solutions
World Bank Loan Details
Overall Conclusions
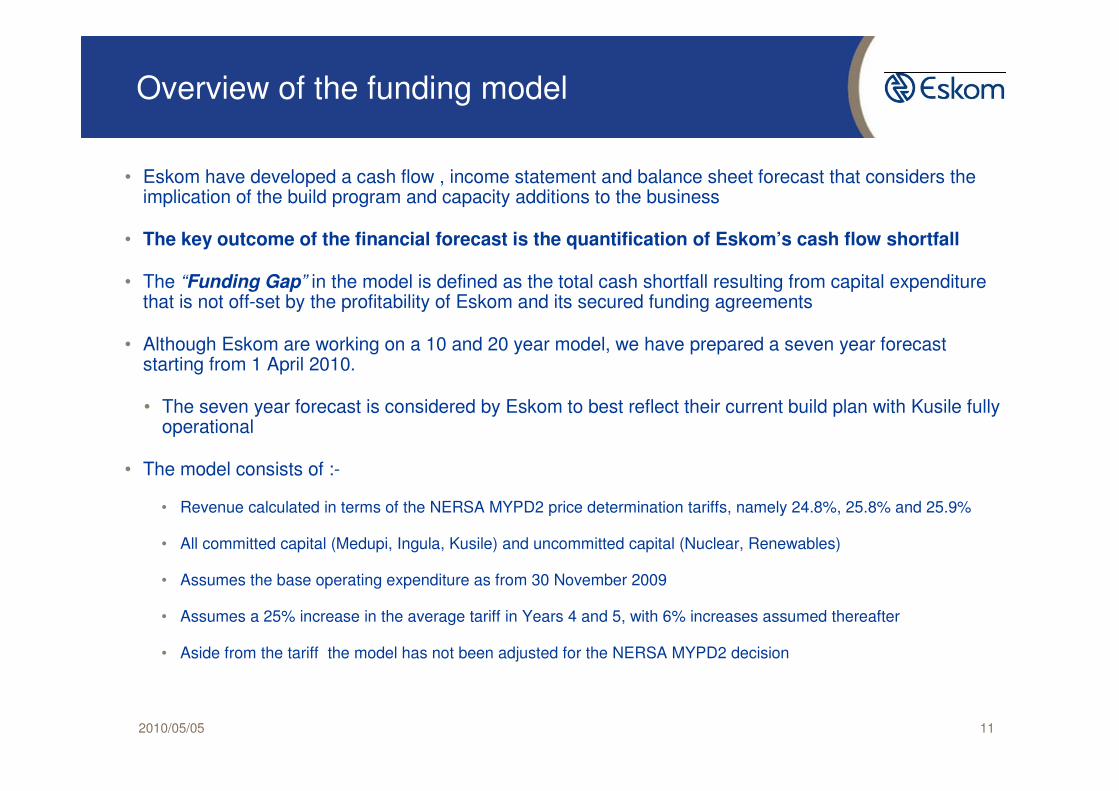
Overview of the funding model
2010/05/05 11
• Eskom have developed a cash flow , income statement and balance sheet forecast that considers the implication of the build program and capacity additions to the business
• The key outcome of the financial forecast is the quantification of Eskom’s cash flow shortfall
• The “Funding Gap” in the model is defined as the total cash shortfall resulting from capital expenditure that is not off-set by the profitability of Eskom and its secured funding agreements
• Although Eskom are working on a 10 and 20 year model, we have prepared a seven year forecast starting from 1 April 2010.
• The seven year forecast is considered by Eskom to best reflect their current build plan with Kusile fully operational
• The model consists of :-
• Revenue calculated in terms of the NERSA MYPD2 price determination tariffs, namely 24.8%, 25.8% and 25.9%
• All committed capital (Medupi, Ingula, Kusile) and uncommitted capital (Nuclear, Renewables)
• Assumes the base operating expenditure as from 30 November 2009
• Assumes a 25% increase in the average tariff in Years 4 and 5, with 6% increases assumed thereafter
• Aside from the tariff the model has not been adjusted for the NERSA MYPD2 decision
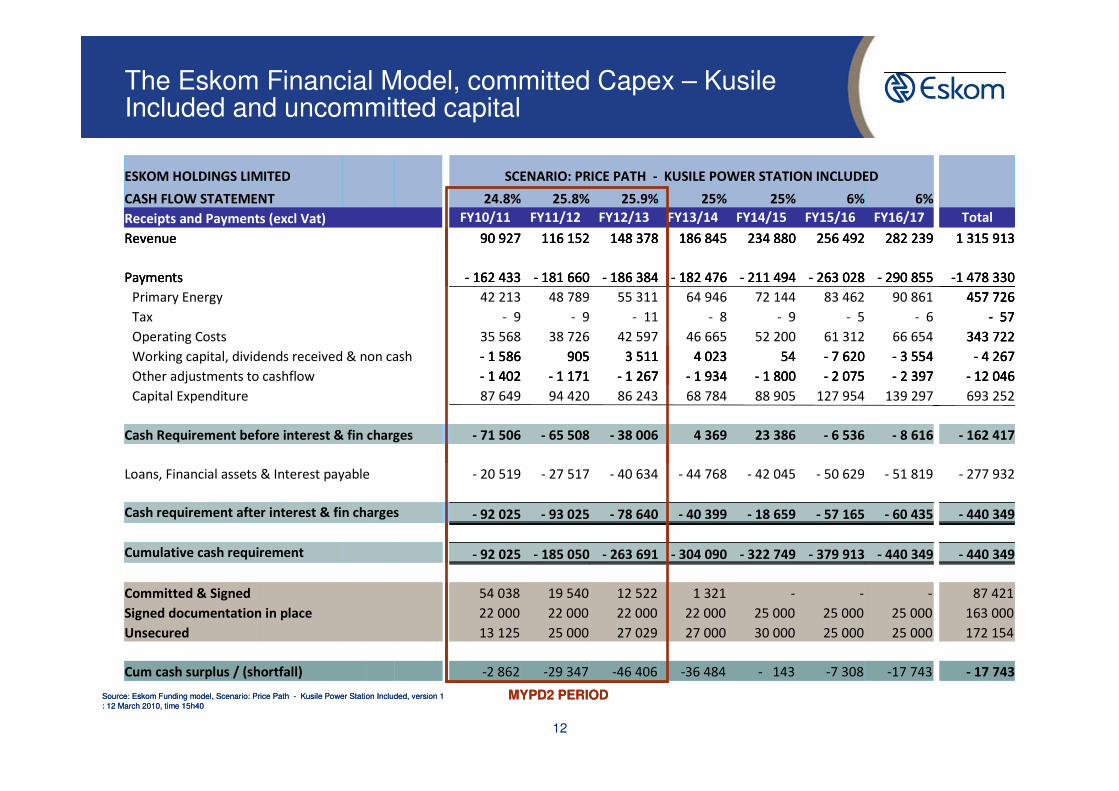
The Eskom Financial Model, committed Capex – KusileIncluded and uncommitted capital
12
Source: Eskom Funding model, Scenario: Price Path - Kusile Power Station Included, version 1 : 12 March 2010, time 15h40
ESKOM HOLDINGS LIMITED SCENARIO: PRICE PATH - KUSILE POWER STATION INCLUDED
CASH FLOW STATEMENT 24.8% 25.8% 25.9% 25% 25% 6% 6%
Receipts and Payments (excl Vat) FY10/11 FY11/12 FY12/13 FY13/14 FY14/15 FY15/16 FY16/17 Total
Revenue 90 927 116 152 148 378 186 845 234 880 256 492 282 239 1 315 913
Payments - 162 433 - 181 660 - 186 384 - 182 476 - 211 494 - 263 028 - 290 855 -1 478 330
Primary Energy 42 213 48 789 55 311 64 946 72 144 83 462 90 861 457 726
Tax - 9 - 9 - 11 - 8 - 9 - 5 - 6 - 57
Operating Costs 35 568 38 726 42 597 46 665 52 200 61 312 66 654 343 722
Working capital, dividends received & non cash - 1 586 905 3 511 4 023 54 - 7 620 - 3 554 - 4 267
Other adjustments to cashflow - 1 402 - 1 171 - 1 267 - 1 934 - 1 800 - 2 075 - 2 397 - 12 046
Capital Expenditure 87 649 94 420 86 243 68 784 88 905 127 954 139 297 693 252
Cash Requirement before interest & fin charges - 71 506 - 65 508 - 38 006 4 369 23 386 - 6 536 - 8 616 - 162 417
Loans, Financial assets & Interest payable - 20 519 - 27 517 - 40 634 - 44 768 - 42 045 - 50 629 - 51 819 - 277 932
Cash requirement after interest & fin charges - 92 025 - 93 025 - 78 640 - 40 399 - 18 659 - 57 165 - 60 435 - 440 349
Cumulative cash requirement - 92 025 - 185 050 - 263 691 - 304 090 - 322 749 - 379 913 - 440 349 - 440 349
Committed & Signed 54 038 19 540 12 522 1 321 - - - 87 421
Signed documentation in place 22 000 22 000 22 000 22 000 25 000 25 000 25 000 163 000
Unsecured 13 125 25 000 27 029 27 000 30 000 25 000 25 000 172 154
Cum cash surplus / (shortfall) -2 862 -29 347 -46 406 -36 484 - 143 -7 308 -17 743 - 17 743
MYPD2 PERIODSource: Eskom Funding model, Scenario: Price Path - Kusile Power Station Included, version 1 : 12 March 2010, time 15h40
ESKOM HOLDINGS LIMITED SCENARIO: PRICE PATH - KUSILE POWER STATION INCLUDED
CASH FLOW STATEMENT 24.8% 25.8% 25.9% 25% 25% 6% 6%
Receipts and Payments (excl Vat) FY10/11 FY11/12 FY12/13 FY13/14 FY14/15 FY15/16 FY16/17 Total
Revenue 90 927 116 152 148 378 186 845 234 880 256 492 282 239 1 315 913
Payments - 162 433 - 181 660 - 186 384 - 182 476 - 211 494 - 263 028 - 290 855 -1 478 330
Primary Energy 42 213 48 789 55 311 64 946 72 144 83 462 90 861 457 726
Tax - 9 - 9 - 11 - 8 - 9 - 5 - 6 - 57
Operating Costs 35 568 38 726 42 597 46 665 52 200 61 312 66 654 343 722
Working capital, dividends received & non cash - 1 586 905 3 511 4 023 54 - 7 620 - 3 554 - 4 267
Other adjustments to cashflow - 1 402 - 1 171 - 1 267 - 1 934 - 1 800 - 2 075 - 2 397 - 12 046
Capital Expenditure 87 649 94 420 86 243 68 784 88 905 127 954 139 297 693 252
Cash Requirement before interest & fin charges - 71 506 - 65 508 - 38 006 4 369 23 386 - 6 536 - 8 616 - 162 417
Loans, Financial assets & Interest payable - 20 519 - 27 517 - 40 634 - 44 768 - 42 045 - 50 629 - 51 819 - 277 932
Cash requirement after interest & fin charges - 92 025 - 93 025 - 78 640 - 40 399 - 18 659 - 57 165 - 60 435 - 440 349
Cumulative cash requirement - 92 025 - 185 050 - 263 691 - 304 090 - 322 749 - 379 913 - 440 349 - 440 349
Committed & Signed 54 038 19 540 12 522 1 321 - - - 87 421
Signed documentation in place 22 000 22 000 22 000 22 000 25 000 25 000 25 000 163 000
Unsecured 13 125 25 000 27 029 27 000 30 000 25 000 25 000 172 154
Cum cash surplus / (shortfall) -2 862 -29 347 -46 406 -36 484 - 143 -7 308 -17 743 - 17 743
MYPD2 PERIOD
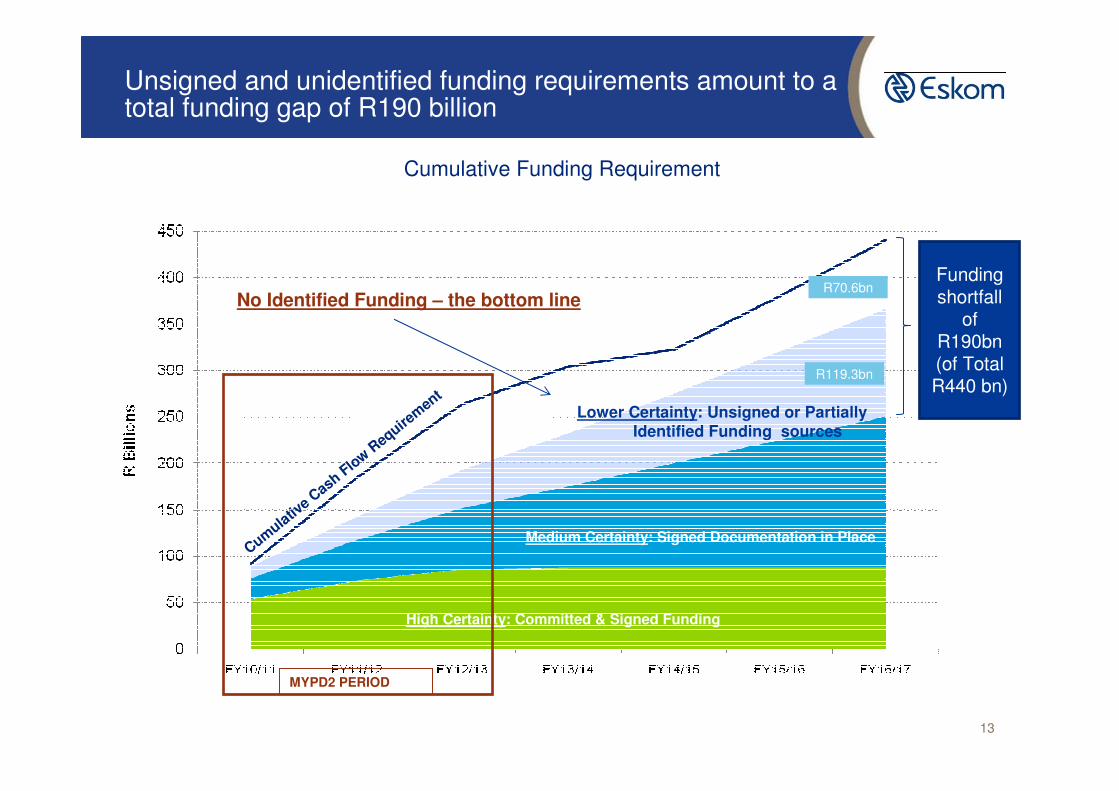
Unsigned and unidentified funding requirements amount to a total funding gap of R190 billion
Cumulative Funding Requirement
High Certainty: Committed & Signed Funding
Medium Certainty: Signed Documentation in Place
No Identified Funding – the bottom line
Cumula
tive C
ash Flo
w R
equirem
ent
Funding shortfall
of R190bn (of Total R440 bn)
Lower Certainty: Unsigned or Partially Identified Funding sources
R70.6bn
R119.3bn
MYPD2 PERIOD
13
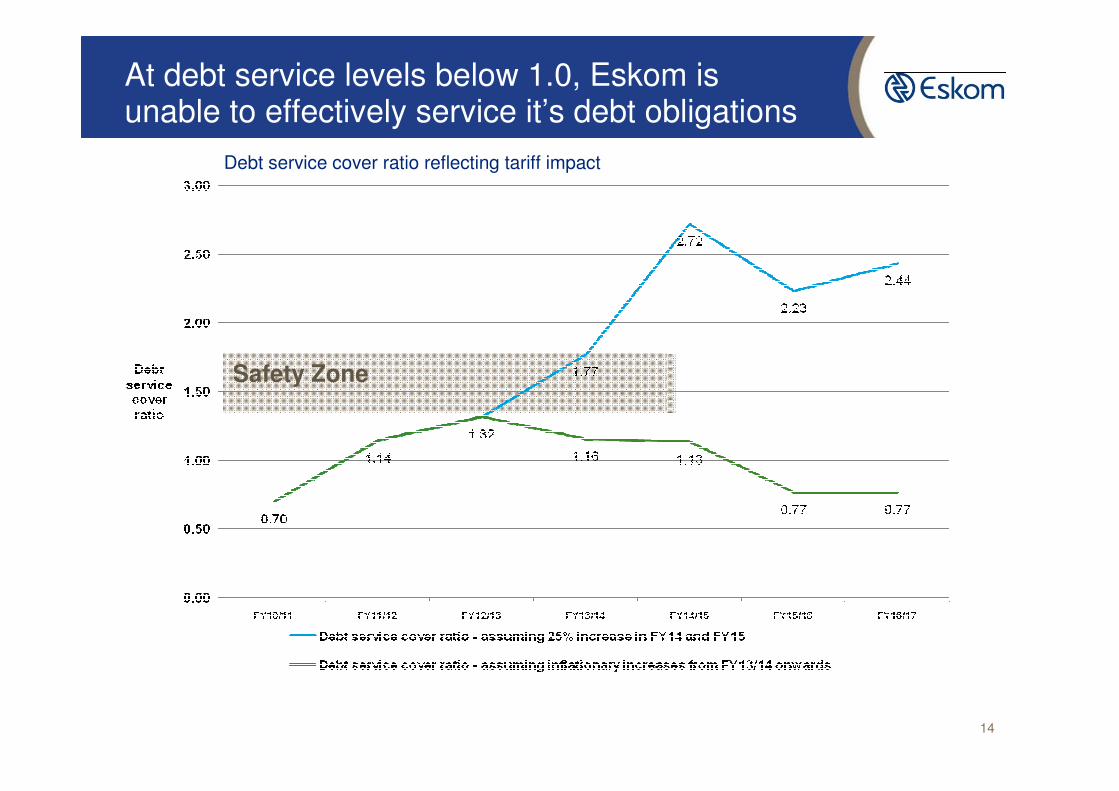
At debt service levels below 1.0, Eskom is unable to effectively service it’s debt obligations
Safety Zone
Debt service cover ratio reflecting tariff impact
14

A risk of the unsecured funding gap is a potential downgrading in Eskom’s credit rating
2010/05/05 15
• All the rating agencies have Eskom on a negative outlook due to uncertainties relating to the funding gap and the regulatory environment beyond the three years
• A preliminary study by Eskom has been undertaken with respect to the financial impact of a fall in the rating. These preliminary indications calculate this impact to be between R4.3 billion and R15.9 billion based on a funding requirement of R150 billion.
The above scenarios are underpinned by:• Sovereign rating and support• Eskom remaining the dominant player in the South African
electricity market• No adverse material changes to the regulatory environment
Entity Rating Moody’s S&P Fitch Ratings
Eskom Holdings Limited
Foreign Currency
Baa2 *BBB+ -
Local Currency
Baa2 *A- *A
ZAR Long-term
- AA+ **AAA
ZAR Short-term
- A1 **F1+
Outlook Negative *Negative *Negative**Stable
Assumption & Supporting Analysis Commentary
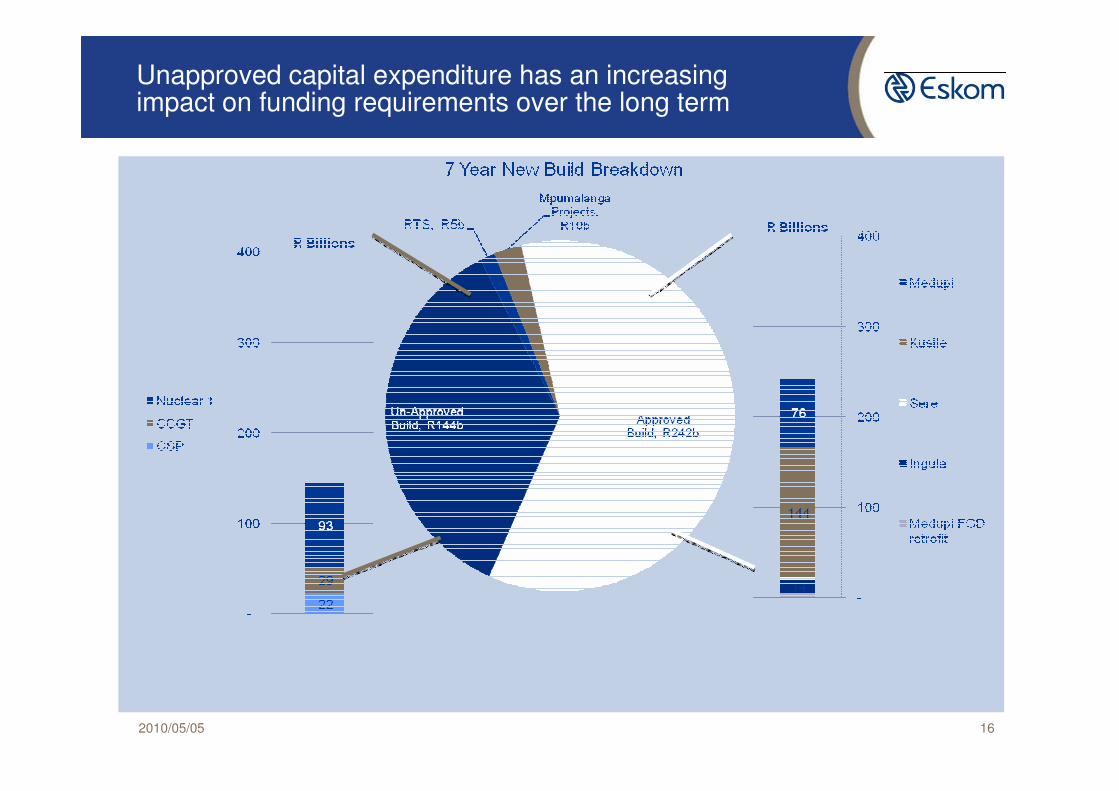
Unapproved capital expenditure has an increasing impact on funding requirements over the long term
2010/05/05 16
Agenda
2010/05/05 17
Electricity Demand Forecasts
Objective, Scope and Approach
Funding Model
Funding Solutions
World Bank Loan Details
Overall Conclusions
Agenda
2010/05/05 18
Electricity Demand Forecasts
Objective, Scope and Approach
Funding Model
Funding Solutions
World Bank Loan Details
Overall Conclusions
Internal Review
JP Morgan Update
Credit Suisse update
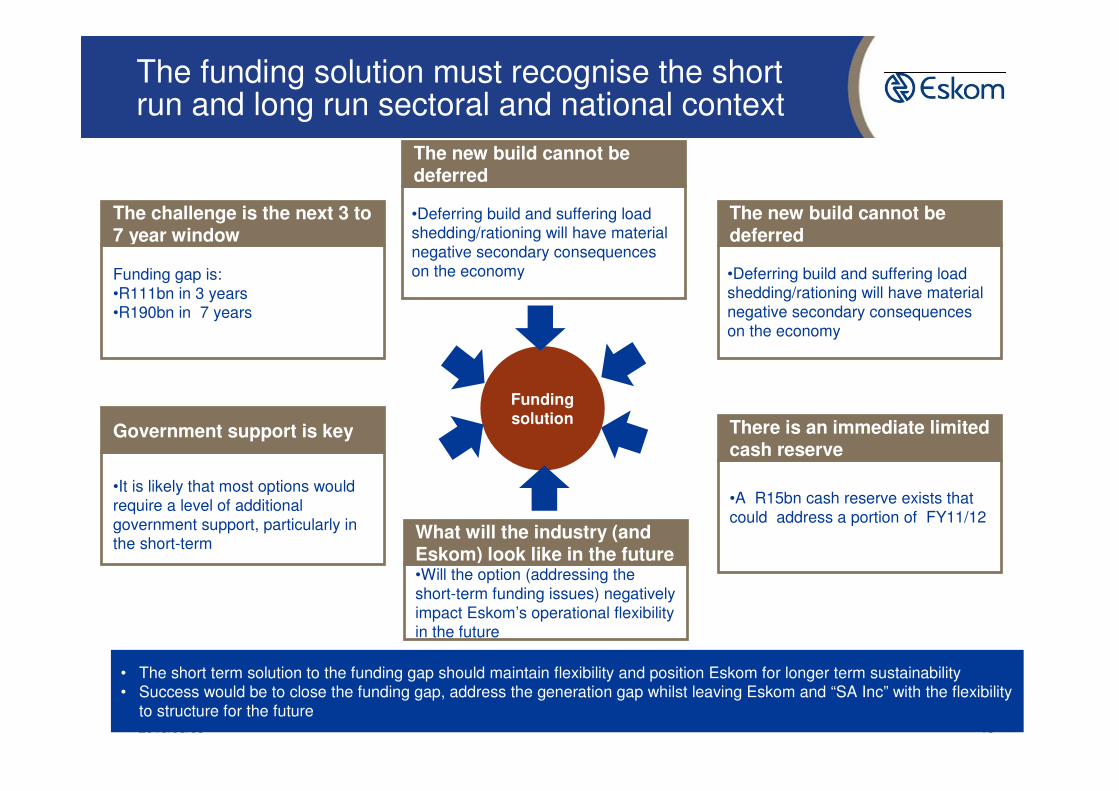
The funding solution must recognise the short run and long run sectoral and national context
2010/05/05 19
Funding solution
The challenge is the next 3 to 7 year window
• The short term solution to the funding gap should maintain flexibility and position Eskom for longer term sustainability• Success would be to close the funding gap, address the generation gap whilst leaving Eskom and “SA Inc” with the flexibility
to structure for the future
Funding gap is:•R111bn in 3 years•R190bn in 7 years
Government support is key There is an immediate limited cash reserve
•A R15bn cash reserve exists that could address a portion of FY11/12
The new build cannot be deferred
•Deferring build and suffering load shedding/rationing will have material negative secondary consequences on the economy
•It is likely that most options would require a level of additional government support, particularly in the short-term
What will the industry (and Eskom) look like in the future•Will the option (addressing the short-term funding issues) negatively impact Eskom’s operational flexibility in the future
The new build cannot be deferred
•Deferring build and suffering load shedding/rationing will have material negative secondary consequences on the economy
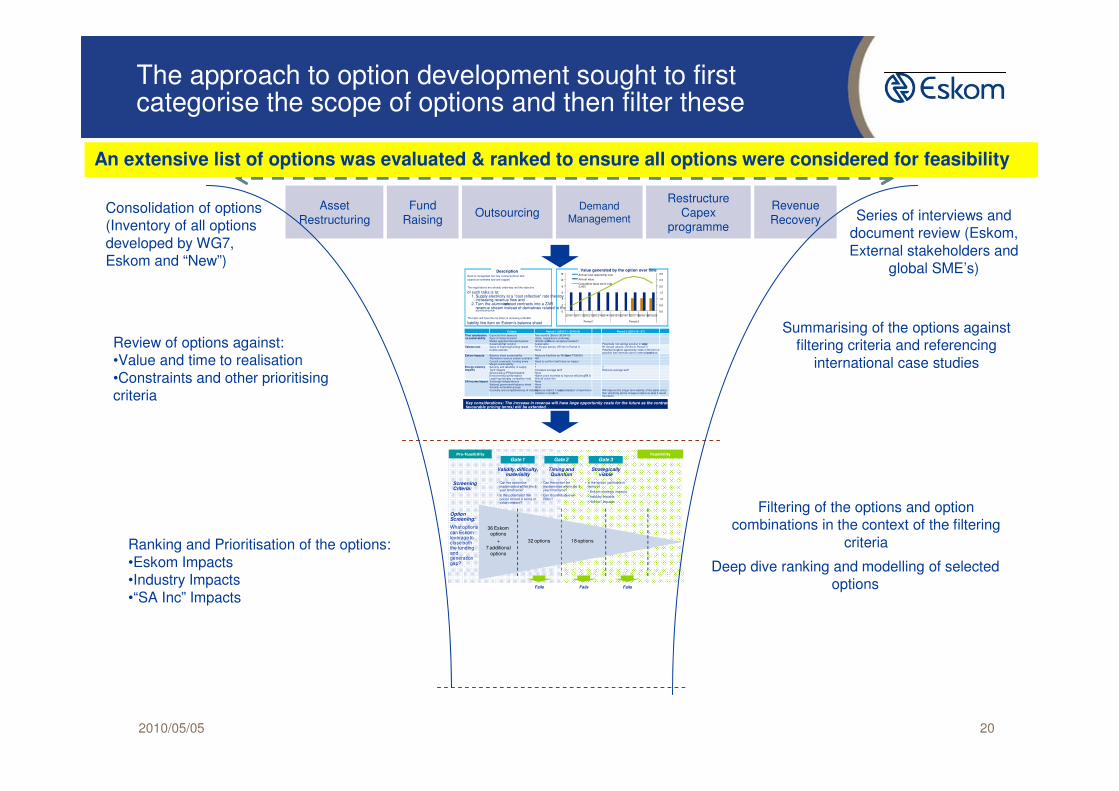
The approach to option development sought to first categorise the scope of options and then filter these
2010/05/05 20
Consolidation of options (Inventory of all options developed by WG7, Eskom and “New”)
Asset Restructuring
Review of options against:•Value and time to realisation•Constraints and other prioritising criteria
Ranking and Prioritisation of the options:•Eskom Impacts•Industry Impacts•“SA Inc” Impacts
Fund Raising
OutsourcingDemand
ManagementRevenue Recovery Series of interviews and
document review (Eskom, External stakeholders and
global SME’s)
Summarising of the options against filtering criteria and referencing
international case studies
Filtering of the options and option combinations in the context of the filtering
criteria
Deep dive ranking and modelling of selected options
Restructure Capex
programme
Gate 1 Gate 2 Gate 3
• Can the option be implemented within the 5 year timeframe?
• Is the potential of the option limited in terms of value creation?
• Can the option be implemented within the 3 year timeframe?
• Can it contribute over R5bn?
• Is the option justif iable in terms of
• Eskom strategic impacts
• Industry impacts
• “SA Inc” impacts
Screening Criteria:
Validity, difficulty, materiality
Timing and Quantum
Strategically viable
Option Screening:
What options can Eskom leverage to close both the funding and generation gap?
Fails
Pre-feasibility Feasibility
Fails Fails
36 Eskom options
7 additional options
+ 18 options32 options
Criteria Period 1 (2010/11 - 2014/15) Period 2 (2015/16 - X?)
Time to realisationvs sustainability
Expected time to execute Two months (Before 30/04/10)Ease of implementation Likely, negotiations underwayMarket appetite/interested parties Hillside and Mozal- receptive/resistant?Sustainability of solution Sustainable Potentially not optimal solution in long-term
Value vs cost Value of financing/funding raised R1.5m per annum, (R7.5m in Period 1) R1.5m per annum, (R7.5m in Period 1)Cost to execute None Potential long-term opportunity costs in the form of
possible lost revenues due to extension of contracts Eskom impacts Balance sheet sustainability Reduces liabilities by R6.8bn (end FY08/09 )
Alternative revenue stream available N/ACurrent covenants, funding terms Need to confirm it will have no impactMargin sustainability ?
Energy industry impacts
Security and reliability of supply ? ?Tariff impacts Increases average tariff Reduces average tariffStructural (e.g.IPP participation ) NoneEnvironmental performance Higher price incentive to improve efficiency in S-T?Legal/regulatory (eg. competition law) Should check this
SA income impact Sovereign independence NoneNational government balance sheet NoneSocially vulnerable groups None Economy and competitiveness of industryReduces implicit 'cross-subsidisation' of aluminium
smelters in short-termWill improve the longer term viability of the plants since their electricity will be cheaper relative to what it would have been.
11Key considerations: The increase in revenue will have large opportunity costs for the future as the contracts (at relatively favourable pricing terms) will be extended. .
Seek to renegotiate four key contracts (three with
aluminium smelters and one copper)
The negotiations are already underway and the objective
of such talks is to:1. Supply electricity at a "cost reflective" rate thereby
increasing revenue flow and 2. Turn the aluminium-related contracts into a ZAR
revenue stream instead of derivatives related to the aluminium price
The latter will have the net effect of removing a R6.8bn
liability line item on Eskom's balance sheet
Description
0.0
0.5
1.0
1.5
2.0
2.5
3.0
0
2
4
6
8
10
12
2010/112011/122012/132013/142014/152015/162016/172017/182018/192019/20
Period 1 Period 2
Annual cost/ opportunity cost
Annual value
Cumulative value net of cost (LHS)
Value generated by the option over time
An extensive list of options was evaluated & ranked to ensure all options were considered for feasibility
Funding Advisors were then appointed to look at the options
• After RFP process, JP Morgan have been appointed overall strategic funding advisor and Credit Suisse have been appointed as advisor on potential Kusile Equity
• Both mandates are to be completed by the end of May 2010
• Edward Nathan Sonnenberg have been appointed as legal advisors
• Best options will be presented to Board and Shareholder in June 2010
• After that financial partners will be selected to implement the best approved options
2010/05/05 21
Agenda
2010/05/05 22
Electricity Demand Forecasts
Objective, Scope and Approach
Funding Model
Funding Solutions
World Bank Loan Details
Overall Conclusions
Internal Review
JP Morgan Update
Credit Suisse update
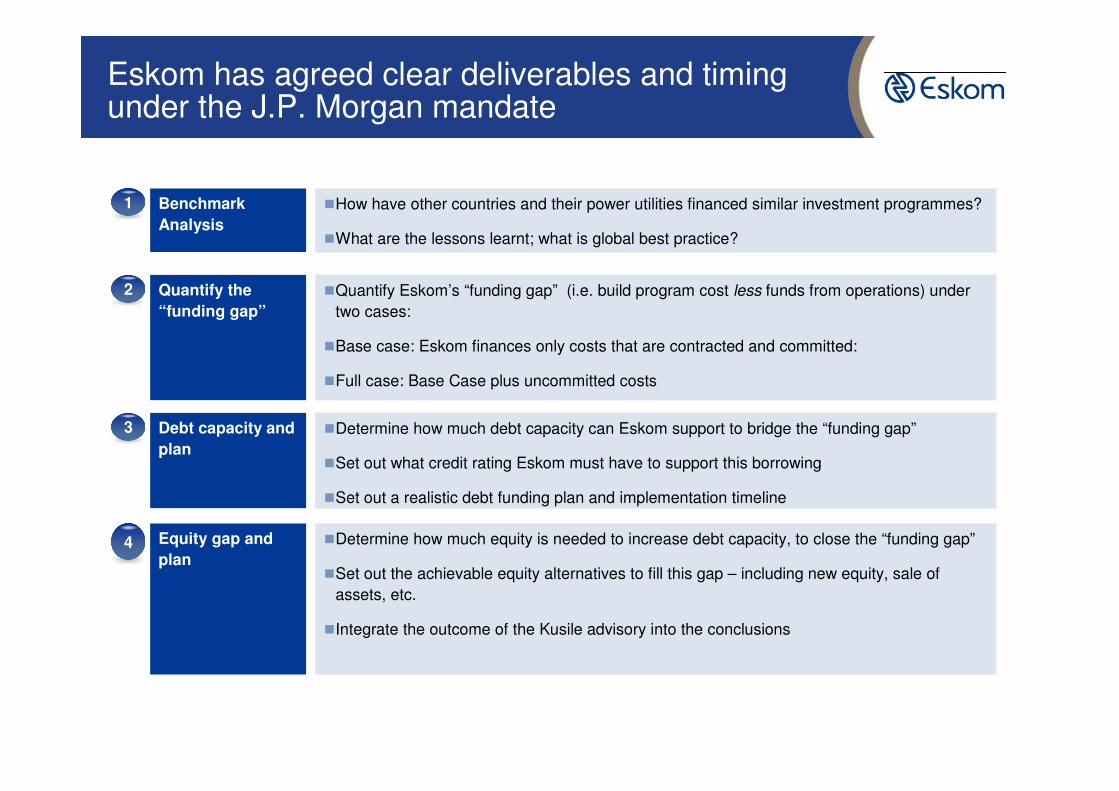
Eskom has agreed clear deliverables and timing under the J.P. Morgan mandate
Benchmark
Analysis
�How have other countries and their power utilities financed similar investment programmes?
�What are the lessons learnt; what is global best practice?
1
Quantify the
“funding gap”
�Quantify Eskom’s “funding gap” (i.e. build program cost less funds from operations) under
two cases:
�Base case: Eskom finances only costs that are contracted and committed:
�Full case: Base Case plus uncommitted costs
2
Debt capacity and
plan
�Determine how much debt capacity can Eskom support to bridge the “funding gap”
�Set out what credit rating Eskom must have to support this borrowing
�Set out a realistic debt funding plan and implementation timeline
3
Equity gap and
plan
�Determine how much equity is needed to increase debt capacity, to close the “funding gap”
�Set out the achievable equity alternatives to fill this gap – including new equity, sale of
assets, etc.
�Integrate the outcome of the Kusile advisory into the conclusions
4
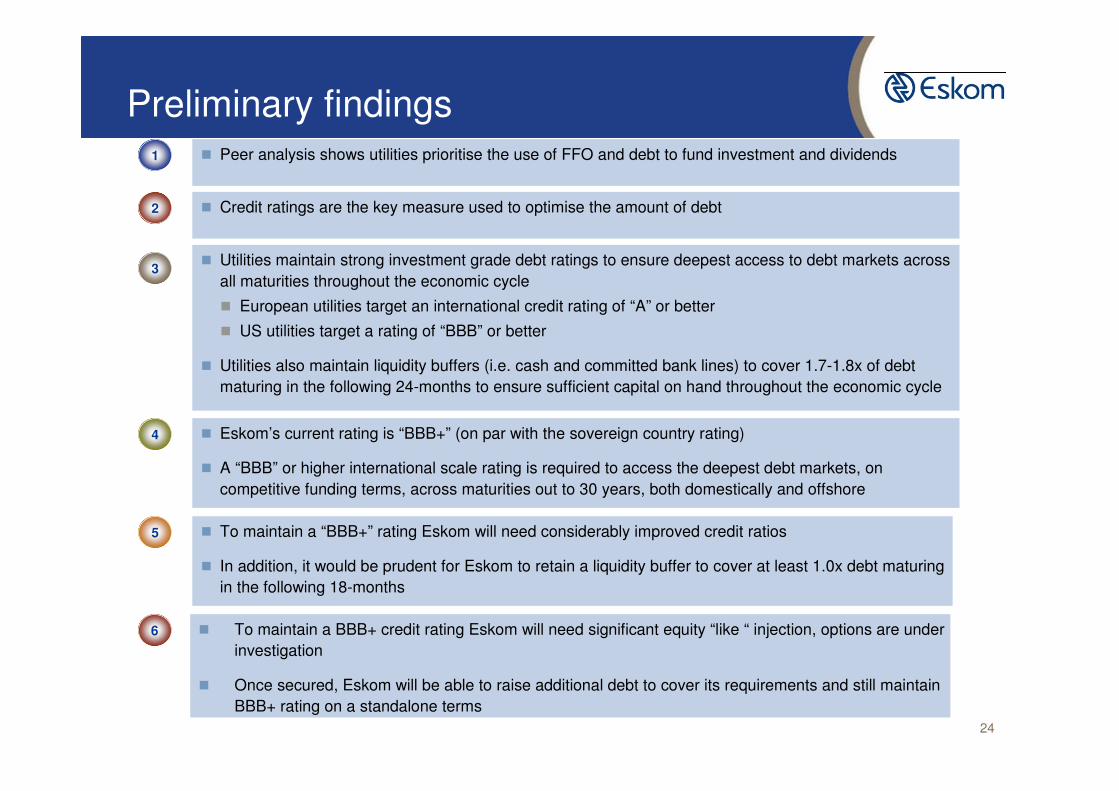
Preliminary findings� Peer analysis shows utilities prioritise the use of FFO and debt to fund investment and dividends1
� Credit ratings are the key measure used to optimise the amount of debt2
� Utilities maintain strong investment grade debt ratings to ensure deepest access to debt markets across
all maturities throughout the economic cycle
� European utilities target an international credit rating of “A” or better
� US utilities target a rating of “BBB” or better
� Utilities also maintain liquidity buffers (i.e. cash and committed bank lines) to cover 1.7-1.8x of debt
maturing in the following 24-months to ensure sufficient capital on hand throughout the economic cycle
3
4 � Eskom’s current rating is “BBB+” (on par with the sovereign country rating)
� A “BBB” or higher international scale rating is required to access the deepest debt markets, on
competitive funding terms, across maturities out to 30 years, both domestically and offshore
5 � To maintain a “BBB+” rating Eskom will need considerably improved credit ratios
� In addition, it would be prudent for Eskom to retain a liquidity buffer to cover at least 1.0x debt maturing
in the following 18-months
24
� To maintain a BBB+ credit rating Eskom will need significant equity “like “ injection, options are under
investigation
� Once secured, Eskom will be able to raise additional debt to cover its requirements and still maintain
BBB+ rating on a standalone terms
6
Summary of Approach & Timelines
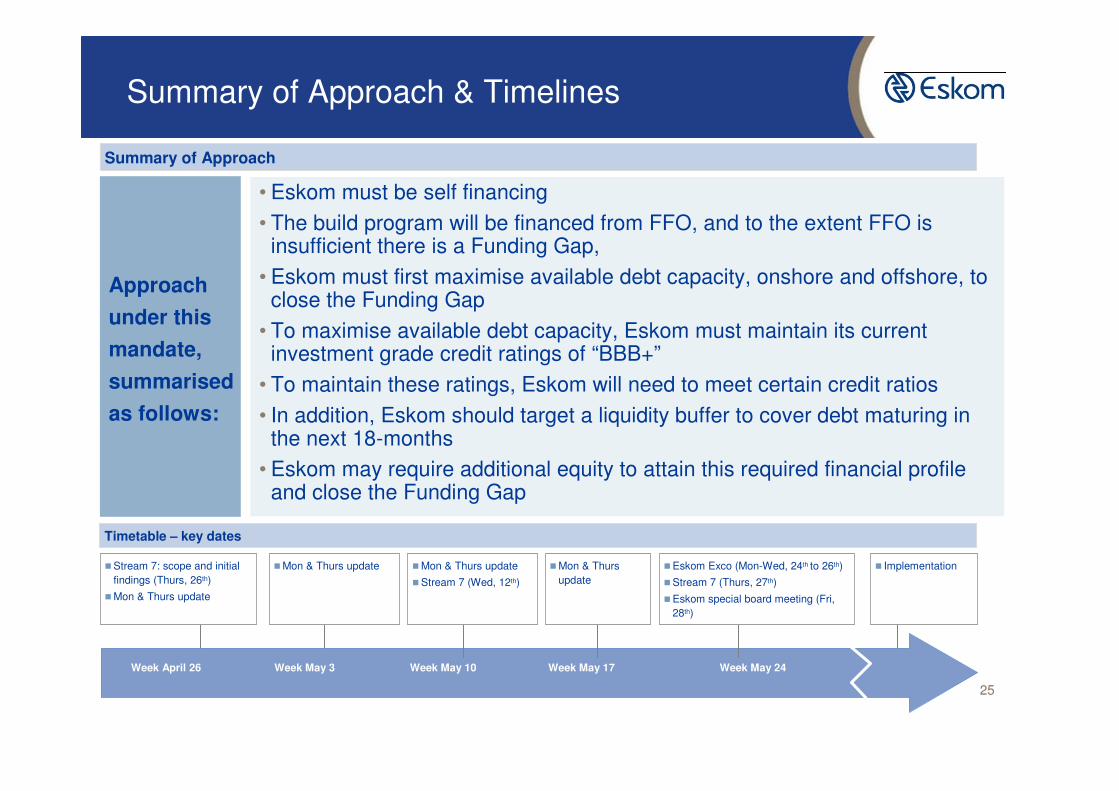
Timetable – key datesTimetable – key dates
�Stream 7: scope and initial
findings (Thurs, 26th)
�Mon & Thurs update
�Mon & Thurs update
Week April 26
� Implementation
Week May 3 Week May 10 Week May 17 Week May 24
�Mon & Thurs update
�Stream 7 (Wed, 12th)
�Mon & Thurs
update
�Eskom Exco (Mon-Wed, 24th to 26th)
�Stream 7 (Thurs, 27th)
�Eskom special board meeting (Fri,
28th)
Summary of ApproachSummary of Approach
Approach
under this
mandate,
summarised
as follows:
• Eskom must be self financing
• The build program will be financed from FFO, and to the extent FFO is insufficient there is a Funding Gap,
• Eskom must first maximise available debt capacity, onshore and offshore, to close the Funding Gap
• To maximise available debt capacity, Eskom must maintain its current investment grade credit ratings of “BBB+”
• To maintain these ratings, Eskom will need to meet certain credit ratios
• In addition, Eskom should target a liquidity buffer to cover debt maturing in the next 18-months
• Eskom may require additional equity to attain this required financial profile and close the Funding Gap
25
Agenda
2010/05/05 26
Electricity Demand Forecasts
Objective, Scope and Approach
Funding Model
Funding Solutions
World Bank Loan Details
Overall Conclusions
Internal Review
JP Morgan Update
Credit Suisse update
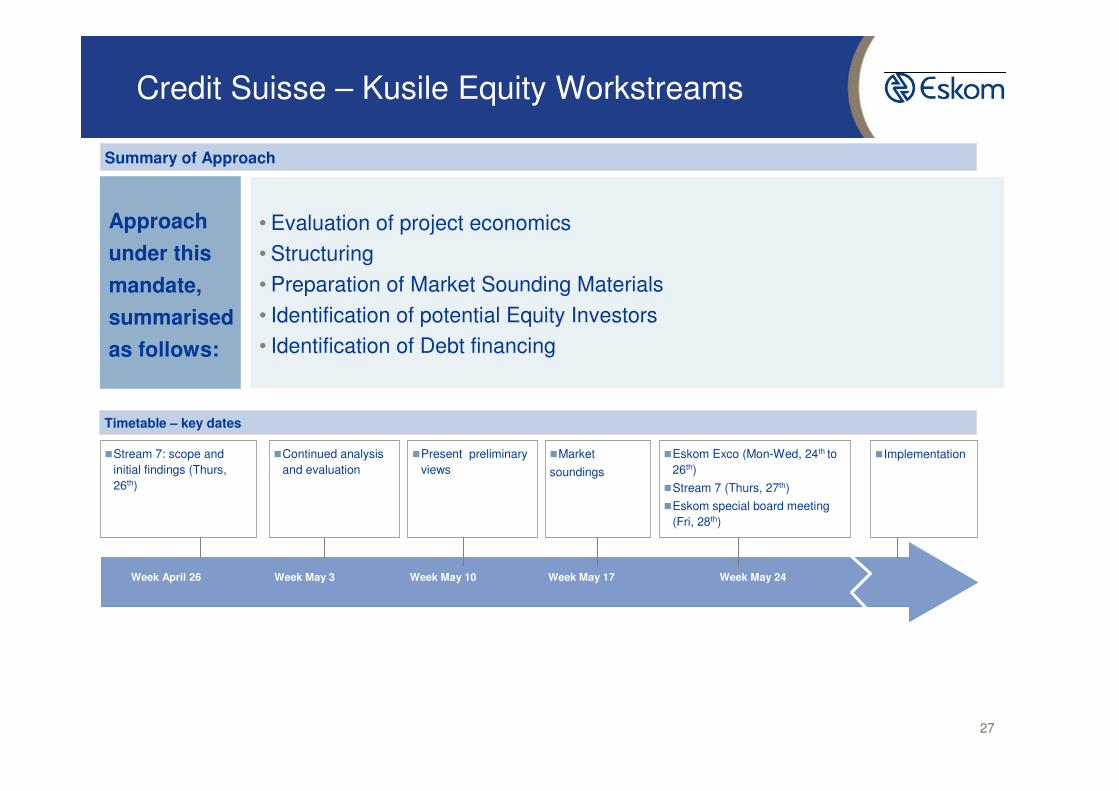
Timetable – key datesTimetable – key dates
�Stream 7: scope and
initial findings (Thurs,
26th)
�Continued analysis
and evaluation
Week April 26
�Implementation
Week May 3 Week May 10 Week May 17 Week May 24
�Present preliminary
views
�Market
soundings
�Eskom Exco (Mon-Wed, 24th to
26th)
�Stream 7 (Thurs, 27th)
�Eskom special board meeting
(Fri, 28th)
Summary of ApproachSummary of Approach
Approach
under this
mandate,
summarised
as follows:
• Evaluation of project economics
• Structuring
• Preparation of Market Sounding Materials
• Identification of potential Equity Investors
• Identification of Debt financing
27
Credit Suisse – Kusile Equity Workstreams

Agenda
2010/05/05 28
Electricity Demand Forecasts
Objective, Scope and Approach
Funding Model
Funding Solutions
World Bank Loan Details
Overall Conclusions
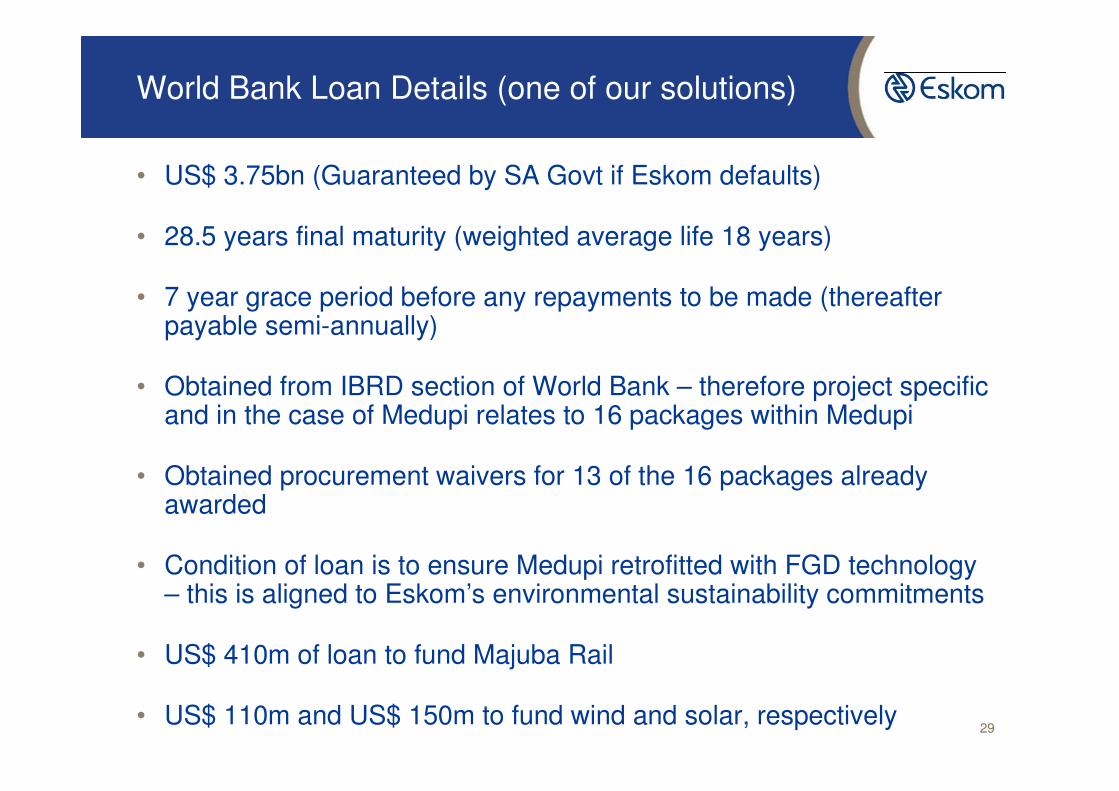
World Bank Loan Details (one of our solutions)
• US$ 3.75bn (Guaranteed by SA Govt if Eskom defaults)
• 28.5 years final maturity (weighted average life 18 years)
• 7 year grace period before any repayments to be made (thereafterpayable semi-annually)
• Obtained from IBRD section of World Bank – therefore project specific and in the case of Medupi relates to 16 packages within Medupi
• Obtained procurement waivers for 13 of the 16 packages already awarded
• Condition of loan is to ensure Medupi retrofitted with FGD technology – this is aligned to Eskom’s environmental sustainability commitments
• US$ 410m of loan to fund Majuba Rail
• US$ 110m and US$ 150m to fund wind and solar, respectively29
Agenda
2010/05/05 30
Electricity Demand Forecasts
Objective, Scope and Approach
Funding Model
Funding Solutions
World Bank Loan Details
Overall Conclusions

Overall conclusions
2010/05/05 31
CLOSING THE FUNDING GAP (Rbn) -POTENTIAL SOLUTIONS
Gap
3 Year
(cum)
7 Year
(cum)
Total funding gap (after secured and high certainty) 111 190
less:
Opening cash position -15 -15
New technology beyond 2017 in ringfenced entity (eg Nuclear) 0 -93
Savings through efficiency -10 -20
86 62
Potential Funding
Equity in power station/ Equity in Eskom 40 40
International Bonds/ Additional ECAs 45 45
(Note: R60bn of Govt guarantee is as yet uncommitted) 85 85