presentation title - maharashtra electricity regulatory ... 58 42/tpc _license application... ·...
TRANSCRIPT
1
Presentation Title ( Arial, Font size 28 )
Date, Venue, etc..( Arial, Font size 18 )Tata Power-Distribution: Application for Distribution LicenseCase No 90 of 2014- Technical Validation Session
17th April 2014
2
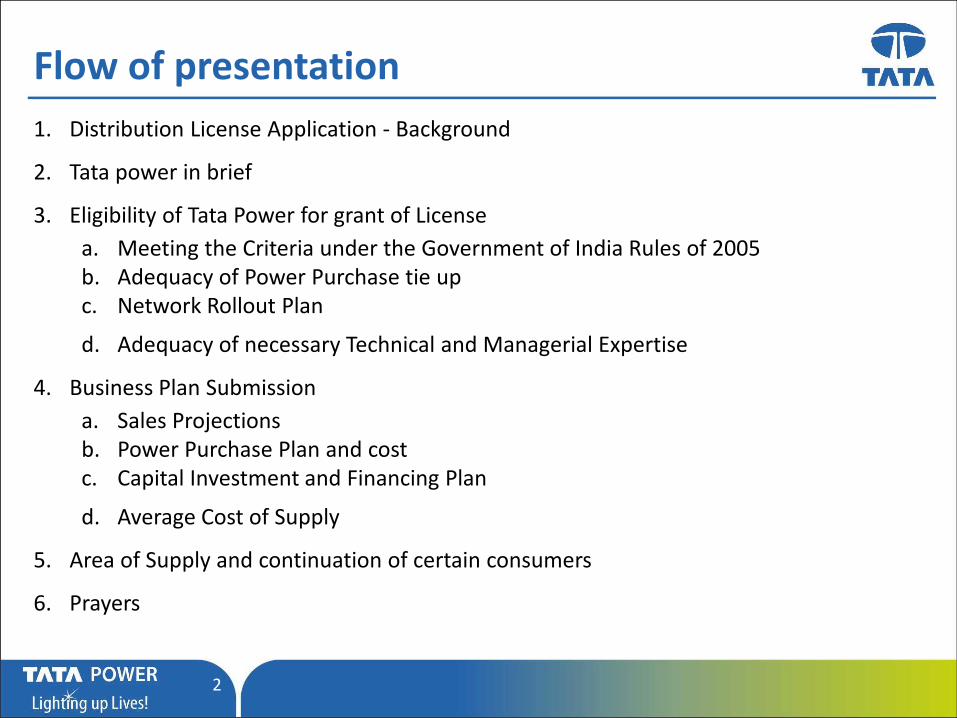
Flow of presentation
1. Distribution License Application - Background
2. Tata power in brief
3. Eligibility of Tata Power for grant of License
a. Meeting the Criteria under the Government of India Rules of 2005b. Adequacy of Power Purchase tie upc. Network Rollout Plan
d. Adequacy of necessary Technical and Managerial Expertise
4. Business Plan Submission
a. Sales Projectionsb. Power Purchase Plan and costc. Capital Investment and Financing Plan
d. Average Cost of Supply
5. Area of Supply and continuation of certain consumers
6. Prayers
3
Distribution License Application: Background

4
Distribution License: Background
Hon’ble Commission has initiated the process of Expression of Interest (EoI) for the
License Area in North and South Mumbai on 1st January 2014
Interested parties were to submit the Expression of Interest by 31st January 2014
Three Parties submitted the EoI including Tata Power –D
The Hon’ble Commission directed Tata Power to submit formal application
License Application was submitted by Tata Power on 7th April 2014 under Section
14 and Section 15 of the Electricity Act 2003

5
Tata Power in brief

6
Tata Power background
100+ year legacy
Part of the $100 billion
TATA Group...
One of the most reputed
and trusted industry
houses from India
Growing international
presencePioneer in technology
adoption
Presence in fuel, generation,
transmission, distribution and trading

7
Tata Power is India’s largest Integrated Power Utility
7
• Founded in 1906 to supply power to Mumbai
– First hydro plant commissioned in 1915
– Was an integrated player and a licensee for - Generation , Transmission and Distribution (1907,1919,1921,1953)
– Set up thermal power plants in Mumbai in the 1950s
• Expanded in India after private sector reforms in 1990s
Fuel Fuel Logistics Generation Transmission Distribution Power Trading
Presence across the entire value chain
• Thrust on renewable energy sources including hydro, wind, solar and geothermal
• Successful Public Private Partnerships in generation, transmission and distribution
8
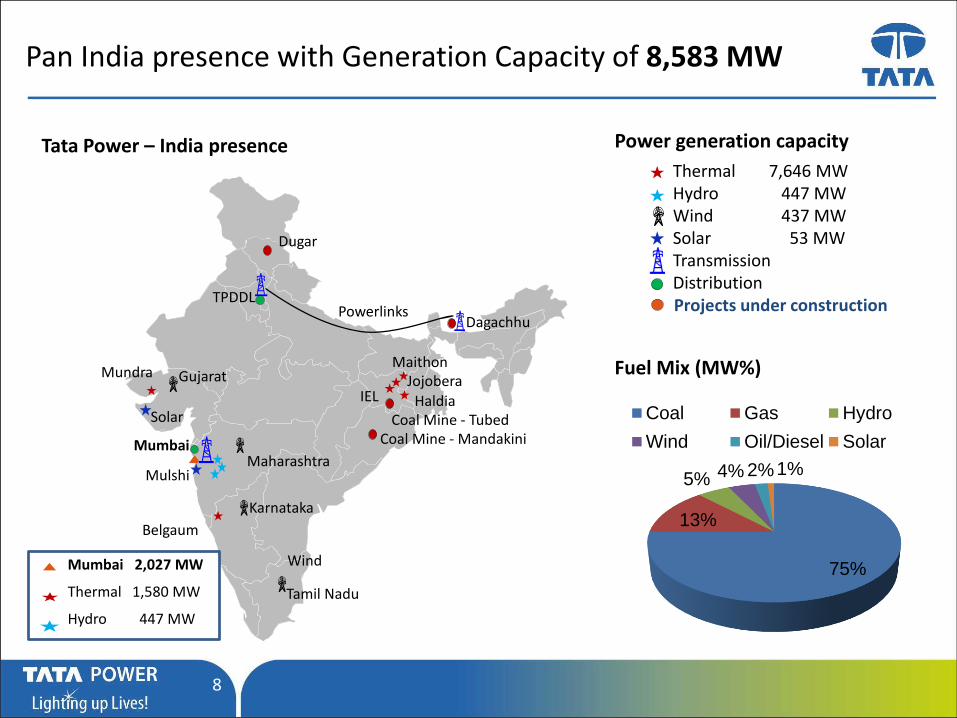
Pan India presence with Generation Capacity of 8,583 MW
Power generation capacity
Thermal 7,646 MWHydro 447 MWWind 437 MWSolar 53 MWTransmissionDistributionProjects under construction
Fuel Mix (MW%)Gujarat
Karnataka
HaldiaIEL
MulshiMaharashtra
Mumbai
TPDDLPowerlinks
Jojobera
Tamil Nadu
Mundra
Solar
Wind
Coal Mine - MandakiniCoal Mine - Tubed
Dugar
Dagachhu
Maithon
Mumbai 2,027 MW
Thermal 1,580 MW
Hydro 447 MW
Tata Power – India presence
75%
13%
5% 4% 2%1%
Coal Gas Hydro
Wind Oil/Diesel Solar
Belgaum
9
Transmission footprint in India and Mumbai
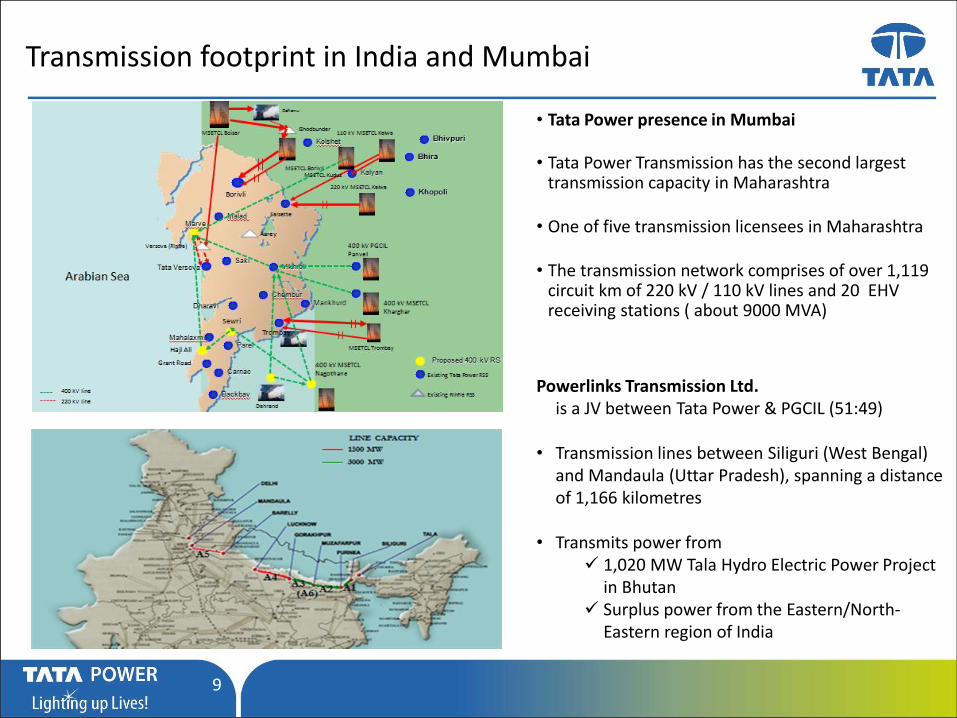
Powerlinks Transmission Ltd.is a JV between Tata Power & PGCIL (51:49)
• Transmission lines between Siliguri (West Bengal) and Mandaula (Uttar Pradesh), spanning a distance of 1,166 kilometres
• Transmits power from 1,020 MW Tala Hydro Electric Power Project
in Bhutan Surplus power from the Eastern/North-
Eastern region of India
• Tata Power presence in Mumbai
• Tata Power Transmission has the second largest transmission capacity in Maharashtra
• One of five transmission licensees in Maharashtra
• The transmission network comprises of over 1,119 circuit km of 220 kV / 110 kV lines and 20 EHV receiving stations ( about 9000 MVA)

10
Distribution presence growing with 18 lakh consumer base
Tata Power Company –Distribution, Mumbai
Tata Power Delhi Distribution Limited
Tata Power – India presence
10
Tata Power Jamshedpur Distribution Limited
Index
Upcoming
Existing operations
Efficiency and customer service – Hallmarks of Tata Power Distribution
Tata Power –D MumbaiRetail customer base crossed 5 lakhsSupplies about 38% of Mumbai’s requirements24x7 reliable and uninterrupted power supply
TPDDL – 51:49 JV with Govt. of DelhiRetail customer base >13 lakhReduction in AT&T losses from 53% to 11%
TPJDL – Jamshedpur Distribution franchiseeRecently won the Distribution Franchisee for the city of JamshedpurExpected retail customer base of 2.5 lakh
11
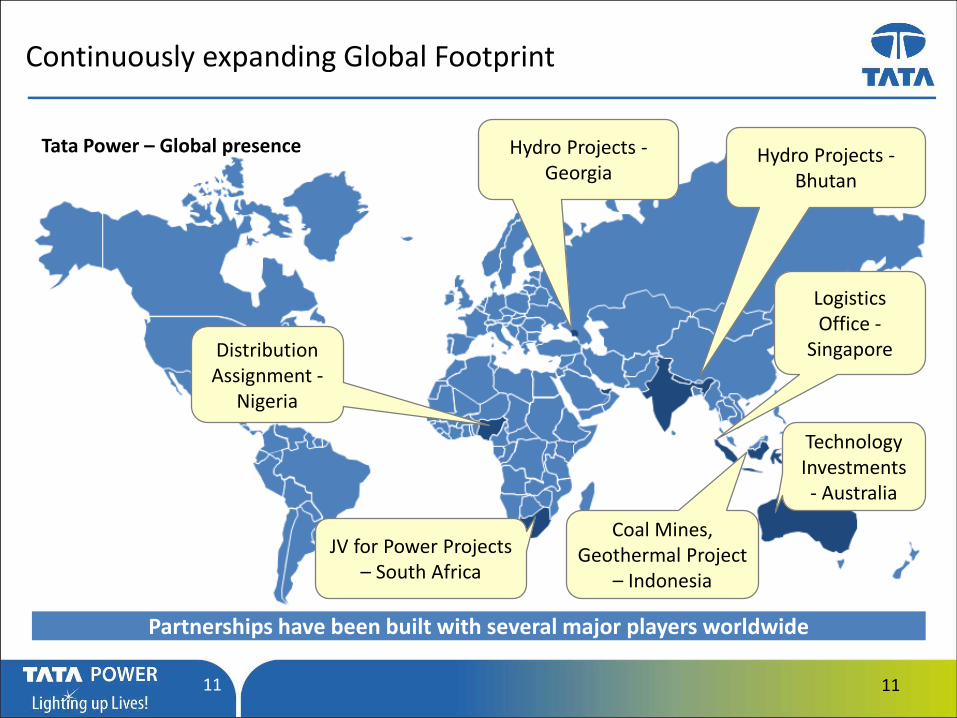
Continuously expanding Global Footprint
Hydro Projects -Bhutan
Logistics Office -
Singapore
Technology Investments - Australia
Coal Mines, Geothermal Project
– Indonesia
JV for Power Projects – South Africa
Tata Power – Global presence
Partnerships have been built with several major players worldwide
Distribution Assignment -
Nigeria
11
Hydro Projects -Georgia

12
Pioneer in the sector with many firsts to its credit
st
Generation
• 12 MW Hydro Unit (~ 1915)
• 150 MW Unit ( 1965)
• 500 MW Unit ( 1984)
• 150 MW Pumped Storage Unit ( 1995)
• 800 MW Unit with Supercritical Boiler (2012)
• 25 MW Solar Project ( 2012)
• Flue Gas Desulphurisation (FGD )1988
Transmission
• Gas Insulated Switchgear (GIS) 1988
• 220 KV Cable transmission ( 1988)
• 220 KV four circuit Transmission (1992)
13
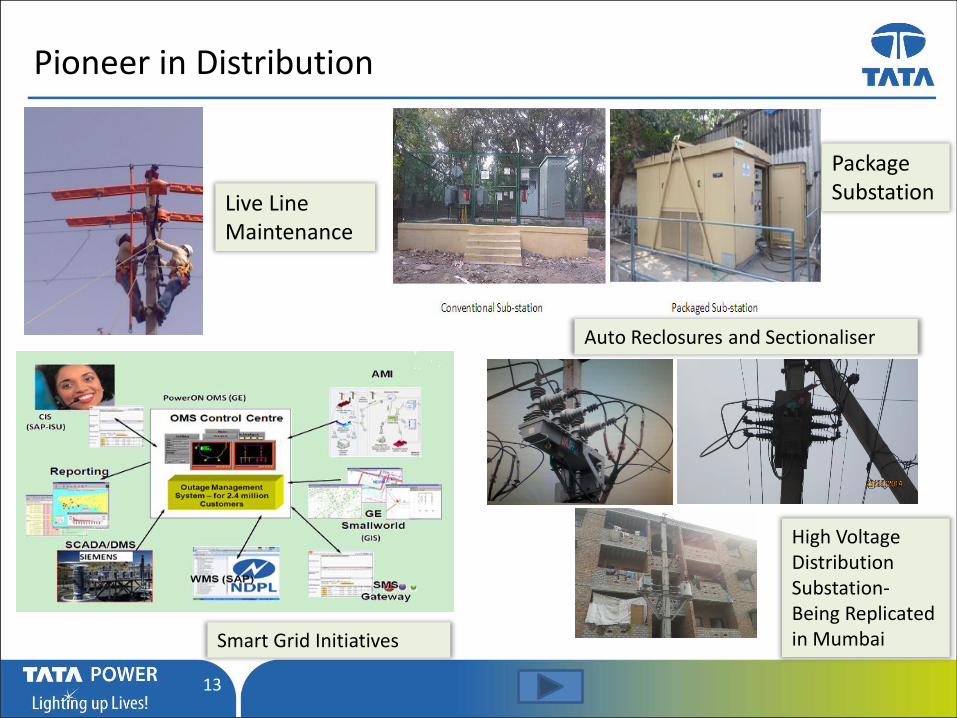
Pioneer in Distribution
Live Line Maintenance
Package Substation
High Voltage Distribution Substation-Being Replicated in Mumbai
Auto Reclosures and Sectionaliser
Smart Grid Initiatives

14
Capability of Tata Power inDistribution
15
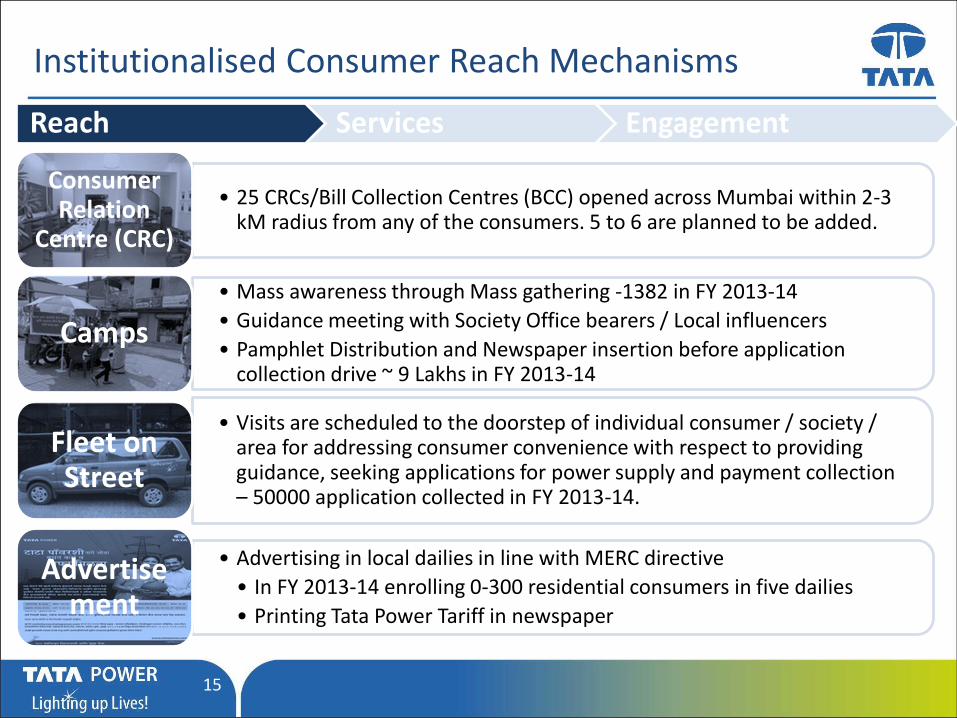
Institutionalised Consumer Reach Mechanisms
Reach Services Engagement
• 25 CRCs/Bill Collection Centres (BCC) opened across Mumbai within 2-3 kM radius from any of the consumers. 5 to 6 are planned to be added.
Consumer Relation
Centre (CRC)
• Mass awareness through Mass gathering -1382 in FY 2013-14
• Guidance meeting with Society Office bearers / Local influencers
• Pamphlet Distribution and Newspaper insertion before application collection drive ~ 9 Lakhs in FY 2013-14
Camps
• Visits are scheduled to the doorstep of individual consumer / society / area for addressing consumer convenience with respect to providing guidance, seeking applications for power supply and payment collection – 50000 application collected in FY 2013-14.
Fleet on Street
• Advertising in local dailies in line with MERC directive
• In FY 2013-14 enrolling 0-300 residential consumers in five dailies
• Printing Tata Power Tariff in newspaper
Advertisement

16
Consumer Services – CRCs
Reach Services Engagement
Multilingual portal which offers wide array of services relating
to billing, Consumer contact point, application forms, Bill
calculator, energy calculator etc
Consumer Relationship Centre (CRC): Managed by advanced
technology like queue management system, consumer
relationship management software and providing automated
feedback mechanism
Array of Bill payment options viz. CRC (35%), electronic kiosk,
drop boxes (24%), ECS+ online payment (26%), Mobile Bill
collection van, Banks, post offices, Credit Card ,Suvidha card,
ITZ card.
About 1,70,000 walk-ins per month at various CRCs
17
Consumer Services – Consumer Meets
Reach Services Engagement
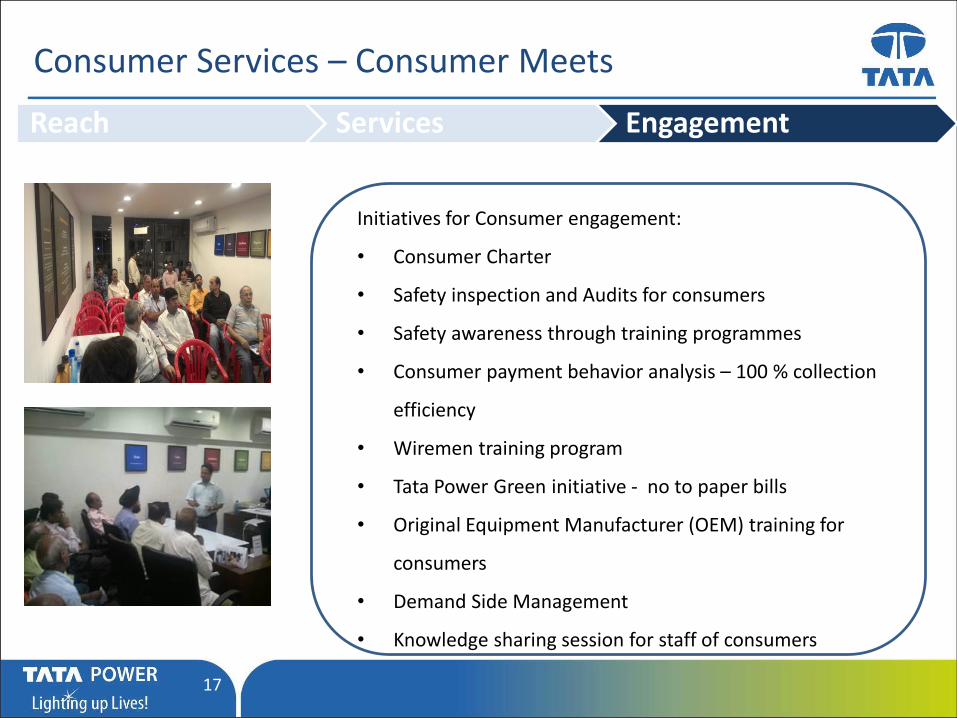
Initiatives for Consumer engagement:
• Consumer Charter
• Safety inspection and Audits for consumers
• Safety awareness through training programmes
• Consumer payment behavior analysis – 100 % collection
efficiency
• Wiremen training program
• Tata Power Green initiative - no to paper bills
• Original Equipment Manufacturer (OEM) training for
consumers
• Demand Side Management
• Knowledge sharing session for staff of consumers

18
Tata Power-D - Technology Initiatives
Consumer Service
Varied Bill Payment Options
Consumer Relationship Mgmt.
(CRM) software
Meter installation data - Personal Device
Assistant
Automatic Meter Reading (AMR)
Network Augmentation & Expansion
CYMEDIST – Network Planning in GIS
Design of 3 Tier DSS
33 kV Ring Main Unit
Ester filled Transformers
Mobile Sub-Station
Network Maintenance
Line Resonance Analysis (LIRA)
Thermo Scan
Ultrasonic Detectors
Power Quality Management Systems
Distribution Automation System

19
Distribution Statistics 1/2
Tata Power has rich experiencein Distribution Business which itundertakes through Tata Power-D in its Mumbai
License area TPDDL in North Delhi
The key statistics of the abovetwo businesses is presentedbeside:
Mumbai Distribution
Particulars Parameters Tata Power-D
(as on 31st
March 2014)
Retail Servicing Consumer Base (Nos)* 4,94,000
Sales (Mus) ( HT -52%,
LT- 48%)
6541
Collection efficiency 100%
Physical
Infrastructure
Capitalisation (Rs Crs)-
Gross Fixed Asset
1450
DSS (Nos) 27
DSS (MVA)** 935+590
HT (km) 1915
CSS (Nos) 643
CSS (MVA) 672
LT (km) 1124
* Now crossed 5 Lakhs
**Additional 110 KV/22 KV stations for meeting Railways and large loads ( about 10 stations) about 590 MVA

20
Distribution Statistics 2/2
Delhi Distribution
Particulars Parameters TPDDL
Retail Servicing Consumer Base (Nos) 13,86,439
Sales (Mus) 7364
Collection efficiency 99.55%
Physical
Infrastructure
GFA 4200
DSS (Nos)- (66 KV + 33 KV) 66
DSS (MVA) 3655
HT (km) 4433
CSS (Nos) (11 KV) 29281
CSS (MVA) 4867
LT (km) 6119
Tata Power has rich experiencein Distribution Business whichit undertakes through Tata Power-D in its
Mumbai License area TPDDL in North Delhi
The key statistics of the abovetwo businesses is presentedbeside:

21
Eligibility for grant of license to Tata Power

22
Criteria for Grant of Distribution License
1 Meeting the requirement laid down under the GoI Rules of 2005
2 Tie up of adequate Power for purchase
3 Submission of Network Roll out plan
4 Availability of Technical and Managerial Expertise
Statutory/Legal Requirement
Additional Requirement

23
1
Criteria for Grant of Distribution License
Meeting the requirement laid down under the GoI Rules of 2005

24
Criteria as per GoI Rules, 2005
Particulars Criteria
Minimum area of supply requirement –
Should be a Revenue District, or a Municipal Corporation or a Municipal Council
Code of conduct requirement - Should not be found guilty or has not been disqualified under certain sections of Companies Act, Income tax Act, SEBI Act, Excise Act and Customs Act
Credit worthiness requirement - No specific requirement mentioned in the Rules
Capital Adequacy requirement – Applicant to satisfy that it can raise 30% equity on cost of investment on the basis of Networth and generation of internal resources – excluding equity committed elsewhere

25
A. Minimum Area Criteria & Code of Conduct
Proposed Area of License How it meets the Criteria
Has applied for the existing license area of Tata Power along with Chene Versave in Mira Bhayander Municipal Corporation
• Proposed Licence area include- South Mumbai which is a Revenue District
• With inclusion of Chene Varsave villages, the entire Mira Bhayandar Municipal Corporation is a part of the proposed Licensed Area
Code of Conduct How it meets the Criteria
Should not be found guilty or has not been disqualified under certain sections of Companies Act, Income tax Act, SEBI Act, Excise Act and Customs Act
Tata Power has not been found guilty under any of these statutesTata Power recognised amongst worlds most ethical companies by Ethisphere Institute
Criteria 1: Minimum Area Criteria
Criteria 2 : Code of Conduct

26
B. Capital Adequacy (1/3) – Computation of Net Worth for Tata Power
The Hon’ble Commission in the past had given the empirical formula for calculationof Net worth and Internal Resource Generation.
Based on the same empirical formula Tata Power has arrived at its Networth for thepast three years as also its Internal Resource Generation as shown in the table below:
Rs Cr
Networth FY 12-13 FY11-12 FY10-11
Max
Networth in
last 3 years
Equity Share capital 237 237 237
Reserves and Surplus 10803 10389 10405
Revaluation Reserve 0 0 0
Intangible assets 103 43 12
Miscellaneous expenditure to the extent not written off
and carry forward losses- -
Networth (Rs Crs) 10,937 10,583 10,630 10,937

27
Rs Cr
Internal Resource Generation FY12-13 FY11-12 FY10-11 Max IRG in
the last three
years
Profit After tax 1024.69 1169.73 941.49
Depreciation & Amortisation 364.1 570.35 510.14
Decrease in Net current assets (excluding cash) -1332.13 -878.89 378.78
Any other non cash expenditure (including deferred tax) 369.23 204.05 37.15
Scheduled loan repayment and increase in net current
assets (excluding cash)
558.96 236.88 524.79
Internal Resource Generation (133) 828 1,343 1,343
B. Capital Adequacy (2/3) – Computation of Internal Resource Generation
28
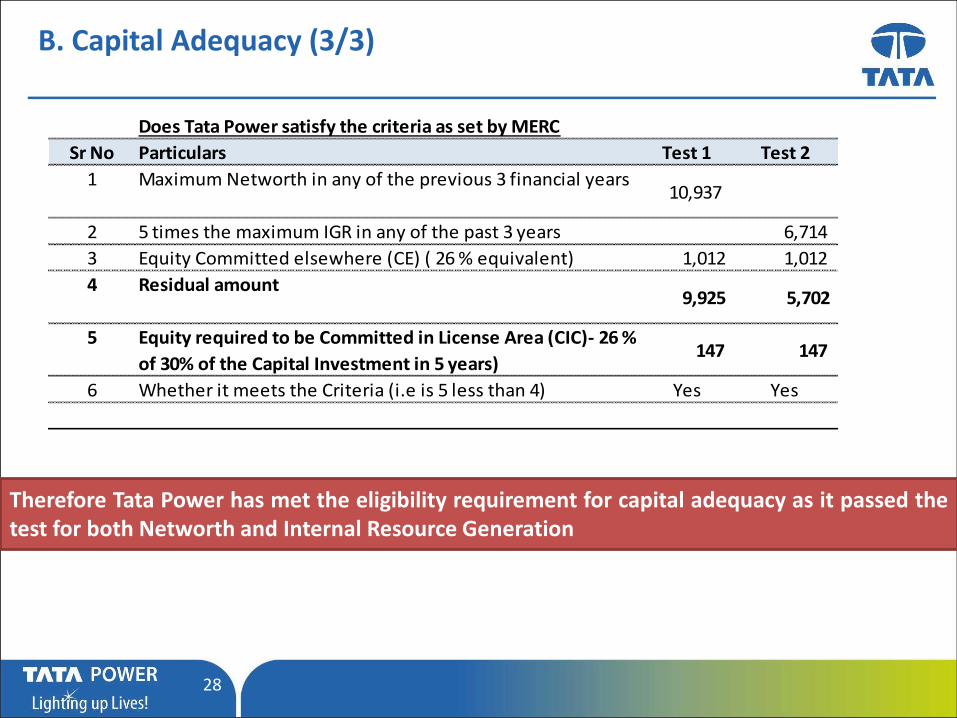
Does Tata Power satisfy the criteria as set by MERC
Sr No Particulars Test 1 Test 2
1 Maximum Networth in any of the previous 3 financial years10,937
2 5 times the maximum IGR in any of the past 3 years 6,714
3 Equity Committed elsewhere (CE) ( 26 % equivalent) 1,012 1,012
4 Residual amount 9,925 5,702
5 Equity required to be Committed in License Area (CIC)- 26 %
of 30% of the Capital Investment in 5 years) 147 147
6 Whether it meets the Criteria (i.e is 5 less than 4) Yes Yes
Therefore Tata Power has met the eligibility requirement for capital adequacy as it passed thetest for both Networth and Internal Resource Generation
B. Capital Adequacy (3/3)

29
C. How has Tata Power met the Credit Worthiness Criteria 1/2
To assess the credit worthiness following two documents have been furnished:
Letter from a bank that the company is financially solvent
Credit rating of some of the debt instruments introduced by the company in themarket

30
C. How has Tata Power met the Credit Worthiness Criteria 2/2
To assess the credit worthiness the following two documents to be furnished:
Letter from a bank that the company is financially solvent
Credit rating of some of the debt instruments introduced by the company in themarket
Both the Credit Rating as well as the Solvency Certificate proves that Tata Power hasgood financial flexibility to undertake operations in the proposed area of License

31
2
Criteria for Grant of Distribution License
Tie up of adequate Power for Purchase

32
Adequacy of Power Purchase
Supply AvailabilityGeneratio
n Capacity
Net
Generatio
n Capacity
Base
Contracted
Capacity
Peak
Contract
ed
Capacity
Base
Contracted
Capacity
Peak
Contract
ed
Capacity
MW MW % MW MW MW MW MWTata Power -G
Unit 4* 150.00 138.00 26.84% 37 - - - -Unit 5 500.00 470.00 48.84% 230 230 230 230 230Unit 6 500.00 482.50 48.84% 236 - 236 236 236Unit 7 180.00 174.60 48.84% 85 85 85 85 85Unit 8 250.00 228.75 60.00% 137 137 137 137 137Hydro 447.00 440.30 48.84% 215 - 215 - 215
* Unit 4 has not been considered for assessng supply availability, Unit 6 shown in peak
286 67 67 67 67
Long Term tie-up for
Domestic Coal276 276 276 276 276
Bilateral Power Purchase 0 - - - -
Total Capacity 1502 795 1246 1031 1246
Base / Average Demand 806 806
Peak Demand 1,120 1,120
Supply Availability 99% 111% 128% 111%
Composite index with weights of 75% for base and 25% for peak 102% 124%
Renewable Source (Equivalent Thermal Capacity shown at 20%
PLF/85% PLF for thermal
Period 1 (FY 2014-15 to
FY 2017-18)
Period 2 (FY 2018-19)
Contracted
Capacity
As Tata Power has adequate arrangement to meet base and peak load demand with a good Composite Index
33
Plan for meeting RPO
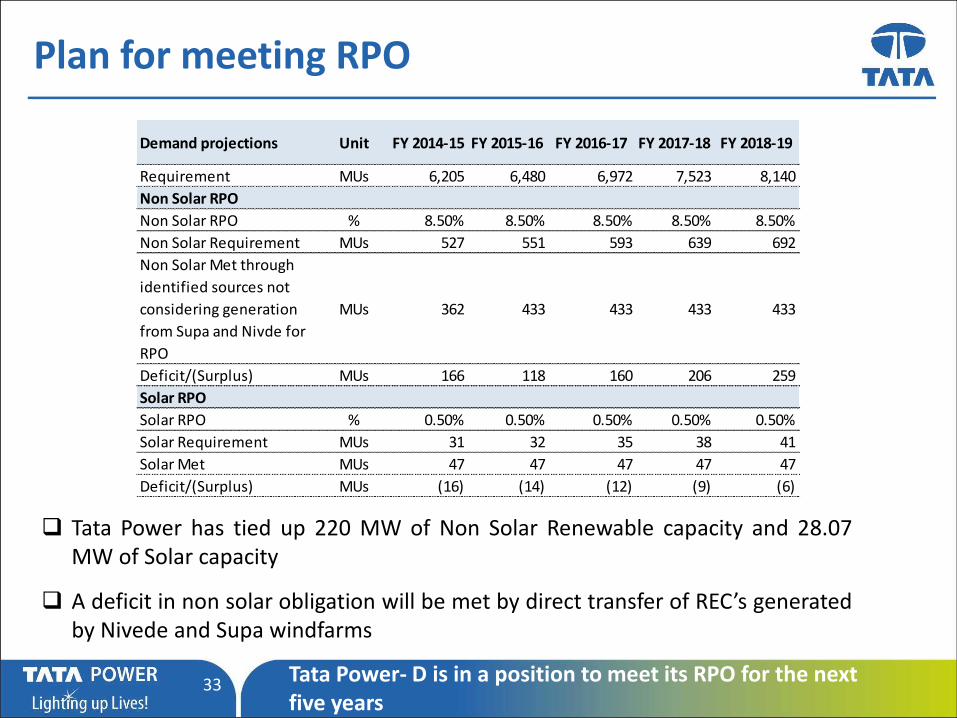
Demand projections Unit FY 2014-15 FY 2015-16 FY 2016-17 FY 2017-18 FY 2018-19
Requirement MUs 6,205 6,480 6,972 7,523 8,140
Non Solar RPO
Non Solar RPO % 8.50% 8.50% 8.50% 8.50% 8.50%
Non Solar Requirement MUs 527 551 593 639 692
Non Solar Met through
identified sources not
considering generation
from Supa and Nivde for
RPO
MUs 362 433 433 433 433
Deficit/(Surplus) MUs 166 118 160 206 259
Solar RPO
Solar RPO % 0.50% 0.50% 0.50% 0.50% 0.50%
Solar Requirement MUs 31 32 35 38 41
Solar Met MUs 47 47 47 47 47
Deficit/(Surplus) MUs (16) (14) (12) (9) (6)
Tata Power has tied up 220 MW of Non Solar Renewable capacity and 28.07MW of Solar capacity
A deficit in non solar obligation will be met by direct transfer of REC’s generatedby Nivede and Supa windfarms
Tata Power- D is in a position to meet its RPO for the next five years
34
Criteria for Grant of Distribution License
3 Submission of Network Roll out plan

35
Network Rollout
Network Planning & Rollout Philosophy
Network Rollout philosophy is based on the MERC Supply Code Regulations, SOP
Regulations and CEA (Technical Standards for Construction of Electrical Plant and
Electrical Lines) Regulations, 2010.
In line with the above Regulations, Tata Power needs to
(a)create a backbone of distribution network backbone - (33kV/11kV) DSS
(b) identify source or outlet at RSS to feed supply to DSS,
(c) establish connectivity to feed the DSS from identified RSS and
(d) create 11 kV main ring network.
• Developing network in this fashion will enable Tata Power to comply with the timelines laid
down under SOP & Supply Code Regulations
• Also in line with the views of Rural Electrification Corporation (REC)

36
Network Rollout
Schematic for Network rollout
RSS
DSS
11 kV Main Ring
CSS
• Transmission network; (part of InSTS)• Receiving Sub-station 220 kV / 132 kV / 110 kV with 33/22 kV feeders
(Transmission System)
(Distribution System Backbone)
(Distribution System – Last Mile Connectivity)
Consumer Premises
LT Feeders
11 kV lines/cables
33 kV lines / cables
11 kV lines/cables
• ~5 km for 3 no. feeders = 15 km of Incoming feeder per DSS• Capacity of 60 MVA S/S with firm capacity 40 MW (3 Transformers)• Power Transformers (3), station Transformers (2), 33 kV breaker panel,
11 kV breaker, LT aux, DSS civil works, earthing, installation, etc.
• Grid small ring with 2 km x 2 km (8 no) • 11 kV cable length - ~32 km per DSS
Network Rollout Plan is towards development of Network backbone .

37
Network Rollout: Planning
Units South
Mumbai
North
Mumbai
Total
a Licence Area Sq Km 65 420 485
b Less: Green Area, Marshy Lands, Water
bodies & Non Development Area
Sq Km 5 158 163
c=a-b Net Area for Development Sq Km 60 262 322
d Demand –MW (FY 12-13) Mw FY 12-13 900 2300 3200
e=d/c Load Density (MW/Sq km) MW/Sq Km 15 9 10
f=d/40 No. of DSS @ 40 MW each @ 40 Mw each 23 58 81
g Geographic Area coverage per DSS @ 6sq km per DSS 6 6 6
h=c/g No of DSS to cover entire geography No 10 44 54
i=f*50% Tata Power DSS @ 50% (Load Criteria) 50% 12 29 41
j=h*100% Tata Power DSS (Reach Criteria) 100% 10 44 54
k=max(I,j) Max of above 2 Criteria 12 44 56
l Existing DSS No 1 26 27
m=k-l Additional DSS to be Identified No 11 18 29
n Number of DSS planned for next five
years on the basis of sites identified
No 5 11 16
o=m-n Number of DSS planned beyind five
years
No 6 7 13
Tata Power is planning to setup additional 30 Nos of DSS out of which 17 Nos of DSS (includingDSS at Chene Varsave) will be commissioned in the next 5 years and another 13 Nos of DSS willbe commissioned beyond FY 2018-19
38
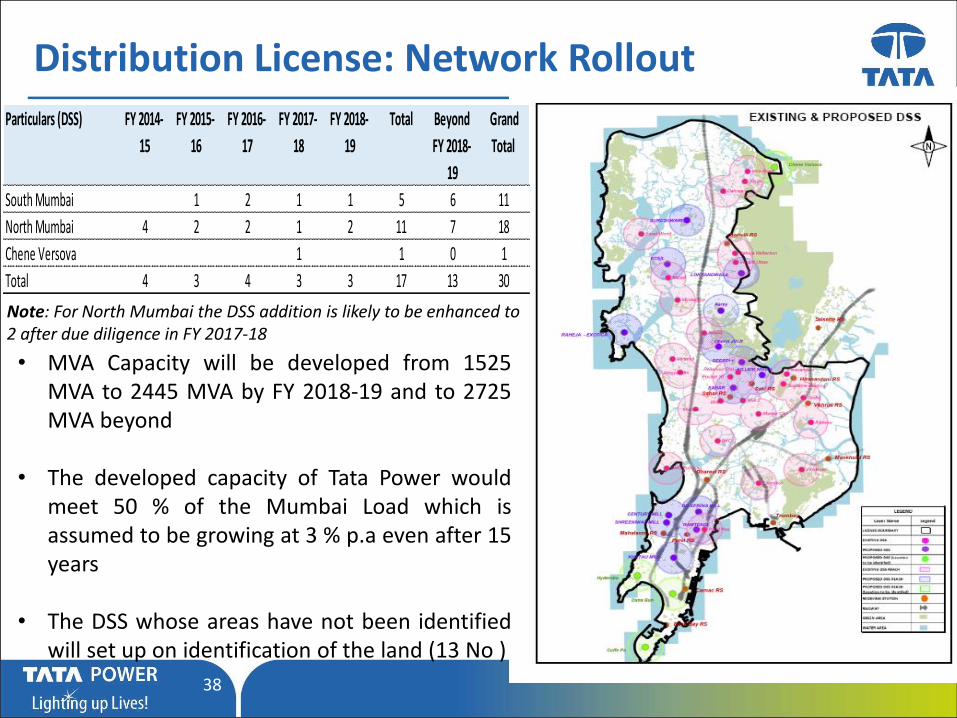
Distribution License: Network Rollout
Particulars (DSS) FY 2014-
15
FY 2015-
16
FY 2016-
17
FY 2017-
18
FY 2018-
19
Total Beyond
FY 2018-
19
Grand
Total
South Mumbai 1 2 1 1 5 6 11
North Mumbai 4 2 2 1 2 11 7 18
Chene Versova 1 1 0 1
Total 4 3 4 3 3 17 13 30
• MVA Capacity will be developed from 1525MVA to 2445 MVA by FY 2018-19 and to 2725MVA beyond
• The developed capacity of Tata Power wouldmeet 50 % of the Mumbai Load which isassumed to be growing at 3 % p.a even after 15years
• The DSS whose areas have not been identifiedwill set up on identification of the land (13 No )
Note: For North Mumbai the DSS addition is likely to be enhanced to 2 after due diligence in FY 2017-18

39
Network Rollout : CSS planning
Establishment of CSS and last mile connectivity would be critically dependent on the
choice to be exercised by the consumers
It will be difficult to assess the location and quantify the requirement for establishment
of CSS/last mile infrastructure at this stage under the network rollout plan
However, for the purpose of business plan projections, we have assumed that around
24 numbers of CSS would be installed per DSS.
Actual number of CSS development would depend on the load and demand for
the area to be served
Some load would be on HT.
Innovation used/planned for installation of CSS• Mobile Sub-station• High Voltage Distribution System• Ester filled transformers

40
Network Rollout : Infrastructure Planned
Particulars FY 2014-15 FY 2015-16 FY 2016-17 FY 2017-18 FY 2018-19 Total
Backbone Network
DSS (no.) 4 3 4 3 3 17
33 kV cable (km) 60 45 60 45 45 255
11 kV cable (km) 128 96 128 96 96 544
CSS Onwards + LT
CSS (no.) 96 72 96 72 72 408
LT Feeder (km) 480 360 480 360 360 2040
Capital Cost Estimate (Rs Crore)
Backbone Network
DSS incl. 33kV and 11kV 237 178 237 178 178 1007
CSS Onwards + LT
CSS 30 23 30 23 23 128
LT Feeders 175 131 175 131 131 744
Capex Investment 442 332 442 332 332 1879

41
Criteria for Grant of Distribution License
4 Availability of Technical and Managerial Expertise

42
Management and Technical Expertise
Area Expertise
Key Personnel(Details of 15 personnel shown inAnnexure-5 of Application)
Key personnel of Tata have rich experience
of about 20 -30 years in both Managerial
and Technical functions viz. Distribution,
Power Purchase and other support services
Experience of Management in Handling
businesses with large no of consumer
and employees
Tata Power through Tata Power-D in
Mumbai serves 5 lakh consumers ( 18 lakhs
with TPDDL) and have a total employee
strength of about 500 employees (excluding
the outsourced manpower) and 4000
employees with TPDDL

43
Management and Technical Expertise
Area Expertise
Experience and record
of accomplishment of
the firm in the value
chain of electricity
Generation: Tata Power has a total installed capacity of 8560 MW comprising
of various sources. Out of this capacity 2027 MW is embedded within
Mumbai
Transmission: Tata Power has 1119 Ckt km of network coupled with 20
Receiving stations with 9000 MVA capacity. 400 KV network underway.
Distribution:-Tata Power through its Distribution businesses has a retail
annual sales of about 13000 Mus (including TPDDL)
Experience of Rolling
out advanced
technology
Tata Power has introduced various technologies which can be broadly
classified under:-
• Network Augmentation and Expansion
• Reliable Power supply
• Disaster Management Plan in line with National Disaster Management
Authority (NDMA) guideline. Was well implemented during the deluge of
2005

44
Business Plan of Tata Power –Da. Sales Projectionsb. Power Purchase Costsc. Capital Costsd. Financing Plane. Average Cost of Supply

45
Sales Estimate
Key Assumptions for estimating Sales for the period FY 2015 – 2019
Hon’ble Commission has projected the sales in the MYT Tariff Order of Tata
Power at 6974 MUs in FY 2013-14 increasing to 8306 MUs in FY 2015-16.
Thereafter, significant regulatory developments have taken place which has
resulted in decline in sales as compared to that estimated in the MYT Order.
Tata Power has worked out the growth rates based on various parameters:
Growths in various categories of consumers experienced in the past and
expected in future
expected additions and deletions from the present sales on account of
tariff differentials,
orders of the Hon’ble Commission and
the network that is being proposed to be rolled out in the next five years.
46
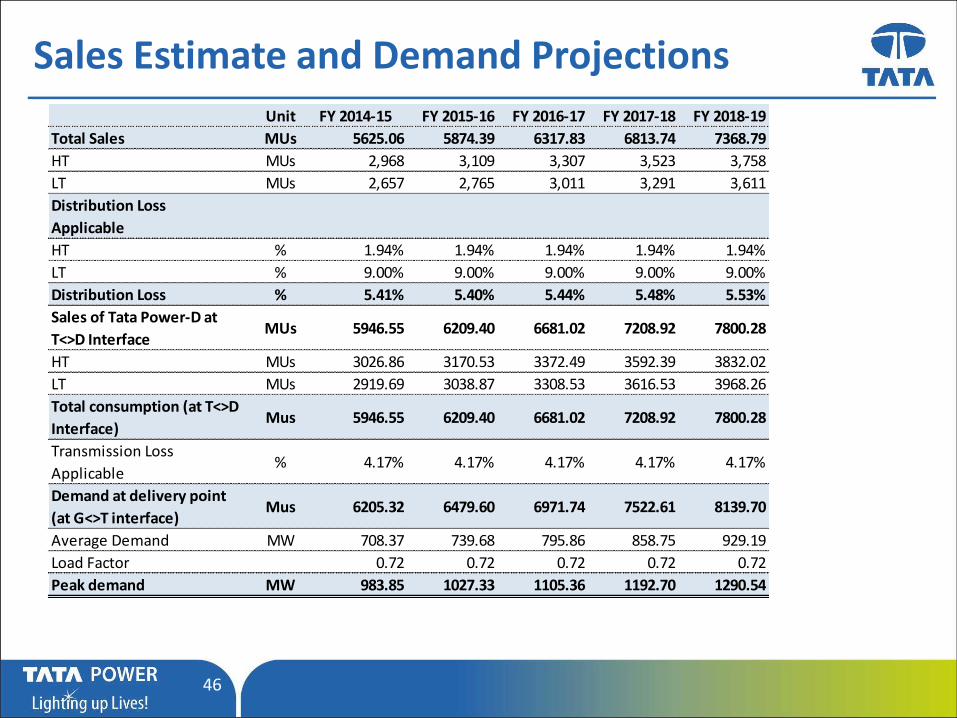
Sales Estimate and Demand ProjectionsUnit FY 2014-15 FY 2015-16 FY 2016-17 FY 2017-18 FY 2018-19
Total Sales MUs 5625.06 5874.39 6317.83 6813.74 7368.79
HT MUs 2,968 3,109 3,307 3,523 3,758
LT MUs 2,657 2,765 3,011 3,291 3,611
Distribution Loss
Applicable
HT % 1.94% 1.94% 1.94% 1.94% 1.94%
LT % 9.00% 9.00% 9.00% 9.00% 9.00%
Distribution Loss % 5.41% 5.40% 5.44% 5.48% 5.53%
Sales of Tata Power-D at
T<>D InterfaceMUs 5946.55 6209.40 6681.02 7208.92 7800.28
HT MUs 3026.86 3170.53 3372.49 3592.39 3832.02
LT MUs 2919.69 3038.87 3308.53 3616.53 3968.26
Total consumption (at T<>D
Interface)Mus 5946.55 6209.40 6681.02 7208.92 7800.28
Transmission Loss
Applicable% 4.17% 4.17% 4.17% 4.17% 4.17%
Demand at delivery point
(at G<>T interface)Mus 6205.32 6479.60 6971.74 7522.61 8139.70
Average Demand MW 708.37 739.68 795.86 858.75 929.19
Load Factor 0.72 0.72 0.72 0.72 0.72
Peak demand MW 983.85 1027.33 1105.36 1192.70 1290.54
47
Power Purchase Plan
Key Assumptions for Power Purchase for the period FY 2015 – 2019 -1/3
Although the current PPA of Tata Power-D with Tata Power-G is ending in FY 2017-18,
same power purchase arrangement considered till FY 2018-19 and beyond.
Unit 4 not considered as a standby unit and no generation considered from Unit 4.
Economy shutdown of Unit 6 proposed to be continued till the unit is converted to a
coal fired unit. –Unit 6 would be brought on line for meeting the Mumbai Demand as
and when required
However, Conversion of Unit 6 proposed in FY 2018-19 instead of FY 2015-16 as
proposed in the MYT in light of delay in permissions

48
Distribution License: Power Purchase Plan
Key Assumptions for Power Purchase for the period FY 2015 – 2019 -2/3
Power Purchase from Domestic Coal based source
Renewable Power purchase will be as per the obligations required to be met and the
procurement will include existing tied up capacities and purchase through REC.
Balance requirement is proposed to be procured through bilateral power purchase and
from imbalance pool

50
Distribution License: Power Purchase Plan
Energy Required at G<> T
Interface
6,205.32 100% 6,479.60 100% 6,971.74 100% 7,522.61 100% 8,139.70 100%
Met Through
Tata Power -G 3,214.85 52% 3,970.82 61% 3,970.82 57% 3,970.82 53% 4,775.11 59%
Unit 5 1,709 1,709 1,709 1,709 1,709
Unit 6 0 0 0 0 804
Unit 7 598 598 598 598 598
Unit 8 266 1,022 1,022 1,022 1,022
Hydro 642 642 642 642 642
Renewable Source 409 7% 480 7% 480 7% 480 6% 480 6%
Long Term tie-up for
Domestic Coal
661 11% 1,362 21% 1,525 22% 2,033 27% 2,033 25%
Bilateral Power Purchase
& Imbalance pool
Purchase/ Unit 6*
1,921 31% 667 10% 997 14% 1,039 14% 852 10%
* Unit 6 - Due to tranmission constraints partial power is expected to be procured from Unit 6
MUs
FY 2014-15 FY 2015-16 FY 2016-17 FY 2017-18 FY 2018-19
Avg Cost of Power
Purchase
Rs/Kwh 3.91 4.18 4.16 4.00 4.05

51
Capital Investment Plan
Particulars FY 2014-15 FY 2015-16 FY 2016-17 FY 2017-18 FY 2018-19 Total
Backbone Network
DSS (no.) 4 3 4 3 3 17
33 kV cable (km) 60 45 60 45 45 255
11 kV cable (km) 128 96 128 96 96 544
CSS Onwards + LT
CSS (no.) 96 72 96 72 72 408
LT Feeder (km) 480 360 480 360 360 2040
Capital Cost Estimate (Rs Crore)
Backbone Network
DSS incl. 33kV and 11kV 237 178 237 178 178 1007
CSS Onwards + LT
CSS 30 23 30 23 23 128
LT Feeders 175 131 175 131 131 744
Capex Investment 442 332 442 332 332 1879
52
Financing Plan
The Capital Investment would be financed in the Debt to Equity ratio of 70:30
For the purpose of Business Plan, it has not identified specific sources of Debt to Equity
However considering its financial strengths and Credit worthiness, Internal Revenue
Generation, Equity Infusion and External Borrowings would be made available

53
Average Cost of Supply
The Average Cost of Supply is without any Regulatory Assetsrecovery
Rs. Crore
FY 2014-15 FY 2015-16 FY 2016-17 FY 2017-18 FY 2018-19
Power Purchase Cost 2949.38 3248.15 3449.07 3562.18 3857.72
RoE 5.56 6.63 7.72 8.81 9.91
Depreciation 6.05 7.10 8.19 9.28 10.35
O&M 69.51 76.51 86.77 98.65 112.48
Interest on Long Term Loans 5.11 5.95 6.71 7.36 7.88
Interest on Working Capital 93.30 104.26 110.82 115.32 127.57
Interest on Security Deposit 25.97 28.97 31.25 32.87 35.87
Provision of Doubtful Debts 2.98 3.34 3.67 3.99 4.48
Contingency Reserve 0.24 0.29 0.34 0.39 0.44
Less: Non Tariff Income -11.06 -11.77 -11.77 -11.77 -11.77
Income Tax 1.21 1.21 1.21 1.21 1.21
Tata Power -D Supply Costs 3148.25 3470.64 3693.98 3828.30 4156.13
Tata Power -D Wheeling Costs 316.47 394.84 474.82 557.30 628.37
Total Cost of Supply 3464.72 3865.47 4168.80 4385.60 4784.50
Total Sales (in Mu) 5816.50 6054.60 6494.34 6984.26 7533.39
Average Cost of Supply (Rs./kWh) 5.96 6.38 6.42 6.28 6.35
54
Distribution License: Area Sought under License

55
Areas and Consumers sought under License
Grant of Distribution License sought for 25 Years under Section 14 and
15 of the Electricity Act, 2003 for the following area:
Existing AreaExisting Area Colaba in the South to Mira Road in the North and
Vikhroli on the central with a total spread of 485 sq. km
Additional Area
Chene and Varsova which are part of the Mira Bhayander
Municipal Corporation in adherance to the Electricity Rules for
Minimum Area
Additional consumers not in
the Geographical License Area
1. 110 kV Ordinance Factory Ambernath,
2. BMC Bhandup,
3. 110 kV Railways,Chola -Thakurli sub-station, (it was
considered part of the Railway supply to be left with Tata
Power)-It was known as Tata Railway System

56
Prayer
57
Prayer to the Hon’ble Commission
In the facts and circumstances of the case, it is most respectfully prayed that this Hon’bleCommission may be pleased to:
(a) Admit the present Application alongwith the attached documents, submitted by TataPower for grant of license under Section 14 and 15 read with Section 86(1)(d) ofElectricity Act, 2003;
(b) Grant Distribution License to Tata Power for a period of 25 years with effect from 16th
August, 2014 which includes South Mumbai and parts of Mumbai Suburban Areas,areas of Mira Bhayandar Municipal Corporation including area covered under Cheneand Varsave;
(c) Condone any inadvertent omissions / errors / shortcomings and permit Tata Power toadd / change / modify / alter this filing and make further submissions as may berequired at a future date;
(d) Any other relief that Hon’ble commission may deem fit.

58
National Award for Meritorious Performance in Power Sector, 2012
National Award for Meritorious Performance in Power Sector, 2008-09
National Awards for Excellence in Energy Management, CII, 2012
59
Backup slides

60
HVDS in Mumbai
Back