presentation on: ice cream - best engineering college … on: ice cream objectives x to analyze the...
TRANSCRIPT

PRESENTED BY:-
AYUSHI TYAGI
AYUSH JAIN
AVINASH RANA
DIVYA TYAGI
Presentation on: Ice Cream

Objectives
To analyze the consumers brand preferences
for Ice creams
To evaluate consumers liking towards ice
creams
To evaluate consumers perception about the
important factors pertaining to ice cream
purchase decision

Hypotheses
Sales of different brand of Ice creams are uniformly distributed i.e
there is no significant difference in the sales of different Ice cream
brands.
There is no significant difference between the preferences of male
and female consumers for their preference towards ice creams.
Different factors which are important in the ice cream purchase
decision do not differ significantly.
Different types of ice creams (Scoop, stick etc.) are equally
preferred by customers
Preference for different type of ice cream (Scoop, stick etc.) are
independent of consumer gender
Hypothesis 1
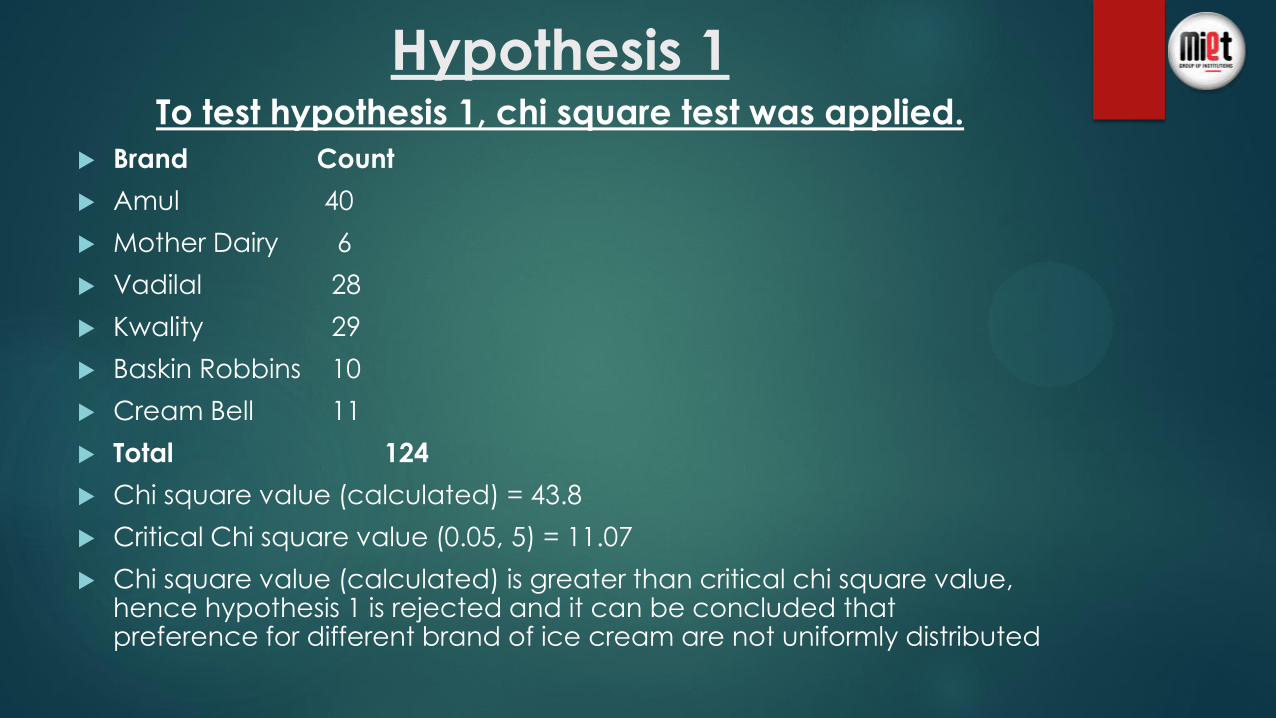
To test hypothesis 1, chi square test was applied.
Brand Count
Amul 40
Mother Dairy 6
Vadilal 28
Kwality 29
Baskin Robbins 10
Cream Bell 11
Total 124
Chi square value (calculated) = 43.8
Critical Chi square value (0.05, 5) = 11.07
Chi square value (calculated) is greater than critical chi square value, hence hypothesis 1 is rejected and it can be concluded that preference for different brand of ice cream are not uniformly distributed

Hypotheses 2
There is no significant difference between the preferences of male and
female consumers for their preference towards ice creams.
To test this hypothesis z test was applied with following results
Since the calculated z value is less than z critical (two tailed) at .05
significance level, hence null hypothesis is accepted and it can be said
that there is no significant difference between male and female consumers for their preferences about ice creams.
Mean n Z value Z value critical at
.05 and 125 df
Result
Male 47.66 53 -1.5 1.95 Insignificant
Accept the null
hypothesis
Female 48.82 73

Hypothesis 3
Different factors which are important in the ice cream purchase
decision do not differ significantly.
To test this hypothesis, ANOVA was used with following results
Anova: Single Factor
SUMMARY
Groups Count Sum Average Variance
Price 126 2547 20.21429 84.18571
Flavor 126 2597 20.61111 73.05556
Taste 126 2697 21.40476 97.04286
Quality 126 2607 20.69048 71.03143
Brand name 126 2152 17.07937 93.83365

ANOVA
Source of Variation SS df MS F P-value F crit
Between Groups 1436.349 4 359.0873 4.283526 0.001994 2.386188
Within Groups 52393.65 625 83.82984
Total 53830 629
Since F calculated is greater than F critical at 95%
significance level, hence Null hypothesis is rejected.
So, it can be concluded that different factors which are
important in the Ice cream purchase decision differ
significantly.

But If Brand factor is omitted from the list,
ANOVA results show insignificant
difference
Anova: Single Factor
SUMMARY
Groups Count Sum Average Variance
Price 126 2547 20.21428571 84.18571429
Flavor 126 2597 20.61111111 73.05555556
Taste 126 2697 21.4047619 97.04285714
Quality 126 2607 20.69047619 71.03142857

F calculated is less than F critical at 95% significance
level, hence Null hypothesis is accepted. Different
factors are equally important for various consumers.
Source of
Variation SS df MS F P-value F crit
Between
Groups 92.85714286 3 30.95238095 0.380582858 0.767045652 2.622735
Within
Groups 40664.44444 500 81.32888889
Total 40757.30159 503

Hypothesis 4
Different types of ice creams (Scoop, stick etc.) are equally preferred by customers
Type Count
Scoop 44
Stick 19
Cup 33
Softy 21
Other 9
Chi square value (calculated) = 29.07
Critical Chi square value (0.05, 4) = 9.48
Chi square value (calculated) is greater than critical chi square value, hence hypothesis 4 is rejected and it can be concluded that preference for different types of ice cream are not uniformly distributed

Hypothesis 5
Preferences for different type of ice cream (Scoop, stick etc.) are independent of consumers’ gender
Chi square value (calculated) = 3.69
Critical Chi square value (0.05, 4) = 9.48
Chi square value (calculated) is less than critical chi square value, hence hypothesis 5 is accepted and it can be concluded that preference for different type of ice cream (Scoop, stick etc.) are independent of consumers’ gender.
Scoop Stick Cup Softy other Total
Male 19 9 16 5 4 53
Female 25 10 17 16 5 73
Total 44 19 33 21 9 126

Descriptive statistics analysis
1. Most popular brand: Amul
Amul Mother Dairy Vadilal Kwality Baskin Robbins Cream Bell
BRAND:- Percent :-
AMUL
31%
Mother
dairy
6%
Vadilal 23%
Kwality 24%
Baskin
robbins
8%
Cream
bell
8%

Rank Preference analysis
Rank Rank 1 Rank 2 Rank 3 Rank 4 Rank 5 Rank 6 Total
Amul 37 20 38 23 5 3 126
Mother Dairy 15 31 30 38 9 3 126
Vadilal 28 40 22 14 20 2 126
Kwality Walls 24 16 22 32 21 11 126
Baskin Robbins 16 13 5 9 54 29 126
Creambell 5 6 8 11 18 78 126
Score Price Flavor Taste Quality Brand Name
Max 50 45 50 50 40
Min 0 0 0 0 0
Avg. 20.21 20.61 21.40 20.69 17.07
Sum 2547 2597 2697 2607 2152
Characteristics of factors which are considered
most for purchasing ice creams

Consumer Profiles:-
Under 18 - 25
62%
26-35
35%
36-45
3%
46-55
0%
Above 56
3%
AGE PROFILE:
42%
58%
0% 0%
Gender:
Male Female
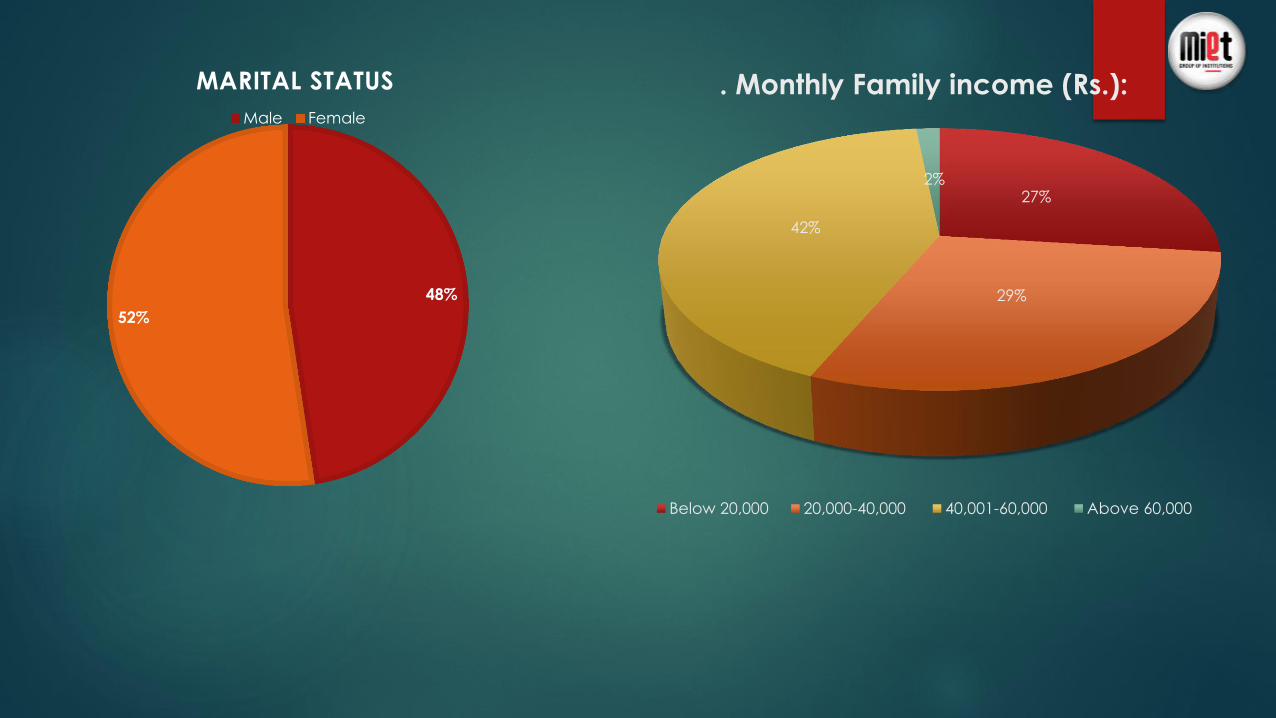
48%
52%
MARITAL STATUS
Male Female
27%
29%
42%
2%
. Monthly Family income (Rs.):
Below 20,000 20,000-40,000 40,001-60,000 Above 60,000

37%
58%
3% 2%
Occupation:
Student Service Business Professionals
24%
25%
51%
0%
Educational qualification:
Under- Gradua Graduate Post- Graduate Others: