presentation of swedbank's year-end report 2012
DESCRIPTION
Swedbank presents its Year-End results for 2012.TRANSCRIPT

Swedbank’s year-end 2012 results Michael Wolf, CEO Göran Bronner, CFO Håkan Berg, CRO

Stable development
2
Retail
SEKm Q2 Q3 Q4 Q/Q
Net interest income 3 404 3 447 3 407 -40
Net commissions 1 248 1 269 1 320 +51
Total income 5 138 5 209 5 107 -102
Total expenses 2 345 2 357 2 432 +75
Profit before
impairments 2 793 2 852 2 675 -177
Credit impairments 100 69 102 +33
• Deposit margins pressure
• Repricing lending
• Increased sales of funds
support commissions
• Solid asset quality ROE, % 24.6 24.4 26.2
C/I ratio 0.46 0.45 0.48

Improved profitability
• Continued growth in Large
Corporates NII
• High activity debt capital
markets and corporate
finance (Norway)
• Equities continue to be slow
• Credit impairment – one large
exposure
3
Large Corporates & Institutions
SEKm Q2 Q3 Q4 Q/Q
Net interest income 825 852 824 -28
- of which LC/FI* 666 689 729 +40
Net commissions 346 379 443 +64
Net gains and
losses 316 341 412 +71
Total income 1 499 1 581 1 703 +122
Expenses excl.
variable staff costs 602 638 612 -26
Variable staff costs 118 66 71 +5
Profit before
Impairments 779 877 1 020 +143
Credit impairments 54 -35 152 +187
* Large Corporates/Financial Institutions
ROE, % 9.8 14.2 17.5
C/I 0.48 0.45 0.40

Slow banking environment
• Lower Euribor affected NII
• Small lending growth in EUR
• One-off in Lithuania SEK -35m
affecting commissions
• Seasonally higher expenses
• Recoveries continued
• Further efficiency focus needed
4
Baltic Banking
SEKm Q2 Q3 Q4 Q/Q
Net interest income 870 755 761 +6
Net commissions 378 360 351 -9
Total income 1 430 1 273 1 275 +2
Total expenses 588 553 631 +78
Profit before
impairments 842 720 644 -76
Credit impairments -204 -18 -329 -311
ROE, % 14.8 11.0 13.7
C/I 0.41 0.43 0.49
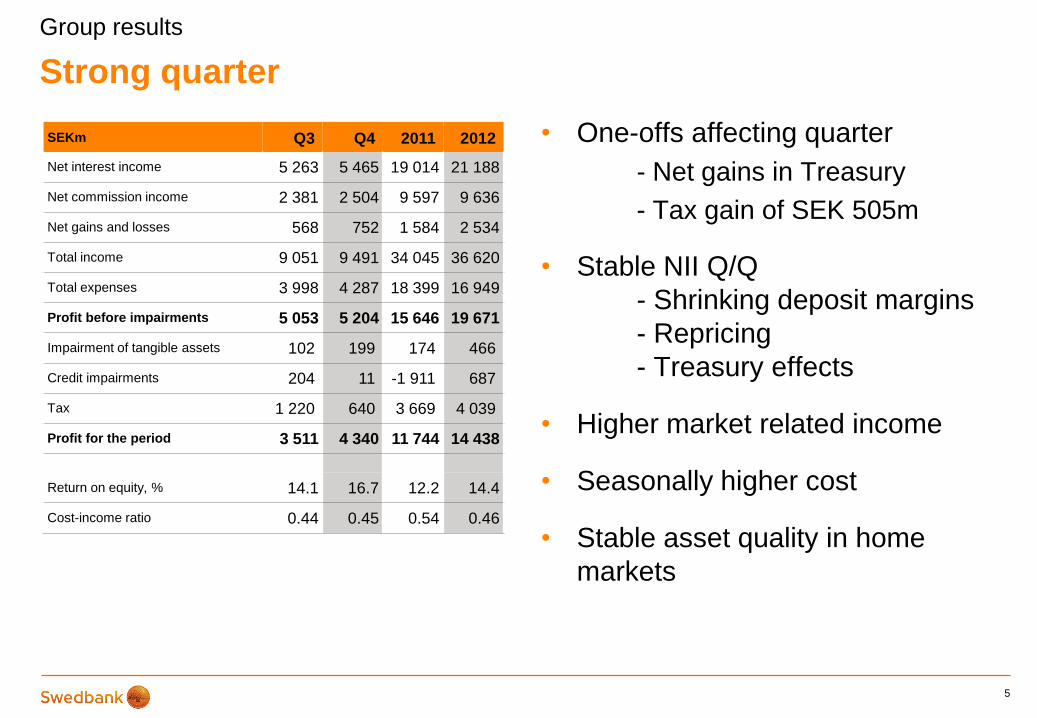
• One-offs affecting quarter
- Net gains in Treasury
- Tax gain of SEK 505m
• Stable NII Q/Q
- Shrinking deposit margins
- Repricing
- Treasury effects
• Higher market related income
• Seasonally higher cost
• Stable asset quality in home
markets
Strong quarter
5
Group results
SEKm Q3 Q4 2011 2012
Net interest income 5 263 5 465 19 014 21 188
Net commission income 2 381 2 504 9 597 9 636
Net gains and losses 568 752 1 584 2 534
Total income 9 051 9 491 34 045 36 620
Total expenses 3 998 4 287 18 399 16 949
Profit before impairments 5 053 5 204 15 646 19 671
Impairment of tangible assets 102 199 174 466
Credit impairments 204 11 -1 911 687
Tax 1 220 640 3 669 4 039
Profit for the period 3 511 4 340 11 744 14 438
Return on equity, % 14.1 16.7 12.2 14.4
Cost-income ratio 0.44 0.45 0.54 0.46

Expenses 2012
Expenses 2013
Focus on customer and efficiency
6
Focus 2013
Customer
service IT
investments
Ektornet Russia &
Ukraine Other
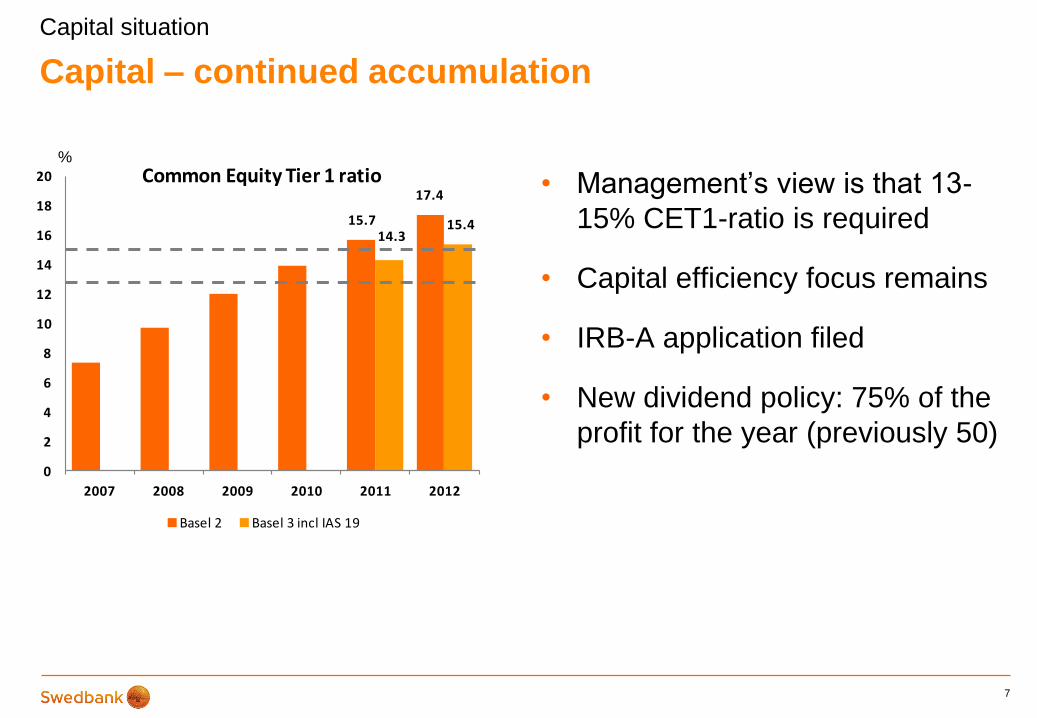
15.7
17.4
14.315.4
0
2
4
6
8
10
12
14
16
18
20
2007 2008 2009 2010 2011 2012
Common Equity Tier 1 ratio
Basel 2 Basel 3 incl IAS 19
Capital – continued accumulation
7
Capital situation
• Management’s view is that 13-
15% CET1-ratio is required
• Capital efficiency focus remains
• IRB-A application filed
• New dividend policy: 75% of the
profit for the year (previously 50)
%

Stable asset quality
8
Risk highlights
• Continued high credit quality in
Sweden
• Net recoveries Baltic Banking
• Exit costs Ukraine continue
Credit impairments
(SEKm) Q3 Q4 2012
Retail 69 102 295
LC&I -35 152 185
Baltic Banking -18 -329 -685
Estonia 2 -242 -343
Latvia 8 86 -124
Lithuania -28 -173 -218
Group Functions &
Other 188 86 892
Russia 28 -30 -43
Ukraine 140 117 915
Other 20 -1 20
Swedbank Group 204 11 687
31.7
14.0
0
5
10
15
20
25
30
35
Q1 11 Q2 11 Q3 11 Q4 11 Q1 12 Q2 12 Q3 12 Q4 12
SEK bnImpaired loans

0
5 000 000
10 000 000
15 000 000
20 000 000
25 000 000
Jan 2010 Jan 2011 Jan 2012Internetbank Mobilebank Telephonebank Branches
High ambition to make it easy for our customers
9
Digital channels
+150% Y/Y
Mobile Bank Sweden: log-ins per month Customer contacts by channel 2012
68% (83%)
5%
(7%)
26% (9%)
2%
Dec 2012
Q&A

Appendix
11

Improved profitability
12
Large Corporates & Institutions
SEKm Q4 11* Q1 12 Q2 12 Q3 12 Q4 12
Net interest income 845 887 825 852 824
of which LC & FI** 563 652 666 689 729
of which Markets 282 235 159 163 95
Commission income 269 434 346 379 443
of which LC & FI* * 261 278 278 311 290
of which Markets 6 156 68 68 153
Total income LC&I 1 328 1 980 1 499 1 581 1 703
of which LC & FI** 832 946 947 1 008 1 030
of which Markets 496 1 034 552 573 673
Total expenses, excl
variable pay 818 607 602 638 612
Variable staff costs 13 106 118 66 71
Profit before
impairments 497 1 267 779 877 1 020
of which LC & FI** 574 735 740 757 792
of which Markets -77 532 39 120 228
Total impairments 21 14 58 -35 152
C/I ratio 0.63 0.36 0.48 0.45 0.40
* Excluding Lehman one-off ,**Large corporates and Financial institutions

Strong execution on costs 2012
• Staff costs -847m and consultancy costs -241m year on year
13
Cost performance
Cost trend (SEKm) FY 2011 FY 2012 YTD
Total expenses 18 399 16 949 -1 450
Variable staff costs -395 -738
Compensation to savings banks -530 -622
Restructuring cost -430 -2
FX effects -87
Underlying cost 16 957 15 587 -1 370
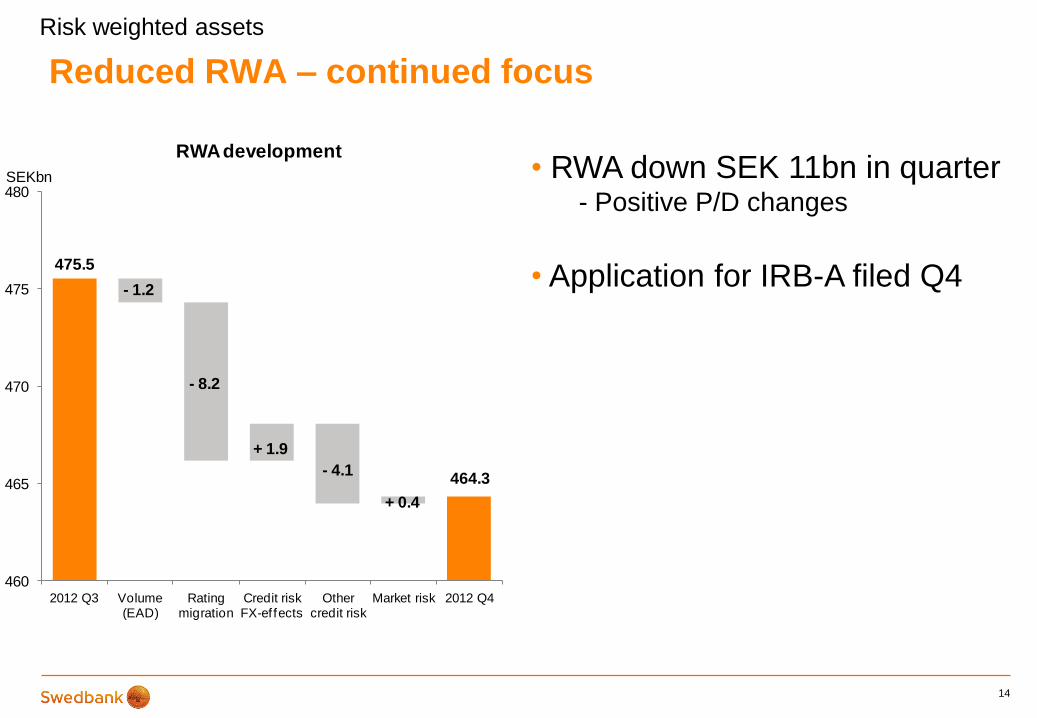
Reduced RWA – continued focus
14
Risk weighted assets
• RWA down SEK 11bn in quarter - Positive P/D changes
• Application for IRB-A filed Q4
464.3
- 1.2
- 8.2
+ 1.9
- 4.1
+ 0.4
475.5
460
465
470
475
480
2012 Q3 Volume (EAD)
Rating migration
Credit risk FX-ef fects
Other credit risk
Market risk 2012 Q4
SEKbn
RWA development
0
200
400
600
800
1 000
1 200
1 400
Q4 2012
0
200
400
600
800
1 000
1 200
1 400
Q4 2012
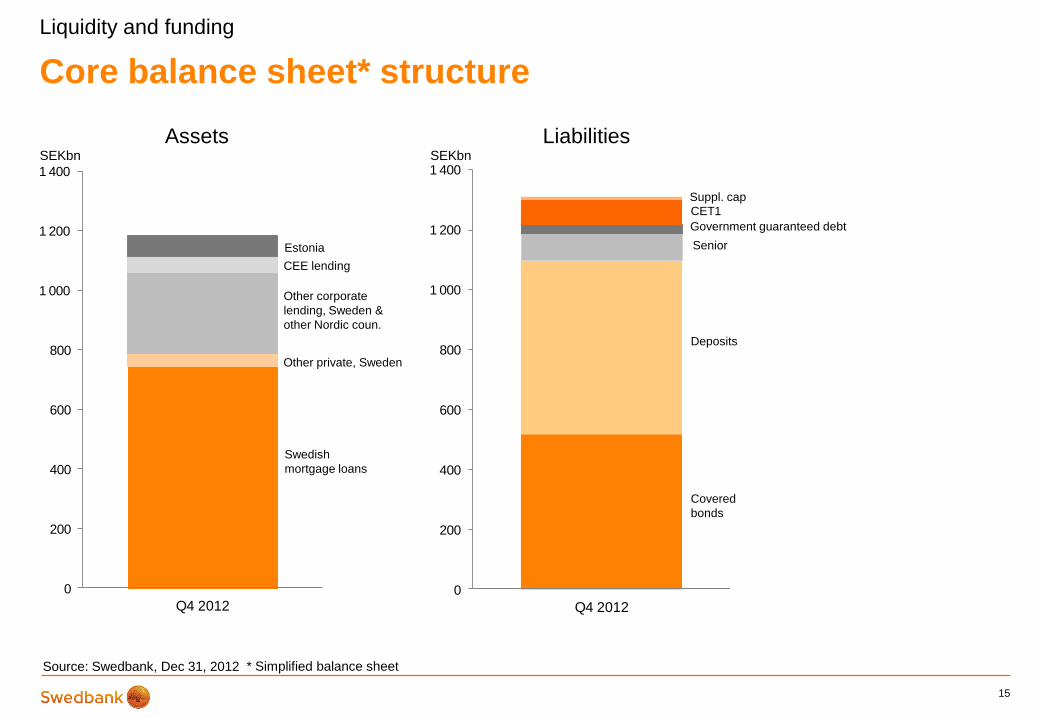
Core balance sheet* structure
15
Liquidity and funding
CEE lending
Estonia
Other corporate
lending, Sweden &
other Nordic coun.
Other private, Sweden
Swedish
mortgage loans
Senior
Covered
bonds
Deposits
CET1
Suppl. cap
Government guaranteed debt
Source: Swedbank, Dec 31, 2012
Assets Liabilities SEKbn SEKbn
* Simplified balance sheet

0
20
40
60
80
100
120
Covered bonds Senior unsecured
Lower funding needs
• LCR139% (Swedish FSA definition FFFS 2012:6)
• NSFR 91%
• Expanded investor base
16
Liquidity and funding
Term funding issuance – completed and planned
SEKbn

0
5 000
10 000
15 000
20 000
25 000
30 000
Domestic CB
Euro CB USD CB (144A)
Other CB Senior unsecured
Q1 12
Q2 12
Q3 12
Q4 12
0
10 000
20 000
30 000
40 000
50 000
60 000
70 000
Domestic CP
ECP/CD USCP Yankee CD French CD Finnish CD
Q1 12
Q2 12
Q3 12
Q4 12
Conservative funding plan
17
Long-term debt issued
• Issued SEK 142bn of term-funding FY 2012, maturities of SEK 86bn
• Term funding plan in 2013 of SEK 120bn, maturities of SEK 86bn
Liquidity and funding
Outstanding short-term debt SEKm SEKm
Source: Swedbank, Dec 31, 2012, nominal amounts
0
50
100
150
200
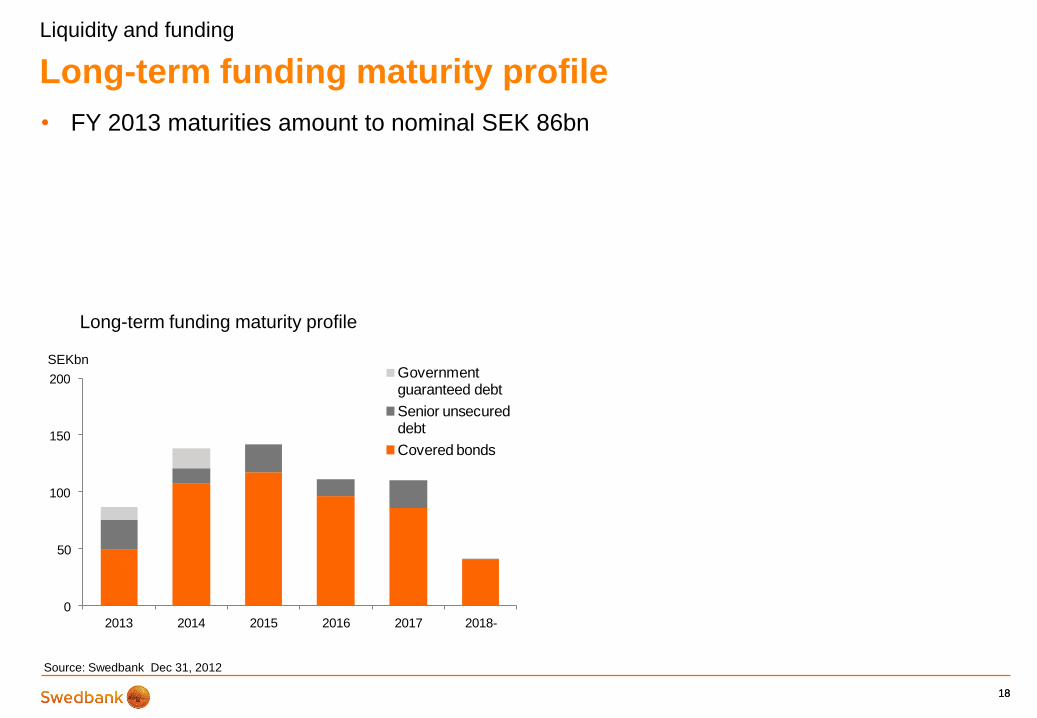
2013 2014 2015 2016 2017 2018-
Government guaranteed debt
Senior unsecured debt
Covered bonds
18
Long-term funding maturity profile
• FY 2013 maturities amount to nominal SEK 86bn
18
Long-term funding maturity profile
Source: Swedbank Dec 31, 2012
Liquidity and funding
SEKbn

-15%
-10%
-5%
0%
5%
10%
15%
20%
25%
30%
35%
40%
0% -5% -10% -15% -20% -25% -30% -35% -40% -45% -50%
OC, Q412
0
20
40
60
2013 2014 2015 2016 2017 2018-
Senior unsecured debt
Senior unsecured debt strategy
19
Source: Swedbank, Dec 31, 2012, nominal amounts
• Limited need given Swedbank’s balance sheet structure
• Secure OC
• Fund liquidity reserves
Senior unsecured debt maturity profile
SEKbn
Over-
colla
tera
lisation
House price drop
House price sensitivity of the cover pool
Liquidity and funding
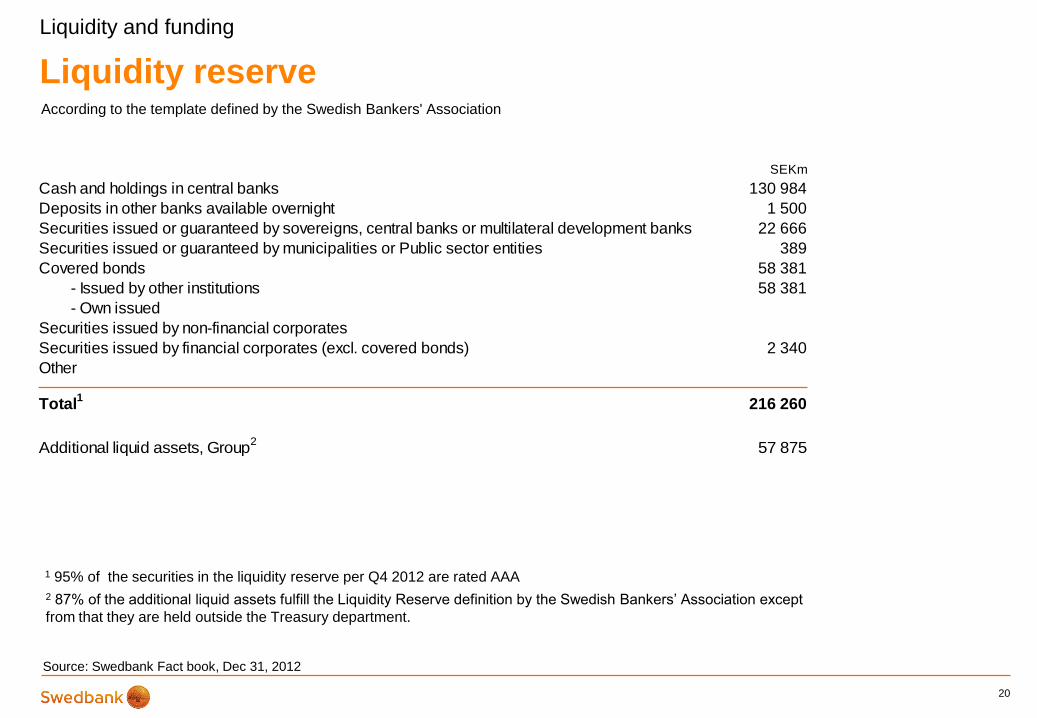
SEKm
Cash and holdings in central banks 130 984
Deposits in other banks available overnight 1 500
Securities issued or guaranteed by sovereigns, central banks or multilateral development banks 22 666
Securities issued or guaranteed by municipalities or Public sector entities 389
Covered bonds 58 381
- Issued by other institutions 58 381
- Own issued
Securities issued by non-financial corporates
Securities issued by financial corporates (excl. covered bonds) 2 340
Other
Total1
216 260
Liquidity reserve
20
1 95% of the securities in the liquidity reserve per Q4 2012 are rated AAA
According to the template defined by the Swedish Bankers' Association
2 87% of the additional liquid assets fulfill the Liquidity Reserve definition by the Swedish Bankers’ Association except
from that they are held outside the Treasury department.
Liquidity and funding
Source: Swedbank Fact book, Dec 31, 2012
Additional liquid assets, Group2
57 875

Prolonged survival horizon*
21
Liquidity and funding
0
50
100
150
200
250
300
0 20 40 60 80 100 120 140 160 180 200 220 240 260 280 300 320 340 360Days forward
365
SEKbn
Source: Swedbank Dec 31, 2012
* For definition see Swedbank factbook

0
50
100
150
200
250
300
350
400
Next 12-month term funding maturities
CP / CDs and net interbank funding,
SEKm
0
50
100
150
200
250
300
350
400
Additional pledgeable and/or liquid assets
Liquidity reserve, securities
Liquidity reserve, central bank deposits,
SEKm
Conservative liquidity levels
• Short-term funding mainly a tool for cash management
• More than 12 months pre-funded
22
SEKbn
Source: Swedbank Dec 31, 2012
Liquidity and funding
1 As defined by the Swedish Bankers’ Association
1
1
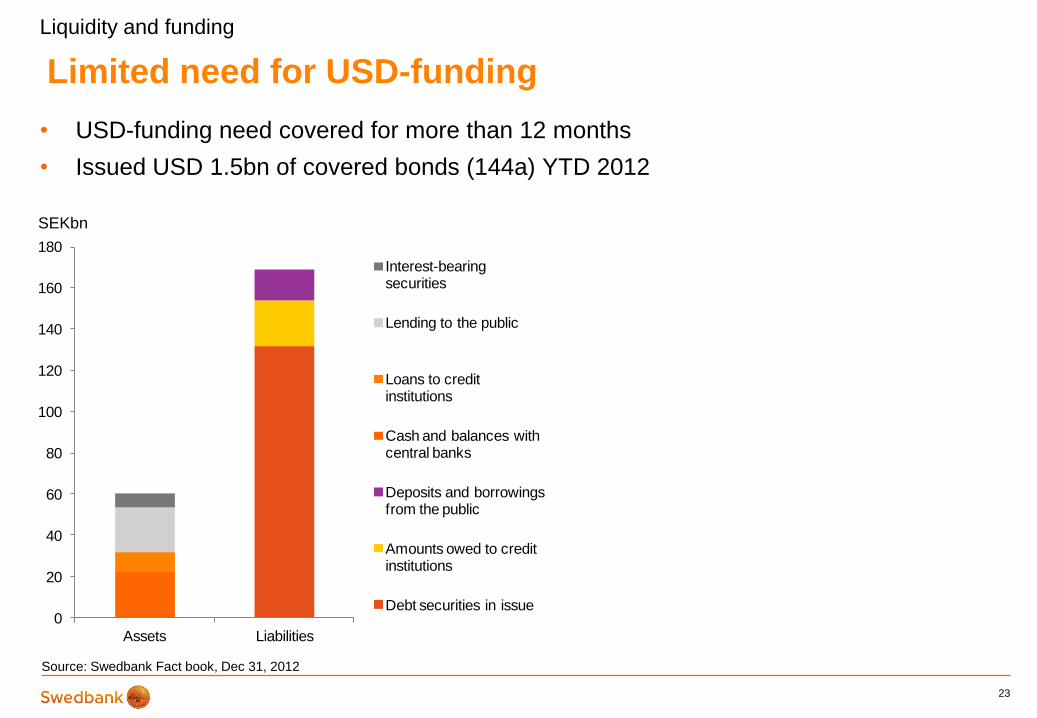
Limited need for USD-funding
23
SEKbn
• USD-funding need covered for more than 12 months
• Issued USD 1.5bn of covered bonds (144a) YTD 2012
Source: Swedbank Fact book, Dec 31, 2012
Liquidity and funding
0
20
40
60
80
100
120
140
160
180
Assets Liabilities
Interest-bearing securities
Lending to the public
Loans to credit institutions
Cash and balances with central banks
Deposits and borrowings from the public
Amounts owed to credit institutions
Debt securities in issue
0
20
40
2013 2014
JPY
CHF
USD
SEK
EUR
24
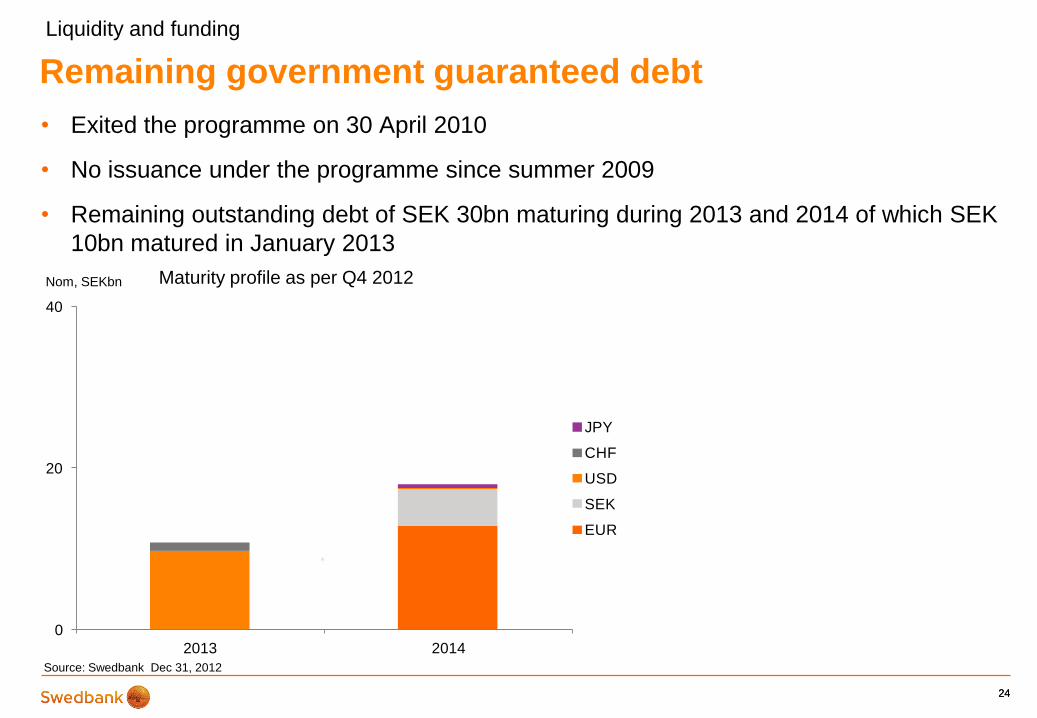
Remaining government guaranteed debt
• Exited the programme on 30 April 2010
• No issuance under the programme since summer 2009
• Remaining outstanding debt of SEK 30bn maturing during 2013 and 2014 of which SEK
10bn matured in January 2013
24
Maturity profile as per Q4 2012
Source: Swedbank Dec 31, 2012
Liquidity and funding
Nom, SEKbn

Asset encumbrance
25
Liquidity and funding
Source: Swedbank Facts Q4 2012
Distribution by type of liability and asset
SEKm
Government
debt
instruments
Central banks
and
supranational
debt
instruments
Covered
bonds
Debt
instruments
issued by
credit
institutions
Securities
issued by
corporate and
other issuers ABS
Mortgage
loans Cash Total
Central bank funding
Intraday settlement collateral 1) 2 12 369 12 371
Repurchase agreements 2) 12 992 13 496 26 488
Derivative collateral 3) 162 862 14 120 15 144
Covered bonds 4) 516 749 516 749
Accrued interest of assets in
the cover pool 2 330 2 330
Other 5) 366 366
Total 13 156 26 727 519 079 14 486 573 448
Financial assets pledged for insurance policy holders 103 083
Additional assets available for secured funding 6)
SEKm
Government
debt
instruments
Central banks
and
supranational
debt
instruments
Covered
bonds
Debt
instruments
issued by
credit
institutions
Securities
issued by
corporate and
other issuers ABS
Mortgage
loans Cash Total
Securities 7, 8) 26 883 3 265 84 045 11 393 8 203 1 059 134 848
Cover pool over
collateralisation incl. accr.
interest 4) 181 828 181 828
Cover pool eligible assets 9) 11 608 11 608
Total 26 883 3 265 84 045 11 393 8 203 1 059 193 436 328 284
1) Pledged securities on balance sheet.
2) Repoed securities on balance sheet.
3) Collateral posted under CSA agreements, gross (3-year, SEKm, High: 21 572,
Low : 10 945, Average: 13 644).
4) Nominal amount excluding accrued interest.
5) Collateral pledged in securities lending activities and w ith exchanges
6) Assets not currently encumbered.
7) Reversed repos are included.
8) All type of securities, including securities non pledgeable at central banks, of
w hich 82% are rated AAA, 2% are rated below A- and 8% are not rated.
9) Type of loans; Residential 84.4%, Forestry & Agriculture 15.3%, Commercial
0.3%.
Swedish mortgage market
• No securitization (on balance sheet), no sub-prime market, no 3rd party origination, no buy-to-let
market
• 70% home ownership1
• Rental market is regulated
• Transparent credit information (credit information agency, www.uc.se)
– Publicly available information regarding income, debt, payment track record etc
• Consumer credit legislation requires affordability calculations including stress test of higher interest
rate
• Very limited debt forgiveness possibilities (full recourse)
• Strong social security and generous unemployment benefit system
26
Swedish housing and mortgage market
1 Source: Boverket, 2011

Real estate prices – Sweden 12 months development
27
Swedish housing and mortgage market
Single-family homes1 Tenant-owner rights2 Combined3
12M Δ
12M Δ
12M Δ
Jan/12 -4% -2% -4%
Feb/12 -4% -1% -3%
Mar/12 -4% 1% -3%
Apr/12 -2% 2% -1%
May/12 -2% 3% -1%
Jun/12 -1% 4% 0%
Jul/12 0% 4% 1%
Aug/12 2% 4% 3%
Sep/12 2% 5% 3%
Oct/12 1% 6% 3%
Nov/12 3% 7% 4%
Dec/12 4% 7% 6%
Source: Valuegard www.valuegard.se (Based on data from Mäklarstatistik), 1 HOXHOUSESWE, 2 HOXFLATSWE, 3 HOXSWE
28
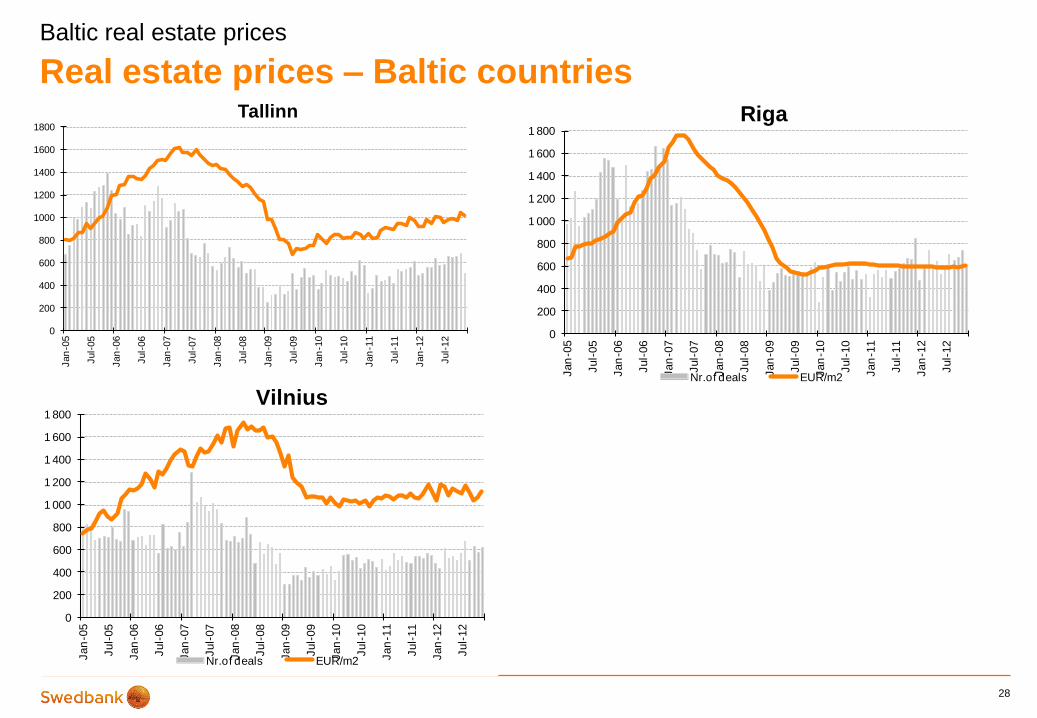
Real estate prices – Baltic countries
Source: Swedbank, Estonian Land Board Source: Swedbank
Baltic real estate prices
0
200
400
600
800
1000
1200
1400
1600
1800
Jan
-05
Jul-
05
Jan
-06
Jul-
06
Jan
-07
Jul-
07
Jan
-08
Jul-
08
Jan
-09
Jul-
09
Jan
-10
Jul-
10
Jan
-11
Jul-
11
Jan
-12
Jul-
12
Tallinn
Nr.of deals EUR/m2
0
200
400
600
800
1 000
1 200
1 400
1 600
1 800
Jan
-05
Jul-
05
Jan
-06
Jul-
06
Jan
-07
Jul-
07
Jan
-08
Jul-
08
Jan
-09
Jul-
09
Jan
-10
Jul-
10
Jan
-11
Jul-
11
Jan
-12
Jul-
12
Riga
Nr.of deals EUR/m2
0
200
400
600
800
1 000
1 200
1 400
1 600
1 800
Jan
-05
Jul-
05
Jan
-06
Jul-
06
Jan
-07
Jul-
07
Jan
-08
Jul-
08
Jan
-09
Jul-
09
Jan
-10
Jul-
10
Jan
-11
Jul-
11
Jan
-12
Jul-
12
Vilnius
Nr.of deals EUR/m2
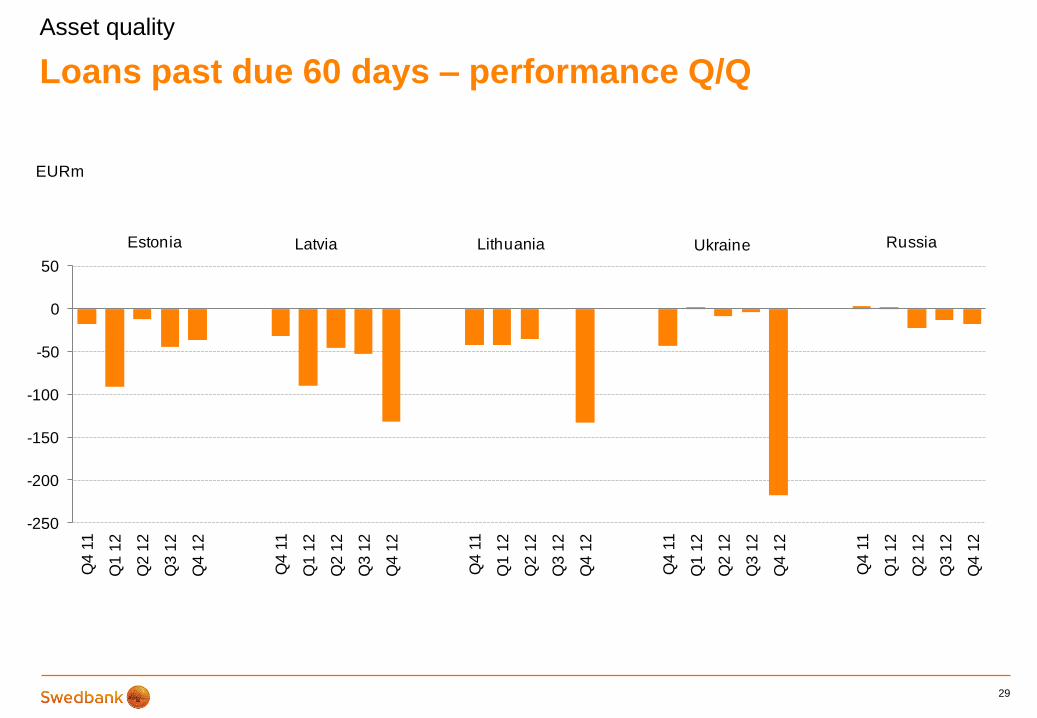
Loans past due 60 days – performance Q/Q
29
Asset quality
-250
-200
-150
-100
-50
0
50
Q4
11
Q1
12
Q2
12
Q3
12
Q4
12
Q4
11
Q1
12
Q2
12
Q3
12
Q4
12
Q4
11
Q1
12
Q2
12
Q3
12
Q4
12
Q4
11
Q1
12
Q2
12
Q3
12
Q4
12
Q4
11
Q1
12
Q2
12
Q3
12
Q4
12
EURm
Estonia Latvia Lithuania RussiaUkraine

Provisions – well provided for
30
Asset quality
Provision ratios, % Q4 12
Retail 75
LC&I 166
Baltic Banking 52
Russia 64
Ukraine 78
Group 62
12 82111 915
10 9519 934
7 077
2 4352 478
2 0401 774
1 545
61.5%65.0% 63.7% 65.2%
61.9%
0
5 000
10 000
15 000
20 000
25 000
Q4 11 Q1 12 Q2 12 Q3 12 Q4 12
SEKm
Individual provisions Portfolio provisions Provision ratio

Corporate Retail portfolio will drive capital efficiency
31
Credit portfolio – Retail
Segments excl. Swedbank
Mortgage and Swedbank Finance
Volume
(SEKbn)
Secured
(%)
Agriculture 6.0 82
Manufacturing 11.3 70
Public sector and utilities 4.7 86
Construction 4.4 85
Retail 8.8 89
Transportation 2.0 78
Shipping 0.1 95
Hotels and restaurants 3.0 90
Information & communication 0.9 49
Finance and insurance 3.3 79
Property management 54.9 96
Professional service 6.7 59
Other 6.4 61
Total 113 86
Total portfolio SEK 231bn
94
24
113
Swedbank Mortgage AB
Leasing (Swedbank
Finance AB)
Other

14
6
4
24 24 26
25 24
0
10
20
30
Q4-11 Q1-12 Q2-12 Q3-12 Q4-12
SEKbn Shipping and Offshore
Offshore Tanker Other
32
Credit portfolio – Large Corporates & Institutions
• Lending exposure to shipping and offshore sector of
SEK 24.2bn plus unutilised commitments of SEK
7.9bn
– Portfolio duration 4-5y
– Average fleet age 7y
– Strong employment profiles
0.4% -3.6%
Shipping and offshore
0 5 10 15 20 25
SEK
EUR
USD
NOK
JPY
Shipping and Offshore Portfolio by Currency
Q4-12
Q3-12
0.5
7.0
1.9
3.6
1.2
1.9
0.2
2.4
0.7
1.2
0.7
1.0
1.7
0 2 4 6 8
Cruise
Drilling & exploration
Oil service
Supply
Accommodation
Floating production
Chemical
Product
Crude oil
Gas (LNG/LPG)
Dry bulk
Container
RORO
Shipping and Offshore Portfolio by Subsegment
Q4-12
Q3-12
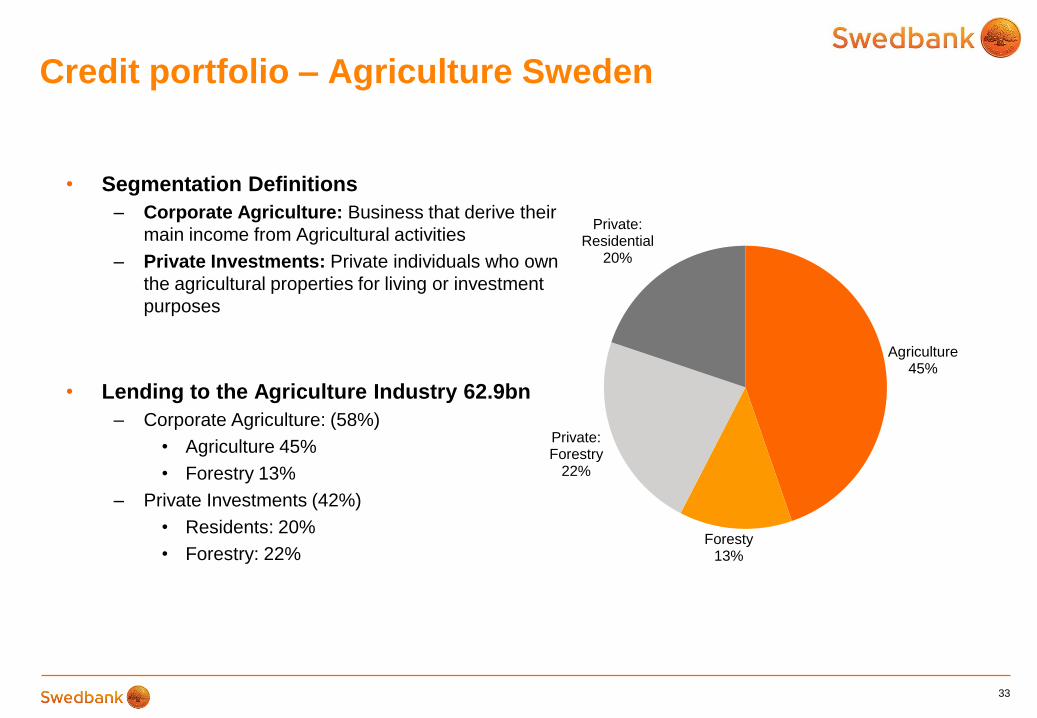
Credit portfolio – Agriculture Sweden
33
• Segmentation Definitions
– Corporate Agriculture: Business that derive their
main income from Agricultural activities
– Private Investments: Private individuals who own
the agricultural properties for living or investment
purposes
• Lending to the Agriculture Industry 62.9bn
– Corporate Agriculture: (58%)
• Agriculture 45%
• Forestry 13%
– Private Investments (42%)
• Residents: 20%
• Forestry: 22%
Agriculture 45%
Foresty 13%
Private: Forestry
22%
Private: Residential
20%

2012 ICAAP Scenario
– Deep recession without recovery
34
• Europe enters into deep
recession
• Limited possibilities for fiscal
stimulus
• European bank runs
• Credit contraction
• Closed funding markets
Triggers Outcome
• Sharp GDP drop with no
recovery (10-15% from 2011
level)
• Severe drop in house prices
(25-37% from 2011 level)
• Depreciated EUR and
appreciated SEK
• Devaluation in Latvia and
Lithuania
ICAAP

High capitalisation even in extremely stressed scenario
• Revenue decrease 31 percent
• Credit impairments SEK 64bn over 5 year
• Scenario effects on Core Tier 1 ratio -165bp
• Well above 12% Core Tier 1 ratio at low point even in extremely
stressed scenario in new regulatory environment
35
ICAAP

55
65
75
85
95
105
2011 2012 2013 2014 2015 2016
Sweden Estonia Latvia Lithuania
2012 ICAAP dcenario
– Deep recession without recovery
36
ICAAP
80
85
90
95
100
105
2011 2012 2013 2014 2015 2016
Sweden Estonia Latvia Lithuania
GDP - Index Real Estate prices - index
0.0%
0.5%
1.0%
1.5%
2.0%
2.5%
3.0%
2011 2012 2013 2014 2015 2016
Euribor Stibor
Interest rates – 3m
0
2
4
6
8
10
12
14
2011 2012 2013 2014 2015 2016
USD/SEK EUR/SEK GBP/SEK
FX scenario
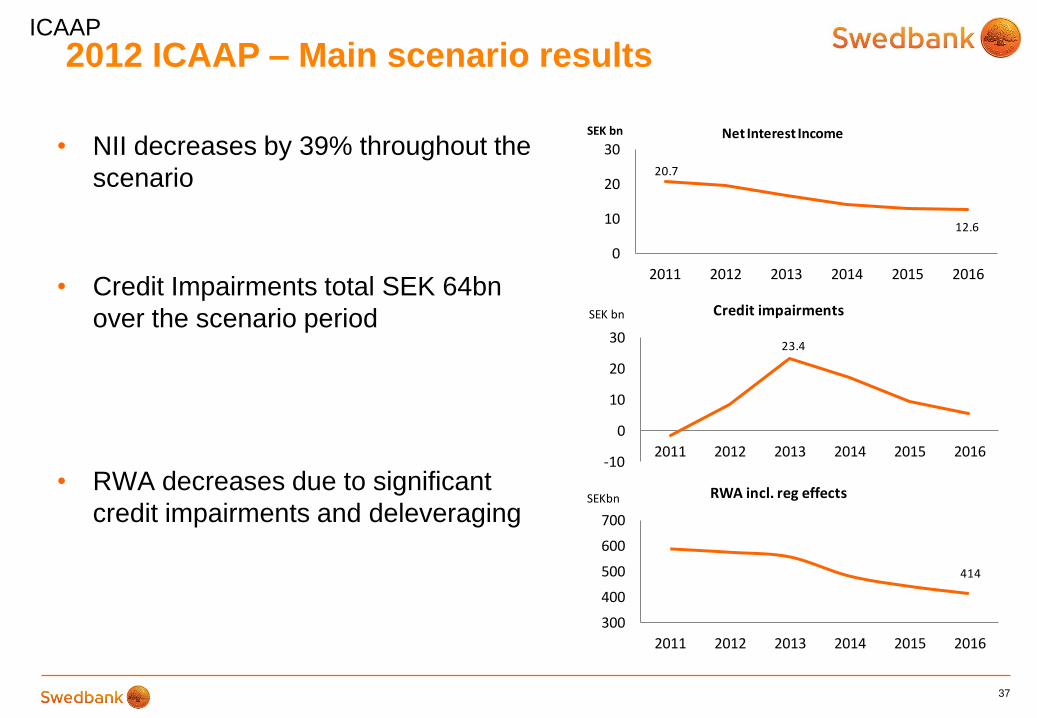
2012 ICAAP – Main scenario results
37
ICAAP
• NII decreases by 39% throughout the
scenario
• Credit Impairments total SEK 64bn
over the scenario period
• RWA decreases due to significant
credit impairments and deleveraging
20.7
12.6
0
10
20
30
2011 2012 2013 2014 2015 2016
SEK bn Net Interest Income
23.4
-10
0
10
20
30
2011 2012 2013 2014 2015 2016
SEK bn Credit impairments
414
300
400
500
600
700
2011 2012 2013 2014 2015 2016
SEKbn RWA incl. reg effects
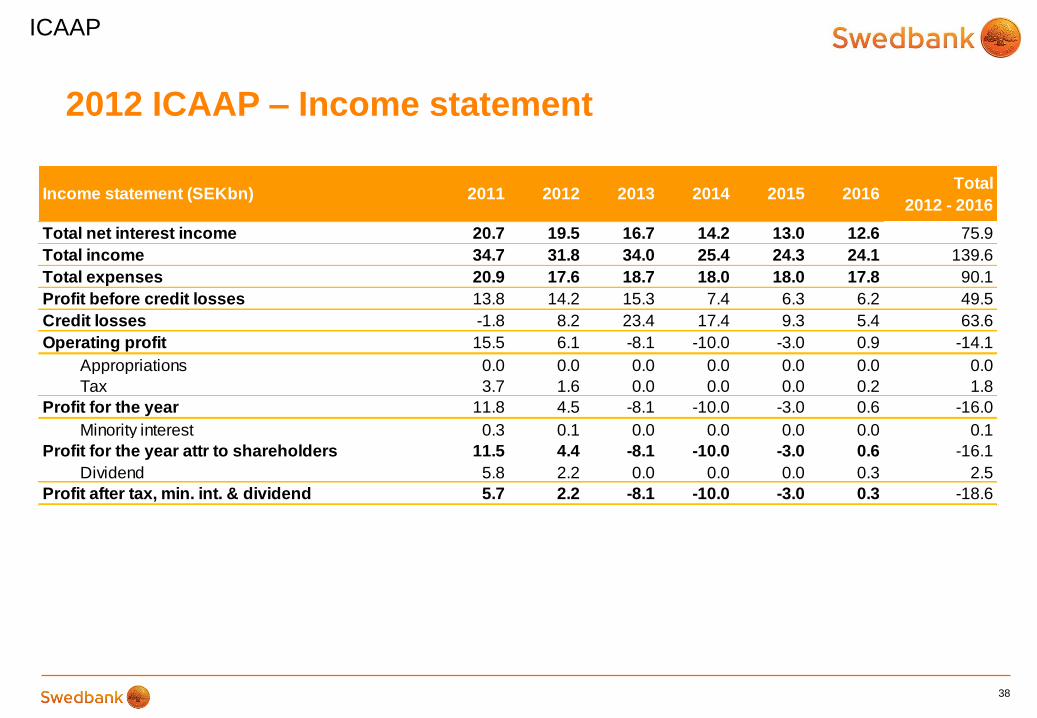
2012 ICAAP – Income statement
38
ICAAP
Income statement (SEKbn) 2011 2012 2013 2014 2015 2016Total
2012 - 2016
Total net interest income 20.7 19.5 16.7 14.2 13.0 12.6 75.9
Total income 34.7 31.8 34.0 25.4 24.3 24.1 139.6
Total expenses 20.9 17.6 18.7 18.0 18.0 17.8 90.1
Profit before credit losses 13.8 14.2 15.3 7.4 6.3 6.2 49.5
Credit losses -1.8 8.2 23.4 17.4 9.3 5.4 63.6
Operating profit 15.5 6.1 -8.1 -10.0 -3.0 0.9 -14.1
Appropriations 0.0 0.0 0.0 0.0 0.0 0.0 0.0
Tax 3.7 1.6 0.0 0.0 0.0 0.2 1.8
Profit for the year 11.8 4.5 -8.1 -10.0 -3.0 0.6 -16.0
Minority interest 0.3 0.1 0.0 0.0 0.0 0.0 0.1
Profit for the year attr to shareholders 11.5 4.4 -8.1 -10.0 -3.0 0.6 -16.1
Dividend 5.8 2.2 0.0 0.0 0.0 0.3 2.5
Profit after tax, min. int. & dividend 5.7 2.2 -8.1 -10.0 -3.0 0.3 -18.6

2012 ICAAP – Credit impairments
39
The accumulated losses constitute SEK 63.6bn.
Credit impairments in LC&I and Retail constitute 74% of total accumulated credit impairments
ICAAP
Credit impairments (%)EAD 2011
(SEKbn) 2012 2013 2014 2015 2016Acc. loss ratio
2012 - 2016
Total 1,384.4 0.6 1.8 1.5 0.9 0.5 4.6
of which LC & I 309.8 0.5 2.3 2.0 0.8 0.6 5.4
Retail 950.8 0.3 1.2 1.0 0.7 0.3 3.2
Estonia 52.5 1.2 2.5 2.2 1.8 1.7 6.6
Latvia 30.6 2.7 6.1 5.6 4.4 4.6 15.0
Lithuania 31.1 2.4 4.1 3.0 2.4 2.2 9.5
Russia & Ukraine 9.6 5.2 20.9 10.5 3.7 1.6 41.9
Credit impairments LC & I and Retail
(%)
EAD 2011
(SEKbn) 2012 2013 2014 2015 2016Acc. loss ratio
2012 - 2016
Agriculture, forestry and fishing 25.8 0.5 1.4 1.3 1.0 0.2 3.7
Manufacturing 39.3 1.0 2.6 2.5 1.2 0.5 6.7
Public sector and utilities 11.6 0.6 1.8 2.1 1.3 0.4 5.3
Construction 15.1 1.2 3.4 3.4 1.9 0.4 8.5
Retail 22.8 1.3 4.6 5.4 4.0 2.4 14.0
Transportation 8.6 2.1 8.2 5.7 3.4 1.2 16.1
Shipping 31.2 0.4 8.5 6.2 0.6 0.5 14.4
Hotels and restaurants 3.8 2.7 6.3 6.3 3.7 0.7 15.0
Information and communication 5.0 0.6 1.7 1.9 1.0 0.5 4.9
Finance and insurance 20.4 0.3 0.8 1.2 0.6 0.3 2.8
Property management 125.1 0.9 3.9 3.8 2.0 1.0 9.6
Cooperative housing associations 75.4 0.3 1.1 1.2 0.5 0.1 2.8
Other corporate lending 75.5 0.9 1.4 1.2 0.7 0.3 3.9
Professional services 14.9 1.0 2.7 3.2 2.1 0.7 8.0
Bank 128.2 0.5 1.3 1.1 0.9 0.8 3.9
Private 657.8 0.1 0.4 0.3 0.3 0.2 1.2
Total 1,260.5 0.4 1.5 1.3 0.7 0.4 3.7

RWA & Capital (SEKbn) 2011 2012 2013 2014 2015 2016
RWA 492.3 489.5 504.1 433.9 395.2 365.0
RWA inc 15% mortgage riskweight * 565.3 552.2 557.1 482.4 442.6 414.4
RWA inc regulatory effects ** 588.1 575.0 557.1 482.4 442.6 414.4
Core Tier 1 77.3 79.7 62.1 52.4 49.5 49.8
Core Tier 1 inc regulatory effects ** 73.6 76.0 62.1 52.4 49.5 49.8
Total Capital base 93.2 88.3 70.9 61.5 57.2 55.2
Capital assessment (%) 2011 2012 2013 2014 2015 2016
Core Tier 1 ratio 15.7 16.3 12.3 12.1 12.5 13.6
Core Tier 1 ratio inc 15% mortgage riskweight * 13.7 14.4 11.1 10.9 11.2 12.0
Core Tier 1 ratio inc. regulatory effects ** 12.5 13.2 11.1 10.9 11.2 12.0
Total capital ratio inc. 15% mortgage riskweight * 16.5 16.0 12.7 12.7 12.9 13.3
2012 ICAAP Main adverse scenario results
Capital assessment
40
* The effect of a 15% average riskweight on the Swedish Mortgage portfolio
** Includes assessed effects of Basel 3, IAS 19 and changed mortgage risk-weights
ICAAP
The Riksbank's Financial Stability Report 2012:2
41
• Swedbank has the overall strongest capitalisation among
Swedish peers
• Swedbank has the strongest liquidity metrics among Swedish
peers,
• Swedbank is the most reciliant bank in a stressed scenario, only
Swedbank makes a profit every year of the stress
• Swedbank is the transparency leader
All subsequent slides are taken from the
Riksbank’s Financial Stability Report 2012:2
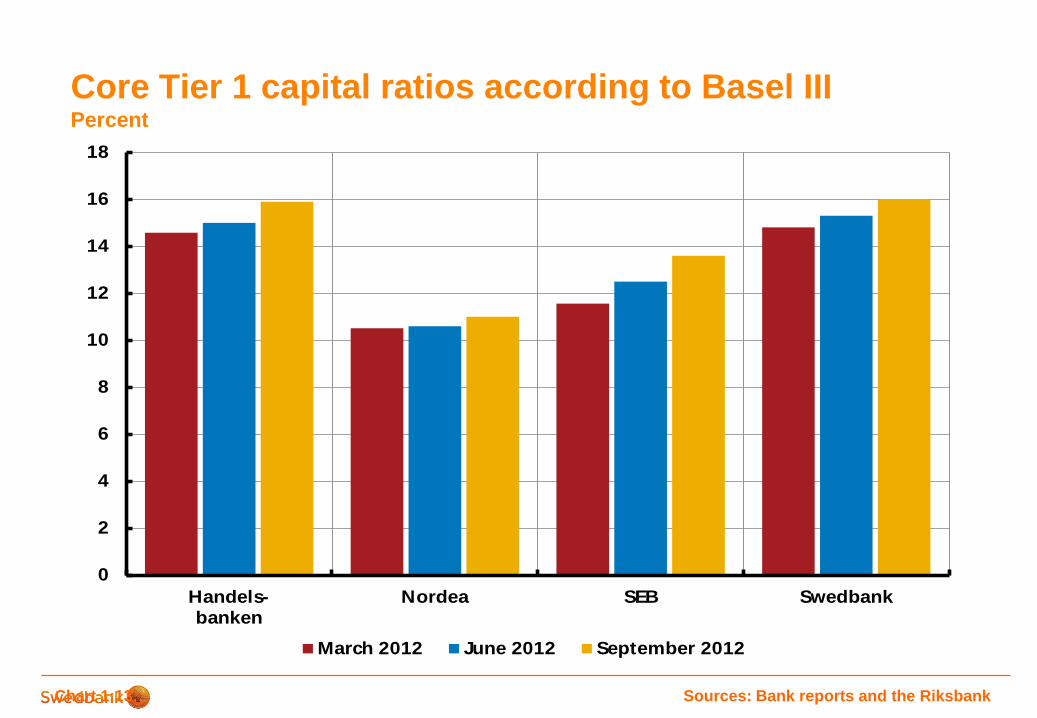
Core Tier 1 capital ratios according to Basel III Percent
0
2
4
6
8
10
12
14
16
18
Handels-banken
Nordea SEB Swedbank
March 2012 June 2012 September 2012
Sources: Bank reports and the Riksbank Chart 1:13

Adjusted Leverage ratio
December 2011, per cent
0 2 4 6 8 10 12
Handelsbanken
Deutsche Bank
Nordea
Danske Bank
Commerzbank
Credit Suisse
DNB
SEB
Swedbank
Raiffeisen
Lloyds
Société Générale
Credit Agricole
UniCredit
BNP Paribas
Barclays
BBVA
Erste Group Bank
St. Chartered
RBS
HSBC
Intesa Sanpaolo
UBS
Sources: Liquidatum and the Riksbank Chart 4:10
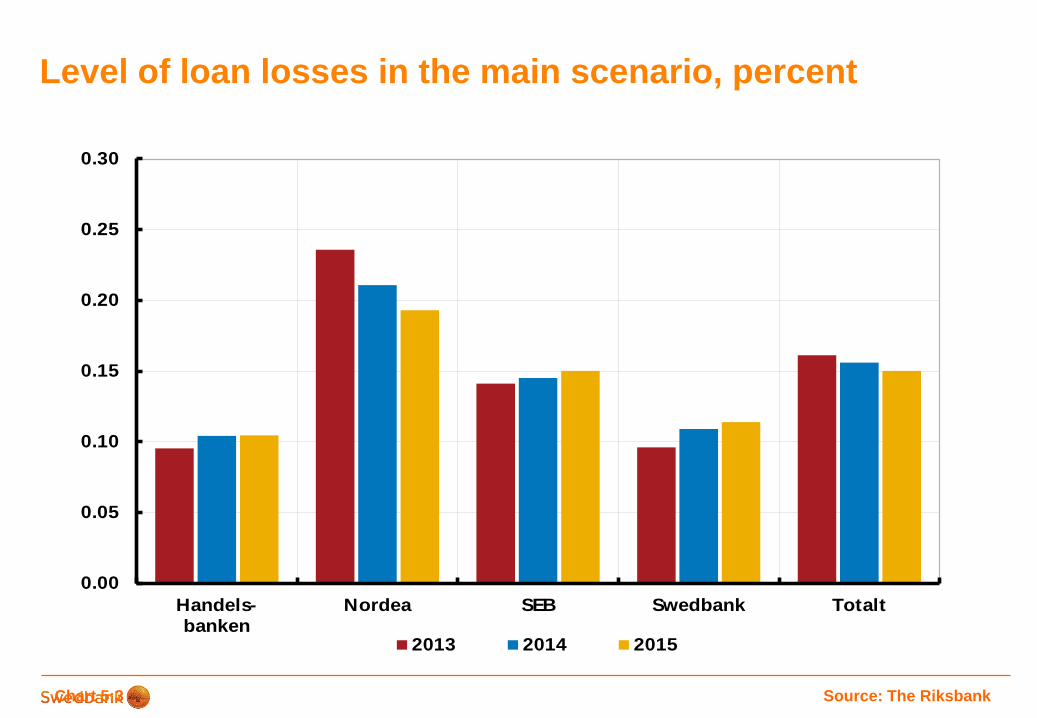
Level of loan losses in the main scenario, percent
0.00
0.05
0.10
0.15
0.20
0.25
0.30
Handels-
banken
Nordea SEB Swedbank Totalt
2013 2014 2015
Source: The Riksbank Chart 5:3

CET 1 capital ratio according to Basel III, initially
and in the Riksbank’s stress test Percent
0
2
4
6
8
10
12
14
16
18
12
Q3
13 14 15 12
Q3
13 14 15 12
Q3
13 14 15 12
Q3
13 14 15
Handelsbanken Nordea SEB Swedbank
Sources: Bank reports and the Riksbank Chart 5:9

P&L in the Riksbank stress test

The Riksbank’s short-term liquidity measure Survival period, number of days
0
20
40
60
80
100
120
Handels-banken
Nordea SEB Swedbank
September 2011 December 2011 March 2012 June 2012 September 2012
Sources: Liquidatum and the Riksbank Chart 5:12

The Riksbank’s structural liquidity measure Stable funding in relation to illiquid assets, per cent
0
20
40
60
80
100
120
Handels-banken
Nordea SEB Swedbank
September 2011 December 2011 March 2012 June 2012 September 2012
Sources: Liquidatum and the Riksbank Chart 5:14
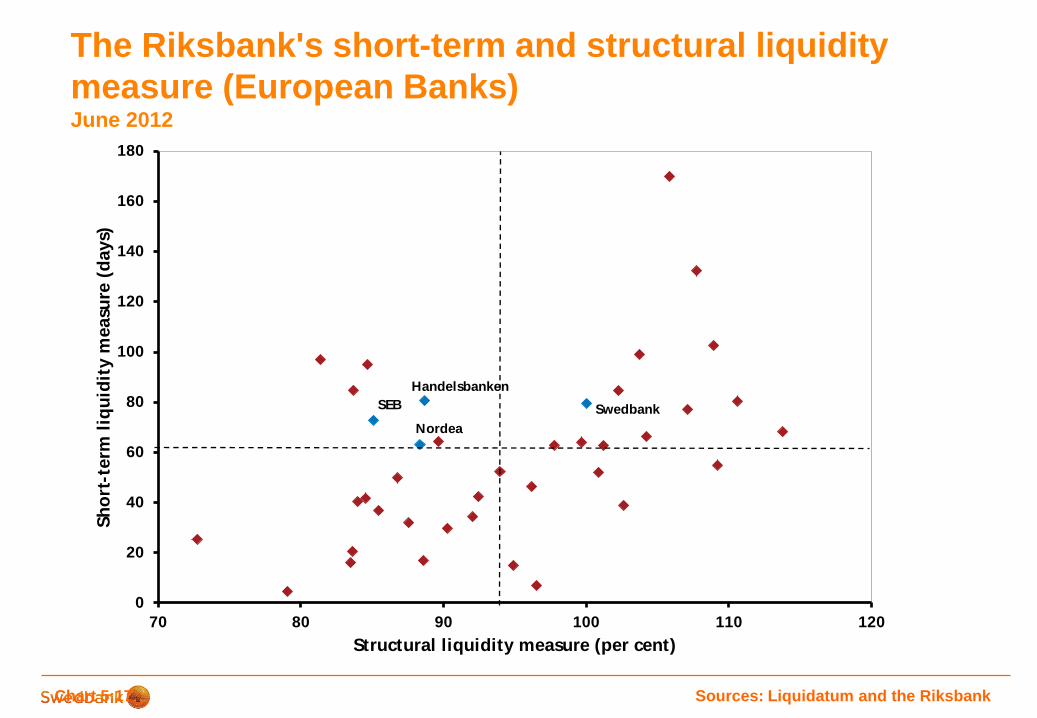
The Riksbank's short-term and structural liquidity
measure (European Banks) June 2012
Nordea
SEB
Handelsbanken
Swedbank
0
20
40
60
80
100
120
140
160
180
70 80 90 100 110 120
Sh
ort
-term
liq
uid
ity m
easu
re (
days)
Structural liquidity measure (per cent)
Sources: Liquidatum and the Riksbank Chart 5:17

Transparency, liquidity risk
50
0
1
2
3
4
5
6
2003 2004 2005 2006 2007 2008 2009 2010 2011 2012
%
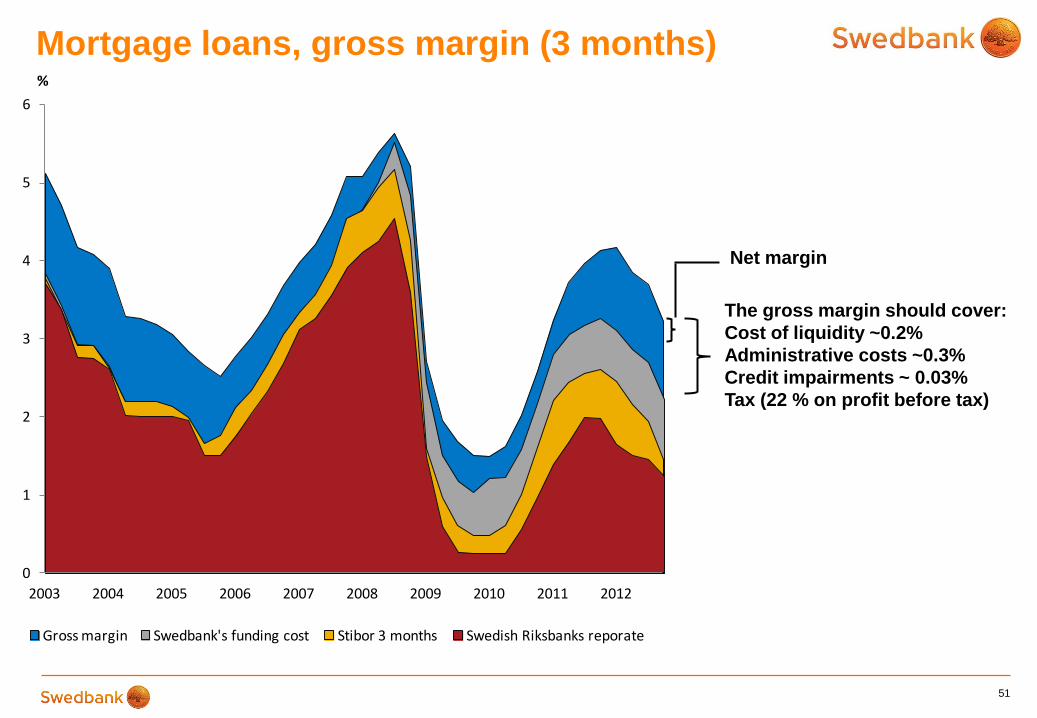
Gross margin Swedbank's funding cost Stibor 3 months Swedish Riksbanks reporate
51
The gross margin should cover:
Cost of liquidity ~0.2%
Administrative costs ~0.3%
Credit impairments ~ 0.03%
Tax (22 % on profit before tax)
Net margin
Mortgage loans, gross margin (3 months)