presentation of experiments for high school …
TRANSCRIPT
PRESENTATION OF EXPERIMENTS FOR HIGH SCHOOL STUDENTS WITH CIVIL ENGINEERING RELATED INTERESTS
By James R. Grandin
David Darwin
A Report on Research Sponsored by
THE NATIONAL SCIENCE FOUNDATION Research Grant No. 9979553
Structural Engineering and Engineering Materials SM Report No. 63
UNIVERISTY OF KANSAS CENTER FOR RESEARCH, INC. LAWRENCE, KANSAS
August 2001

ii
ABSTRACT
In February of 1999, the National Science Foundation developed a $7.5
million program to provide graduate and undergraduate students with the opportunity
to serve as teaching fellows and academic resources in kindergarten through grade
twelve in the fields of science, mathematics, engineering, and technology. This
program enabled university students to introduce new concepts to address science,
mathematics, engineering and technology weaknesses found in many of the nation's
schools. Efforts at the University of Kansas were modeled after similar programs, in
which graduate students are used to promote science and technology.
This report describes six experiments dealing with civil engineering materials
and structures. Each of the experiments includes worksheets for the student and the
instructor. The worksheets provide background information, an explanation of the
processes followed to develop the experiment, a summary of the necessary materials,
and a review section including discussion questions or a calculation worksheet. The
worksheet for the instructor also provides scheduling recommendations and solutions
to questions in the review section.
Key Words: bridge competition, concrete, corrosion, end reactions, engineering,
GK-12, graduate students, graphing, high school, mathematics, moment of inertia,
National Science Foundation, science, technology, University of Kansas

lll
ACKNOWLEDGMENTS
This report is based on a thesis written by James R. Grandin in partial
fulfillment of the requirements for the MSCE degree from the University of Kansas.
The report is an outcome of his work in the National Science Foundation GK-12
Program, directed at the University of Kansas by Dr. Janet Robinson. Appreciation is
expressed to the instructors and administrators at Wyandotte County High School and
in the Kansas City, Kansas Public School District (USD 500) who welcomed
University of Kansas science, math, and engineering graduate students into their
classrooms. Special thanks are due to Walter Thompson, Dr. Mike Hotz, and Mrs.
Dee Dee Albert.

IV
TABLE OF CONTENTS
Page
ABSTRACT ............................................................................................................. ii
ACKNOWLEDGEMENTS ...................................................................................... iii
LIST OF TABLES .................................................................................................... X
LIST OF FIGURES .................................................................................................. xi
CHAPTER 1: INTRODUCTION .............................................................................. 1
1.1 General . . . . . . . . . . . . . . . . . . . . . . . . . . . . . . . . . . . . . . . . . . . . . . . . . . . . . . . . . . . . . . . . . . . . . . . . . . . . . . . . . . . . . . . . . . . . . . . . . . . . 1
1.2 GK-12 at The University of Kansas ......................................................... 2
1.3 Object and Scope ..................................................................................... 3
CHAPTER 2: SIMILAR PROJECTS ........................................................................ 5
2.1 General .................................................................................................... 5
2.2 Monarch Watch ....................................................................................... 5
2.3 K-12 Engineering Outreach Program ....................................................... 7
2.4 Wisconsin Initiative for Space Education (WISE) .................................... 8
CHAPTER 3: CLASSROOM LABORATORIES ................................................... 10
3. 0 General.............................................................................................................. 1 0
3.1 Corrosion Laboratory: Experiment Number 1 ........................................ 12
3.1.1 Purpose ................................................................................... 12
3 .1.2 Introduction ............................................................................. 12
3 .1.3 Corrosion Background ............................................................. 13
3.1.4 How This Experiment is Similar to the Process of Corrosion ... 14
3.1.5 What You Will Need ............................................................... 15
3.1.6 Schedule .................................................................................. 16
3.1.7 Procedure ................................................................................ 16

v
3.1.8 Observations ............................................................................ 17
3 .1.9 Answers to Discussion Questions ............................................ 17
E!.O Creating Rust: Electrolysis of Water ........................................ 18
El.l Purpose .................................................................................... 18
E 1.2 Introduction ............................................................................. 18
E 1.3 Corrosion Background ............................................................. 19
E 1.4 How This Experiment is Similar to the Process of Corrosion .... 20
El.5 What You Will Need ................................................................ 21
E 1.6 Procedure ................................................................................. 22
E I. 7 Discussion Questions ............................................................... 23
3.2 Concrete Mix Design Experiment: Experiment Number 2 ...................... 24
3 .2.1 Purpose ................................................................................... 24
3.2.2 Introduction ............................................................................. 24
3.2.3 Background ............................................................................. 25
3.2.4 Testing .................................................................................... 26
3.2.5 What You Will Need (Per Group) ............................................ 27
3.5.6 Schedule .................................................................................. 27
3.2.7 Procedure ................................................................................ 28
3.2.8 Observations ............................................................................ 28
3.2.9 Stimmary ................................................................................. 28
3.2.10 Answers To Discussion Questions ......................................... 29
E2.0 Concrete Mix Design Experiment ............................................ 30
E2.1 Purpose .................................................................................... 30
E2.2 Introduction ............................................................................. 30
E2.3 Background .............................................................................. 32

VI
E2.4 Testing ..................................................................................... 32
E2.5 What You Will Need (Per Group) ............................................ 33
E2.6 Procedure ................................................................................. 34
E2.7 Useful Conversions .................................................................. 36
E2.8 Discussion Questions ............................................................... 36
3.3 Graphing with Microsoft Excel: Experiment Number 3 .......................... 37
3.3.1 Purpose ................................................................................... 37
3.3.2 Introduction ............................................................................. 37
3.3.3 Background ............................................................................. 38
3.3.4 What You Will Need (per group) ............................................. 38
3.3.5 Schedule .................................................................................. 38
3.3.6 Procedure ................................................................................ 39
3.3.7 Summary ................................................................................. 39
J.3.8 Answer to Discussion Questions .............................................. 39
E3.0 Graphing .................................................................................. 41
E3.1 Purpose .................................................................................... 41
E3 .2 Graphing Background .............................................................. 41
E3.3 Sample Graph .......................................................................... 42
E3.4 Graphing with Microsoft Excel ................................................ 44
E3 .5 Discussion Questions ............................................................... 44
E3.6 How to Graph Using Microsoft Excel ...................................... 45
3.4 Moment ofinertia Experiment: Experiment Number 4 ........................... 49
3.4.1 Purpose ................................................................................... 49
3.4.2 Introduction ............................................................................. 49
3.4.3 Background ............................................................................. 50

vii
3.4.4 What You Will Need ............................................................... 51
3.4.5 Schedule .................................................................................. 51
3 .4. 6 Procedure ................................................................................ 51
3.4.7 Observations ............................................................................ 52
3.4.8 Summary ................................................................................. 52
3.4.8 Worksheet Solutions ................................................................ 53
E4.0 Moment ofinertia .................................................................... 57
E4.1 Purpose .................................................................................... 57
E4.2 Moment ofinertia Background ................................................ 57
E4.3 Moment ofinertia Equations .................................................... 59
E4.4 Moment ofinertia Questions .................................................... 60
3.5 Calculating End Reactions: Experiment Number 5 ................................. 64
3.5.1 Purpose ................................................................................... 64
3.5.2 Introduction ............................................................................. 64
3.5.3 Background ............................................................................. 65
3.5.4 Step-By-Step Instruction to Calculating End Reactions ............ 67
3.5 .5 What You Will Need (per group offour) ................................. 68
3.5.6 Schedule .................................................................................. 68
3.5.7 Procedure ................................................................................ 69
3.5.8 Sununary ................................................................................. 69
3.5.9 Answers to Worksheet ............................................................. 69
3.5.10 Worksheet Solution Guide ..................................................... 70
E5.0 Solving End Reactions ............................................................. 73
E5 .I Purpose .................................................................................... 73
E5 .2 Introduction ............................................................................. 73

vm
E5.3 Background .............................................................................. 74
E5 .4 Solving End Reactions ............................................................. 7 5
E5.5 Step-By-Step Instruction to Calculating End Reactions ............ 76
E5.6 What You Will Need (per group offour) .................................. 77
E5.7 Procedure ................................................................................. 77
E5.8 End Reaction Questions ........................................................... 78
3.6 Bridge Building Competition: Experiment Number 6 ............................. 81
3.6.1 Purpose ................................................................................... 81
3.6.2 Introduction ............................................................................. 81
3.6.3 Competition Rules ................................................................... 81
3.6.3.1 Bridge Dimensions .................................................... 81
3.6.3.2 Bridge Materials ....................................................... 81
3.6.3.3 Cost .......................................................................... 82
3.6.3.4 Judging ..................................................................... 83
3.6.3.5 Loading ..................................................................... 83
3.6.4 What You Will Need (per class) .............................................. 83
3.6.5 Schedule .................................................................................. 84
3.6.6 Procedure ................................................................................ 84
3.6.7 Sununary ................................................................................. 85
E6.0 Bridge Building Competition ........................................ 86
E6.1 Purpose ........................................................................ 86
E6.2 Bridge Building Background ........................................ 86
E6.2.1 Dimensions .................................................... 86
E6.2.2 Cost of Labor and Bridge Materials ................ 86
E6.2.3 Loading .......................................................... 87
IX
E6.2.4 Judging .......................................................... 87
E6.3 Procedure ..................................................................... 87
CHAPTER 4: SUMMARY AND CONCLUSION .................................................. 88
4.1 SUMMARY .......................................................................................... 88
4.2 CONCLUSION ..................................................................................... 89
REFERENCES ....................................................................................................... 90

Table
E2.1
E2.2
E2.3
5.1
E5.1
X
LIST OF TABLES Page
Unit Weight Values ................................................................................... 35
Concrete Mixture Specifications ................................................................ 35
Compressive Strength Values ..................................................................... 36
Descriptions of the Primary Support Conditions ......................................... 65
Descriptions of the Primary Support Conditions ......................................... 7 4

Table
3.1.1
El.l
3.4.1
3.4.2
E4.1
E4.2
3.5.1
E5.1
XI
LIST OF FIGURES Page
Electrolysis Diagram .................................................................................. 15
Electrolysis Diagram .................................................................................. 21
Beam Loaded at Midspan ........................................................................... 49
Effect of Beam Orientation on Moment oflnertia ...................................... 50
Beam Loaded at Midspan ........................................................................... 57
Effect of Beam Orientation on Moment oflnertia ...................................... 58
Bridge Reactions ........................................................................................ 64
Bridge Reactions ........................................................................................ 73

CHAPTER!
INTRODUCTION
1.1 GENERAL
"Enlisting the knowledge and skills of graduate students and advanced
undergraduates who are working toward science ... related degrees will be a positive
step in improving K-12 learning." Luther Williams, the National Science
Foundation's (NSF) assistant director for education and human resources, made this
statement at the unveiling of the NSF GK-12 Fellowship program in February 1999
(Herring 1999). This $7.5 million program provides graduate and undergraduate
students with the opportunity to serve as teaching fellows and academic resources in
kindergarten through grade twelve (K-12) in the fields of science, mathematics and
technology (Herring 1999). The National Science Foundation is a government
agency accountable for promoting science and engineering through programs that
invest over $3.3 billion per year in almost 20,000 research and education projects
(Introduction 1999).
The National Science Foundation recognized that students in higher education
could assist in addressing the science, mathematics, engineering and technology
(SMET) weaknesses found in the nation's K-12 schools. The problems this program
aims to resolve include (1) the absence of knowledge of science and technology fields
for K-12 students, (2) the lack of professional development opportunities for K-12
teachers, and (3) the weak links between local school districts and higher education
institutions. To address these issues, the GK-12 Fellows work directly with teachers
to:
• convey key SMET concepts;
• act as role models for future SMET professionals;
1

2
• enrich teachers' knowledge and understanding of science and
mathematics and;
• assist in science and mathematics instruction.
To accomplish these goals, approximately $7.5 million were made available
over three years to universities across the nation. Individual awards totaled $200,000
to $500,000 per year.
1.2 GK-12 AT THE UNIVERSITY OF KANSAS
The 1999-2000 school calendar marked the inaugural year for the GK-12
Program serving students and faculty at Wyandotte High School, located in Kansas
City, Kansas. Six graduate students from engineering, science, and mathematics
including Civil and Environmental Engineering, Mathematics, Chemistry, and
Biology, met with teachers to conduct lectures and laboratory experiments. The
experiments were aimed at interesting high school students in participating in the
graduate student's respective field of study.
As a Civil Engineering graduate student, the author had the opportunity to
work with chemistry and physics classes. The students in the chemistry class were
freshman and juniors, while the students in the physics class were juniors and seniors.
Since enrollment in chemistry was mandatory and the students had a wide range in
age and educational experience, an attempt was made to develop experiments and
lectures to provide variety and to keep the students engaged during the duration of the
class. The topics covered included:
• Recycled Asphalt Paving Construction (RAP);
• Normal versus Lightweight Concrete Mix Designs;
• Graphing in Microsoft Excel and;

3
• Reinforcing Steel Corrosion.
Meanwhile, because physics was an elective, the experiments and lectures were
designed to help the students develop quantitative reasoning skills and/or to consider
engineering design, while considering the effects of every engineering design based
decision. This was accomplished by studying:
• Moment ofinertia;
• Methods of Solving for End Reactions;
• Bridge Building Competition.
Throughout the one-year tenure at Wyandotte High School, the author gained
experience and learned many lessons about teaching and teachers and students at an
inner city public school. Many of the lessons were learned by trial and error.
Meanwhile, many positive relationships were developed with students and faculty
members; the relationships were made possible by taking the time to treat everyone
with great respect.
1.3 OBJECT AND SCOPE
The National Science Foundation developed the GK-12 Fellowship program to
encourage the teaching of math, science, and engineering technology (SMET) in
grades K-12. The program is based on the recognition that students in higher
education programs in SMET can contribute to the understanding of K-12 students.
In particular, SMET graduate students can serve K-12 teachers and schools as
valuable resources in the field.
This report reviews programs that influenced the development of the GK-12
Fellowship program and describes six laboratory experiments that were designed to
interest high school students, with special emphasis in the area of civil engineering, in

4
SMET. The experiments include: (1) corrosion of steel, including the electrolysis of
water; (2) concrete mix design, summarizing the applications and design of normal
weight and lightweight concrete; (3) graphing, first by hand then using Microsoft
Excel; ( 4) moment of inertia, demonstrated by hands-on experiments and a
calculation worksheet; (5) end reactions of beams, demonstrated by hands-on
experiments and a calculation worksheet; and (6) bridge building competition, with
rules and judging criteria.
The object of this report is to:
(I) Offer engineering experiments for use by future fellowship participants,
and
(2) Provide educational tools and ideas for the program.

2.1 GENERAL
CHAPTER2
SIMILAR PROJECTS
The National Science Foundation's GK-12 program placed graduate students
in classrooms to teach science and technology material to students in kindergarten
through the twelfth grade. The GK -12 program is similar to other programs found at
different universities in that graduate students are used to promote science and
technology instruction. This chapter describes three of those programs.
2.2 MONARCH WATCH
Monarch Watch is an educational outreach program that was initiated at the
University of Kansas in 1993. The program has participants, including K-12
students, teachers, and undergraduates who study the Monarch butterfly. This
ongoing project allows participants to learn about the butterfly while:
1. promoting science education in primary and secondary schools;
2. supporting conservation of Monarch butterflies; and
3. involving thousands of students and adults in a study of the Monarch's
migration.
These goals have been achieved during the rapid growth of the Monarch Watch
program, involving an increasing number of students and adults. It is estimated that,
since the program started, more than 100,000 students in thirty-nine states and three
Canadian provinces have tagged and studied over 76,000 Monarch butterflies (About
1999). Due to the large interest of students in K-12 science curriculums, the
5
6
educational experience gained from participating in this study has been extremely
valuable.
Students in the program have the opportunity to participate in a genuine
science experiment that explores the migration patterns of the Monarch butterfly. A
comprehensive kindergarten through eighth grade (K-8) science curriculum,
Monarchs in the Classroom, has been developed to lead teachers and students through
an inquiry-based study of the butterfly.
As winter approaches, the Monarchs in North America travel southward, up to
three thousand miles-much farther than any other tropical butterfly. Their migration
patterns can be easily predicted since they use the same winter roosts year after
year-often to the same trees (Migration 1999). Since the pattern can be forecasted,
students from Canada to Mexico have a high probability of producing successful
tracking data. To encourage a large number of participants, directions on how to tag
or read the tag are given on the official Monarch Watch website:
http://www.monarchwatch.org. Participants have been able to help answer the
following questions related to Monarchs moving across the continent:
(1) Do they move in specific directions or take certain pathways?
(2) How is migration influenced by the weather?
(3) Are there differences in the migration from year to year?
Due to the Monarch's natural beauty and charm, children naturally enjoy
engaging in activity with the butterfly (Migration 1999). As a result, this project has
served as a popular and successful activity to introduce students to science and have
them contribute to a real scientific study.

7
2.3 K-12 ENGINEERING OUTREACH PROGRAM
The college of engineering at the University of Wisconsin at Madison initiated
a program that benefited students, from kindergarten to the twelfth grade (K-12),
within local school districts. Engineering undergraduates visited classrooms to
familiarize the students with the major influences that professional engineers have
placed on society. While producing an interesting and challenging science and
technology environment for K-12 students, the goal of this project was to "improve
K-12 science and engineering literacy, to engage and interest school children and
their teachers towards science and technology, and to expose undergraduate students
to outreach and to its rewards." This was accomplished by making a variety of
presentations to K-12 students (Mission 1999).
Due to the vast difference in attention spans between kindergarten and twelfth
grade students, separate presentations were developed for: (1) elementary school
students, (2) middle school students, and (3) high school students. The elementary
school students were given lectures, which included a large number of experiments
and applied activities to capture their attention. Middle school students were exposed
to a variety of engineering and science-related technologies. This was accomplished
by explaining the engineering concepts behind designing certain structures, such as
sidewalks and buildings. Also, many common questions (i.e., how airplanes fly and
why the sky is blue) were answered. The high school students were encouraged to
discuss science and technology theories while also exploring career and educational
options. To optimize the effectiveness of these presentations, a general format was
specifically designed for each age group (Mission 1999).
Typically, two or three presenters visited schools within a thirty-five mile
radius of the university, making three or more consecutive presentations per day. To

8
help demonstrate that the science and technology field is open to anybody who is
interested, the teams included men, women, minorities, and international students.
The presentations usually lasted thirty to forty-five minutes, depending on the age
group.
The program was deemed successful based on the benefits to the participants.
Science teachers were familiarized with new science and technology research, while
exploring new ideas for hands-on projects and classroom discussions. The
undergraduates gained beneficial public speaking skills, while the K -12 students had
the opportunity to observe the undergraduates as role models by listening and
acknowledging the benefits of studying science and mathematics.
2.4 WISCONSIN INITIATIVE FOR SPACE EDUCATION (WISE)
The Wisconsin Initiative for Space Education (WISE) was developed at the
University of Wisconsin's Space and Engineering Science Center in response to the
need for an organized program devoted to K-12 education and public outreach.
Studies at the federal and state level have shown that teaching expertise and learning
standards for K-12 students have been lacking in the space-related physical sciences.
To alleviate these problems, the WISE program sent representatives to the local
schools (Mission 1998).
WISE members visited schools, initiating programs, such as the Mars
Exploration Curriculum, as well as several teacher seminars to spark interest in the
space science and technology field. The Mars Exploration Curriculum involved
spending four to five hours a week during the school year with fourth and fifth grade
classes exploring the concept of Mars exploration (Mission 1998). While considering
the basic environmental conditions for human survival, the students investigated and

9
discussed ideas of human exploration and habitation of Mars. Ultimately, several
presentations were given, with the intention of expanding the project to several other
schools in the immediate area. As students benefited from the opportunities provided
by the WISE program, teachers also gained by participating in the programs which
offered unique exposure into the space science and technology field.
With help from the School of Education, WISE developed proposals, which
funded two, one-week workshops. With help from WISE representatives, the
workshops supported professional development opportunities for teachers to learn
new techniques to educate students in the space-related sciences. While serving as a
resource in space science education, the programs offered by WISE successfully
initiated partnerships between undergraduate students, teachers, and space scientists,
improving the quality of math and physical science instruction.

3.0GENERAL
CHAPTER3
CLASSROOM LABORATORIES
This chapter describes civil engineering-based experiments that can be
performed in public school classrooms. Each experiment includes three basic items:
(I) a brief introduction into the background of the experiment, for the graduate
student who will conduct the class, (2) recommended methods of instruction, and (3)
a summary of the materials and procedure required for the experiment. Several
experiments include worksheets, to be used as homework problems or for classroom
discussion, which include background information relating to the experiment. In
some cases, equation worksheets and practice problems for the students are also
included. Six experiments are described below:
1. Corrosion Laboratory
• Explains the process of corrosion and how it relates to the rusting
of reinforcing steel (rebar) in concrete while becoming familiar
with chemical formulas and the electrolysis of water.
2. Concrete Mix Design Laboratory
• Demonstrates the differences and similarities between lightweight
and normal weight concrete mix designs. Students will have the
opportunity to develop their own mixture while determining the
effect of the water/cement ratio by varying the amount of water.
10

11
3. Graphing With Microsoft Excel
• Promotes an understanding of relationships between variables on a
graph and the basic techniques needed to graph values by hand
and by using Microsoft Excel
4. Moment oflnertia Experiment
• Illustrates the concept of moment of inertia. Calculation and
equation worksheets are included.
5. Calculating End Reactions
• Students should be able to successfully calculate the end reactions
of a simply supported beam subjected to point loads. Practice
problems are included.
6. Bridge Building Competition
• The students compete with each other to develop a popsicle stick
bridge. Using the methods for calculating moment of inertia and
end reactions, combined with the opportunity to make decisions
considering bridge aesthetics, strength, cost, and weight, this
project lets students operate like structural design engineers. The
graduate student and head instructor serve as the judges in the
competition.
The experiments in this chapter have been used in high school science and
mathematics classes (grades 9 - 12), enhancing student interest in civil engineering
and in the science and technology, in general.

12
3.1 CORROSION LABORATORY (2 Class Periods)
EXPERIMENT NUMBER 1
3.1.1 Purpose
Explain the process of corrosion and how it relates to the rusting of
reinforcing steel (rebar) in concrete while becoming familiar with chemical formulas
and the electrolysis of water.
3.1.2 Introduction
Throughout the world, particularly in areas where road salt is used and high
exposure to salty environments exists, corrosion of rebar in concrete annually results
in billions of dollars of repairs. The most familiar example of corrosion is the rusting
of iron, a complex chemical reaction in which the iron combines with both oxygen
and water to form hydrated iron oxide. The problem with iron, as well as many other
metals, is that the rust formed by the oxidation reaction does not firmly adhere to the
surface of the metal and flakes off easily, which causes pitting. Extensive pitting
eventually causes structural weakness and disintegration of the metal.
Corrosion of rebar occurs when chlorides from road salts· or seawater
penetrate into reinforced concrete. With water present, the chlorides serve as a
catalyst, which help transport electrons to complete the iron oxidation, or rusting,
process. Not only will corrosion weaken the metal, but rust also occupies more space
than the initial metal and leads to cracking and spalling of the concrete.

13
3.1.3 Corrosion Background
Corrosion is defined as a partial or complete wearing away, dissolving, or
softening of any substance by chemical or electrochemical reaction with its
environment (Corrosion 2001). The corrosion of iron (and reinforcing steel) occurs
as the result of an oxidation-reduction reaction. For an oxidation-reduction reaction
to begin, water and oxygen must be present. Oxidation, or the loss of electrons,
occurs at the anode producing two electrons and a ferrous ion.
Anode(+)
• Fe ;;::= 2e· +Fez+ (3.1)
Meanwhile, a reduction reaction occurs at the cathode. This reaction uses the two
electrons produced at the anode, which travel through the iron, plus oxygen and
water. As water and oxygen are reduced, or gain electrons, hydroxyl (OH") ions are
produced (Mindess, Young, and Darwin 2002).
Cathode(-)
• (3.2)
To complete the formation of ferrous hydroxide, Fe(OH)z, the hydroxyl ions migrate
back to the anode through the water.
• Fez++ 2(0H)" -c; Fe(OHi (3.3)
Lastly, the ferrous hydroxide will oxidize in the presence of oxygen and water,
creating ferric oxide (rust) at the anode (Mindess, Young, and Darwin 2002). 02, H20
• 2Fe(OH)z 2Fe(OH)J -c; Fez01 · nHzO (3.4)

14
3.1.4 How This Experiment is Similar to the Process of Corrosion
To demonstrate the process of corrosion this experiment involves the
oxidation of iron wire, which occurs during the electrolysis of water. Electrolysis is
an electrochemical process by which electrical energy is used to promote chemical
reactions that occur at electrodes. In a naturally occurring oxidation-reduction
reaction, an electric charge is created when electrons are transferred. This naturally
occurring reaction requires a large amount of time before its results can be seen with
the naked eye. Therefore, this experiment uses an external battery to increase the rate
of reaction by transferring more electrons between two electrodes. The electrodes are
inserted in a container filled with an electrolyte solution. Saltwater, a common
electrolyte, should be used to promote the exchange of electrons between ions. As a
result of electrolysis, water is split into oxygen and hydrogen. The electrode that
generates oxygen (anode) will oxidize and form iron oxide (rust) while the other
electrode (cathode) will produce hydrogen gas.
Anode(+)
• 2H20 -7 02 + 4H+ + 4e·
Cathode(-)
• 4H20 + 4e· -7 2H2 + 40H"
(3.5)
(3.6)
As the experiment continues, determining which wires serve as the cathode and the
anode is easily accomplished. The volume of hydrogen gas (H2) produced is twice
the volume of oxygen (02).
(3.7)
After the experiment continues for roughly one hour, the accelerated version
of the naturally occurring process of corrosion is witnessed at the anode. Rust will be
developed on the anode once (Fig. 3.1.1):
15
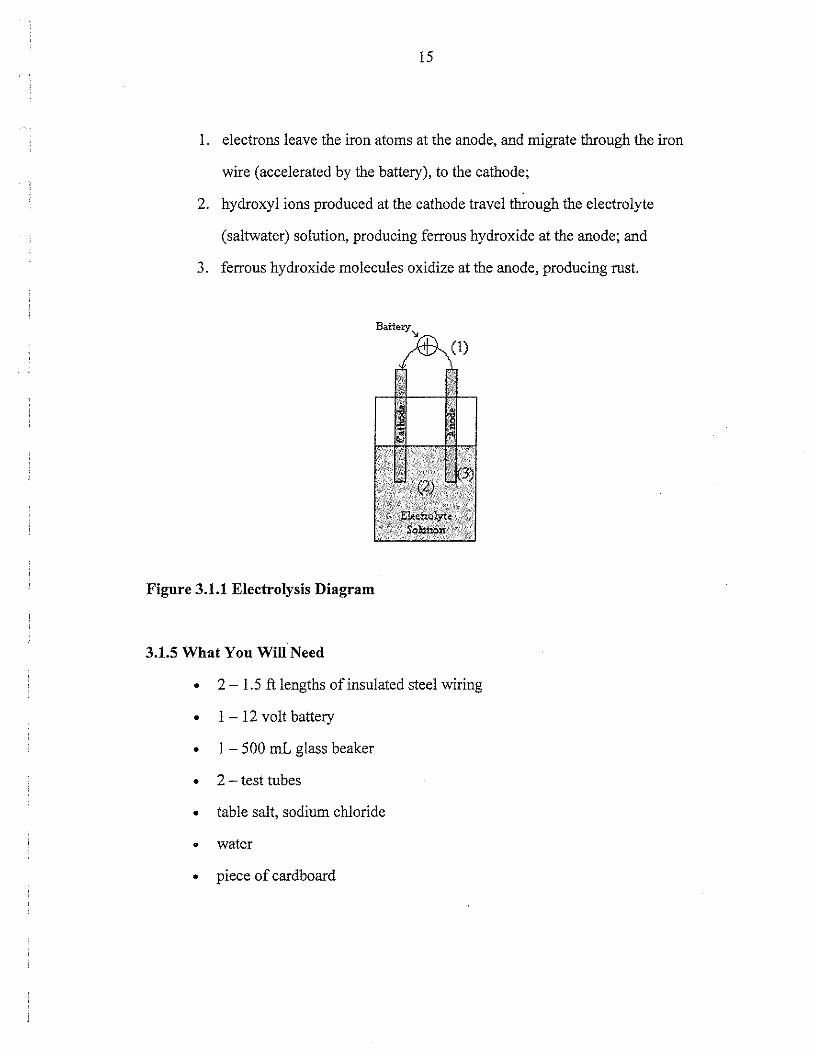
I. electrons leave the iron atoms at the anode, and migrate through the iron
wire (accelerated by the battery), to the cathode;
2. hydroxyl ions produced at the cathode travel through the electrolyte
(saltwater) solution, producing ferrous hydroxide at the anode; and
3. ferrous hydroxide molecules oxidize at the anode, producing rust.
Battety 'Jt
/~"I ~,,(1)
Figure 3.1.1 Electrolysis Diagram
3.1.5 What You Will Need
• 2 - 1.5 ft lengths of insulated steel wiring
• 1 - 12 volt battery
• 1 - 500 mL glass beaker
• 2 - test tubes
• table salt, sodium chloride
• water
• piece of cardboard

16
3.1.6 Schedule
Day 1: Introduce the process of corrosion. Afterwards, setup and begin
laboratory experiment. Students should document observations and any
changes that have occurred.
Day 2: Students should document changes and answer the discussion
questions.
3.1.7 Procedure
I. Remove two inches of insulation from each length of steel wiring.
2. Cut cardboard to fit over beaker.
3. Push the two wires into the cardboard, roughly two inches apart.
4. Dissolve two teaspoons of salt in the water.
5. Connect one wire to the positive terminal on the battery and the other wire
to the negative terminal.
6. Place the free ends of the wires into separate test tubes and insert into the
salt-water solution.

17
3.1.8 Observations
As the electricity from the battery passes through the wires and between the
electrodes, the water splits into hydrogen and oxygen, which collect as tiny bubbles
around the end of the wires. This also creates an oxidation-reduction reaction and
generates a red precipitate (iron oxide) on the positively charged electrode (anode).
3.1.9 Answers to Discussion Questions
1. Does the positive or negative wire generate hydrogen? Why?
• Negative Wire; water is reduced at the cathode (-) from the
introduction of electrons at the anode. This reaction produces
hydrogen molecules and hydroxyl ions [Eq. (3.6)].
2. What is the red precipitate found at one ofthe electrodes?
• Rust (Ferric Oxide); it is formed on the anode(+).
3. Recommend methods to separate the hydrogen and oxygen from
water at a faster pace.
• Increase the current by increasing the voltage; increase the surface area
of the wire (this works by reducing the resistance through the
electrolyte); introduce more electrolytes (salt) into the solution.
4. Recommend a method to prevent corrosion in metallic materials.
• Provide a protective coating (epoxy, paint, etc.).

18
Date:--------- Name: ________________ __
Experiment Number 1 Worksheet
El.O CREATING RUST: ELECTROLYSIS OF WATER
El.l Purpose
Explain the process of corrosion and how it relates to the rusting of
reinforcing steel (rebar) in concrete while becoming familiar with chemical formulas
and the electrolysis of water.
E1.2 Introduction
Throughout the world, particularly in areas where road salt is used and high
exposure to salty environments exists, corrosion of rebar in concrete annually results
in billions of dollars of repairs. The most familiar example of corrosion is the rusting
of iron, a complex chemical reaction in which the iron combines with both oxygen
and water to form hydrated iron oxide. The problem with iron, as well as many other
metals, is that the rust formed by the oxidation reaction does not firmly adhere to the
surface of the metal and flakes off easily, which causes pitting. Extensive pitting
eventually causes structural weakness and disintegration of the metal.
Corrosion of rebar occurs when chlorides from road salts or seawater
penetrate into reinforced concrete. With water present, the chlorides serve as a
catalyst, which help transport electrons to complete the iron oxidation, or rusting,
process. Not only will corrosion weaken the metal, but rust also occupies more space
than the initial metal and leads to cracking and spalling of the concrete.

19
E1.3 Corrosion Background
Corrosion is defined as a partial or complete wearing away, dissolving, or
softening of any substance by chemical or electrochemical reaction with its
environment (Corrosion 2001). The corrosion of iron in reinforcing steel occurs as a
result of an oxidation-reduction reaction. For an oxidation-reduction reaction to
begin, water and oxygen must be present. Oxidation, or the loss of electrons, occurs
at the anode producing two electrons and a ferrous ion.
Anode(+)
• Fe ;:::0 2e· + Fe2+ (El.l)
Meanwhile, a reduction reaction occurs at the cathode. This reaction uses the two
electrons produced at the anode, which travel through the iron plus oxygen and water.
As water and oxygen are reduced, or gain electrons, hydroxyl (OH") ions are
produced (Mindess, Young, and Darwin 2002).
Cathode(-)
• (El.2)
To complete the formation of ferrous hydroxide, Fe(OH)2, the hydroxyl ions migrate
back to the anode through the water.
• Fe2+ + 2(0Hr -7 Fe(OHi (El.3)
Lastly, the ferrous hydroxide will oxidize in the presence of oxygen and water,
creating ferric oxide (rust) at the anode (Mindess, Young, and Darwin 2002).
• 2Fe(OH)z (E1.4)

20
E1.4 How This Experiment is Similar to the Process of Corrosion
To demonstrate the process of corrosion this experiment involves the
oxidation of iron wire, which occurs during the electrolysis of water. Electrolysis is
an electrochemical process by which electrical energy is used to promote chemical
reactions that occur at electrodes. In a naturally occurring oxidation-reduction
reaction, an electric charge is created when electrons are transferred. This naturally
occurring reaction requires a large amount of time before its results can be seen with
the naked eye. Therefore, this experiment uses an external battery to increase the rate
of reaction by transferring more electrons between two electrodes. The electrodes are
inserted in a container filled with an electrolyte solution. Saltwater, a common
electrolyte, should be used to promote the exchange of electrons between ions. As a
result of electrolysis, water is split into oxygen and hydrogen. The electrode that
generates oxygen (anode) will oxidize and form iron oxide (rust) while the other
electrode (cathode) will produce hydrogen gas.
Anode(+)
• ZH20 --? 02 + 4H+ + 4e
Cathode (-)
• 4H20 + 4e---? ZH2 + 40H-
(E1.5)
(El.6)
As the experiment continues, determining which wires serve as the cathode and the
anode is easily accomplished. The volume of hydrogen gas (H2) produced is twice
the volume of oxygen (02).
• ZH20 --? 2Hz + 02 (E1.7)
After the experiment continues for roughly one hour, the accelerated version
of the naturally occurring process of corrosion is witnessed at the anode. Rust will be
developed on the anode once (Fig. El.l):

21
1. electrons leave the iron atoms at the anode, and migrate through the iron
wire (accelerated by the battery), to the cathode;
2. hydroxyl ions produced at the cathode travel through the electrolyte
(saltwater) solution, producing ferrous hydroxide at the anode; and
3. ferrous hydroxide molecules oxidize at the anode, producing rust.
Figure El.l Electrolysis Diagram
El.S What You Will Need
• 2 - 1.5 ft lengths of insulated steel wiring
• 1 - 12 volt battery
• 1 - 500 mL glass beaker
• 2 - test tubes
• table salt, sodium chloride
• water
• piece of cardboard
22
E1.6 Procedure
I. Remove two inches of insulation from each length of steel wiring.
2. Cut cardboard to fit over beaker.
3. Push the two wires into the cardboard, roughly two inches apart.
4. Dissolve two teaspoons of salt in the water.
5. Connect one wire to the positive terminal on the battery and the other wire
to the negative terminal.
6. Place the free ends of the wires into separate test tubes and insert into the
salt-water solution.

23
El. 7 Discussion Questions
1. Does the positive or negative wire generate hydrogen? Why?
2. What is the red precipitate found at one of the electrodes?
3. Recommend methods to separate the hydrogen and oxygen from water at a
faster pace.
!) ______________________________________ __
2) ____________________________________ ___
4. Recommend a method to prevent corrosion in metallic materials.

24
3.2 CONCRETE MIX DESIGN EXPERIMENT (2 Class Periods)
EXPERIMENT NUMBER 2
3.2.1 Purpose
To demonstrate the differences and similarities between lightweight and
normal weight concrete mix designs. Students will have the opportunity to develop a
unique mixture while determining the effects of changing the water/cement ratio.
3.2.2 Introduction
Considered the most widely used construction material in the world, concrete
is a heterogeneous mixture used in many different applications. Concrete consists of
portland cement, water, fine and coarse aggregates, and a small amount of air. It can
be molded into virtually any form or shape and given a variety of surface textures and
colors. Concrete is used to construct a wide variety of structures including sidewalks,
highways and streets, bridges, dams, large buildings, airports, silos and farm
buildings, homes, and even barges and ships. Evidence of the durability of concrete
is provided by the existence of structures fabricated by the Romans more than 2000
years ago, which are still standing (Concrete 2001).
Basic concrete mixes are composed of two major items-cement paste and
aggregate. Cement paste consists of portland cement, water, and air voids, either
intentionally placed or existing as naturally entrapped bubbles. When portland
cement is mixed with water, the compounds in cement chemically react with water to
form a cementing substance. In properly mixed concrete, each particle of aggregate is
completely surrounded by cement paste and fills the spaces between the particles. As
the cement paste cures, it hardens and binds the aggregates into a solid mixture. The

25
aggregate is divided into two different categories: fine and coarse. Fine aggregate
(sand) is generally smaller than 4.75 mm (3/16 inches) while coarse aggregate (gravel
or crushed stone) is larger.
Depending on the type of application, concrete can be mixed in two forms:
normal weight and lightweight. The primary difference between the two types of
concrete is the type of aggregate. Normal weight concrete includes sand and gravel
in its mixtures whereas lightweight concrete includes lightweight aggregate (e.g.,
expanded shale). Normal weight concrete is normally used as a structural material
whereas lightweight concrete is used in aerated concrete blocks and panels, sound and
thermal insulation, and in structures with lower compressive strength (although high
strength lightweight concrete can be made).
3.2.3 Background
This experiment requires dividing the class into multiple groups, and allowing
each group to create a lightweight and a normal weight concrete mixture. Each group
is given the same quantity of aggregate and cement, varying the water/cement ratio
(between 0.35 and 0.5). Be sure that each group has been assigned a different
water/cement ratio. This is done to demonstrate that altering the water/cement ratio
will have a significant impact on the final strength (higher water/cement ratio yields
lower strength). The concrete should be tested after the mixture has cured enough to
develop strength (5 days). Refer to Section 3.2.4 for a summary of the testing
procedure.
Once the specimens have been made, one will find that the lightweight sample
actually floats on water! This occurs because the density of the lightweight concrete
is less than that of water. Once both normal and lightweight samples have been tested

26
for compressive strength, the class can discuss the effect of the water/cement ratio on
strength. Afterwards, the data from the laboratory can be used in Lab Number Three:
Graphing with Microsoft Excel.
3.2.4 Testing
After concrete properly cures for twenty-eight days, most of the strength gain
that can occur will have occurred. Following the twenty-eight day curing period,
concrete will continue to hydrate and get stronger, provided sufficient moisture is
available. In fact, the concrete in the center of Hoover Dam is expected to still be
curing, slowly gaining in strength! Due to the early strength development in
concrete, compressive tests are typically performed after seven and twenty-eight days.
For example, at a construction site, a seven-day test would give the engineer
an opportunity to determine if the strength of the concrete .is developing as expected.
The seven-day test is extremely useful because it indicates whether the concrete will
meet the design strength. The twenty-eight day test will prove to the engineer if the
concrete has reached the design strength. Compressive tests are rarely performed
after twenty-eight days if the design strength has been reached.
The specimens in this laboratory should be tested, using a certified concrete
compression machine, no earlier than five days after the start of curing. The test will
determine the maximum force each sample can support. Students can use the data to
observe the effects on strength by changing the water/cement ratio and using
lightweight and normal weight aggregates.

27
3.2.5 What You Will Need (Per Group)
• 1 - empty 5 gallon bucket
• 2 - thin plastic cups (volume of each cup should be approximately 1 pint z
30.0 cm3)
• 1 mixing spoon
• 1 weighing scale
• Normal Weight Mixture
- 450 grams of sand
500 grams of 1/4-inch gravel (normal weight aggregate)
- 350 grams of Portland Cement
• Lightweight Mixture
3.5.6 Schedule
200 grams of perlite (lightweight aggregate)
460 grams of Portland Cement
Day 1: Summarize the characteristics of lightweight and normal weight
concrete. Afterwards, students should be divided into groups and develop the
two concrete mixtures.
Day 2- 5: Concrete should cure in a water bath.
Day 6: Test the concrete samples for compressive strength.
Day 7: Discuss the test results with the students and summarize the effect of
changing the water/cement ratio. Give the students an opportunity to answer
the discussion questions provided in this write-up.

28
3.2. 7 Procedure
1. Assign each group a different water/cement ratio (between 0.35 and 0.5)
2. Record the weight and volume of the thin plastic cup.
3. Calculate the mass of water needed.
l w I c ratio) mass cement= mass water
4. Mix water and cement in the bucket until a paste is formed.
5. While mixing, slowly add all of the measured normal weight aggregate
(sand and gravel).
6. Completely fill the empty thin plastic cups with the concrete and smooth
the top, to give a surface that is even along the lip of the cup.
7. Weigh the thin plastic cup filled with the final mixture.
8. Rinse the bucket.
9. Fill out the laboratory worksheet.
10. Repeat Steps 2-8 and add lightweight aggregate (perlite) instead of normal
weight aggregate in Step 5.
3.2.8 Observations
Both concrete mixes will begin to set and harden shortly after adding all of the
ingredients. The lightweight concrete will be considerably lighter than the normal
weight concrete.
3.2.9 Summary
Once the concrete cures for five days, compressive tests can be performed.
Use the compressive strength data to explain the relationship between the
water/cement ratio and the strength of the normal weight and lightweight mixtures.
29
3.2.10 Answers To Discussion Questions
1. Does the lightweight concrete float in water? Why?
• The lightweight concrete floats because its density is less than the
density of water.
2. What effect does the water/cement ratio have on the final strength of
concrete?
• The strength of the concrete decreases as the water/cement ratio
mcreases.
3. Why is the lightweight concrete weaker than the normal weight
concrete?
• Since the water/cement ratio was the same, the major factor in the
concrete strength was the aggregate. The aggregate within the
lightweight concrete (perlite) is weaker than the normal weight
aggregate (gravel).

30
Date:---------- Name: ____________ __
Experiment Number 2 Worksheet
E2.0 CONCRETE MIX DESIGN EXPERIMENT
E2.1 Purpose
To demonstrate the differences and similarities between lightweight and
normal weight concrete mix designs. Students will have the opportunity to develop a
unique mixture while determining the effects of changing the water/cement ratio.
E2.2 Introduction
Considered the most widely used construction material in the world, concrete
is a heterogeneous mixture used in many different applications. Concrete consists of
portland cement, water, fine and coarse aggregates, and a small amount of air. It can
be molded into virtually any form or shape and given a variety of surface textures and
colors. Concrete is used to construct a wide variety of structures including sidewalks,
highways and streets, bridges, dams, large buildings, airports, silos and farm
buildings, homes, and even barges and ships. Evidence of the durability of concrete
is provided by the existence of structures fabricated by the Romans more than 2000
years ago, which are still standing (Concrete 2001).
Basic concrete mixes are composed of two major items--cement paste and
aggregate. Cement paste consists of portland cement, water, and air voids, either
intentionally placed or existing as naturally entrapped bubbles. When portland
cement is mixed with water, the compounds in cement chemically react with water to
form a cementing substance. In properly mixed concrete, each particle of aggregate is
31
completely surrounded by cement paste and fills the spaces between the particles. As
the cement paste cures, it hardens and binds the aggregates into a solid mixture. The
aggregate is divided into two different categories: fine and coarse. Fine aggregate
(sand) is generally smaller than 4.75 mm (3/16 inches) while coarse aggregate (gravel
or crushed stone) is larger.
Depending on the type of application, concrete can be mixed in two forms:
normal weight and lightweight. The primary difference between the two types of
concrete is the type of aggregate. Normal weight concrete includes sand and gravel
in its mixtures whereas lightweight concrete includes lightweight aggregate (e.g.,
expanded shale). Normal weight concrete is normally used as a structural material
whereas lightweight concrete is used in aerated concrete blocks and panels, sound and
thermal insulation, and in structures with lower compressive strength (although high
strength lightweight concrete can be made).
Depending on the type of application concrete exists in two forms: normal
weight and lightweight.
1. Normal Weight Concrete
• approximate mass: 2.32 g/cm3 (145 lb/ft3)
• uses normal weight aggregate (e.g., gravel and sand)
2. Lightweight Concrete
• approximate mass: 1.68 g/cm3 (1 05 lb/ft3)
• uses light-weight aggregate (e.g., expanded shale and perlite)
• will float in water
Normal weight concrete is normally used as a structural material whereas lightweight
concrete is used in aerated concrete blocks and panels, sound and thermal insulation,
and in structures with low compressive strength.

32
E2.3 Background
This experiment requires dividing the class into multiple groups, and allowing
each group to create a lightweight and a normal weight concrete mixture. Each group
will be given the same quantity of aggregate and cement, varying the water/cement
ratio (between 0.35 and 0.5). Make sure that your group has been assigned a different
water/cement ratio than the others. This is done to demonstrate that altering the
water/cement ratio will have a significant impact on the final strength (higher
water/cement ratio yields lower strength). The concrete should be tested after the
mixture has cured enough to develop strength (5 days). Refer to Section E2.4 for a
summary of the testing procedure.
Once the specimens have been made, one will find that the lightweight sample
actually floats on water! This occurs because the density of the lightweight concrete
is less than that of water. Once both normal and lightweight samples have been tested
for compressive strength, the class can discuss the effect of the water/cement ratio on
strength. Afterwards, the data from the laboratory can be used in Lab Number Three:
Graphing with Microsoft Excel.
E2.4 Testing
After concrete properly cures for twenty-eight days, most of the strength gain
that can occur will have occurred. Following the twenty-eight day curing period,
concrete will continue to hydrate and get stronger, provided sufficient moisture is
available. In fact, the concrete in the center of Hoover Dam is expected to still be
curing, slowly gaining in strength! Due to the early strength development in
concrete, compressive tests are typically performed after seven and twenty-eight days.
33
For example, at a construction site, a seven-day test would give the engineer
an opportunity to determine if the strength of the concrete is developing as expected.
The seven-day test is extremely useful because it indicates whether the concrete will
meet the design strength. The twenty-eight day test will prove to the engineer if the
concrete has reached the design strength. Compressive tests are rarely performed
after twenty-eight days if the design strength has been reached.
The specimens in this laboratory should be tested, using a certified concrete
compression machine, no earlier than five days after the start of curing. The test will
determine the maximum force each sample can support. Students can use the data to
observe the effects on strength by changing the water/cement ratio and using
lightweight and normal weight aggregates.
E2.5 What You Will Need (Per Group)
• 1 - empty 5 gallon bucket
• 2 -thin plastic cups (volume of each cup should be approximately 1 pint~
30.0 cm3)
• 1 mixing spoon
• 1 weighing scale
• Normal Weight Mixture
- 450 grams of sand
- 500 grams of 1/4-inch gravel (normal weight aggregate)
- 350 grams of Portland Cement
• Lightweight Mixture
- 200 grams of perlite (lightweight aggregate)
460 grams of Portland Cement

34
E2.6 Procedure
1. Ask for your assigned water/cement ratio (between 0.35 and 0.5)
2. Record the weight and volume of the thin plastic cup.
3. Calculate the mass of water needed.
(w I c ratio) mass cement = mass water
4. Mix water and cement in the bucket until a paste is formed.
5. While mixing, slowly add all of the measured normal weight aggregate
(sand and gravel).
6. Completely fill the empty thin plastic cups with the concrete and smooth
the top, to give a surface that is even along the lip of the cup.
7. Weigh the thin plastic cup filled with the final mixture.
8. Rinse the bucket.
9. Fill out the laboratory worksheet.
10. Repeat Steps 2-8 and add lightweight aggregate (perlite) instead of normal
weight aggregate in Step 5.

35
Table E2.1 Unit Weight Values
Volume of Cup (cm3)'
Unit Wei¥ht (g/cm3) '
Normal Weight Concrete
Lightweight Concrete
Table E2.2 Concrete Mixture Specifications
Wt. of Wt. of Wt. of w/c Wt. of Wt.of Wt. of Cup Cement Water Ratio Sand Rocks Filled
Cup
~.!:: pounds § .2!> 0 ., ;z;~ grams
•.E pounds ;Eibll bll·-·- ., ....:<~ grams
3 {Mass of Filled Cup (g))- {Mass of Cup (g))
Vol. of Cup (em ) =..:_ _ _:_ __ _:._::.._::....:.__: __ ::.._....::__.c....:.
l_f_ em 3
(E2.1)
Unzt Wt. -- = -"--_::. ___ _.:.......::::~--'--:--.::..__::._::::.:...::. . ( g ) (Mass of Filled Cup (g))- (Mass of Cup (g))
em3 Volume of Cup (em 3)
(E2.2)
'The volume of the cup can be found using Eq. (E2.I), which considers the density, or unit weight of water, I g/cm3 (62.4 lb/ft'), and the mass of the plastic cup--empty and filled with water. " The density, or unit weight, of concrete can be found using Eq. (E2.2).

36
Table E2.3 Compressive Strength Values
Pressure (lbs/in2)
Maximum Force (N)
Maximum Weight (lbs)
Lightweight Concrete
Normal Weight Concrete L_ __________ ~ ____________ L_ ________ _j
E2.7 Useful Conversions
•
•
•
1 pound= 453.6 grams
1 fe = 1728 cm3
m N=kg·9.81 s2
E2.8 Discussion Questions
1. Does the lightweight concrete float in water? Why?
2. What effect does the water/cement ratio have on the fmal strength of
concrete?
3. Why is the lightweight concrete weaker than the normal weight concrete?

37
3.3 GRAPHING WITH MICROSOFT EXCEL (2 Class Periods)
EXPERIMENT NUMBER 3
3.3.1 Purpose
To understand relationships between variables on a graph and to comprehend
the basic techniques needed to graph values by hand and by using Microsoft Excel.
3.3.2 Introduction
A graph can be defined as a diagram that illustrates relationships between two
variables. Graphs provide a means to display numerical information so that it is
possible to see patterns or trends in the relationships between variables. The variables
can be classified as being either dependant or independent. The dependent variable
will change when influenced by the independent variable, whereas the independent
variable is not affected by the dependent variable. If considering a tire factory, a
graph could be plotted using the number of tires produced as a reflection of the
number of factory workers. In this graph, the number of factory workers would be
the independent variable because tire production will not alter the number of workers.
Meanwhile, the dependent variable, or the number of tires produced, would depend
on the number of people working in the factory. Once these relationships have been
established, it is very important to label the graph correctly to avoid confusion.
When labeling the axes on a graph, the independent variable is plotted on the
x-axis (horizontal), while the dependent variable is plotted on the y-axis (vertical).
When writing the title for a graph, the variable that is plotted on they-axis (dependant
variable) is usually listed first, while the variable that is plotted on the x-axis
(independent variable) is listed second.
38
3.3.3 Background
The class should be equally divided into as many groups as there are
computers. Every person will be given a copy of the attached laboratory worksheet
and will develop a graph using the given data. The data will illustrate that as the
water/cement ratio in concrete increases, the strength of the concrete decreases. Once
every student understands the relationship displayed on the graph, the students will
replot the graph using Microsoft Excel.
A guide is provided along with the laboratory worksheets to assist while
learning to graph with Microsoft Excel. The guide offers pictures with written
descriptions for each step needed to correctly plot and label a graph.
3.3.4 What You Will Need (per group)
• I - straight edge
• 1 - computer with Microsoft Excel
3.3.5 Schedule
Day 1: Define the purpose of a graph and summarize the purpose of
dependent and independent variables. Try graphing without the assistance of
a computer.
Day 2: Graph with Microsoft Excel.
39
3.3.6 Procedure
1. By hand, plot a graph based on the values of the variables listed on the
laboratory worksheet.
2. IdentifY the relationship.
3. Plot the same graph using Microsoft Excel.
4. Explore the program and have some fun!
3.3.7 Summary
Both graphs should demonstrate that concrete strength increases as the
water/cement ratio decreases. After developing the graphs, it is apparent that an
inverse relationship exists between the two variables.
3.3.8 Answer to Discussion Questions
1. Should the first or second variable in the graph title be placed on the
x-axis?
• The second variable in the graph title is placed on the x-axis
2. If the water/cement ratio in concrete is increased, what happens to the
strength of the concrete?
• The strength of the concrete will decrease if the water/cement ratio is
increased.
3. What window will the Chart Wizard button bring up when pressed?
• When the Chart Wizard button is pressed, a window will appear
requesting the user to choose a chart type.
40
4. What other kinds of graphs can be created in Microsoft Excel?
• Other kinds of graphs Microsoft Excel can create can be viewed in the
Chart Type window-after the Chart Wizard button has been pressed
(i.e., Column, Bar, Line, Pie, Area, Doughnut, and Radar graphs).

41
Date: __________________ __ Name: ________________________ __
Experiment Number 3 Worksheet
E3.0 Graphing
E3.1 Purpose
To understand relationships between variables on a graph and the basic
techniques needed to graph values by hand and by using Microsoft Excel.
E3.2 Graphing Background
A graph can be defined as a diagram that illustrates relationships between two
variables. Graphs provide a means to display numerical information so that it is
possible to see patterns or trends in the relationships between variables. The variables
can be classified as being either dependant or independent. The dependent variable
will change when influenced by the independent variable, whereas the independent
variable is not affected by the dependent variable. If considering a tire factory, a
graph could be plotted using the number of tires produced as a reflection of the
number of factory workers. In this graph, the number of factory workers would be
the independent variable because tire production will not alter the number of workers.
Meanwhile, the dependent variable, or the number of tires produced, would depend
on the number of people working in the factory. Once these relationships have been
established, it is very important to label the graph correctly to avoid confusion.
When labeling the axes on a graph, the independent variable is plotted on the
x-axis (horizontal), while the dependent variable is plotted on the y-axis (vertical).
When writing the title for a graph, the variable that is plotted on they-axis (dependant

42
variable) is usually listed first, while the variable that is plotted on the x-axis
(independent variable) is listed second. For example, in the following case,
• Number of Tires Produced :=} y-axis (dependent variable)
• Number of Factory Workers :=} x-axis (independent variable)
the title of the graph would be "The Number of Tires Produced vs. The Number
Factory Workers":
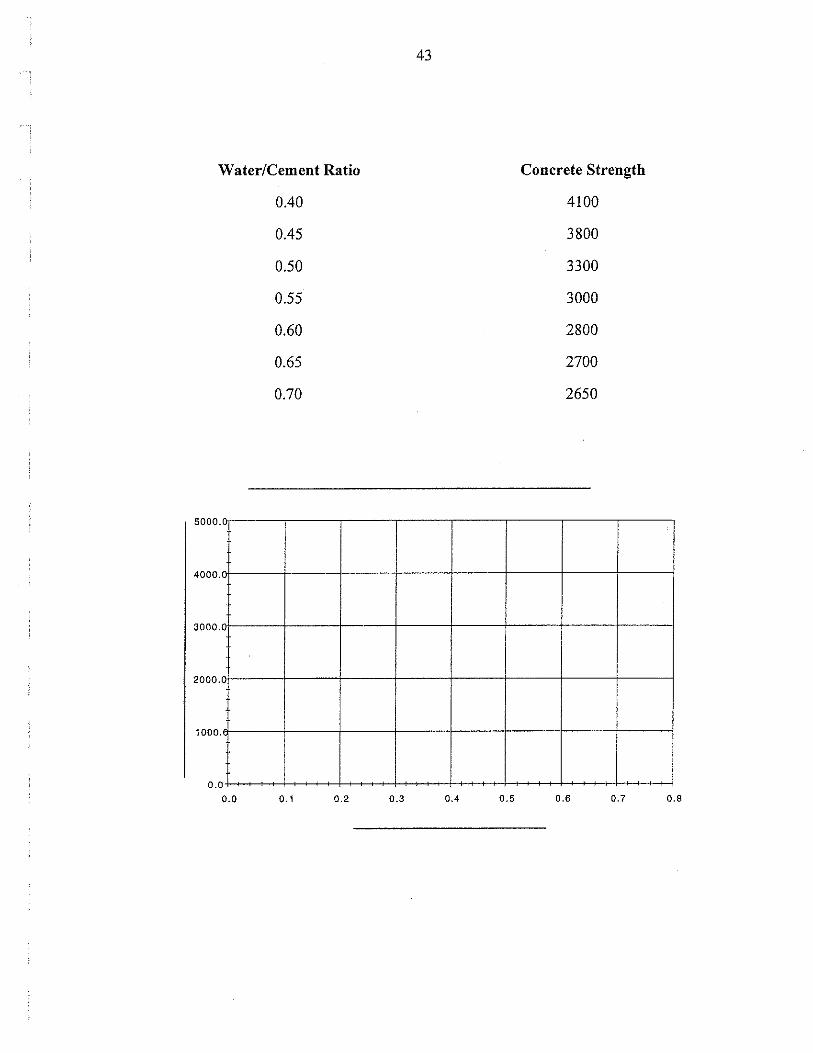
E3.3 Sample Graph
On the next page, plot a graph using the provided water/cement ratio and
concrete strength values (Scientific 2000).
43
Water/Cement Ratio Concrete Strength
0.40 4100
0.45 3800
0.50 3300
0.55 3000
0.60 2800
0.65 2700
0.70 2650
sooo.o,---,-----,---,----,----,-----,----,---,
4ooo.ol---+---+--+---+----+----+---+-----l
3ooo.ot---+--+-·-+---+---+---+---+---l
2000.of----1----t----t----+---+---+---+---l
10oo+---4---+--+--+--+--+---+-----l
o. o +--<-~~+-+-+-<-+---H-+-<--+---H-+-~+-+-+-~-1-~-+-+-+--<-+--+--->-+--+-+~e--i 0.0 0.1 0.2 0.3 0.4 0.5 0.6 0.7 0.8
44
E3.4 Graphing with Microsoft Excel
To create a graph using Microsoft Excel, please use the instruction guide on
the following page.
E3.5 Discussion Questions
1. Which variable in the title should be placed on the x-axis?
2. If the water/cement ratio in concrete is increased, what happens to the
strength of the concrete?
3. What window will the Chart Wizard button bring up when pressed?
4. What other kinds of graphs can be created in Microsoft Excel?

45
E3.6 How to Graph Using Microsoft Excel
1. Enter data to be graphed in two columns.
2. Highlight the data in both columns.

46
3. Click on the "Chart Wizard" button.
4. Select X-Y Scatter Plot on menu and click "Next."

47
5. Compare the chart below with the one on your screen. If they look similar, click
"Next."
6. Fill in the chart title and titles of the x andy-axes and click, "Next."

48
7. Click on, "Finish."
8. Graph should look like this (with correct titles):
4500
4000 3500
3000
2500 2000 1500
1000 500
0 0 0.2 0.4
1-+- Series11
0.6 0.8
--~_,,_,,,_ ,, __ .,,. __ _ .

49
3.4 MOMENT OF INERTIA EXPERIMENT (2 Class Periods)
EXPERIMENT NUMBER 4
3.4.1 Purpose
This experiment illustrates the concept of moment of inertia. This laboratory
should be completed, along with an introduction to bending moment (Experiment
Number Five), to prepare the students for the bridge building competition
(Experiment Number Six).
3.4.2 Introduction
Moment of inertia represents the ability of an object to resist bending about an
axis. This concept is best demonstrated by examining a 2x4 that spans between two
supports (Fig 3.4.1), with a load placed at midspan.
Load
.. J .. ·····~·~
Figure 3.4.1 Beam Loaded at Midspan
To limit bending deflection, the most efficient way to place the 2x4 would be
on edge so the load is parallel to the wider portion of the cross-section (Fig. 3.2a).
Under this condition, the compression and tension forces are largest at the top and
bottom of the beam. Therefore, parallel to the load, if more of the object's mass is
placed farther from the neutral axis, the harder it is to bend the 2x4 (Measurement
1998). The quantitative method for measuring resistance to bending is known as
50
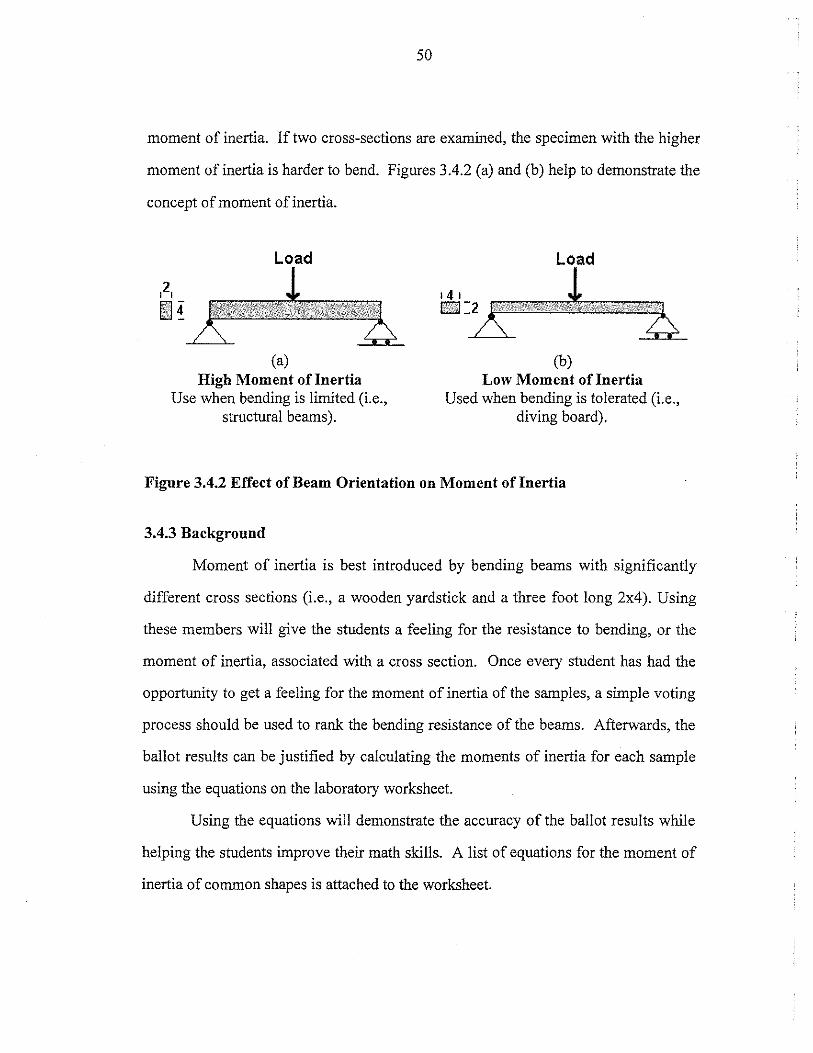
moment of inertia. If two cross-sections are examined, the specimen with the higher
moment of inertia is harder to bend. Figures 3.4.2 (a) and (b) help to demonstrate the
concept of moment of inertia.
Load
,2, !EIE
(a) High Moment oflnertia
Use when bending is limited (i.e., structural beams).
(b) Low Moment oflnertia
Used when bending is tolerated (i.e., diving board).
Figure 3.4.2 Effect of Beam Orientation on Moment oflnertia
3.4.3 Background
Moment of inertia is best introduced by bending beams with significantly
different cross sections (i.e., a wooden yardstick and a three foot long 2x4). Using
these members will give the students a feeling for the resistance to bending, or the
moment of inertia, associated with a cross section. Once every student has had the
opportunity to get a feeling for the moment of inertia of the samples, a simple voting
process should be used to rank the bending resistance of the beams. Afterwards, the
ballot results can be justified by calculating the moments of inertia for each sample
using the equations on the laboratory worksheet.
Using the equations will demonstrate the accuracy of the ballot results while
helping the students improve their math skills. A list of equations for the moment of
inertia of common shapes is attached to the worksheet.

51
3.4.4 What You Will Need
• 1 -moment of inertia equation sheet (per student)
• 1 - yardstick
• 1 -three foot long 2x4
3.4.5 Schedule
Day 1: Introduce moment of inertia while letting the students try bending
objects with different cross-sections. Introduce moment of inertia equations
and practice calculating bending resistance for different common cross
sections.
Day 2: Review the problems on the moment of inertia worksheet
3.4.6 Procedure
(Day One)
1. Let the students experiment with the two "beams."
2. Have the students vote on the cross section that is the hardest and easiest
to bend.
3. Introduce the moment of inertia equations and have the students calculate
the moments of inertia after measuring the dimensions of the yardstick and
2x4.
4. Compare the calculated results with the rankings obtained earlier by the
students. Were the assumptions about the moments of inertia correct?
Justify why their assumptions were correct or incorrect and allow the

52
students to retest their theories. Afterwards, allow the students to solve
the worksheet problems.
(Day Two)
5. Review worksheet solutions with students.
3.4. 7 Observations
Students should become familiar with the concept of moment of inertia.
3.4.8 Summary
Students should be able to grasp the meaning of moment of inertia and know
which shapes will have the most resistance to bending. This experiment should also
help students recognize that members deeper in the direction parallel to the load will
be able to provide more resistance to bending. This concept should be reemphasized
during the design process of the bridge building competition (Experiment Number
Six).

53
3.4.8 Worksheet Solutions
1) Guess if bending about the x-axis or y-axis produces the greater resistance. Then,
calculate the moment of inertia for each axis to see if your assumption is correct.
x-axis _y-axis
10 em
Scm
** Bending about they-axis will provide more resistance because the shape is
deeper in that direction.
I =-1
bh 3
X 12
4 Ix = 104.17 em
I =]_bh 3
y 12
4 IY = 416.67 em

54
2) Calculate the moment of inertia for each axis. Will there be a difference between
the axes?
**The inertia values will not be different, due to the symmetrical geometry.
Diameter= 20 em
1 4 I =I =-n: r
X y 4
4 Ix = IY = 7853.98 em
Please STOP Here Until Evervone has Caught Up

55
3) Calculate the moment of inertia for this shape.
Diameter = 20 em Thickness = 2 em
J x = J y = J solid circle - ]inner circle
4 4 Ix =ly =7853.98 em -3216.99 em
4 Ix = IY = 4636.99 em

56
4) Please guess and place a checkmark on which shape (#1 or #2) possesses a greater
resistance (higher moment of inertia) to bending. Then calculate the moment of
inertia for each shape.
#1
14 em
Diameter= 20 em
#1 __ #2
#2
20 em
Diameter = 14 em
** Shape #2 will encounter more resistance because the shape is deeper in the axis
parallel to the load.
#1 #2
• Jx = Jy =/solid circle- /inner square • Jx = J y =/solid square -]inner circle
•
•
I =I =2_tr·(10 em) 4-
x y 4
~(14 em)(14 cm)3
12
I =I = 7853.98 em4-
X y
3201.33 em4
Ix = IY = 4652.65 em4
•
0
1 Ix = IY = -(20 em)(20 em) 3
-12
1 -n·(7 em) 4
4
Ix = IY = 13333.33 em4-
7853.90 em 4
Ix = IY = 5479.35 em4

57
Date:--------- Name: ------------Experiment Number 4 Worksheet
E4.0 Moment oflnertia
E4.1 Purpose
This experiment illustrates the concept of moment of inertia. This laboratory
should be completed, along with an introduction to bending moment (Experiment
Number Five), to prepare the students for the bridge building competition
(Experiment Number Six).
E4.2 Moment oflnertia Background
Moment of inertia represents the ability of an object to resist bending about an
axis. This concept is best demonstrated by examining a 2x4 that spans between two
supports (Fig E4.1 ), with a load placed at midspan.
Load
J H·········~
Figure E4.1 Beam Loaded at Midspan
To limit bending deflection, the most efficient way to place the 2x4 would be
on edge so the load is parallel to the wider portion of the cross-section (Fig. E4.2a).
Under this condition, the compression and tension forces are largest at the top and
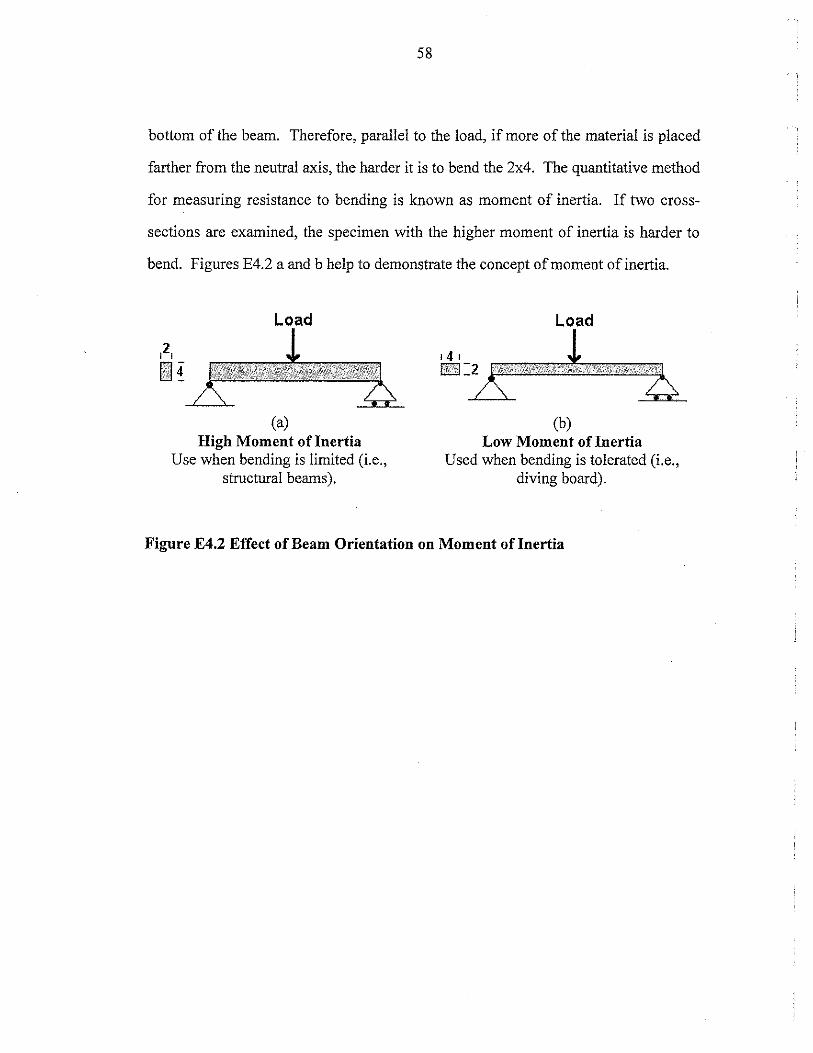
58
bottom of the beam. Therefore, parallel to the load, if more of the material is placed
farther from the neutral axis, the harder it is to bend the 2x4. The quantitative method
for measuring resistance to bending is known as moment of inertia. If two cross-
sections are examined, the specimen with the higher moment of inertia is harder to
bend. Figures E4.2 a and b help to demonstrate the concept of moment of inertia.
,2, I}]~
(a) High Moment oflnertia
Use when bending is limited (i.e., structural beams).
(b) Low Moment oflnertia
Used when bending is tolerated (i.e., diving board).
Figure E4.2 Effect of Beam Orientation on Moment oflnertia

E4.3 Moment oflnertia Equations
h
Circle
I 4 I =I =-JC ·r
X y 4
Triangle
b
I =-1
b·h3
X 36 I =-
1 h·b3
y 36
59
Square/Rectangle
h
b
Special Condition
H
B
Ix =(outer reef.) - (inner rect.)
I = (.!_B · H3 J- (.!_b · h3 J X 12 12
(solution for x axis; for y-axis, just switch variables)
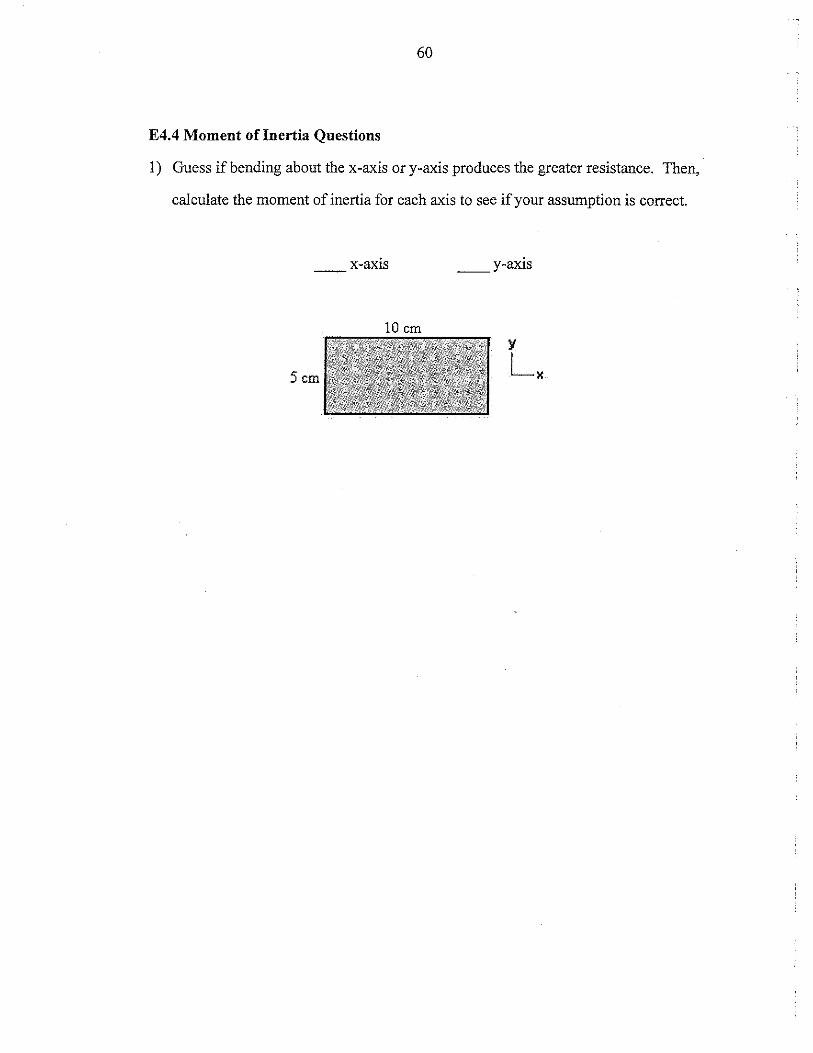
60
E4.4 Moment oflnertia Questions
1) Guess if bending about the x-axis or y-axis produces the greater resistance. Then,
calculate the moment of inertia for each axis to see if your assumption is correct.
x-axis __ y-aXJs
Scm

61
2) Calculate the moment of inertia for each axis. Will there be a difference between
the axes?
Diameter= 20 em
Please STOP Here Until Everyone has Caught Up

62
3) Calculate the moment of inertia for this shape.
Diameter = 20 em Thickness = 2 em
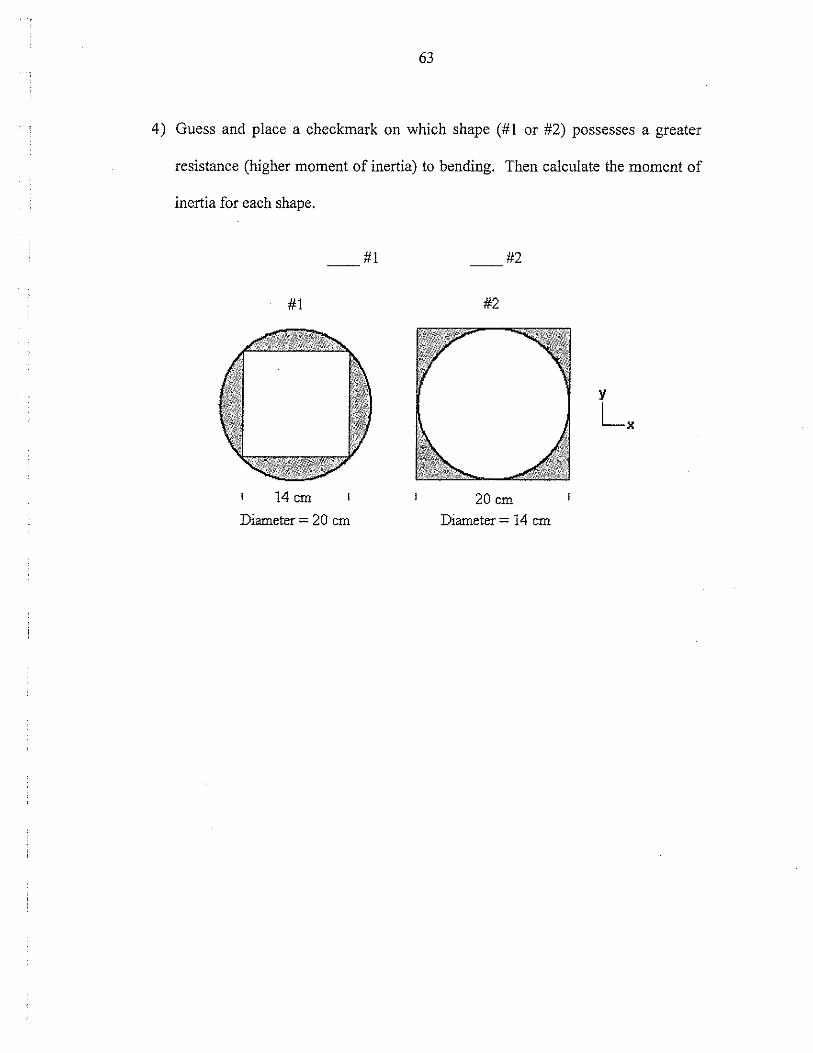
63
4) Guess and place a checkmark on which shape (#! or #2) possesses a greater
resistance (higher moment of inertia) to bending. Then calculate the moment of
inertia for each shape.
#1
14 em
Diameter= 20 em
#1 #2
#2
20 em
Diameter= 14 em

64
3.5 CALCULATING END REACTIONS (2 CLASS PERIODS)
EXPERIMENT NUMBER 5
3.5.1 Purpose
To successfully calculate the end reactions of a simply supported beam
subjected to point loads perpendicular to the neutral axis.
3.5.2 Introduction
In most highway bridges it is common to find· large I-shaped beams
supporting the bridge deck. The weight that each I-beam carries is transferred to the
bridge columns where opposing forces are exerted to support the beam. These forces
are known as end reactions (Fig. 3.5.1).
Figure 3.5.1 Bridge Reactions
If a vehicle stopped at the center of the beam, the reactions at each end would
equal half the weight of the vehicle. Although the reactions from this centrally
loaded beam are easy to determine without mathematics, how would the reactions of
a beam with more complex loading patterns be found? This experiment will focus on
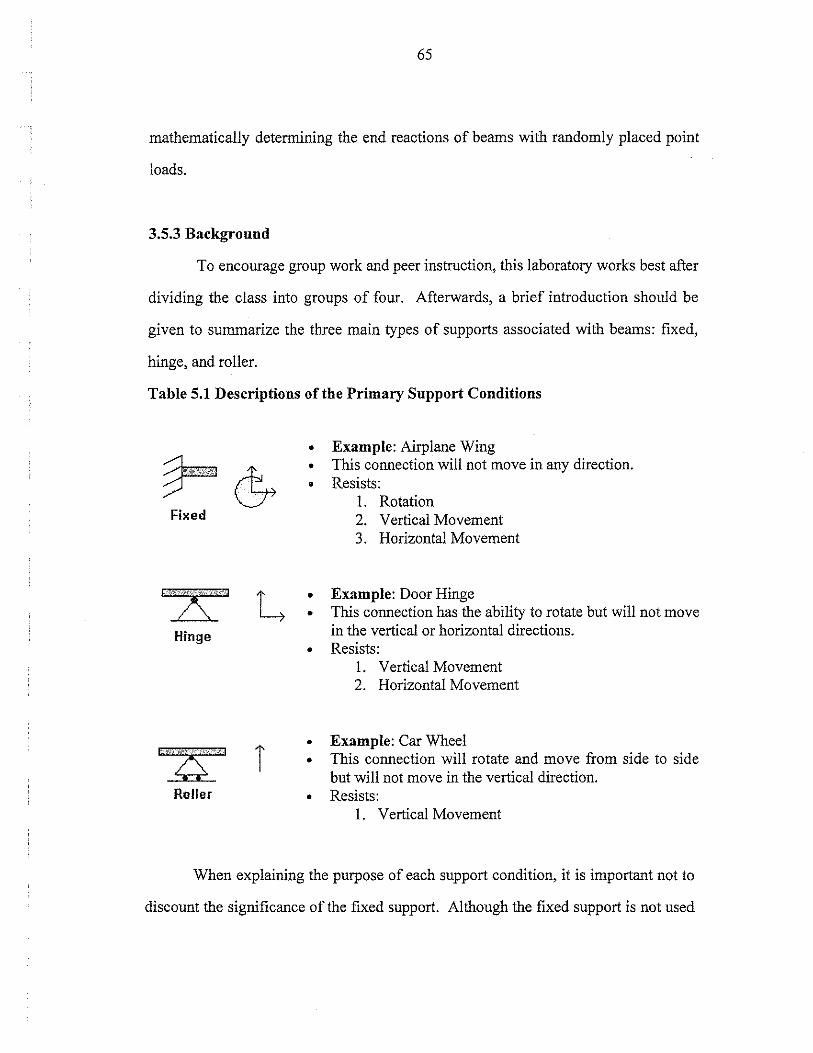
65
mathematically determining the end reactions of beams with randomly placed point
loads.
3.5.3 Background
To encourage group work and peer instruction, this laboratory works best after
dividing the class into groups of four. Afterwards, a brief introduction should be
given to summarize the three main types of supports associated with beams: fixed,
hinge, and roller.
Table 5.1 Descriptions of the Primary Support Conditions
r~ Fixed
1?\·1 L Hinge
T Roller
• Example: Airplane Wing • This connection will not move in any direction. • Resists:
1. Rotation 2. Vertical Movement 3. Horizontal Movement
• Example: Door Hinge • This connection has the ability to rotate but will not move
in the vertical or horizontal directions. • Resists:
1. Vertical Movement 2. Horizontal Movement
• Example: Car Wheel • This connection will rotate and move from side to side
but will not move in the vertical direction. • Resists:
1. Vertical Movement
When explaining the purpose of each support condition, it is important not to
discount the significance of the fixed support. Although the fixed support is not used

66
in a simply supported beam, it is a very common support condition and the rotational
resistance it provides should be emphasized. Once the explanations of the support
conditions have been completed, the students should be ready to learn about
calculating the reactions.
The methods used to determine the end reactions of a simply supported beam
are best demonstrated by constructing a beam using two scales and two yardsticks.
To avoid excessive deflection, the yardsticks should be stacked upon each other as the
ends are placed on the scales. Once completed, the beam should be loaded with
objects of known mass. The scales will measure the end reactions and the students
can be challenged to calculate the same loads measured by the scales. Since the end
supports have the ability to rotate, the resistance to rotation, or moment, at the ends
will be equal to zero. Therefore, the end reactions can be found by summing the
moments (distance x load) about one end of the beam. Examples of this technique
should be presented to the class prior to students attempting the calculations.

67
3.5.4 Step-By-Step Instruction to Calculating End Reactions (example)
10 N
)\~0S>!'2E'i:' $ll'2E'2,, ......• ~::::::::::ii j 4m I 8m j Av Bv
Ay & By = End Reactions
1) Pick which end of beam to sum end reactions about (A or B)
• For this example, we will pick end A.
2) Choose which directions the positive axis and moment are orientated.
3) Sum the moments about the A end (Moment= length x force).
• Since the end supports are rollers and hinges, the ends of the beam will
rotate. As a result, the moments will be equal to zero.
MA =0=BY(l2 m)-10 N(4 m)
BY =3.33 N

68
4) Sum the vertical forces to determine the end reaction at Ay.
• The sum of forces in the vertical direction (LFy) is equal to zero
because the beam is in equilibrium.
Ay =6.6T N
)\ i 4 m
Ay = 6.67 N
10N
l l Om
.. ····::; i
By=3.33 N
Ay & By= End Reactions
3.5.5 What You Will Need (per group of four)
• 2- scales (i.e., triple beam balance)
• 2 - yardsticks
• several objects of known mass
3.5.6 Schedule
Day 1: Introduce support conditions and explain the provided example on
solving end reactions. Afterwards, students should calculate the end reactions
for three different loading configurations on the yardstick beam.
Day 2: Review the end reaction homework problems.

69
3.5. 7 Procedure
1. Place the yardsticks, using the scales as end supports.
2. Place weights at different locations on the yardstick beam.
3. Calculate the end reactions and compare to the readings on the scales.
4. Repeat this procedure two more times, placing the weights at different
locations each time.
3.5.8 Summary
By the end of this laboratory, the students should feel comfortable with
calculating end reactions of a simply supported beam.
3.5.9 Answers to Worksheet
Please refer to the attached worksheet solution guide.
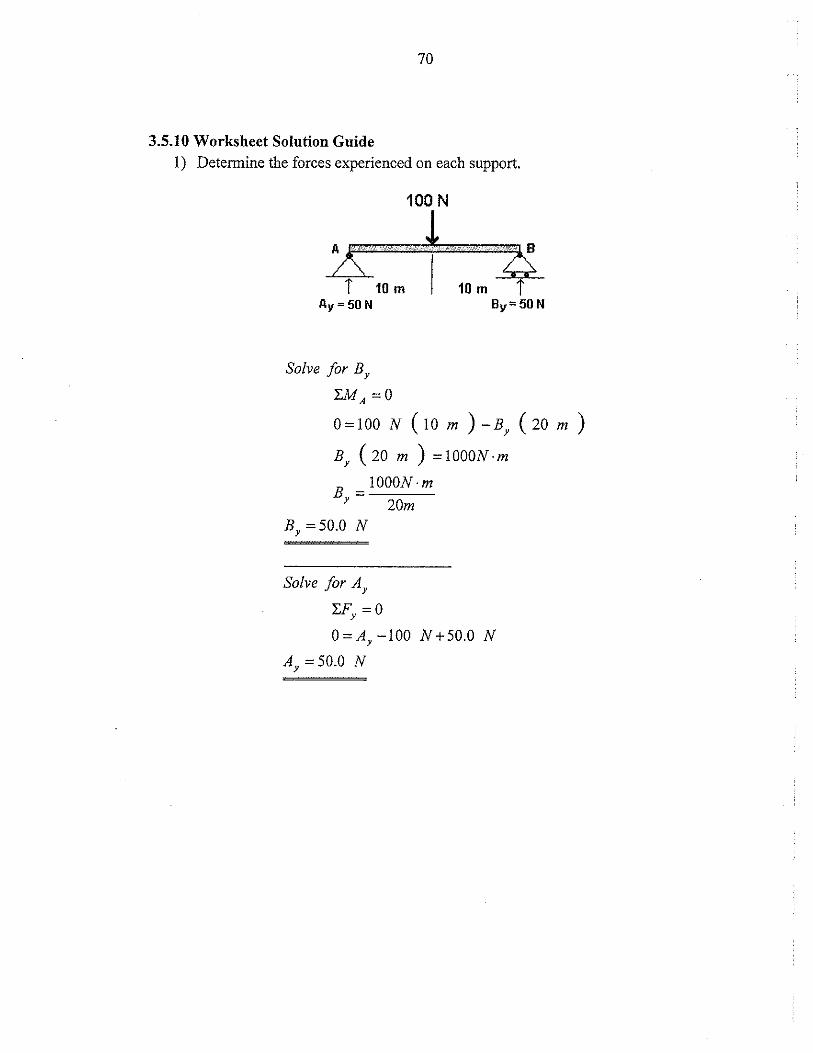
70
3.5.10 Worksheet Solution Guide 1) Determine the forces experienced on each support.
/\ i 10m
Ay=50N
Solve for BY
LMA=O
100 N
! 2$
10m i By= 50 N
0 = 100 N ( 10 m ) -BY ( 20 m )
By ( 20 m ) =1000N·m
B = 1000N·m y
By =50.0 N
Solve forAY
LFY =0
20m
O=Ay-100 N+50.0 N
AY =50.0 N

71
2) Determine the forces experienced on each support.
50N 20N
AJ··~·. ·t i 10m I 30m i
Alf=37.5N Blf=32.5N
Solve forB,
"ZMA=O
0=50 N (10m )+20 N (40 m )-BY (40 m) B, (40 m) = ( 500N·m) + ( SOON·m)
B = !300N·m 1 40m
B, =32.5 N
Solve for A,
"ZF, =0
0 = A1
-50 N- 20 N + 32.5 N
AY =37.5 N

72
3) Determine the forces experienced on each support.
AN i 15m
Ay=11.4N
Solve for BY
LMA =0
10 N 20 N
l,J,-:Q 110 m 110m i
By=18.6 N
0=10 N (15m )+20 N (25m )-BY (35m)
By (35m )=(150N·m )+ (soON·m)
B = 650N·m Y 35m
BY =18.6 N
Solve forAY
I.FY = 0
O=Ay-10 N-20 N+I8.6 N
Ay =11.4 N

73
Date:---------- Name: ____________ _
Experiment Number 5 Worksheet
ES.O Solving End Reactions
ES.l Purpose
To successfully calculate the end reactions of a simply supported beam
subjected to point loads perpendicular to the neutral axis.
E5.2 Introduction
In most highway bridges it is common to find large I -shaped beams
supporting the bridge deck. The weight that each I-beam carries is transferred to the
bridge columns where opposing forces are exerted to support the beam. These forces
are known as end reactions (Fig. E5.1).
Figure ES.l Bridge Reactions
For example, if a vehicle stopped at the center of the I-beam, the end reactions would
equal half the weight of the vehicle. Although the reactions from this centrally

74
loaded beam are easy to determine without mathematics, how would the reactions of
a beam with more complex loading patterns be found? This experiment will focus on
mathematically determining the end reactions of beams with randomly placed point
loads.
E5.3 Background
When engineers design structural beams they primarily use three different
support conditions. The most common are the fixed, hinge, and roller supports.
Descriptions of these support conditions are summarized in Table E5.1.
Table E5.1 Descriptions ofthe Primary Support Conditions
~-~ :::r- (~ Fixed
L Hinge
T Roller
• Example: Airplane Wing • This connection will not move in any direction. • Resists:
1. Rotation 2. Vertical Movement 3. Horizontal Movement
• Example: Door Hinge • This connection has the ability to rotate but will not move
in the vertical or horizontal directions. • Resists:
I. Vertical Movement 2. Horizontal Movement
• Example: Car Wheel • This connection will rotate and move from side to side but
will not move in the vertical direction. • Resists:
I. Vertical Movement
This experiment will consider end reactions produced on a simply supported beam. A
simply supported beam exists with a hinge support at one end and a roller at the other.

75
The roller support allows for expansion and contraction as the temperature changes.
Although not part of a simply supported structure, a fixed support condition also
plays an important role in structural design. The fixed support is very popular
because it can resist moving in any direction. This experiment will not consider end
reactions on beams with fixed support conditions reaction because the calculations
become too complex.
E5.4 Solving End Reactions
The methods used to determine the end reactions of a simply supported beam
are best demonstrated by constructing a beam using two scales and two yardsticks.
To avoid excessive deflection, the yardsticks should be stacked upon each other as the
ends are placed on the scales. Once completed, the beam should be loaded with
objects of known mass and the measured loads on the scales (end reactions) should be
recorded. Since the end supports have the ability to rotate, the resistance to rotation,
or moment, at the ends will be equal to zero. Therefore, the end reactions can be
found by summing the moments (distance x load) about one end of the beam. An
example of this technique is provided in the next section.
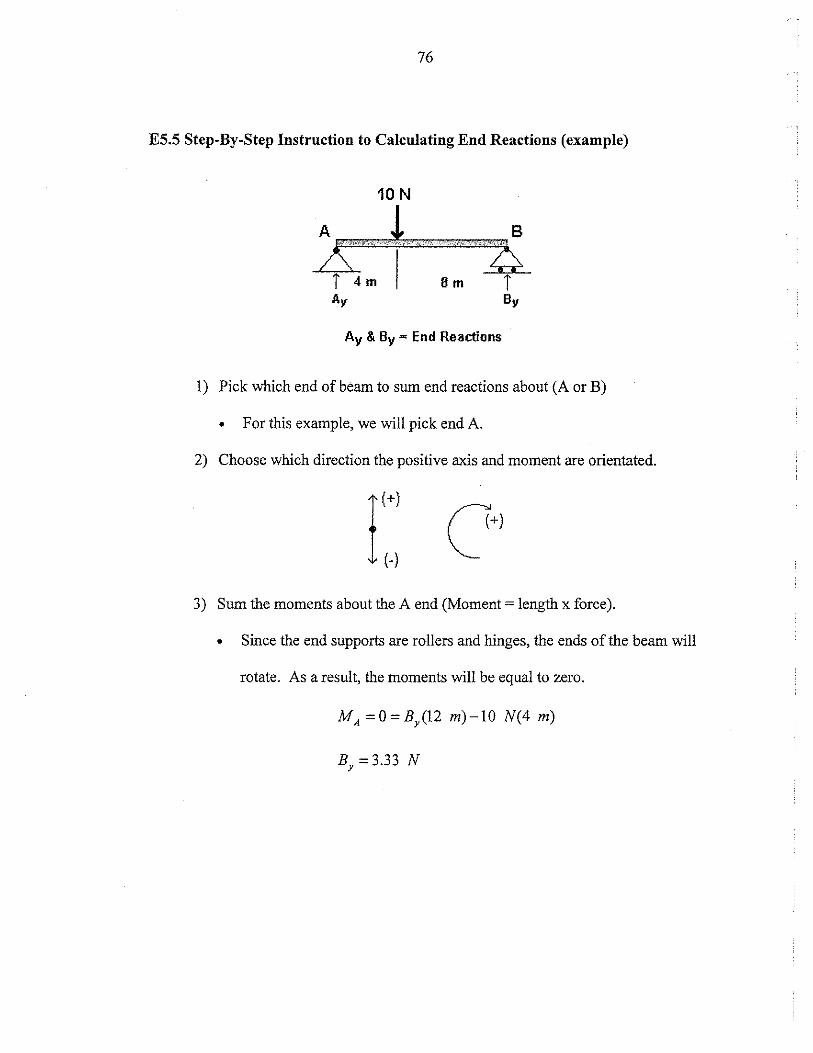
76
ES.S Step-By-Step Instruction to Calculating End Reactions (example)
10 N
A .. · ..... !.......... B )\~""'·"' EZE··+===EZE··~·····:6,
i 4m I 8m i Ay By
Ay & By = End Reactions
1) Pick which end of beam to sum end reactions about (A or B)
• For this example, we will pick end A.
2) Choose which direction the positive axis and moment are orientated.
I(+)
(-)
c+) 3) Sum the moments about the A end (Moment= length x force).
• Since the end supports are rollers and hinges, the ends of the beam will
rotate. As a result, the moments will be equal to zero.
MA =0=By(I2 m)-10 N(4 m)
BY =3.33 N

77
4) Sum the vertical forces to determine the end reaction at Ay.
• The sum of forces in the vertical direction (LF y) is equal to zero
because the beam is in equilibrium.
Ay =6.67 N
);:····· j 4 m
A v = 6.67 N
10 N
! I
········;:; 8 m i
Bv=3.33 N
Ay & By = End Reactions
E5.6 What You Will Need (per group offour)
• 2- scales (i.e., triple beam balance)
• 2 -yardsticks
• several objects of known mass
E5.7 Procedure
I. Place the yardsticks, using the scales as end supports.
2. Place weights at different locations on the yardstick beam.
3. Calculate the end reactions and compare to the readings on the scales.
4. Repeat this procedure two more times, placing the weights at different
locations each time.

78
E5.8 End Reaction Questions
1) Determine the forces experienced on each support.
100 N
J .. :Q
10m 10m I

79
2) Determine the forces experienced on each support.
50N 20N
! /\ .......•...
I 10m I t
30m I

80
3) Determine the forces experienced on each support.
10 N 20 N
A LJ:Q I 15 m 110 m 110 m I

81
3.6 BRIDGE BUILDING COMPETITION (10 CLASS PERIODS)
EXPERIMENT NUMBER 6
3.6.1 Purpose
To enhance the students' recently acquired structural design skills and allow
them to participate in a bridge building competition. The students will have the
opportunity to calculate the moment of inertia and end reactions of their original
bridge designs as they consider the factors on which the bridges will be judged.
These factors include strength, aesthetics, cost, and weight.
3.6.2 Introduction
To eliminate any confusion, a set of guidelines has been established to provide
a foundation to begin the competition. These suggestions were developed after
conducting a similar bridge building contest.
3.6.3 Competition Rules
3.6.3.1 Bridge Dimensions
The bridge should span twenty inches and be supported at each end. School
desks work well as bridge supports. The bridge should be two inches wide and will
be loaded at the center of the span.
3.6.3.2 Bridge Materials
Wooden popsicle sticks and/or tongue depressors should be used to construct
the bridges. Pasta was used once, but many problems were encountered when gluing

82
pieces together and cutting them into the desired shapes. Using wood alleviates most
of the difficulties experienced with pasta. The pieces of wood should be attached to
each other using Elmer's glue-it is inexpensive, dries relatively quickly and is easy
to clean up.
3.6.3.3 Cost
As the students are designing their bridges, the "cost" of materials and labor
should be considered to create a realistic design environment. Considering the cost
associated with each structural member and the overall construction time will
encourage the students to acknowledge the effects that each decision will have on the
final cost. This is done to demonstrate that the best bridges are not always made of
the biggest and strongest members-the best bridges are constructed by optimizing
the strength and cost of each structural member.
Labor costs are set high to encourage the students to build their bridges as
quickly and as efficiently as possible. Likewise, the structural member costs are
suggested to encourage the students to use smaller, lighter members in their structural
designs. For a wooden popsicle stick bridge, the suggested costs are listed below:
• Popsicle Stick: $100.00
• Tongue Depressor:
• Labor Costs:
$400.00
$100.00/hour
83
3.6.3.4 Judging
The bridges are judged based on strength, weight, cost, and aesthetics. Using
strength, weight, and cost encourages the students to explore different designs. The
total cost of the bridge design includes the cost of materials plus labor. The cost of
materials should be calculated by multiplying the cost of each member by the total
number of members used. The labor costs should be calculated by multiplying the
cost per hour by the total number of hours devoted to constructing the bridge. Bridge
aesthetics will be judged by the graduate student and head teacher and will encourage
the students to foster a creative construction environment.
3.6.3.5 Loading
The bridge should be weighed before it is loaded. Once the weight has been
recorded, loading the bridge can be accomplished using a plastic bucket, a 3 foot long
piece of wire, and sand. Simply, hang the wire over the bridge, with the center of the
wire at the center of the bridge. Connect the ends of the wire to the bucket through
handles or by drilling holes in the side of the bucket. Once the bucket has been
rigged, sand can be placed in the bucket until the bridge fails. The bucket and sand
should then be weighed to determine the maximum load carried by the bridge.
3.6.4 What You Will Need (per class)
• I 000 - popsicle sticks
• 1 00 - tongue Depressors
• 5 - bottles of glue
• 5 -pairs of scissors
• 1 - plastic bucket

84
• I -piece of three ft. long wire
• 2 -desks
• I- scale
3.6.5 Schedule
Day One: Summarize contest rules and encourage the students to suggest
different appearances and designs for their bridges. Take the suggestions and
record them on the chalkboard. Emphasize the relevance of moment of inertia
and how it can be used to orientate a beam for optimum bending resistance.
As homework, the students should develop a preliminary structural design.
Day Two: Students should present their bridge designs to the class. This step
allows the graduate student and teacher to suggest changes (if needed) and to
help students having problems developing the structural designs.
Days Three through Eight: Construct the wooden bridges.
Days Nine and Ten: Judge the bridges based on strength, weight, cost, and
aesthetics.
3.6.6 Procedure
I. The students should design the bridge on paper considering the dimensions
and appearance and the competition rules (Section 3.6.3).
2. The students should build the bridge.
3. Once the bridges have been completed, the students can calculate the moment
of inertia for the main span supporting the bridge.
4. The instructor and graduate student will judge the bridge competition based
on strength, weight, cost, and aesthetics.
85
3.6. 7 Summary
At the conclusion of this laboratory, the students will gain some insight into
the field of structural design. The students should be asked to perform moment of
inertia calculations on their bridges and calculate the end reactions in their bridges at
the maximum load. Comparing the moments of inertia and end reactions may help
explain how the winning bridge was able to hold the most weight before failure.
86
Date:---------- Name: ____________ _
Experiment Number 6 Worksheet
E6.0 Bridge Building Competition
E6.1 Purpose
To enhance the students' recently acquired structural design skills and allow
them to participate in a bridge building competition. The students will have the
opportunity to calculate the moment of inertia and end reactions of their original
bridge designs as they consider the factors on which the bridges will be judged.
These factors include strength, aesthetics, cost, and weight.
E6.2 Bridge Building Background
E6.2.1 Dimensions
• Length = 20 inches
• Deck Width = 2 inches
E6.2.2 Cost of Labor and Bridge Materials
• The costs will be summed at the end of the competition and will be used
as one of the criteria for selecting the winning design competition.
• Popsicle sticks - $100. 00/stick
• Tongue Depressors - $400. DO/depressor
• Labor Costs- $100.00/hour

87
E6.2.3 Loading
• The load will be placed at the center of the bridge until the bridge breaks.
E6.2.4 Judging
• Judging will be based on three different categories:
1. Aesthetics
2. Cost
3. Strength-to-weight ratio
E6.3 Procedure
1 . The students should design the bridge on paper considering the
dimensions and appearance and the competition rules (Section E6.2).
2. The students should build the bridge.
3. Once the bridges have been completed, the students can calculate the
moment of inertia for the main span supporting the bridge.
4. The instructor and graduate student will judge the bridge competition
based on strength, weight, cost, and aesthetics.

4.1SUMMARY
CHAPTER4
SUMMARY AND CONCLUSION
In February 1999, the National Science Foundation approved a $7.5 million
program that placed graduate students in kindergarten through grade twelve (K-12)
classrooms. The National Science Foundation's GK-12 Fellowship program was
developed to assist in addressing science, mathematics, engineering, and technology
(SMET) weaknesses found in the nation's public schools. As part of the program,
graduate students from the University of Kansas developed experiments to interest
high school students in their respective fields of study and to educate teachers in
various fields of science and technology. Presenting experiments to the K-12 classes
assisted in science and mathematics instruction and enriched the students' and
teachers' knowledge and understanding ofSMET .
. Other universities have offered programs in which graduate students have
promoted science and technology and introduce K-12 teachers and students in SMET.
One program, coordinated by the University of Kansas, involves thousands ofK-12
students in a project that tracks the migration habits of the Monarch Butterfly.
Similarly, graduate students from the University of Wisconsin have visited GK-12
classrooms to familiarize K-12 students with the major influences that professional
engineers have had on society. The University of Wisconsin also developed a
program that placed graduate students in local classrooms to lead discussions based
on theoretical science problems. This program also hosted several teaching seminars
for instructors in kindergarten through twelfth grade, to spark interest in space science
and technology.
88

89
The graduate students participating in the GK-12 program developed
experiments, relating to their respective fields of study, that encouraged learning
about SMET for the students and instructors in the K-12 community. The author, a
civil engineering graduate, wrote six experiments directed towards teaching students
and instructors about important aspects of civil engineering. The experiments include
the following topics:
1. the process of corrosion,
2. developing concrete mix designs,
3. graphing with Microsoft Excel,
4. calculating moment of inertia,
5. calculating end reactions of simply supported beams, and
6. designing and building a bridge to be entered in a classroom bridge
building competition.
4.2 CONCLUSIONS
The experiments within this report can be used as a valuable tool for teaching
students in grades kindergarten to twelve (K-12) about science, mathematics, and
engineering related technology. The six experiments presented in this report sparked
the interest of high school students in civil engineering. The students enjoyed the
experiments because (1) they offered hands-on activities, which encouraged students
to learn about science, math and engineering related technology normally not taught
in grades K-12, and (2) the students had the opportunity to learn from and to help
their peers while completing group work required in each exercise.

90
REFERENCES
"About Us," (1999). Monarch Watch, University of Kansas (www.monarchwatch.org/about/index.htm).
"Concrete Construction," (2001). Microsoft Encarta Online Encyclopedia, Microsoft Corporation (www.encarta.com).
"Corrosion," (2001). Microsoft Encarta Online Encyclopedia, Microsoft Corporation ( encarta.msn.com).
Herring, Lee. (1999). "Graduate Science, Math, Engineering & Technology Students Can Become K-12 Teaching Fellows," NSF News ( www .nsf.gov/od/lpa/news/press/99/pr9912.htm).
"Introduction to the GK-12 Program," (1999). NSF Graduate Teaching Fellows inKI2 Education (www.nsf.gov/bome/crssprgrnlgk12/start.htm).
"Measurement of Moment ofinertia of an Odd-shaped Object," (1998). Laboratory Experiments in Physics I, Czech Technical University in Prague ( www.cvut.cz/ cc/icsc/personnel!vesela! experiment lim 1 ).
Mindess, S., Young, J. F., and Darwin, D. (2002). Concrete, 2nd Ed., Prentice-Hall, Englewood Cliffs, NJ, in press.
"Mission of the Program," (1999). K-12 Engineering Outreach Program, University of Wisconsin ( darkstar.engr. wisc.edulzwickel/Outreach/index.html).
"Mission Statement," (1998). Wisconsin Initiative for Space Education (WISE): K-I2 Education Efforts at Space Science & Engineering Center, University of Wisconsin (www.ssec.wisc.edu/outreach/wise.html).
"Migration and Tagging," (1999). Monarch Watch, University of Kansas (www.monarchwatch.org/tagmig/index.htm).
"Scientific Principles" (2000). Materials Science and Technology Teacher's Workshop, University of Illinois at Urbana/Champaign ( matse l.mse. uiuc.edul -tw/ concrete/prin.html).