high strain rate experiments - ernetugc/nrcmmpc12/dynamicmechtesting... · high strain rate...
TRANSCRIPT

High Strain Rate Experiments
Krishna JonnalagaddaMechanical Engineering
Indian Institute of Technology Bombay
NRC-M Summer School on
Mechanical Property Characterization
Indian Institute of Science, Bangalore
July 7th, 2012
Krishna Jonnalagadda (IIT Bombay) NRC-M Summer School - June 2012 July 7th, 2012 1 / 34
Contents Outline
Topics Covered
Introduction to High Strain Rate Experiments
Review of One Dimensional Elastodynamics
Kolsky Bar Experiments - Compression, Tension, and Torsion
Kolsky Bar Experimental Setup
Wave Propagation Analysis - Dynamic Material Property Extraction
1 Compression and Tension2 Torsion3 Adiabatic Heating
Important Features of Kolsky Bar Experimental Technique
1 Specimen Geometry - Friction, Homogenization, Inertial Effects2 Specimen Material (Metal/Ceramic/Polymer) - Pulse Shaping3 Wave Dispersion4 High/Low Temperature Experiments
Krishna Jonnalagadda (IIT Bombay) NRC-M Summer School - June 2012 July 7th, 2012 2 / 34

High Strain Rate Experiments Introduction
High Strain Rate Experiments on Materials
Dynamic loading causes significant deformation and damage ofmaterials due to the kinetic energy carried by a mass as compared toquasi-static loading
In dynamic loading stress is a function of the particle velocity, i.e., themotion of an individual point mass in the body
Upon impact of a body a stress wave is generated, which travels at aspecified velocity
The velocity of the stress wave is different from the the velocity ofthe particle in motion
Stress wave velocity depends on the nature of the wave and thematerial properties, such as, density and modulus
Dynamic deformation of materials involves stress wave propagation
High strain rate experiments are performed to extract constitutivebehavior, failure, fracture and fragmentation of materials
Krishna Jonnalagadda (IIT Bombay) NRC-M Summer School - June 2012 July 7th, 2012 3 / 34

High Strain Rate Experiments Introduction
High Strain Rate Experimental Techniques
Quasi-static strain rates - < 10−3s−1
Intermediate strain rates - > 10−3s−1
High strain rates - > 102s−1
Very high strain rates - > 104s−1
Ultra high strain rates - > 106s−1
1The choice of experimental technique determines the strain rate rangeaccessible for different materials
Material properties that affect that the strain rate include, density,wave speed, yield strength, etc.
The specimen geometry also changes between the techniques toensure that uniform stress state exists during the experiment
1Ramesh, Experimental Mechanics Handbook, 2009Krishna Jonnalagadda (IIT Bombay) NRC-M Summer School - June 2012 July 7th, 2012 4 / 34
High Strain Rate Experiments Review of 1-D Elastodynamics
One Dimensional Wave Propagation in Elastic Media
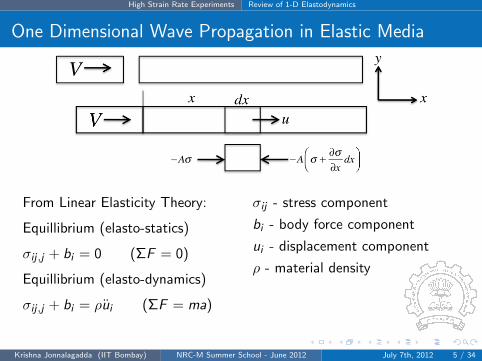
From Linear Elasticity Theory:
Equillibrium (elasto-statics)
σij ,j + bi = 0 (ΣF = 0)
Equillibrium (elasto-dynamics)
σij ,j + bi = ρui (ΣF = ma)
σij - stress component
bi - body force component
ui - displacement component
ρ - material density
Krishna Jonnalagadda (IIT Bombay) NRC-M Summer School - June 2012 July 7th, 2012 5 / 34

High Strain Rate Experiments Review of 1-D Elastodynamics
One Dimensional Wave Propagation in Elastic Media
1-D equillibrium in x-direction without body forces:
σxx ,x = ρux (1)
1-D linear elastic material:
σxx = Eεxx (2)
From (1) and (2)
Eεxx ,x = ρux (3)
c20∂2ux∂x2 = ∂2ux
∂t2 (4)
where c0 =√
Eρ is the ” longitudinal wave speed”
Krishna Jonnalagadda (IIT Bombay) NRC-M Summer School - June 2012 July 7th, 2012 6 / 34
High Strain Rate Experiments Review of 1-D Elastodynamics
One Dimensional Wave Propagation in Elastic Media
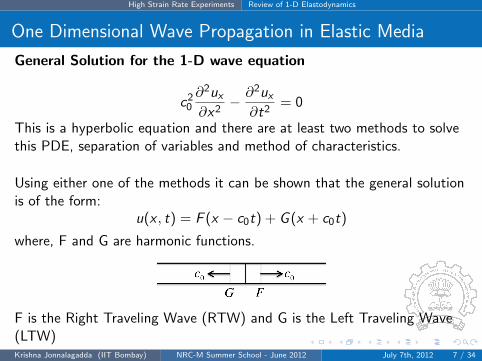
General Solution for the 1-D wave equation
c20
∂2ux
∂x2− ∂2ux
∂t2= 0
This is a hyperbolic equation and there are at least two methods to solvethis PDE, separation of variables and method of characteristics.
Using either one of the methods it can be shown that the general solutionis of the form:
u(x , t) = F (x − c0t) + G (x + c0t)
where, F and G are harmonic functions.
F is the Right Traveling Wave (RTW) and G is the Left Traveling Wave(LTW)Krishna Jonnalagadda (IIT Bombay) NRC-M Summer School - June 2012 July 7th, 2012 7 / 34
High Strain Rate Experiments Review of 1-D Elastodynamics
One Dimensional Wave Propagation in Elastic Media
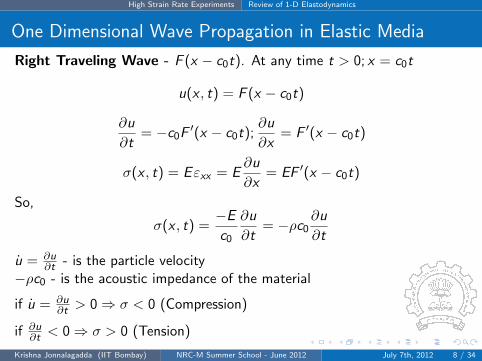
Right Traveling Wave - F (x − c0t). At any time t > 0; x = c0t
u(x , t) = F (x − c0t)
∂u
∂t= −c0F
′(x − c0t);∂u
∂x= F ′(x − c0t)
σ(x , t) = Eεxx = E∂u
∂x= EF ′(x − c0t)
So,
σ(x , t) =−E
c0
∂u
∂t= −ρc0
∂u
∂t
u = ∂u∂t - is the particle velocity
−ρc0 - is the acoustic impedance of the material
if u = ∂u∂t > 0⇒ σ < 0 (Compression)
if ∂u∂t < 0⇒ σ > 0 (Tension)
Krishna Jonnalagadda (IIT Bombay) NRC-M Summer School - June 2012 July 7th, 2012 8 / 34

High Strain Rate Experiments Review of 1-D Elastodynamics
One Dimensional Wave Propagation in Elastic Media
Left Traveling Wave - G (x + c0t). At any time t > 0; x = −c0t
u(x , t) = G (x + c0t)
∂u
∂t= c0G
′(x + c0t);∂u
∂x= G ′(x + c0t)
σ(x , t) = Eεxx = E∂u
∂x= EG ′(x + c0t)
So,
σ(x , t) =E
c0
∂u
∂t= ρc0
∂u
∂t
if u = ∂u∂t > 0⇒ σ > 0 (Tension)
if u = ∂u∂t < 0⇒ σ < 0 (Compression)
Krishna Jonnalagadda (IIT Bombay) NRC-M Summer School - June 2012 July 7th, 2012 9 / 34
High Strain Rate Experiments Review of 1-D Elastodynamics
Reflection and Trasmission of Waves
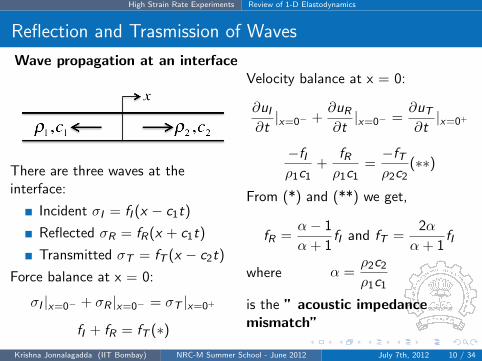
Wave propagation at an interface
There are three waves at theinterface:
Incident σI = fI (x − c1t)
Reflected σR = fR(x + c1t)
Transmitted σT = fT (x − c2t)
Force balance at x = 0:
σI |x=0− + σR |x=0− = σT |x=0+
fI + fR = fT (∗)
Velocity balance at x = 0:
∂uI
∂t|x=0− +
∂uR
∂t|x=0− =
∂uT
∂t|x=0+
−fIρ1c1
+fRρ1c1
=−fTρ2c2
(∗∗)
From (*) and (**) we get,
fR =α− 1
α + 1fI and fT =
2α
α + 1fI
where α =ρ2c2
ρ1c1
is the ” acoustic impedancemismatch”
Krishna Jonnalagadda (IIT Bombay) NRC-M Summer School - June 2012 July 7th, 2012 10 / 34

High Strain Rate Experiments Review of 1-D Elastodynamics
Reflection and Trasmission of Waves
Free End Reflection:
Incident σI = fI (x − c1t)
Reflected σR = fR(x + c1t)
At the free end, stress is zero
σ|x=0 = fI |x=0 + fR |x=0 = 0⇒ fR = −fI
So, the pulse is of the same shape but of opposite sign, i.e., a compressivepulse reflects as a tensile pulse after interacting with a free surface andvice versa. What about particle velocity?
∂u
∂t=−fIρ1c1
+fRρ1c1
=−2fIρ1c1
The velocity doubles at the free surface
Krishna Jonnalagadda (IIT Bombay) NRC-M Summer School - June 2012 July 7th, 2012 11 / 34

High Strain Rate Experiments Review of 1-D Elastodynamics
Reflection and Trasmission of Waves
Built in or Rigid End Reflection:
Incident uI = FI (x − c1t)
Reflected uR = FR(x + c1t)
At a rigid end, the boundary conditions are u = 0 and u = 0
ux=0 = FI |x=0 + FR |x=0 = 0⇒ FR = −FI
So, the velocity changes the sign in this case. What about stress?
∂u
∂t=−fIρ1c1
+fRρ1c1
= 0⇒ fI = fR ⇒ σ|x=0 = fI + fR = 2fI
The stress doubles at a rigid end.
Krishna Jonnalagadda (IIT Bombay) NRC-M Summer School - June 2012 July 7th, 2012 12 / 34
High Strain Rate Experiments Review of 1-D Elastodynamics
Reflection and Trasmission of Waves
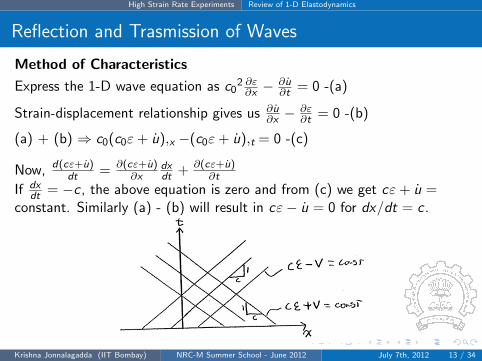
Method of Characteristics
Express the 1-D wave equation as c02 ∂ε∂x −
∂u∂t = 0 -(a)
Strain-displacement relationship gives us ∂u∂x −
∂ε∂t = 0 -(b)
(a) + (b) ⇒ c0(c0ε+ u),x −(c0ε+ u),t = 0 -(c)
Now, d(cε+u)dt = ∂(cε+u)
∂xdxdt + ∂(cε+u)
∂t
If dxdt = −c , the above equation is zero and from (c) we get cε+ u =
constant. Similarly (a) - (b) will result in cε− u = 0 for dx/dt = c .
Krishna Jonnalagadda (IIT Bombay) NRC-M Summer School - June 2012 July 7th, 2012 13 / 34

High Strain Rate Experiments Experimental Techniques
Kolsky Bar Experiment - Compression
2
Stress wave is generated by launching a projective onto the input bar
Strains are measured in the input and the output bar
Alignment of the bars and projectile are very important
The bars need to move freely in the supports in their length direction
2Ramesh, Experimental Mechanics Handbook, 2009Krishna Jonnalagadda (IIT Bombay) NRC-M Summer School - June 2012 July 7th, 2012 14 / 34

High Strain Rate Experiments Experimental Techniques
Kolsky Bar Experiment - Tension
3
A tensile pulse is generated by the sudden release of tensile strainstored in the bar using a clamp
The pulse shape and wave form characteristics are influenced by theclamp design
Finite element analysis is required for specimen design3Ramesh, Experimental Mechanics Handbook, 2009
Krishna Jonnalagadda (IIT Bombay) NRC-M Summer School - June 2012 July 7th, 2012 15 / 34

High Strain Rate Experiments Experimental Techniques
Tension/Compression x - t Diagram
4
Lagrangian or x-t diagrams are extremely useful in the analysis ofKolsky bar experiments
4Ramesh, Experimental Mechanics Handbook, 2009Krishna Jonnalagadda (IIT Bombay) NRC-M Summer School - June 2012 July 7th, 2012 16 / 34

High Strain Rate Experiments Experimental Techniques
Kolsky Bar Experiment - Torsion
5
In a torsion bar a torsional (shear) wave is propagated in the bars andthe specimen
Torsional bars do not required dispersion correction
Large strains can be generated in a torsional bar
Bending waves need to avoided during operation
Finite element analysis is required for the specimen design5Ramesh, Experimental Mechanics Handbook, 2009
Krishna Jonnalagadda (IIT Bombay) NRC-M Summer School - June 2012 July 7th, 2012 17 / 34

High Strain Rate Experiments Experimental Techniques
Kolsky Bar Experiment - Torsion - x-t Diagram
6
6ASM Metals Handbook, Vol. 8Krishna Jonnalagadda (IIT Bombay) NRC-M Summer School - June 2012 July 7th, 2012 18 / 34

High Strain Rate Experiments Experimental Analysis
Kolsky Bar Analysis - Compression and Tension
A0 - Initial specimen cross section area and L0 - Initial specimen lengthAverage Stress in the specimen:
σ(t) =P1(t) + P2(t)
2A0
P1(t) = EAε1 = EA(εI (t) + εR(t)) and P2(t) = EAε2 = EAεT (t)
If the specimen stress state is homogeneous (equillibrium)
P1 = P2 and εI + εR = εT
Therefore, engineering stress and true stress are:
σ(t) =EAεT (t)
A0and σt(t) = σ(t)[1− ε(t)]
Krishna Jonnalagadda (IIT Bombay) NRC-M Summer School - June 2012 July 7th, 2012 19 / 34
High Strain Rate Experiments Experimental Analysis
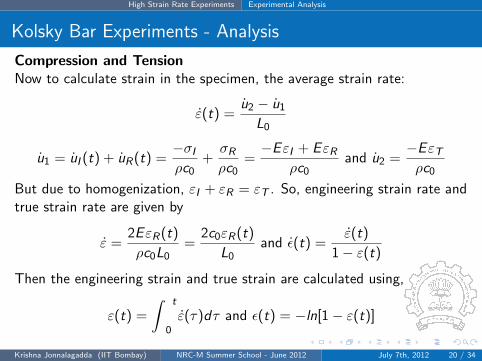
Kolsky Bar Experiments - Analysis
Compression and TensionNow to calculate strain in the specimen, the average strain rate:
ε(t) =u2 − u1
L0
u1 = uI (t) + uR(t) =−σI
ρc0+σR
ρc0=−EεI + EεR
ρc0and u2 =
−EεTρc0
But due to homogenization, εI + εR = εT . So, engineering strain rate andtrue strain rate are given by
ε =2EεR(t)
ρc0L0=
2c0εR(t)
L0and ε(t) =
ε(t)
1− ε(t)
Then the engineering strain and true strain are calculated using,
ε(t) =
∫0
t
ε(τ)dτ and ε(t) = −ln[1− ε(t)]
Krishna Jonnalagadda (IIT Bombay) NRC-M Summer School - June 2012 July 7th, 2012 20 / 34

High Strain Rate Experiments Experimental Analysis
Kolsky Bar Experiments - Compression Analysis
7
7Ramesh, Experimental Mechanics Handbook, 2009Krishna Jonnalagadda (IIT Bombay) NRC-M Summer School - June 2012 July 7th, 2012 21 / 34
High Strain Rate Experiments Experimental Analysis
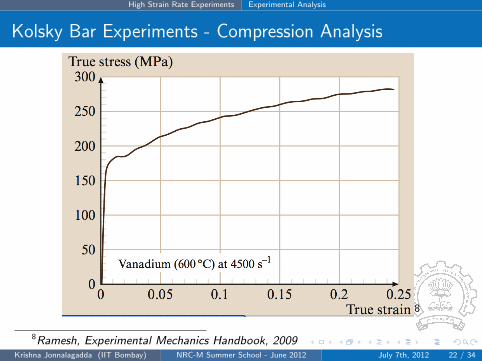
Kolsky Bar Experiments - Compression Analysis
8
8Ramesh, Experimental Mechanics Handbook, 2009Krishna Jonnalagadda (IIT Bombay) NRC-M Summer School - June 2012 July 7th, 2012 22 / 34
High Strain Rate Experiments Experimental Analysis
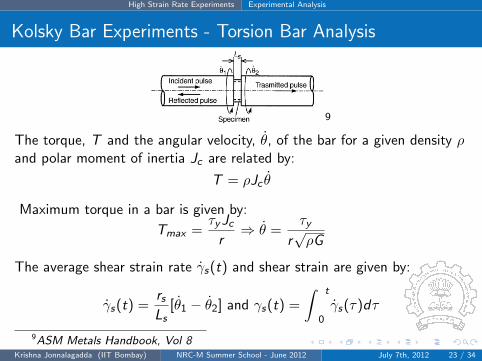
Kolsky Bar Experiments - Torsion Bar Analysis
9
The torque, T and the angular velocity, θ, of the bar for a given density ρand polar moment of inertia Jc are related by:
T = ρJc θ
Maximum torque in a bar is given by:
Tmax =τyJc
r⇒ θ =
τy
r√ρG
The average shear strain rate γs(t) and shear strain are given by:
γs(t) =rsLs
[θ1 − θ2] and γs(t) =
∫0
t
γs(τ)dτ
9ASM Metals Handbook, Vol 8Krishna Jonnalagadda (IIT Bombay) NRC-M Summer School - June 2012 July 7th, 2012 23 / 34

High Strain Rate Experiments Experimental Analysis
Kolsky Bar Experiments - Torsion Bar Analysis
The relative change in angular velocity is given by (with one strain gage):
[θ1 − θ2] =2[−TR(t)]
ρJcand TR(t) =
GJcγR(t)
rb
Now to compute the shear stress we use to the strain measured in thetransmitted bar, γT assuming that the stress in the specimen is uniform ⇒torque at both ends of the specimen is same
τs(t) =Ts(t)
2πrs2ts=
Grb3
4rs2tsγT (t)
where, rs is the mean radius of an hollow specimen, rb is the radius of thetorsion bars, ts is the thickness of the specimen, TR(t) torque calculatedfrom the reflected strain. 10
10ASM Metals Handbook, Vol 8Krishna Jonnalagadda (IIT Bombay) NRC-M Summer School - June 2012 July 7th, 2012 24 / 34
High Strain Rate Experiments Experimental Analysis
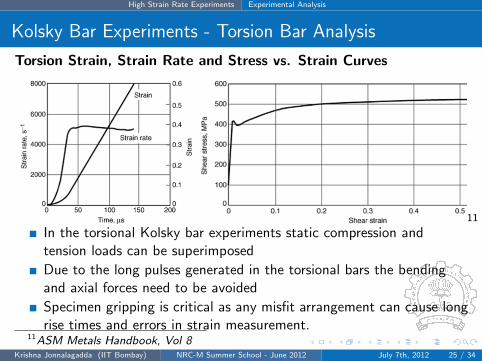
Kolsky Bar Experiments - Torsion Bar Analysis
Torsion Strain, Strain Rate and Stress vs. Strain Curves
11
In the torsional Kolsky bar experiments static compression andtension loads can be superimposed
Due to the long pulses generated in the torsional bars the bendingand axial forces need to be avoided
Specimen gripping is critical as any misfit arrangement can cause longrise times and errors in strain measurement.
11ASM Metals Handbook, Vol 8Krishna Jonnalagadda (IIT Bombay) NRC-M Summer School - June 2012 July 7th, 2012 25 / 34

High Strain Rate Experiments Experimental Analysis
Kolsky Bar Experiments - Adiabatic Heating
Under dynamic loading, inelastic deformation causes temperature risein the specimen
The heat removal rate in a material depends on the thermaldiffusivity α (= 1.14cm2s−1 for copper).
The distance the heat travels is given by 2√αt
At higher strain rates, the heat generated from the specimen duringentire experiment is accumulated - this is called adiabatic heating
Temperature rise during adiabatic heating is given by
∆T =β
ρCp
∫ εf
0σdε
where β depends on the plastic work converted into heat
Implications of this adiabatic heating include thermal softening andshear banding
Krishna Jonnalagadda (IIT Bombay) NRC-M Summer School - June 2012 July 7th, 2012 26 / 34
High Strain Rate Experiments Experimental Setup
Kolsky Bar Experiment - Design
Kolsky bar design has three important ratios to consider but mostimportantly the specimen size, i.e., for a cylindrical sample the lengthl0 and diameter d0 and the projectile velocity V are chosen first.
The ratios are:1 L/D - Bar length to bar diameter ratio - typically about 1002 D/d0 - Bar diameter to specimen diameter - about 2 to 43 l0/d0 - Specimen length to its diameter - about 0.5 to 1
The main components of Kolsky bar setup are:1 Projectile launcher - e.g., compressed air gas gun2 Input and output bars - e.g., maraging steel bars3 Strain gauges to measure strain in the bars - e.g., foil gages4 Alignment fixture to keep the bars straight and concentric5 Data acquisition with required bandwidth and resolution - e.g.,
oscilloscope
The specimen size chosen should represent the bulk response of thematerials
Krishna Jonnalagadda (IIT Bombay) NRC-M Summer School - June 2012 July 7th, 2012 27 / 34
High Strain Rate Experiments Experimental Setup
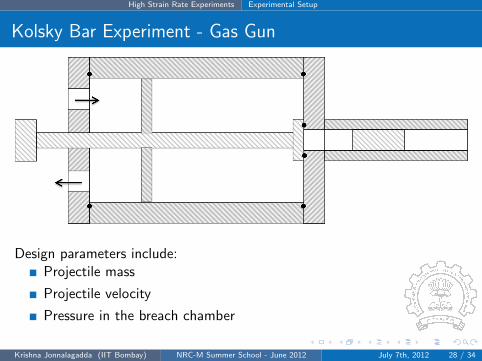
Kolsky Bar Experiment - Gas Gun
Design parameters include:Projectile mass
Projectile velocity
Pressure in the breach chamber
Krishna Jonnalagadda (IIT Bombay) NRC-M Summer School - June 2012 July 7th, 2012 28 / 34

High Strain Rate Experiments Experimental Setup
Kolsky Bar Experiment - Strain Measurement
Quarter Bridge vs. Half Bridge - Depends on length of the bar andoutput signal required
Bonded Foil vs. Semiconductor Strain Gages - Depends on gagefactor required
Signal Amplification is necessary when amplitude is small
Data acquisition should have enough bandwidth to capture sharpgradients in the signal
Krishna Jonnalagadda (IIT Bombay) NRC-M Summer School - June 2012 July 7th, 2012 29 / 34

High Strain Rate Experiments Comments
Kolsky Bar Experiment - Specimen Geometry
Considerations for specimen geometry and preparation
Specimen surfaces need to be flat, parallel and smooth forcompression experiments
Specimen should not have stress concentration regions for allcompression, tension and torsion
In the case of tension and torsion finite element calculations need tobe performed with the end conditions
While testing ceramic specimens the punch effect should be avoided
For ceramic specimens pulse shaping may be required to allowuniform loading before critical strength is reached
For very soft materials lower stiffness bars are required to measurestress
For tension and torsion experiments local strain measurement may berequired for accurate stress vs. strain curves
Strain control by varying pulse width or by using a collarKrishna Jonnalagadda (IIT Bombay) NRC-M Summer School - June 2012 July 7th, 2012 30 / 34

High Strain Rate Experiments Comments
Kolsky Bar Experiment - Requirements
Force equilibrium ⇒ P1 = P2
Stress equilibration is required for output bar measurement torepresent average stress in the specimen.
Friction Effects - will lead to specimen barreling and uniaxial stressstate is not maintained
Friction can be removed by ensuring flat and smooth bar andspecimen surfaces and by the use of lubricants
Dispersion Effects - Longitudinal waves suffer from geometricdispersion, e.g., due to Poisson expansion or contraction.
Dispersion effects the strain pulses, superimposes oscillations in thespecimen loading and shorter pulses cause much worse dispersioneffects.
Dispersion effects can be removed by corrections performed on thestrain signals or by introducing pulse shaping
Krishna Jonnalagadda (IIT Bombay) NRC-M Summer School - June 2012 July 7th, 2012 31 / 34

High Strain Rate Experiments Some Results
Dynamic Compression Kolsky Bar
Projectile
Vertical Posts Input Bar Output Bar Momentum Trap Specimen
12
Desktop Kolsky bar designed to load specimens at very high strainrates of 104 to 105
The typical projectile velocity ranges from 10-50 m/s12Jonnalagadda et al., MSE-A, submitted
Krishna Jonnalagadda (IIT Bombay) NRC-M Summer School - June 2012 July 7th, 2012 32 / 34

High Strain Rate Experiments Some Results
Dynamic Strength of Armor Materials
Dynamic strength, failure, rate-dependence and fracture in metals andceramicsTemperature-Strain Rate dependence in materialsPhenomelogical and physical models such as Johnson & Cook,Zerilli-Armstrong (Z-A) and Mechanical Threshold Stress (MTS) formaterial behavior
Krishna Jonnalagadda (IIT Bombay) NRC-M Summer School - June 2012 July 7th, 2012 33 / 34

High Strain Rate Experiments References
References
1 D. Jia and K. T. Ramesh, ”A rigorous assessment of the benefits ofminiaturization in the Kolsky bar system,” Experimental Mechanics,2004.
2 K. T. Ramesh, ”High Strain Rate and Impact Experiments,”Experimental Mechanics Handbook, Springer, 2009.
3 Mechanical Testing and Evaluation, ASM Handbook, Vol 8, 2000.
4 B. A. Gama, et al., ”Hopkinson Bar Experimental Technique: ACritical Review,”Appl Mechanics Reviews, vol 57, 2004.
5 M. A. Meyers, ”Dynamic Behavior of Materials, John Wiley and Sons,1994.
6 G. T. Gary, ”Classic Split Hopkinson Pressure Bar Testing,” ASMInternational, 2000
Krishna Jonnalagadda (IIT Bombay) NRC-M Summer School - June 2012 July 7th, 2012 34 / 34