presentation by dr. ehab shalaby · dr. ehab shalaby to capacity building program on climate change...
TRANSCRIPT
Presentation by
Dr. Ehab Shalaby To
Capacity Building Program on Climate Change
Ministry of Environment Egyptian Environmental Affairs Agency EEAA
28 - 30 November 2016

About EHAB SHALABY
Academic achievement
Public consultations
Business occupation
Academic Achievements

Public consultations
Business occupation

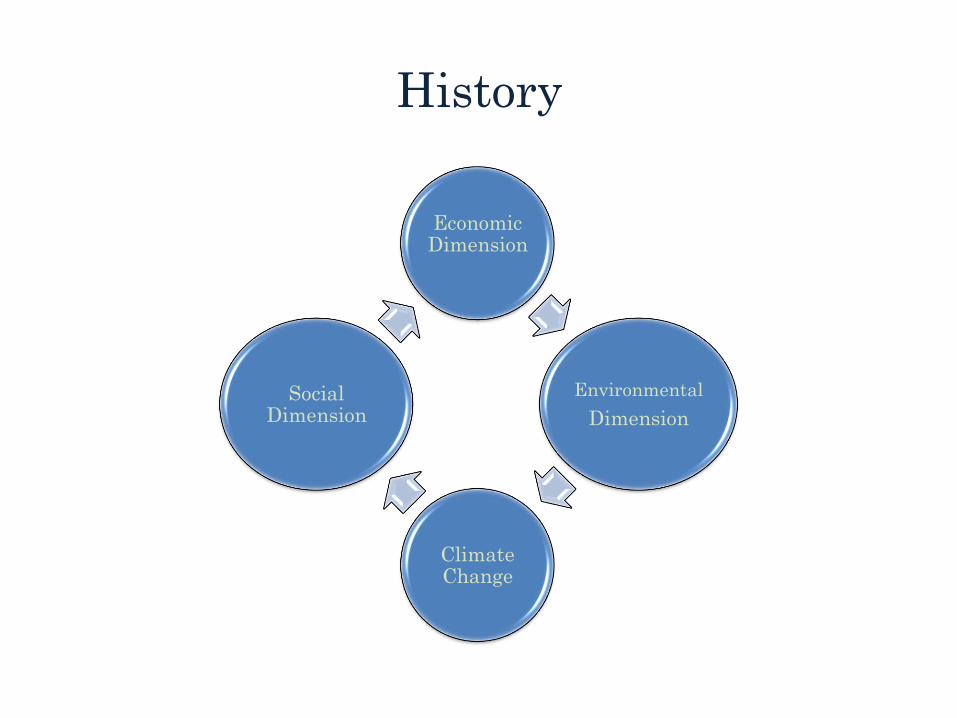
History
Economic Dimension
Environmental
Dimension
Climate Change
Social Dimension

Major conferences & Summits
• UN Conference of the
Human Environment (1972)
• World Commission on
Environment and
Development (1987)

Major conferences & Summits
• United Nations Conference
on Environment and
Development (1992)
• Millennium Summit (2000)

Major conferences & Summits
• World Summit on
Sustainable Development
(2002)
• UN Conference on
Sustainable Development
(2012)
• United Nations Sustainable
Development Summit (2015)
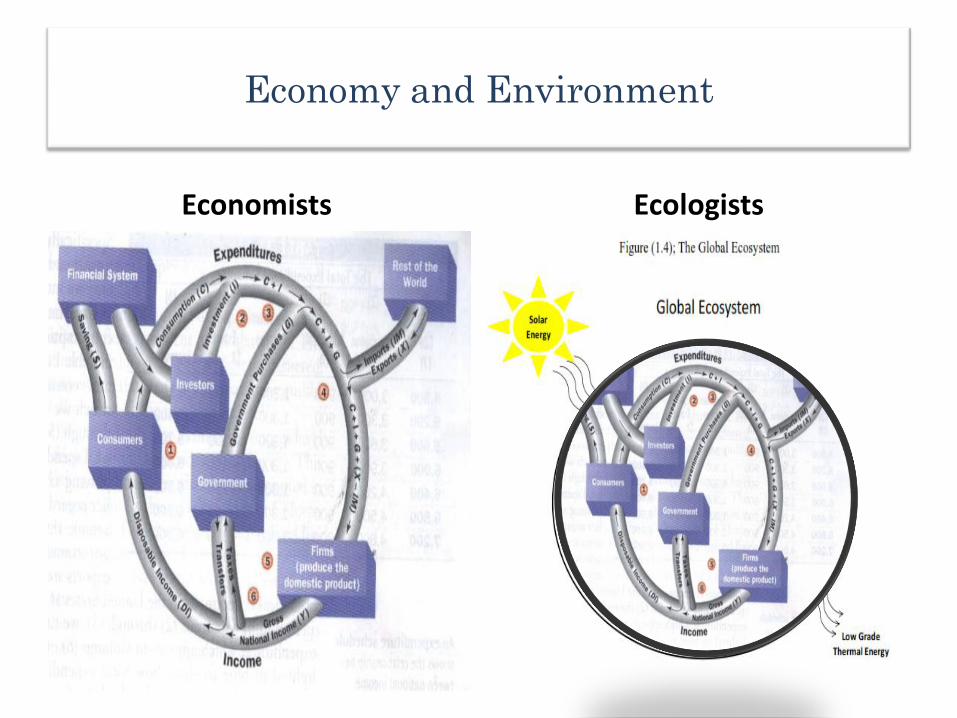
Economy and Environment
Economists Ecologists

CO2 Emissions
0
20
40
60
80
100
120
140
160
Agriculture Sector Industrial Sector Energy & Transport wastes
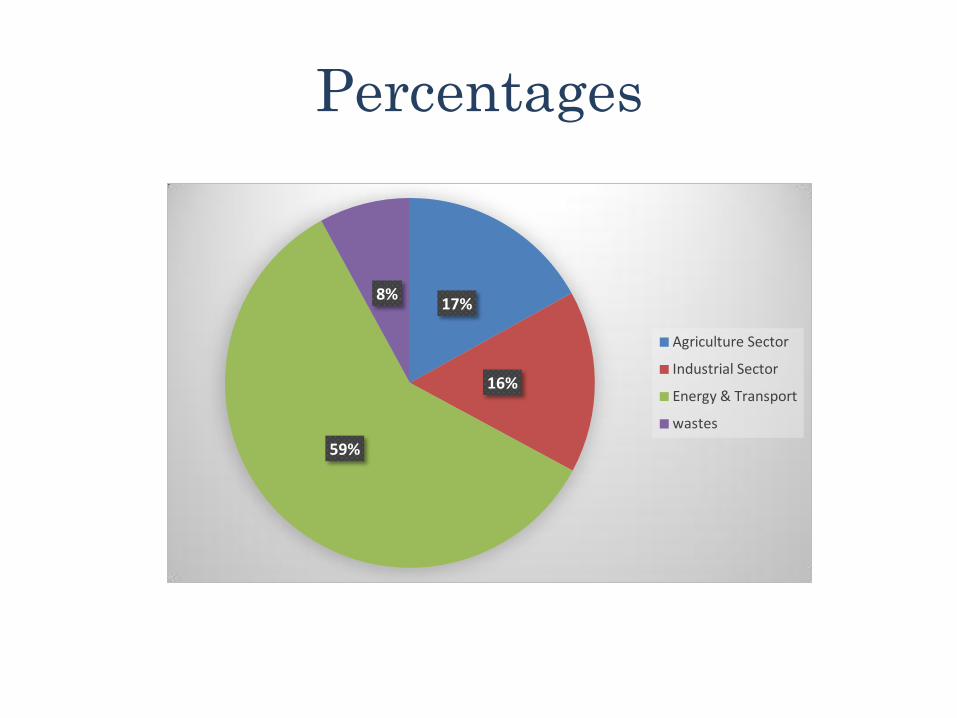
Percentages
17%
16%
59%
8%
Agriculture Sector
Industrial Sector
Energy & Transport
wastes

Total reductions of GHG emissions by 2030
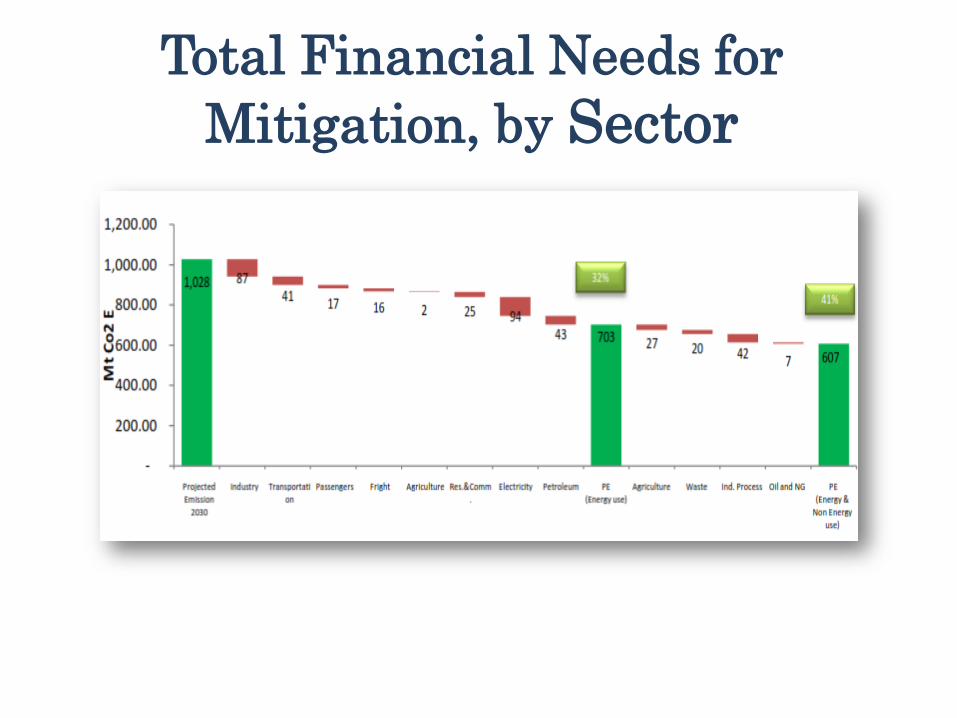
Total Financial Needs for
Mitigation, by Sector
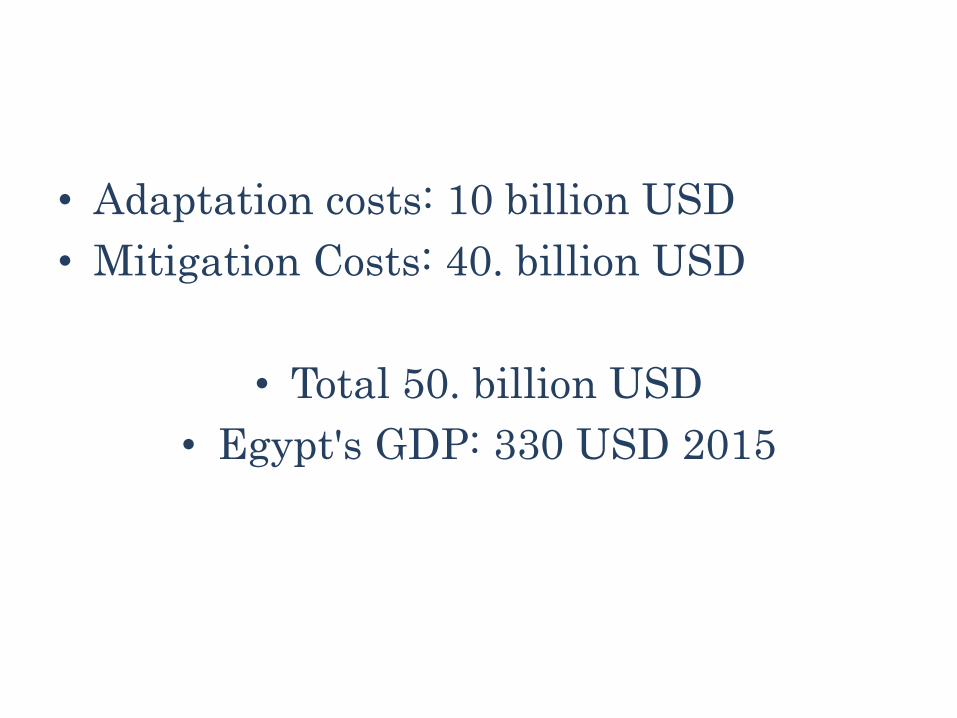
• Adaptation costs: 10 billion USD
• Mitigation Costs: 40. billion USD
• Total 50. billion USD
• Egypt's GDP: 330 USD 2015

Subtract
Yields
Yields
Subtract
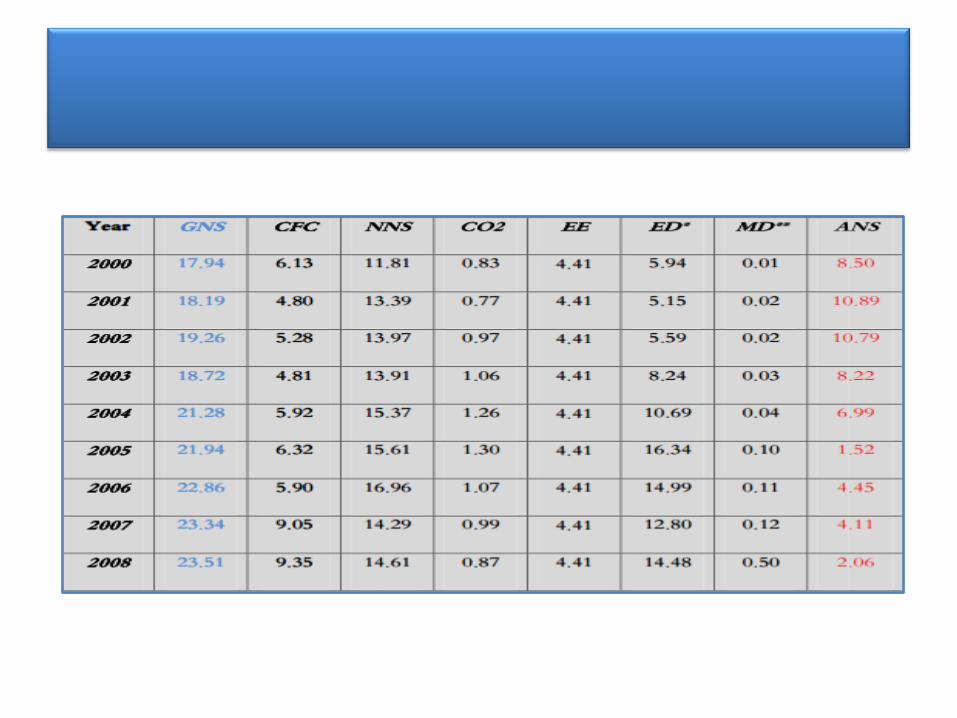
Gross National Income (GNI) (Y)
Public & Private Consumption
Gross National Savings (GNS)
Net National Savings (NNS) (CH KM)
Consumption Of Fixed Capital (CFC)
Value OF Res. Depletion
INV. In Human Capital
(KI)
Value Of Damage
From Pollution
Adjusted Net Savings (ANS) (CH K)
YIELDS
World Bank adjusted
net saving indicator
components.

World comparison
18.16%
6.85%
19.30%
6.32%
GNS EGYPT NNS EGYPT GNS WA. NNS WA.
% GNI (2010)
Source: World Development Indicators & Global Development Finance, (WB, 2012).

18.16
6.85
11.26
-7.07
-1.55
3.61
GNS NNS NNS+EDE TRD TED ANS
GNS & ANS % of GNI (2010)
GNS and ANS
Source: World Development Indicators & Global Development Finance, (WB,
2012).
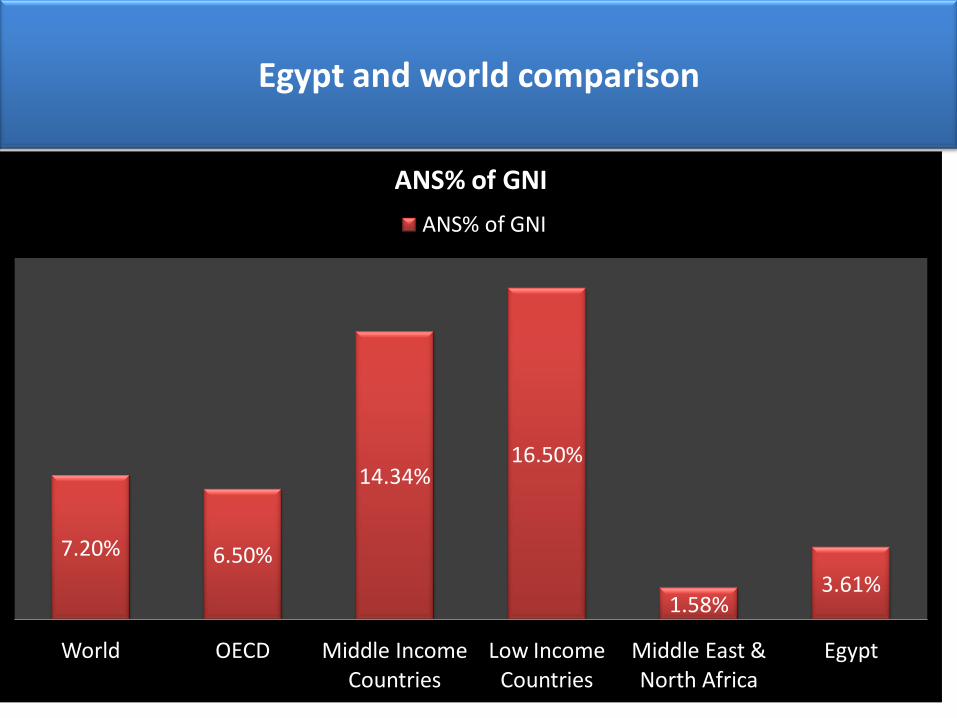
7.20% 6.50%
14.34% 16.50%
1.58% 3.61%
World OECD Middle Income Countries
Low Income Countries
Middle East & North Africa
Egypt
ANS% of GNI
ANS% of GNI
Egypt and world comparison

0.00
2.00
4.00
6.00
8.00
10.00
12.00
14.00
16.00
18.00
1990 91 92 93 94 95 96 97 98 99 2000 1 2 3 4 5 6 7 8 9 10
ANS
Linear (ANS)
Linear (ANS)
ANS trends
Source: World Development Indicators & Global Development Finance, (WB, 2012).
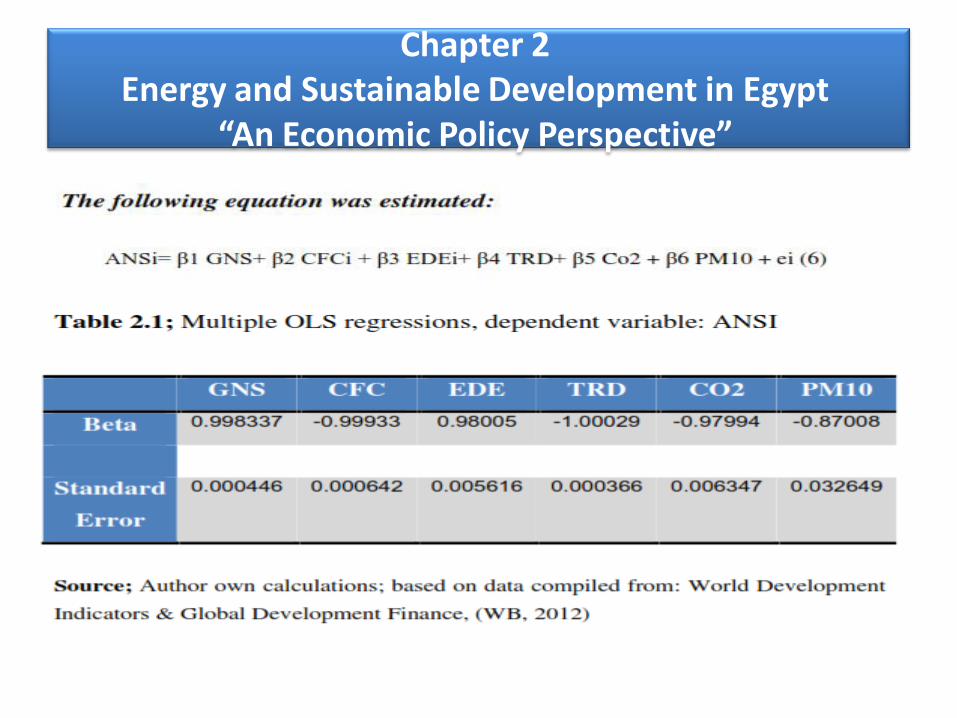
Chapter 2 Energy and Sustainable Development in Egypt
“An Economic Policy Perspective”

Weak VS Strong Sustainability
Neoclassical Approach
Weak Sustainability
KM
KI
KN
0<K
Ecological Economic Approach
Strong Sustainability
KM
KI
KN
K>0
