presentación de powerpoint - sacyr 1h 2017_tcm30-34628.pdf · - qatar: sewerage works of plot...
TRANSCRIPT
1H2017 – Presentation of Results
RESULTS 2017
F i r s t H a l f 8 S e p t e m b e r 2 0 1 7

1H2017 – Presentation of Results
HIGHLIGHTS
OPERATIONAL EVOLUTION
PERFORMANCE BY BUSINESS AREAS
ANNEXES
2
Table of Contents

1H2017 – Presentation of Results
Reduction of net debt in 2Q17 = -802€M.
Exposure to variations of Repsol share price totally covered through derivative transactions,
retaining the potential upside in Repsol share price and the access to dividends.
Full early repayment of the loan associated to our stake in Repsol, for an amount of 769€M.
Decrease in net financial costs by 17%.
3
Highlights
REVENUE +8%
EBITDA +16%
EBITDA margin / Revenue = 12.5%
Rotation of mature concession assets: Sale of 49% of Rutas del Algarrobo (Chile) and 4%
Tenerife Tram (Spain).
Backlog +16%. Amount > 30,100€M; 61% International.
High international procurement: relevant awards in our strategic markets.
FINANCIAL
REINFORCEMENT
1H 2017 Highlights
OPERATIONAL
GROWTH
SHAREHOLDER
REMUNERATION Bonus Share Capital Increase 1x33: Profitability 3% (July 2017).
1H2017 – Presentation of Results
HIGHLIGHTS
OPERATIONAL EVOLUTION
PERFORMANCE BY BUSINESS AREAS
ANNEXES
4
Table of contents

1H2017 – Presentation of Results 5
Operational Evolution (I)
(€ Million) JUN 2017 JUN 2016 Var.
Revenue 1,523 1,414 +8%
International 57% 54% +3 p.p.
EBITDA 191 165 +16%
EBITDA margin 12.5% 11.7% +0.8 p.p.
EBIT 136 116 +17%
Financial Result -88 -106 -17%
Net Profit 60 64 -6%*
Main Figures
(€ Million) JUN 2017 DEC 2016 Var.
Backlog 30,165 25,956 +16%
Net Debt 2,986 3,726 -20%
* Like-for-like, without extraordinary in 2016 = +36%

1H2017 – Presentation of Results 6
Contribution by Activity
REVENUE (1H2017) EBITDA (1H2017)
Operational Evolution (II)
Construction Concessions Services Industrial

1H2017 – Presentation of Results 7
EBITDA
Profitability: Consolidated EBITDA margin 1H2017 = 12.5%
27 22
112
31
39
13
17
191
165
100
Operational Evolution (III)
(€ Million)

1H2017 – Presentation of Results
Operational Evolution (IV)
BACKLOG
INTERNATIONAL FOCUS
CONSTRUCTION CONCESSIONS SERVICES INDUSTRIAL
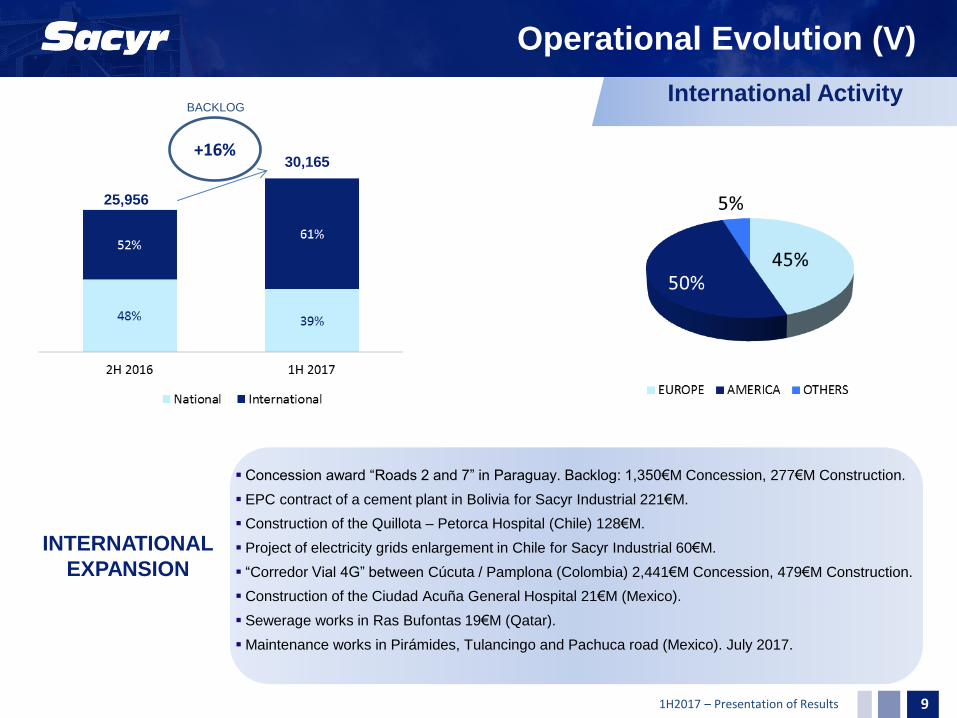
Backlog 1H 2017: 30,165 €M Backlog increase 1H17/2H16 + 16%
International 8 8
1H2017 – Presentation of Results 9
30,165
25,956
+16%
Operational Evolution (V)
Concession award “Roads 2 and 7” in Paraguay. Backlog: 1,350€M Concession, 277€M Construction.
EPC contract of a cement plant in Bolivia for Sacyr Industrial 221€M.
Construction of the Quillota – Petorca Hospital (Chile) 128€M.
Project of electricity grids enlargement in Chile for Sacyr Industrial 60€M.
“Corredor Vial 4G” between Cúcuta / Pamplona (Colombia) 2,441€M Concession, 479€M Construction.
Construction of the Ciudad Acuña General Hospital 21€M (Mexico).
Sewerage works in Ras Bufontas 19€M (Qatar).
Maintenance works in Pirámides, Tulancingo and Pachuca road (Mexico). July 2017.
INTERNATIONAL
EXPANSION
International Activity BACKLOG
1H2017 – Presentation of Results
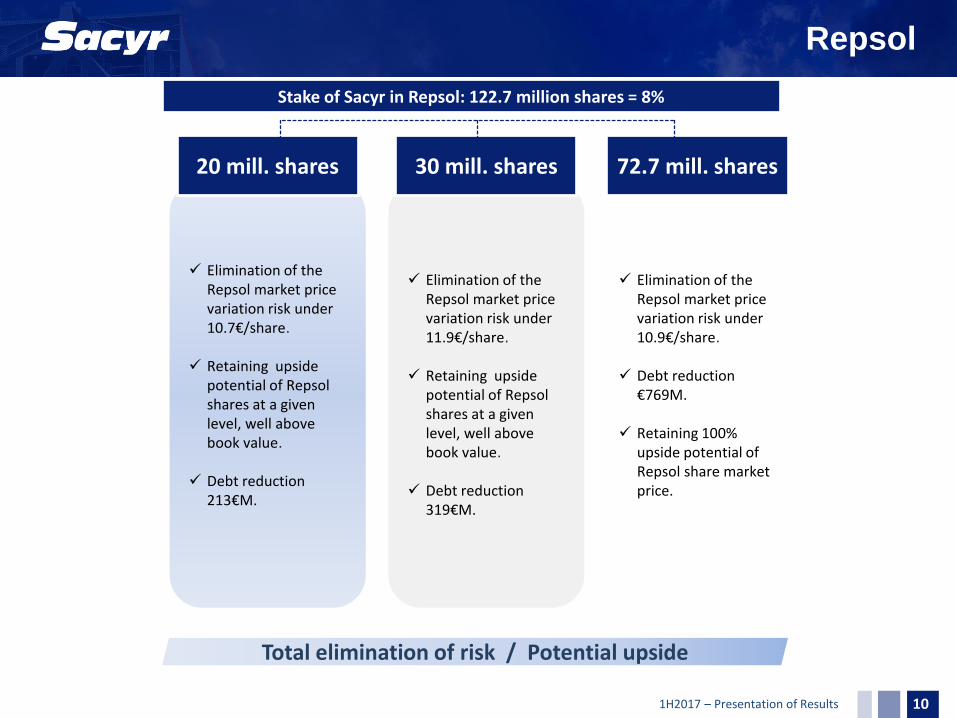
Elimination of the Repsol market price variation risk under 10.7€/share.
Retaining upside
potential of Repsol shares at a given level, well above book value.
Debt reduction
213€M.
20 mill. shares
Repsol
Elimination of the Repsol market price variation risk under 11.9€/share.
Retaining upside
potential of Repsol shares at a given level, well above book value.
Debt reduction
319€M.
30 mill. shares
Elimination of the Repsol market price variation risk under 10.9€/share.
Debt reduction
€769M.
Retaining 100% upside potential of Repsol share market price.
72.7 mill. shares
Stake of Sacyr in Repsol: 122.7 million shares = 8%
Total elimination of risk / Potential upside
10

1H2017 – Presentation of Results
Debt decrease due to
financing flow
(855)
Deuda neta2016
EBITDA Working Capital Otros flujosoperativos + tax
Resultadofinanciero
Inversion Desinversion Repsol Otros +dif.conversión
Deuda neta 1S2017
11
(191)
(22) 83
54
241 (50)
(792)
(63) 2,986
3,726
Debt decrease due to
operative flow
(76)
Debt Evolution
Debt increase due to
Net Investment
191
(€ Million) Net Debt decrease 1H2017 = (740)
Net Debt
2016
Working
Capital
Financial
Result
Investment
Divestment
Other +
translation
differences
Net Debt
1H 2017
Other operative
flows + tax
1H2017 – Presentation of Results
HIGHLIGHTS
OPERATIONAL EVOLUTION
PERFORMANCE BY BUSINESS AREAS
ANNEXES
12
Table of contents

1H2017 – Presentation of Results
Construction
• REVENUE AND EBITDA: sustained growth of the
international activity (+5.7%) and slowdown of the activity
in Spain and Somague.
• BACKLOG: 4,501€M. 43 months of activity. 86% is
international.
• CONTRACT AWARDS:
- Chile: Quillota – Petorca Hospital for an amount of
128€M.
- Paraguay: Roads 2 and 7 for an amount of 277€M.
- Colombia: Corredor vial Cúcuta – Pamplona. Amount
479€M.
- Mexico: Ciudad Acuña General Hospital, Coauitla, for
an amount of 21€M.
- Qatar: Sewerage works of plot QEZ-1, in Ras
Bufontas, for an amount of 19€M.
- Mexico: Road between Pirámides, Tulancingo and
Pachuca. (July 2017).
(€ Million) 1H 2017 1H 2016 Var.
Revenue 632 687 -8%
Sacyr Construcción 530 525 +1%
Somague 102 162 -37%
EBITDA 22 27 -20%
Sacyr Construcción 26 27 -2%
Somague -4 0 n.s.
EBITDA Margin 3.4% 3.9%
Margin Sacyr Construcción 4.9% 5.0%
Margin Somague -4.3% 0.2%
Backlog (1H17/2H16) 4,501 4,131 +9%
% International Backlog 86% 84% +2.p.p
Months of activity 43 36
13

1H2017 – Presentation of Results
Concessions
(€ Million) 1H 2017 1H 2016 Var.
Revenue 260 263 -1%
Construction income 87 118 -26%
Concessions income 174 145 +20%
EBITDA 112 100 +12%
EBITDA Margin 64.3% 68.6%
Backlog (1H17/2H16) 17,126 12,926 +32%
% International Backlog 71% 59% +12.p.p
• CONCESSIONS INCOME: Concessions revenue increase
due to positive evolution of traffic and commissioning of
Valles del Bio-Bio.
• ASSET ROTATION:
– Sale of 49% Ruta del Algarrobo (La Serena -
Vallenar), in Chile, for an EV of 161€M.
– Sacyr Concesiones sales its 4% stake in Tenerife
Tram.
• BACKLOG: 17,126 €M (+32%). 71% international.
• FINANCING CLOSE: Corredor Vial 21 and 24 (Uruguay).
Aprox 76€M.
• CONTRACT AWARDS:
– Paraguay : Roads 2 and 7. Backlog 1,350€M.
– Colombia: Corredor vial Cúcuta – Pamplona.
Backlog 2,441€M. Sacyr Concesiones ranks first in
number of contract awards of the 4G Plan (4
Concessions).
– Mexico: First PPP project (Public Private
Partnership) in the Country: renovation,
maintenance and conservation of 91.5 Km road
between Pirámides, Tulancingo and Pachuca (July
2017).
14
1H2017 – Presentation of Results
Services
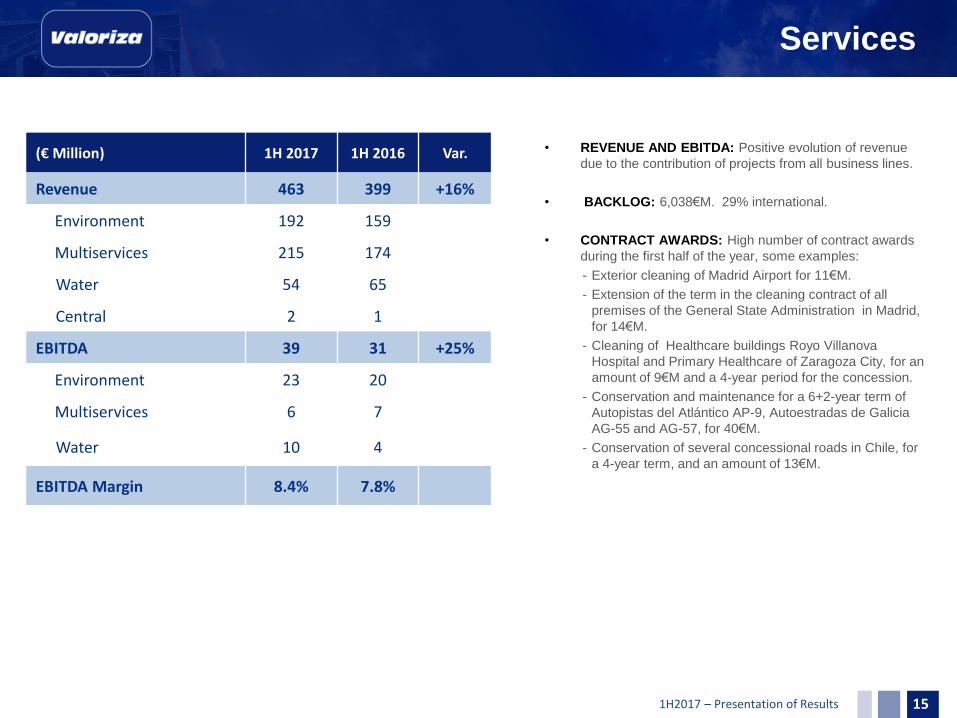
• REVENUE AND EBITDA: Positive evolution of revenue
due to the contribution of projects from all business lines.
• BACKLOG: 6,038€M. 29% international.
• CONTRACT AWARDS: High number of contract awards
during the first half of the year, some examples:
- Exterior cleaning of Madrid Airport for 11€M.
- Extension of the term in the cleaning contract of all
premises of the General State Administration in Madrid,
for 14€M.
- Cleaning of Healthcare buildings Royo Villanova
Hospital and Primary Healthcare of Zaragoza City, for an
amount of 9€M and a 4-year period for the concession.
- Conservation and maintenance for a 6+2-year term of
Autopistas del Atlántico AP-9, Autoestradas de Galicia
AG-55 and AG-57, for 40€M.
- Conservation of several concessional roads in Chile, for
a 4-year term, and an amount of 13€M.
(€ Million) 1H 2017 1H 2016 Var.
Revenue 463 399 +16%
Environment 192 159
Multiservices 215 174
Water 54 65
Central 2 1
EBITDA 39 31 +25%
Environment 23 20
Multiservices 6 7
Water 10 4
EBITDA Margin 8.4% 7.8%
15

1H2017 – Presentation of Results
Industrial
• REVENUE AND EBITDA: Relevant increase of the
activity.
- Integration of EPC Water Contracts (Sohar desalination
plant in Oman).
- Electricity pool price increase. (51.24 €/MW/h)
- Contribution of new Oil & Gas projects, electricity
plants, environment and mining.
• BACKLOG: 2,499€M. +2% increase.
• CONTRACT AWARDS:
- Cement plant in Potosí (Bolivia), for a total amount of
221 €M.
- Enlargement of electricity grids in Chile for an amount
of 60 €M.
(€ Million) 1H 2017 1H 2016 Var.
Revenue 259 188 +38%
Oil & Gas 105 112
Electric Grids 14 14
Environment and Mining 32 9
Water (EPC) 43 0
Power Generation 64 51
Central 1 2
EBITDA 17 13 +30%
EBITDA Margin 6.6% 7.0%
16

1H2017 – Presentation of Results 17
HIGHLIGHTS
OPERATIONAL EVOLUTION
PERFORMANCE BY BUSINESS AREA
ANNEXES
Table of contents

1H2017 – Presentation of Results
Income Statement
18
STATEMENT OF INCOME % chg
(Thousands of Euros) 1H17/1H16
Revenue 1,522,573 1,413,916 7.7%Other income 40,228 47,205 -14.8%Total operating income 1,562,801 1,461,121 7.0%External and Operating Expenses -1,371,973 -1,296,219 5.8%EBITDA 190,828 164,902 15.7%Amortisation and depreciation charge -55,640 -52,659 5.7%Trade Provisions and non recurring items 646 4,223 n.s.NET OPERATING PROFIT 135,834 116,466 16.6%Financial results -87,570 -105,730 -17.2%Forex results -16,944 -2,614 548.2%Results from equity accounted subsidiaries 48,488 73,891 -34.4%Provisions for financial investments -2,874 -2,179 31.9%Change in value of financial instruments 8,435 -14,289 n.s.Results from sales of non current assets 1,836 20,513 -91.0%PROFIT BEFORE TAXES 87,205 86,057 1.3%Corporate Tax -15,705 -15,236 3.1%PROFIT FOR CONTINUING ACTIVITIES 71,501 70,821 1.0%
RESULTS FOR COMPANIES WITH DISCONTINOUS ACTIVITIES 0 0
CONSOLIDATE RESULTS 71,501 70,821 1.0%Minorities -11,111 -6,365 74.6%NET ATTRIBUTABLE PROFIT 60,390 64,456 -6.3%
Gross margin 12.5% 11.7%
1H 2017 1H 2016

1H2017 – Presentation of Results
Consolidated Balance Sheet
19
BALANCE SHEET
(Thousands of Euros)
NON CURRENT ASSETS 6,884,323 7,023,764 -139,441Intangible Assets 13,630 13,044 586Concessions Investments 1,381,610 1,402,267 -20,656Fixed Assets 370,694 363,350 7,344Financial Assets 2,979,500 3,110,156 -130,656Receivables from concession assets 1,715,885 1,712,627 3,258Other non Current Assets 237,587 236,820 767Goodwill 185,416 185,500 -84
CURRENT ASSETS 3,774,844 3,665,181 109,662
Non current assets held for sale 466,558 475,406 -8,849Inventories 197,561 236,121 -38,560Receivables from concession assets 205,638 173,877 31,761Accounts Receivable 2,172,098 2,065,683 106,415Financial Assets 97,509 92,787 4,722Cash 635,480 621,308 14,173
ASSETS = LIABILITIES 10,659,166 10,688,945 -29,779
EQUITY 1,934,368 2,080,399 -146,031Shareholder's Equity 1,617,890 1,791,524 -173,633Minority Interests 316,478 288,875 27,603
NON CURRENT LIABILITIES 5,327,041 5,271,628 55,413Financial Debt 2,851,318 3,605,678 -754,360Financial Instruments at fair value 188,346 185,829 2,517Provisions 375,486 370,428 5,058Other non current Liabilities 498,076 491,399 6,677Other hedged debt 1,413,816 618,294 795,522
CURRENT LIABILITIES 3,397,757 3,336,918 60,839Liabilities associated with the non current assets held for sale 194,188 203,042 -8,854Financial Debt 867,951 829,062 38,889Financial Instruments at fair value 19,146 21,375 -2,229Trade Accounts Payable 1,487,348 1,550,211 -62,863Operating Provisions 219,862 220,778 -916Other current liabilities 609,261 512,450 96,811
Chg 1H171H 2017 DEC 2016

1H2017 – Presentation of Results
Income Statement by Line of Business 1H 2017
20
CONSOLIDATED INCOME STATEMENT AS OF JUNE 2017
(Thousands of Euros) ConstrucciónSacyr
ConcesionesValoriza
Sacyr
Industrial
Holding and
AdjustmentsTOTAL
Turnover 631,533 260,480 463,185 259,356 -91,981 1,522,573
Other Sales 30,320 4,018 5,234 1,936 -1,280 40,228
Total Income 661,853 264,498 468,420 261,293 -93,262 1,562,801
External and Operating Expenses -640,341 -152,827 -429,705 -244,118 95,017 -1,371,973
GROSS OPERATING PROFIT 21,512 111,671 38,715 17,175 1,755 190,828
Depreciation -8,556 -23,199 -18,396 -4,482 -1,008 -55,640
Trade Provisions and non recurring items 7,171 -4,550 -1,787 -194 6 646
NET OPERATING PROFIT 20,127 83,922 18,532 12,499 753 135,834
Financial results -509 -50,584 -5,312 -1,858 -29,308 -87,570
Forex results -7,104 1,764 -37 -574 -10,993 -16,944
Results from equity accounted subsidiaries 2,151 4,090 2,977 35 39,235 48,488
Provisions for financial investments 354 -2,902 -332 513 -506 -2,874
Change in value of financial instruments at fair value 0 -8,990 -1,597 -561 19,583 8,435
Results from sales of non current assets 1,632 30 163 -77 88 1,836
PROFIT BEFORE TAXES 16,651 27,330 14,394 9,978 18,852 87,205
Corporate Tax -10,660 -9,030 -4,134 -2,239 10,358 -15,705
PROFIT FOR CONTINUING ACTIVITIES 5,991 18,299 10,260 7,739 29,211 71,501
PROFIT FOR DISCONTINUING ACTIVITIES 0 0 0 0 0 0
CONSOLIDATE RESULTS 5,991 18,299 10,260 7,739 29,211 71,501
Minorities 1 -9,123 282 -2,418 147 -11,111
NET ATTRIBUTABLE PROFIT 5,992 9,177 10,542 5,321 29,358 60,390
1H2017 – Presentation of Results
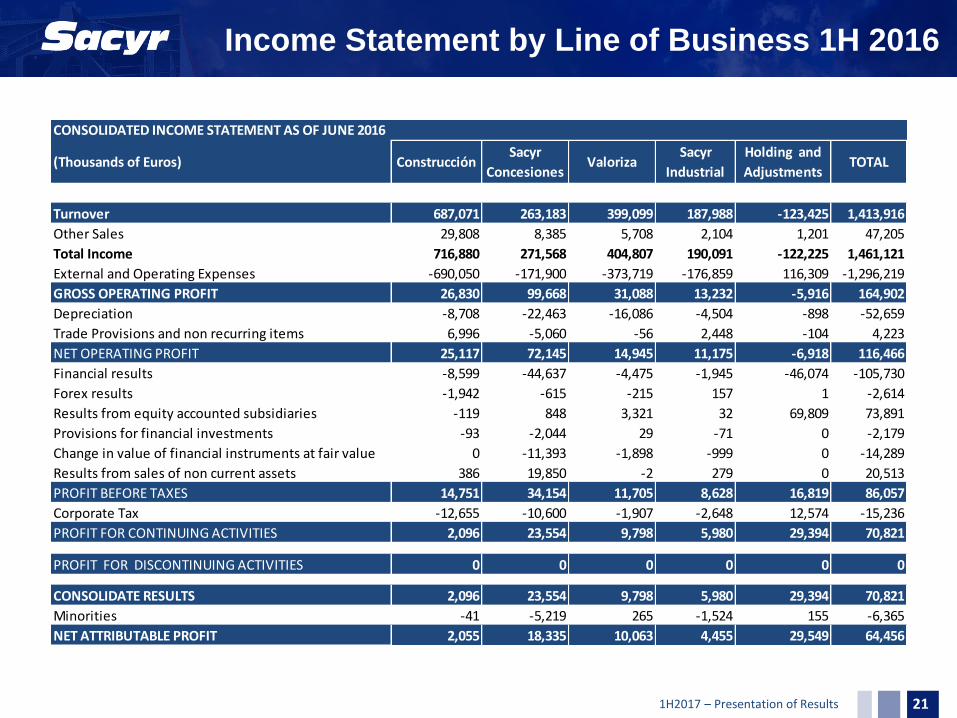
Income Statement by Line of Business 1H 2016
21
CONSOLIDATED INCOME STATEMENT AS OF JUNE 2016
(Thousands of Euros) ConstrucciónSacyr
ConcesionesValoriza
Sacyr
Industrial
Holding and
AdjustmentsTOTAL
Turnover 687,071 263,183 399,099 187,988 -123,425 1,413,916
Other Sales 29,808 8,385 5,708 2,104 1,201 47,205
Total Income 716,880 271,568 404,807 190,091 -122,225 1,461,121
External and Operating Expenses -690,050 -171,900 -373,719 -176,859 116,309 -1,296,219
GROSS OPERATING PROFIT 26,830 99,668 31,088 13,232 -5,916 164,902
Depreciation -8,708 -22,463 -16,086 -4,504 -898 -52,659
Trade Provisions and non recurring items 6,996 -5,060 -56 2,448 -104 4,223
NET OPERATING PROFIT 25,117 72,145 14,945 11,175 -6,918 116,466
Financial results -8,599 -44,637 -4,475 -1,945 -46,074 -105,730
Forex results -1,942 -615 -215 157 1 -2,614
Results from equity accounted subsidiaries -119 848 3,321 32 69,809 73,891
Provisions for financial investments -93 -2,044 29 -71 0 -2,179
Change in value of financial instruments at fair value 0 -11,393 -1,898 -999 0 -14,289
Results from sales of non current assets 386 19,850 -2 279 0 20,513
PROFIT BEFORE TAXES 14,751 34,154 11,705 8,628 16,819 86,057
Corporate Tax -12,655 -10,600 -1,907 -2,648 12,574 -15,236
PROFIT FOR CONTINUING ACTIVITIES 2,096 23,554 9,798 5,980 29,394 70,821
PROFIT FOR DISCONTINUING ACTIVITIES 0 0 0 0 0 0
CONSOLIDATE RESULTS 2,096 23,554 9,798 5,980 29,394 70,821
Minorities -41 -5,219 265 -1,524 155 -6,365
NET ATTRIBUTABLE PROFIT 2,055 18,335 10,063 4,455 29,549 64,456

1H2017 – Presentation of Results
Balance Sheet by Line of Business 1H 2017
22
CONSOLIDATED BALANCE SHEET AS OF JUNE 2017
(Thousands of Euros) ConstrucciónSacyr
ConcesionesValoriza
Sacyr
Industrial
Holding y
AjustesTOTAL
NON CURRENT ASSETS 369,867 3,192,540 745,365 193,426 2,383,125 6,884,323
Intangible Assets 701 60 9,613 1,773 1,484 13,630
Concessions Investments 49,623 1,081,831 250,156 0 0 1,381,610
Fixed Assets 116,181 2,596 145,695 102,407 3,814 370,694
Financial Assets 166,275 311,014 102,968 21,417 2,377,827 2,979,500
Receivables for concession assets 18,604 1,562,047 135,235 0 0 1,715,885
Other non Current Assets 0 234,993 2,594 0 0 237,587
Goodwill 18,482 0 99,104 67,829 0 185,416
CURRENT ASSETS 2,328,095 951,760 513,050 369,574 -387,634 3,774,844
Non current assets held for sale 0 280,208 0 0 186,349 466,558
Inventories 148,178 286 27,307 20,473 1,316 197,561
Receivables for concession assets 39 203,052 2,547 0 0 205,638
Accounts Receivable 1,535,555 150,928 311,890 227,386 -53,661 2,172,098
Financial Assets 501,517 7,485 100,466 17,716 -529,676 97,509
Cash 142,805 309,800 70,839 103,999 8,037 635,480
ASSETS = LIABILITIES 2,697,961 4,144,300 1,258,415 563,000 1,995,490 10,659,166
Equity 477,968 878,956 280,143 140,388 156,913 1,934,368
Shareholder's Equity 482,050 615,706 271,115 88,383 160,636 1,617,890
Minority Interests -4,082 263,250 9,029 52,004 -3,723 316,478
NON CURRENT LIABILITIES 681,743 2,573,676 579,705 71,321 1,420,596 5,327,041
Financial Debt 206,274 1,883,311 282,196 41,281 438,255 2,851,318
Financial Instruments at fair value -69 143,399 15,967 873 28,175 188,346
Provisions 356,183 89,537 114,014 10,800 -195,049 375,486
Other non current Liabilities 119,355 457,428 167,527 18,366 -264,601 498,076
Other hedged debt 0 0 0 0 1,413,816 1,413,816
CURRENT LIABILITIES 1,538,250 691,668 398,567 351,291 417,981 3,397,757
Liabilities associated with the non current assets held for sale 0 0 0 0 194,188 194,188
Financial Debt 205,274 353,420 98,609 44,695 165,953 867,951
Financial instruments at fair value 0 16,752 1,461 933 0 19,146
Trade Accounts Payable 794,583 236,096 134,979 245,764 75,926 1,487,348
Operating Provisions 78,933 16,199 26,550 4,547 93,633 219,862
Other current liabilities 459,460 69,201 136,967 55,353 -111,719 609,261

1H2017 – Presentation of Results
Balance Sheet by Line of Business 2H 2016
23
CONSOLIDATED BALANCE SHEET AS OF DECEMBER 2016
(Thousands of Euros) ConstrucciónSacyr
ConcesionesValoriza
Sacyr
Industrial
Holding y
AjustesTOTAL
NON CURRENT ASSETS 363,685 3,200,814 716,131 191,383 2,551,750 7,023,764
Intangible Assets 633 47 9,083 1,961 1,320 13,044
Concessions Investments 50,405 1,091,406 260,455 0 0 1,402,267
Fixed Assets 118,270 3,105 135,638 102,192 4,145 363,350
Financial Assets 157,156 281,039 106,275 19,401 2,546,285 3,110,156
Receivables for concession assets 18,738 1,591,154 102,735 0 0 1,712,627
Other non Current Assets 0 234,063 2,757 0 0 236,820
Goodwill 18,482 0 99,188 67,829 0 185,500
CURRENT ASSETS 2,345,295 857,383 600,220 258,789 -396,505 3,665,181
Non current assets held for sale 0 279,928 0 0 195,478 475,406
Inventories 154,128 17,278 40,359 23,441 915 236,121
Receivables for concession assets 0 170,040 3,837 0 0 173,877
Accounts Receivable 1,536,256 104,884 346,959 174,660 -97,076 2,065,683
Financial Assets 506,616 6,321 74,628 8,366 -503,145 92,787
Cash 148,295 278,931 134,437 52,322 7,323 621,308
ASSETS = LIABILITIES 2,708,980 4,058,197 1,316,351 450,172 2,155,245 10,688,945
Equity 510,109 863,066 270,669 133,573 302,983 2,080,399
Shareholder's Equity 514,341 633,437 260,885 84,535 298,326 1,791,524
Minority Interests -4,233 229,629 9,784 49,037 4,657 288,875
NON CURRENT LIABILITIES 659,964 2,510,324 573,885 58,947 1,468,509 5,271,628
Financial Debt 203,075 1,876,519 273,310 40,689 1,212,085 3,605,678
Financial Instruments at fair value -24 132,374 17,506 1,133 34,840 185,829
Provisions 343,042 92,128 115,759 2,808 -183,310 370,428
Other non current Liabilities 113,871 409,303 167,309 14,317 -213,401 491,399
Other hedged debt 0 0 0 0 618,294 618,294
CURRENT LIABILITIES 1,538,907 684,807 471,797 257,653 383,753 3,336,918
Liabilities associated with the non current assets held for sale 0 0 0 0 203,042 203,042
Financial Debt 218,572 341,528 95,486 61,375 112,099 829,062
Financial instruments at fair value 0 19,033 1,326 1,015 0 21,375
Trade Accounts Payable 880,389 231,396 226,281 151,916 60,229 1,550,211
Operating Provisions 96,420 5,540 21,599 3,586 93,633 220,778
Other current liabilities 343,526 87,309 127,104 39,761 -85,250 512,450

1H2017 – Presentation of Results
€ Million 1H 2017 1Q 2017 VAR. 2Q 2017
Project Finance 2,214 2,214 0
Other business lines debt 238 256 -18
Total Business Lines 2,452 2,470 -18
Corporate Bank Borrowings 187 188 -1
Capital Markets 347 357 -10
Total Corporate 534 545 -11
Repsol 0 773 -773
NET DEBT 2,986 3,788 -802
Net Financial Debt
24
1H2017 – Presentation of Results
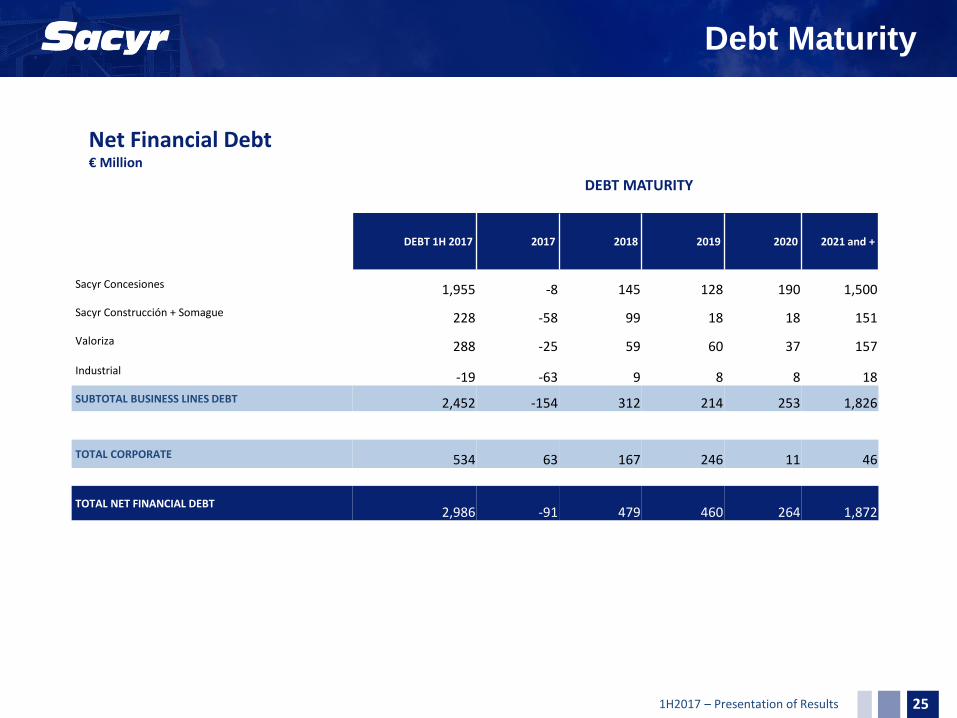
Debt Maturity
DEBT MATURITY
DEBT 1H 2017 2017 2018 2019 2020 2021 and +
Sacyr Concesiones 1,955 -8 145 128 190 1,500
Sacyr Construcción + Somague 228 -58 99 18 18 151
Valoriza 288 -25 59 60 37 157
Industrial -19 -63 9 8 8 18
SUBTOTAL BUSINESS LINES DEBT 2,452 -154 312 214 253 1,826
TOTAL CORPORATE 534 63 167 246 11 46
TOTAL NET FINANCIAL DEBT 2,986 -91 479 460 264 1,872
Net Financial Debt € Million
25 25

1H2017 – Presentation of Results
SHADOW TOLL HIGHWAY SPAIN
- AUTOVIA DEL NOROESTE
- Ma-15 PALMA-MANACOR
- AS-II OVIEDO-GIJÓN (VIASTUR)
- AUTURSA CV-35
- ERESMA
- BARBANZA
- ARLANZON
TOLL HIGHWAY SPAIN
- AP-46 MÁLAGA - LAS PEDRIZAS
TOLL HIGHWAY OTHER COUNTRIES
- N6 GALWAY-BALLINASLOE
- VALLES DEL DESIERTO
- R-1 RUTAS DEL DESIERTO
- R-16 RUTAS DEL DESIERTO
- RUTAS DEL ALGARROBO RG- III
- RUTAS DEL ALGARROBO RG-IV
- VALLES DEL BIO-BIO - HUINANCO (4)
- VALLES DEL BIO-BIO - PUENTES NEGROS (4)
- MONTES DE MARÍA - EL CALAMAR
- MONTES DE MARÍA - EL CARMEN
- UNIÓN VIAL DEL SUR
- DESARROLLO VIAL AL MAR
24,321 22,587 7.7%23,831 23,050 3.4%
ACCUMULATED ADT
1H 2017 1H 2016 Var.
12,364 11,600 6.6%
12,892 12,204 5.6%20,196 19,080 5.8%
39,162 37,907 3.3%7,960 7,448 6.9%
4,900 4,872 0.6%5,766 5,796 -0.5%
11,447 10,383 10.2%
11,001 10,530 4.5%
4,620 3,268 41.4%
2,680 2,706 -1.0%
7,160 7,027 1.9%4,402 4,410 -0.2%
8,793
2,448
-
-
Note: Highways with no data in accumulated ADT 1H2016 are concessions with less than 12 months into operation.
3,561 3,415 4.3%5,939 5,957 -0.3%7,162 -
Increase of weighted ADT in Spain +5.56%
Concessions: Traffic
26

1H2017 – Presentation of Results
Concessions: Revenue Breakdown
27
(€ Thousands) 1H 2017 1H 2016 Var. (%)
AUTOVÍA DEL TURIA 6,748 6,094 10.7%
AUTOVÍA NOROESTE C.A.R.M. 3,548 4,105 -13.6%
VIASTUR 3,642 3,517 3.6%
PALMA MANACOR 5,317 4,928 7.9%
AUTOVÍA DEL BARBANZA 5,755 5,458 5.4%
AUTOVÍA DEL ERESMA 3,469 3,210 8.1%
AUTOVÍA DEL ARLANZÓN 17,008 15,046 13.0%
INTERCAMBIADOR DE MONCLOA 5,866 5,926 -1.0%
INTERCAMBIADOR DE PLAZA ELÍPTICA 3,172 3,203 -1.0%
AUTOPISTA DE GUADALMEDINA 6,510 5,821 11.8%
HOSPITAL DE PARLA 6,766 7,863 -14.0%
HOSPITAL DE COSLADA 7,293 7,111 2.6%
HOLDINGS 1,573 1,844 -14.7%AEROPUERTO DE MURCIA CONCESIONARIA -1
SPAIN 76,665 74,125 3.4%
HOLDINGS 631 559 12.9%
IRELAND 631 559 12.9%
HOSPITAL BRAGA - 1,239 -100.0%
HOSPITAL DE VILA FRANCA - 1,285 -100.0%
PARQUE DO NOVO HOSPITAL - 155 -100.0%
HOLDINGS 446 586 -23.9%
ESCALA PARQUE - 327 -100.0%
PORTUGAL 446 3,592 -87.6%
HOLDINGS 814 659 23.4%
RUTAS DEL DESIERTO - ACCESOS A IQUIQUE 10,552 9,605 9.9%
VALLES DEL BIO BIO - CONCEPCIÓN CABRERO 17,941 9,091 97.4%
VALLES DEL DESIERTO - VALLENAR CALDERA 11,612 11,323 2.6%
RUTA 43 - LIMARI 1,515 734 106.4%
HOSPITAL ANTOFAGASTA 10,873 5,476 98.6%
SERENA VALLENAR - RUTAS DEL ALGARROBO 15,320 13,852 10.6%
CHILE 68,626 50,739 35.3%
CONVIAL SIERRA NORTE 6,321 7,297 -13.4%
PERU 6,321 7,297 -13.4%
HOLDINGS 427 - n/aMONTES DE MARÍA 10,276 5,631 82.5%RUMICHACA 10,267 3,381 203.7%
COLOMBIA 20,969 9,012 132.7%
HOLDINGS 11 - n/aRUTAS DEL LITORAL 18 - n/a
URUGUAY 28 - n/a
RUTAS DEL ESTE 11 - n/a
PARAGUAY 11 - n/a
TOTAL WITHOUT CONSTRUCTION INCOME 173,698 145,322 19.5%
CONSTRUCTION INCOME 86,782 117,861 -26.4%
TOTAL 260,480 263,183 -1.0%
REVENUE

1H2017 – Presentation of Results
Alternative Performance Measures
28
The Sacyr Group presents its earnings in accordance with International Financial Reporting Standards (IFRS). The Group also provide certain additional financial
measurements, known as Alternative Performance Measures (APMs) used by management in decision-making and evaluation of the Group's financial performance, cash
flows and financial position.
In order to comply with the Guidelines on Alternative Performance Measures (2015/1415en) published by the European Securities and Markets Authority (ESMA), the
disclosures required for each APM are set out below, including its definition, reconciliation, explanation of its use, comparatives and consistency.
Sacyr Group considers that this additional information will improve the comparability, reliability and comprehensibility of its financial information. ALTERNATIVE PERFORMANCE MEASURES EBITDA: this indicator shows operating profit or loss prior to depreciation and amortisation and any change in provisions , excluding extraordinary/non-recurring profits and
losses.
EBIT: Calculated as the difference between Operating income (Revenue, Own work capitalized, Other operating income, Government grants released to the income statement)
and Operating expenses (Staff costs, Depreciation and amortisation expense, Changes in provisions and Other). GROSS DEBT: Comprises Non-current financial debt and Current financial debt as shown on the liabilities side of the consolidated statement of financial position, which include
bank borrowings and issues in capital markets (bonds). NET DEBT: Calculated as Gross debt less Other current financial assets and Cash and cash equivalents, from the asset side of the consolidated statement of financial position.
PROJECT FINANCE DEBT (GROSS OR NET): The financial debt (gross or net) from project companies. In this type of debt, the guarantee received by the lender is limited to the
project cash flow and its asset value, with limited recourse to shareholders. CORPORATE DEBT (GROSS OR NET): Debt held by the Group's Parent, comprising bank borrowings and issues in capital markets.
FINANCIAL RESULT: The difference between Total finance income and Total finance costs.
BACKLOG: Value of awarded and closed work contracts pending completion. These contracts are included in the backlog once they are formalised. The backlog is shown as
the percentage attributable to the Group, as per the corresponding consolidation method.
Once a contract has been included in the backlog, the value of production pending completion on the contract remains in the backlog, until it is completed or cancelled.
Nevertheless, valuation adjustments are made to reflect any changes in prices and time periods agreed with the client. Due to a number of factors, all or part of the backlog
linked to a contract may not actually become income. The Group's backlog is subject to adjustments and cancellation of projects, and cannot be taken as an exact indicator of
future earnings.
Given that no comparable financial measure is foreseen under IFRS, a reconciliation with the financial statements is not possible.
Management considers that the backlog is a useful indicator of the Group's future revenues and a customary indicator used by companies in the sector in which Sacyr
operates.
The concessions backlog represents estimated future revenues on concessions, over the concession period, based on the financial plan for each concession, and includes
projected fluctuations in the exchange rate between the euro and other currencies, as well as changes in inflation, prices, tolls and traffic volumes.
MARKET CAP: Number of shares at the end of the accounting period, multiplied by the share price at the end of the accounting period .
LIKE-FOR-LIKE BASIS: On occasions, certain figures are corrected to permit a comparison between accounting periods, for example, by eliminating non-recurring
impairment, significant changes in the consolidation scope that could distort the year-on-year comparison of indicators such as sales, the effect of exchange rates, etc. In
each case, details are provided in the notes to the corresponding item .
ADT: Defined as the total number of users of a concession during a day. ADT is normally calculated as the total number of vehicles travelling on the motorway each day

1H2017 – Presentation of Results
NOTE: The financial information contained in this document is drafted according to the International Financial Reporting
Standards. This information has not been audited and therefore may be modified in the future. This document is not a offer,
invitation or recommendation to buy, sell or exchange shares or make any kind of investment. Sacyr does not assume any
type of damages or losses as a result of the use of this document or its content.
In addition, the Group uses Alternative Performance Measures to provide with additional information which enhances the
comparability and comprehension of its financial information and facilitate the decision-making and the evaluation of the
group´s performance.
To comply with the Directives (2015/1415es) of European Securities and Markets Authority (ESMA) on APMs, this
document comprises the more outstanding APMs used in the preparation of this document (Annex).