preparing the financial case for hospital support asa practice management conference 2008 joe laden...
TRANSCRIPT
Preparing the
Financial CaseFor
Hospital SupportASA Practice Management Conference 2008
Joe Laden & Michael J. Monea

Michael J. Monea, President Central Anesthesia Management Services, Inc.
Past Director, KOAMA
Joe LadenBusiness Manager
Anesthesia Associates of Louisville, PSCDirector, KOAMA
Member MGMA/[email protected]

KOAMA KOAMA Kentucky / Ohio Anesthesia Kentucky / Ohio Anesthesia
Managers AssociationManagers Association
Mission Statement:Mission Statement:
““Define and Implement Best Practices Define and Implement Best Practices for the Financial Management of for the Financial Management of
Anesthesiology Groups”Anesthesiology Groups”

The OR Utilization SpreadsheetsThe OR Utilization Spreadsheets
ASA NewsletterASA NewsletterPractice Management DepartmentPractice Management Department
June 2004June 2004September 2004September 2004
June 2007June 2007
Spreadsheets can be downloaded from these Spreadsheets can be downloaded from these articles on ASA Web Site articles on ASA Web Site
Phases of Hospital SupportPhases of Hospital Support
Friendly Support RequestFriendly Support Request
Detailed Justification Required Detailed Justification Required
Hospital PushbackHospital Pushback
The cost of providing the service exceeds the revenue of delivery that service, and
The group is providing that service as cost-effectively as is reasonable, and
When the failure to secure that support would imminently jeopardize the ability of the group to provide that service.
When To Consider Hospital Support

Metrics that may indicate a subsidy is needed
Payer MixPayer MixPayments per unit Payments per unit < $36/unit< $36/unitMedicare/Medicaid/IndigentMedicare/Medicaid/Indigent > 40%> 40%
Hospital EfficiencyHospital EfficiencyOR Utilization OR Utilization < 75%< 75%Revenue per ORRevenue per OR < $450,000< $450,000
MD Compensation MD Compensation below regional median below regional median
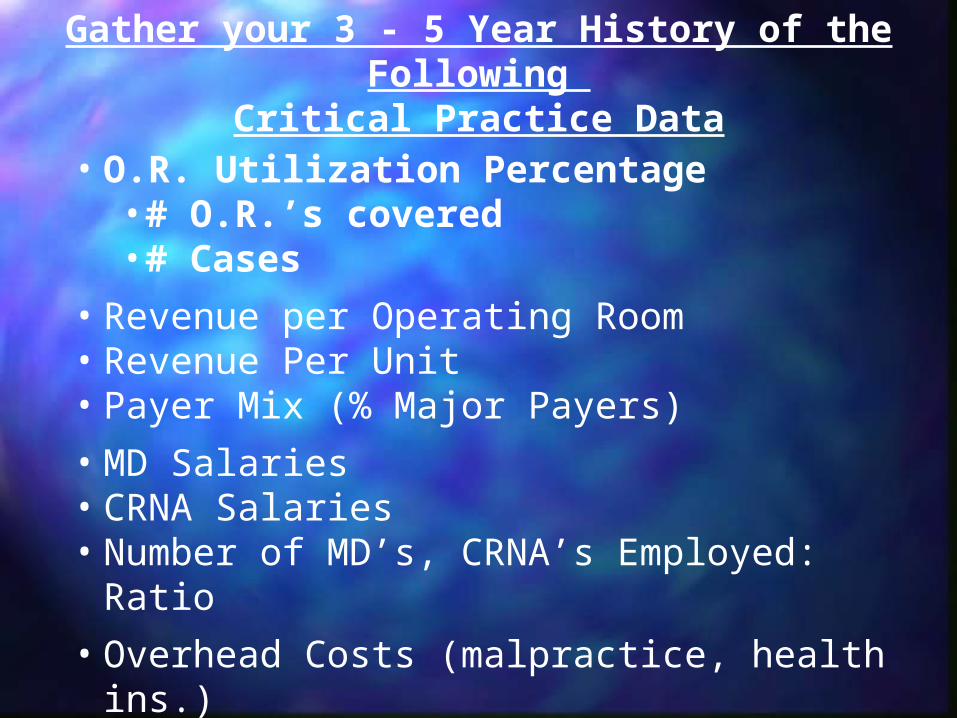
• O.R. Utilization Percentage • # O.R.’s covered• # Cases
• Revenue per Operating Room• Revenue Per Unit• Payer Mix (% Major Payers)• MD Salaries• CRNA Salaries• Number of MD’s, CRNA’s Employed: Ratio• Overhead Costs (malpractice, health ins.)
Gather your 3 - 5 Year History of the Following Critical Practice Data

YearRevenue Per Revenue Per
ORORRevenue per Revenue per
UnitUnitHours Billed Hours Billed
Per ORPer OR
Average Average Case Case
LengthLength OR UtilizationOR Utilization OR's OR's Personnel Cost Personnel Cost
Per ORPer OR
2007 $465,000 $38.74 1,725 1.7 64.5% 21 $525,000
2006$472,00
0 $39.65 1,775 1.6 68.3% 20 $500,000
2005 $481,600 $40.10 1,760 1.5 69.8% 20 $475,000
2004 $484,300 $40.95 1,840 1.4 72.7% 19 $450,000
2003 $487,000 $41.20 1,820 1.4 73.0% 19 $425,000
When is the Subsidy Needed?Support Crossover Point -- Example

Verify Your Data Against Benchmark Data


MGMA Physician Compensation (W-2Wages)MGMA Physician Compensation (W-2Wages)2006 Data - 3,505 Anesthesiologists2006 Data - 3,505 Anesthesiologists
Median Compensation $365,409
Eastern $375,000
Midwest $393,931
Southern $386,238
Western $326,346
Median Gross Charges per MD $1,016,993
Median Collections per MD $468,410
Median Cases Per MD 961

W-2 Wages 350,000
Retirement Plan Contribution 45,000Professional Liability Insurance 18,500Health Insurance 14,000Disability Insurance 12,000Other Insurance (dental, life, etc) 1,000Professional Meeting and Expense 3,500Employer FICA & Medicare Tax 10,655
Total Benefits, Malpractice and Tax 104,655
Total MD Compensation 454,655
Anesthesiologist Total Compensation

Base Salary 120,000Overtime & Call Pay 15,000Retirement Plan Contribution 20,250Professional Liability Insurance 2,500Health Insurance 14,000Disability Insurance 3,500Other Insurance (dental, life, etc) 1,500Professional Meeting and Expense 2,000Employer FICA & Medicare Tax 7,320
Total Benefits, Malpractice and Tax 51,070
Total CRNA Compensation 171,070
CRNA Total Compensation

Year W-2
Compensation2002 $306,9642003 $323,4912004 $325,9992005 $359,6992006 $365,409
MGMA Compensation and Production Survey 2007


Total Stipend Per Anesthetizing LocationMedian 54,18425th %ile 23,09275th %ile 92,90890th %ile 150,042
Total Stipends/Trauma CenterMedian 1,040,336
MGMA/ASA Cost Survey for Anesthesia and Pain MGMA/ASA Cost Survey for Anesthesia and Pain Management Practices 2006 Data - 117 PracticesManagement Practices 2006 Data - 117 Practices

Units Per MD Median 10,20675th %ile 13,85895th %ile 18,977
Collections Per UnitMedian $38.8825th %ile $34.0575th %ile $51.77
Weeks Worked/Year Median 44Hours Worked/Week Median 46
MGMA Physician Production SurveyMGMA Physician Production Survey2006 Data - 3,505 Anesthesiologists2006 Data - 3,505 Anesthesiologists

Your Practice vs. MGMA – Explain Difference

What happens when the CRNA:MD ratio changes?

IMPACT ON MD COMPENSATION BY CHANGING THE PHYSICIAN : CRNA RATIO
OR's to Cover 24
MD Total Comp. $450,000 $460,000 $470,000 $475,000 $500,000 $525,000CRNA Total Comp. $172,000 $174,000 $177,000 $180,000 $185,000
MD's 30 26 22 18 14 10CRNA's 0 6 12 18 24 30 MD Cost $13,500,000 $11,960,000 $10,340,000 $8,550,000 $7,000,000 $5,250,000CRNA Cost $0 $1,032,000 $2,088,000 $3,186,000 $4,320,000 $5,550,000 Total Cost $13,500,000 $12,992,000 $12,428,000 $11,736,000 $11,320,000 $10,800,000 Personnel Cost / OR $562,500 $541,333 $517,833 $489,000 $471,667 $450,000

SubsidySubsidy Types Types O.R revenue guarantee vs. collectionsO.R revenue guarantee vs. collections
Payer mix subsidy (guarantee / unit)Payer mix subsidy (guarantee / unit)
MD salary guaranteeMD salary guarantee
Negotiated amount with Negotiated amount with escalator/descelatorescalator/descelator
Fixed amount for call, OB, Medical Fixed amount for call, OB, Medical DirectorDirector
Guarantee for new anesthetizing locationsGuarantee for new anesthetizing locations

Hospital / Consultant Analysis of Your Proposal and Verification of Your Data
O.R. Utilization including Turnover Time
MD / CRNA W-2’s & Benefits – Individual and Average MD / CRNA weeks worked per year MD hours in hospital per week MD call frequency / days off after call MD : CRNA Ratio
Billing and collection statistics & audit Negotiated payer rates O.R Staffing Model
Locum use Governance

Your Practice Parameters That May Be Challenged
• Number of MD/CRNA’s needed to staff facility utilization a reasonable efficiency model• MD:CRNA Ratio
• Anesthesiologist FTE Comp (50th , 75th, 90th %ile)• MD weeks of vacation• Days off after call / late call• Anesthesiologists hours worked per week
• Production per physician (cases & units)

KOAMA OR Utilization SpreadsheetKOAMA OR Utilization Spreadsheet
