preparing for the challenges and opportunities of the common core state standards willard r....
TRANSCRIPT

Preparing for the Challenges and Opportunities of the
Common Core State Standards Willard R. Daggett, CEO
April 18, 2012

• 5-year study with CCSSO and Gates Foundation
Point of Reference

• 5-year study with CCSSO and Gates Foundation • Rigor and Relevance Framework became
framework for CCSS and NGA
Point of Reference

• 5-year study with CCSSO and Gates Foundation • Rigor and Relevance Framework became
framework for CCSS and NGA• Race to the Top
Point of Reference

• 5-year study with CCSSO and Gates Foundation • Rigor and Relevance Framework became
framework for CCSS and NGA• Race to the Top• Private sector initiatives
Point of Reference

• 5-year study with CCSSO and Gates Foundation
Point of Reference

School Improvement
Schools are Improving

Schools are Improving
School Improvement
Changing World

Skills Gap

School Improvement
Changing World
Schools are Improving

School Improvement
Changing World
Schools are Improving

School
Impro
vement
Changing World
Schools are Improving


Organ
izational
Lead
ersh
ip
StudentAchievement

Organ
izational
Lead
ersh
ip
StudentAchievement

Teaching
Organ
izational
Lead
ersh
ipInstructional
Leadership
Student Achievement

Teaching
Organ
izational
Lead
ersh
ipInstructional
Leadership
Student Achievement

Teaching
Organ
izational
Lead
ersh
ipInstructional
Leadership
Student Achievement

Teaching
Organ
izational
Lead
ersh
ipInstructional
Leadership
Student Achievement

Rigor and Relevance
Teaching

Common Core State Standards
• Fewer• Higher

2011 TN state reading test (grades 3-8) and NAEP
Group TN State 2011 P&A
NAEP 2011 P&A
Point Spread
Grade 4 44.7% 26.0% 18.7%
Grade 8 45.3% 27.0% 18.3%

Common Core State Standards
• Fewer• Higher•Different

Common Core State Standards
• Content VS.•Instruction

Application Model1. Knowledge in one discipline2. Application within discipline3. Application across disciplines4. Application to real-world predictable
situations5. Application to real-world unpredictable
situations

Knowledge Taxonomy1. Awareness2. Comprehension 3. Application4. Analysis5. Synthesis 6. Evaluation

1 2 3 4 5
Bloom’sBloom’s
CC DD
AA BB
456
321
ApplicationApplication
Levels

1
2
3
4
5
6
1 2 3 4 5
A B
DC
Rigor/Relevance Framework
• Express probabilities as fractions, percents, or decimals.
• Classify triangles according to angle size and/or length of sides.
• Calculate volume of simple three- dimensional shapes.
• Given the coordinates of a quadrilateral, plot the quadrilateral on a grid.
• Analyze the graphs of the perimeters and areas of squares having different-length sides.
• Determine the largest rectangular area for a fixed perimeter.
• Identify coordinates for ordered pairs that satisfy an algebraic relation or function.
• Determine and justify the similarity or congruence for two geometric shapes.
• Obtain historical data about local weather to predict the chance of snow, rain, or sun during year.
• Test consumer products and illustrate the data graphically.
• Plan a large school event and calculate resources (food, decorations, etc.) you need to organize and hold this event.
• Make a scale drawing of the classroom on grid paper, each group using a different scale.
• Calculate percentages of advertising in a newspaper.
• Tour the school building and identify examples of parallel and perpendicular lines, planes, and angles.
• Determine the median and mode of real data displayed in a histogram
• Organize and display collected data, using appropriate tables, charts, or graphs.

1
2
3
4
5
6
1 2 3 4 5
A B
DC• Analyze the graphs of the
perimeters and areas of squares having different-length sides.
• Determine the largest rectangular area for a fixed perimeter.
• Identify coordinates for ordered pairs that satisfy an algebraic relation or function.
• Determine and justify the similarity or congruence for two geometric shapes.
• Obtain historical data about local weather to predict the chance of snow, rain, or sun during year.
• Test consumer products and illustrate the data graphically.
• Plan a large school event and calculate resources (food, decorations, etc.) you need to organize and hold this event.
• Make a scale drawing of the classroom on grid paper, each group using a different scale.
• Calculate percentages of advertising in a newspaper.
• Tour the school building and identify examples of parallel and perpendicular lines, planes, and angles.
• Determine the median and mode of real data displayed in a histogram
• Organize and display collected data, using appropriate tables, charts, or graphs.
•Express probabilities as fractions, percents, or decimals.
•Classify triangles according to angle size and/or length of sides.
•Calculate volume of simple three- dimensional shapes.
•Given the coordinates of a quadrilateral, plot the quadrilateral on a grid.
Rigor/Relevance Framework

1
2
3
4
5
6
1 2 3 4 5
A B
DC• Express probabilities as fractions,
percents, or decimals.• Classify triangles according to angle
size and/or length of sides.• Calculate volume of simple three-
dimensional shapes.• Given the coordinates of a
quadrilateral, plot the quadrilateral on a grid.
• Analyze the graphs of the perimeters and areas of squares having different-length sides.
• Determine the largest rectangular area for a fixed perimeter.
• Identify coordinates for ordered pairs that satisfy an algebraic relation or function.
• Determine and justify the similarity or congruence for two geometric shapes.
• Obtain historical data about local weather to predict the chance of snow, rain, or sun during year.
• Test consumer products and illustrate the data graphically.
• Plan a large school event and calculate resources (food, decorations, etc.) you need to organize and hold this event.
• Make a scale drawing of the classroom on grid paper, each group using a different scale.
• Calculate percentages of advertising in a newspaper.
• Tour the school building and identify examples of parallel and perpendicular lines, planes, and angles.
• Determine the median and mode of real data displayed in a histogram.
• Organize and display collected data, using appropriate tables, charts, or graphs.
Rigor/Relevance Framework

1 2 3 4 5
Bloom’sBloom’s
CC DD
AA BB
456
321
ApplicationApplication
Levels

AA BB
DDCC

Teaching
Organ
izational
Lead
ersh
ipInstructional
Leadership
Student Achievement

High expectations
Instructional Leadership

Reading Study Summary
600
800
1000
1400
1600
1200
Tex
t L
exil
e M
easu
re (
L)
HighSchool
Literature
CollegeLiterature
HighSchool
Textbooks
CollegeTextbooks
Military PersonalUse
Entry-LevelOccupations
SAT 1,ACT,AP*
* Source of National Test Data: MetaMetrics
Interquartile Ranges Shown (25% - 75%)

Common Core State Standards
• Fewer• Higher

2005 Proficiency2005 ProficiencyGrade 4 ReadingGrade 4 Reading
ProficientRequired
NAEP Score
Mississippi 88 %
Tennessee 88 %
Georgia 87 %
Texas 81 %
New York 71 %
Florida 71%
California 48 %
Massachusetts 48 %

2009 Proficiency2009 ProficiencyGrade 4 ReadingGrade 4 Reading
ProficientRequired
NAEP Score
Tennessee 90 %
Georgia 87 %
Texas 84 %
New York 77 %
Florida 74%
California 60 %
Massachusetts 60 %
Mississippi 52 %

2005 Proficiency2005 ProficiencyGrade 4 ReadingGrade 4 Reading
ProficientRequired
NAEP Score
Mississippi 88 % 161
Tennessee 88 % 170
Wisconsin 82 % 189
Texas 81 % 190
New York 71 % 207
Florida 71% 202
California 48 % 210
Massachusetts 48 % 234

2009 Proficiency2009 ProficiencyGrade 4 ReadingGrade 4 Reading
ProficientRequired
NAEP Score
Tennessee 90 % 178
Georgia 87 % 188
Texas 84 % 192
New York 77 % 200
Florida 74 % 206
California 60 % 202
Massachusetts 54 % 234
Mississippi 52 % 210

2009 Proficiency2009 ProficiencyGrade 4 ReadingGrade 4 Reading
ProficientRequired
NAEP Score
Tennessee 90 % (0) 170 (+2)
Georgia 87 % (0) 178 (+3)
Texas 84 % (+3) 188 (-2)
New York 77 % (+6) 200 (-7)
Florida 74% (+3) 206 (+4)
California 60 % (+17) 202 (-8)
Massachusetts 54 % (+6) 234 (0)
Mississippi 52 % (-36) 210 (+49)

2009 Proficiency2009 ProficiencyGrade 8 ReadingGrade 8 Reading
ProficientRequired
NAEP Score
Texas 94 % (+11) 201 (-24)
Tennessee 93 % (+6) 211 (-11)
Wisconsin 85 % (-1) 232 (+3)
New York 68 % (+19) 247 (-21)
North Carolina 66% (-22) 246 (+29)
Florida 54% (10) 262 (-3)
Mississippi 48 % (-10) 254 (+7)
California 48 % (+9) 259 (-3)

2009 Proficiency2009 ProficiencyGrade 4 MathematicsGrade 4 Mathematics
ProficientRequired
NAEP Score
Tennessee 90 % (+3) 195 (-5)
Texas 85% (+3) 214 (-5)
Ohio 78 (+13)) 219 (-5)
Florida 75 % (+12) 225 (+3)
California 65% (+14) 220 (-11)
Mississippi 58 % (-21) 223 (+17)
Massachusetts 48 % (+9) 255 (0)
Missouri 45 % (+4) 246 (+4)

2009 Proficiency2009 ProficiencyGrade 8 MathematicsGrade 8 Mathematics
ProficientRequired
NAEP Score
Tennessee 90 % (+2) 229 (-1)
Texas 83 % (+22) 254 (-19)
New York 80 % (+24) 249 (-26)
Florida 66 % (+8) 266 (-3)
Oklahoma 59 % (+8) 269 (-9)
Mississippi 54 % (+1) 264 (+2)
Massachusetts 49 % (+7) 300 (-1)
Missouri 47 % (+32) 287 (-24)

PISA 2009
1 Shanghai-China 556
2 Korea 539
3 Finland 536
4 Hong Kong-China 533
5 Singapore 526
6 Canada 524
7 New Zealand 521
8 Japan 520
9 Australia 515
10 Netherlands 508
17 United States 500
20 Germany 497
21 Ireland 496
22 France 496
25 United Kingdom 494
33 Spain 481
43 Russian Federation 459
48 Mexico 425
53 Brazil 412
57 Indonesia 402
Overall Reading
Scale
Significantly Above OECD Average
Not Significantly Different
(OECD Average 493)
Significantly below OECD Average

PISA 2009
Overall Math Scale
Significantly Above OECD Average
Not Significantly Different
(OECD Average 496)
Significantly below OECD Average
1 Shanghai-China 600
2 Singapore 562
3 Hong Kong-China 555
4 Korea 546
6 Finland 541
9 Japan 529
10 Canada 527
11 Netherlands 526
13 New Zealand 519
15 Australia 514
16 Germany 513
22 France 497
28 United Kingdom 492
31 United States 487
32 Ireland 487
34 Spain 483
38 Russian Federation 468
51 Mexico 419
57 Brazil 386
61 Indonesia 371

PISA 2009
Overall Science
Scale
Significantly Above OECD Average
Not Significantly Different
(OECD Average 501)
Significantly below OECD Average
1 Shanghai-China 575
2 Finland 554
3 Hong Kong-China 549
4 Singapore 542
5 Japan 539
6 Korea 538
7 New Zealand 532
8 Canada 529
10 Australia 527
11 Netherlands 522
13 Germany 520
16 United Kingdom 514
20 Ireland 508
23 United States 502
27 France 498
36 Spain 488
39 Russian Federation 478
50 Mexico 416
53 Brazil 405
60 Indonesia 383

Teaching
Organ
izational
Lead
ersh
ipInstructional
Leadership
Student Achievement

Rigor and Relevance
Relationships
Teaching

1
2
3
1 2 3 4 5
A B
DC
• Calculate with numbers, including decimals, ratios, percents, and fractions.
• Understand two-dimensional motion and trajectories by separating the motion of an object into x and y components.
Rigor/Relevance Framework

1
2
3
1 2 3 4 5
A B
DC
• Know the characteristics and phenomena of sound waves and light waves.
• Understand the effect of sounds, words, and imagery on a listening audience.
Rigor/Relevance Framework

Rigor and Relevance
Relationships
Content
Teaching

Rigor and Relevance
Relationships
Content
Teaching
How
stu
dent
s le
arn

AA BB
DDCC

How Students Learn

AA BB
DDCC

Rigor and Relevance
Relationships
Content
Teaching
How
stu
dent
s le
arn
Inst
ruct
iona
l stra
tegi
es

Data systems should enable us to personalize learning but it has
caused us to standardize it

Next Navigator

1 2 3 4 5

Road Map
• State Standards to State Test

StateTests
StateStandards
AA
AA

Road Map
• State Standards to State Test• State Standards to Research

National Essential Skills Study (NESS)

NESS StudySubgroup Rankings
ELA Skill: Write clear and concise directions or procedures.
Group Rank
Overall 9
Business/Industry 2
Other Non-educators 10
English Language Arts Teachers 25
Other Educators 8

NESS StudySubgroup Rankings
ELA Skill: Give clear and concise oral directions.
Group Rank
Overall 7
Business/Industry 3
Other Non-educators 9
English Language Arts Teachers 28
Other Educators 7

NESS StudySubgroup Rankings
Math Skill: Apply the Pythagorean Theorem to right triangles.
Group Rank
Overall 20
Business/Industry 29
Other Non-educators 31
Mathematics Teachers 4
Other Educators 24

NESS StudySubgroup Rankings
Math Skill: Understand accuracy and precision of measurement, round off numbers according to the correct number of significant figures, and determine percent error.
Group Rank
Overall 12
Business/Industry 3
Other Non-educators 10
Mathematics Teachers 30
Other Educators 8

Proficiency

Reading Study Summary
600
800
1000
1400
1600
1200
Tex
t L
exil
e M
easu
re (
L)
HighSchool
Literature
CollegeLiterature
HighSchool
Textbooks
CollegeTextbooks
Military PersonalUse
Entry-LevelOccupations
SAT 1,ACT,AP*
* Source of National Test Data: MetaMetrics
Interquartile Ranges Shown (25% - 75%)

NESS &
Lexile
StateTests
StateStandards
AA

CommonCore
Standards
NESS&
Lexile
StateTests
StateStandards
AA

TN. Standards CCSS

CCSS TN. Standards

Road Map
• State Standards to State Test• State Standards to Research• State Standards to CCSS• CCSS to State Standard

Road Map
• State Standards to State Test• State Standards to Research• State Standards to CCSS• CCSS to State Standard• State Test to CCSS• Samples to NGA

Road Map
• State Standards to State Test• State Standards to Research• State Standards to CCSS• CCSS to State Standard• State Test to CCSS• Samples to NGA

State Test NGACreate a large spinner for a game that has at least eight sectors. Each sector should be assigned a different ‘prize’. Prizes should range in value from most appealing to least appealing.
Vary the sectors so that the probability to win a desired prize is much less that the probability to win a lesser desired prize. Calculate the theoretical probability of landing on each prize.
Conduct multiple trials with the spinner and determine the experimental probability of landing on each prize. Which price has the greatest probability and which prize has the least probability?

Performance Task drawn from the Ohio Performance Assessment Project.

Performance Task drawn from the Ohio Performance Assessment Project.

Performance Task drawn from the Ohio Performance Assessment Project.

CommonCore
Standards
NESS&
Lexile
StateTests
StateStandards
ConsortiumAssessment
DDAA

AA BB
DDCC

Gold Seal Lessons

Gold Seal Lessons

Gold Seal Lessons

Gold Seal Lessons

• Read 180• System 44
Existing Solutions

• Read 180• System 44• Next Navigator
Existing Solutions

• Read 180• System 44• Next Navigator• Gold Seal Lessons
Existing Solutions

Rigor and relevance
Relationships
Content H
ow s
tude
nts
lear
n
Inst
ruct
iona
l stra
tegi
es
Asses
smen
t to
guid
e
inst
ruct
ion
Teaching

To often student assessments have become the
object of learningrather than the assessment of
learning

Culture
Organizational Leadership

Culture
Vision
Organizational Leadership

Where are the JobsNon-Routine
Routine• Rules Driven• Problem Solving• Less Innovation/Creativity
• Results Driven• Decision Making• More Innovation / Creativity
1980 2011

Where are the Jobs
• Write an Algorithm• Can be Digitized• Can be Outsourced
• Cannot Write an Algorithm• Cannot be Digitized• Cannot be Outsourced
1980 2011
Non-Routine
Routine

Quad DSkills and Knowledge
• Decision Making• Innovation/Creativity • Goal Setting/Results Driven• Multi Tasking• Work with others

Culture
Vision
Structure and
systems
Organizational Leadership

Organizational Changes
• Looping

Organizational Change
• Looping• Interdisciplinary Chairs

Repeating Grades 2010-11
0
50000
100000
150000
200000
250000
300000
K 1 2 3 4 5 6 7 8 9 10 11 12
SOURCE: US Dept of Education

Organizational Changes
• Looping• Interdisciplinary Chairs• 9th Grade Electives

• Flipped Classrooms• Technology -Gaming
21st Century Learners

Cut the RopeKids won’t even know that you consider Cut the Rope educational! Using elements of physics (gravity and vectors), you move a ball of candy around the screen to collect three stars and then end up in the little green monster’s mouth. You accomplish this by cutting different types of ropes at the right time and in the right order, by using air blowers, popping bubbles, etc. It is fairly addictive, very fun and stimulating. There are currently nine levels, each with 25 puzzles, and the puzzles get progressively more difficult. Each level adds a new tool to work with. Cut the Rope is best for 1st-4th graders, but it is fun for adults as well, and for some kindergarteners.
Skills: Physics, problem solving

• Flipped Classrooms• Technology -Gaming -Apps
21st Century Learners

• Flipped Classrooms• Technology -Gaming -Apps -On line
21st Century Learners

Online Learning Facts• 30 states have full-time online
schools• 96% of LEAs have students
enrolled in distance education courses at the HS level

US Average per Pupil Expenditures
• Fully online model - $6,400• Blended-learning model - $8,900• Traditional school model - $10,000

Teaching
Organ
izational
Lead
ersh
ipInstructional
Leadership
Student Achievement


Recommendations• Needs Assessment

Recommendations• Needs Assessment• Model Schools Conference


Recommendations• Needs Assessment• Model Schools Conference• Next Navigator and Gold Seal
Lessons

1 2 3 4 5

Gold Seal Lessons

Recommendations• Needs Assessment• Model Schools Conference• Next Navigator and Gold Seal
Lessons• Focused and Sustained
Professional Development

Recommendations• Needs Assessment• Model Schools Conference• Next Navigator and Gold Seal
Lessons• Focused and Sustained
Professional Development• Leadership Development –
including Executive Coaching

Recommendations• Needs Assessment• Model Schools Conference• Next Navigator and Gold Seal
Lessons• Focused and Sustained
Professional Development• Leadership Development –
including Executive Coaching• Start with Leadership Teams
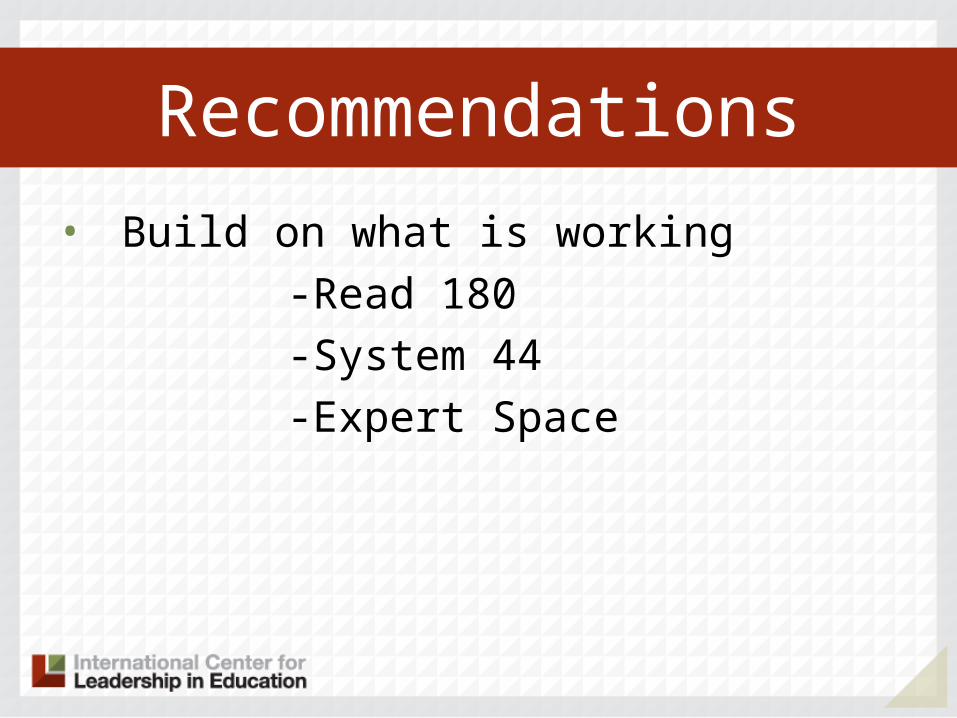
Recommendations• Build on what is working -Read 180 -System 44 -Expert Space