prepared by: new jersey department of transportation … · prepared by: new jersey department of...
TRANSCRIPT

Prepared by:
New Jersey Department of Transportation
March 2015


ii
TABLE OF CONTENTS
Page
CURRENT STATUS OF STATE HIGHWAY SYSTEM ........................................................ 1
Description of System ................................................................................................... 1
Figure 1: NJ Roadway System, Breakdown By Lane Miles ............................ 1
Assessment of the State Highway System .................................................................... 2
Table 1: Condition Criteria ............................................................................... 2
Table 2: Functional Adequacy of NJ State Hwy System .................................. 3
Figure 2: Functional Adequacy of NJ State Hwy System ................................ 3
Figure 3: Multi-Year Status of State Highway System .................................... 4
PAVEMENT FUNDING .............................................................................................................. 5
Table 3: FY 2014 Pavement Funding ........................................................................... 5
WORK COMPLETED IN FISCAL YEAR 2014 ...................................................................... 6
FY 2014 Highway Capital Maintenance Projects ......................................................... 6
FY 2014 Highway Resurfacing – Operations Division Projects .................................. 7
Table 4: Contracts ............................................................................................. 7
FY 2014 Hwy Resurfacing/Rehab/Reconstruct – Capital Program Mgt. Projects ....... 8
Table 5: Projects ............................................................................................... 8
FY 2014 Pavement Preservation Preventive Maintenance Projects ............................. 9
Table 6: Capital Program Mgt. Projects ........................................................... 9
Table 7: Operations Division Projects ............................................................ 10
Multi-Year Summary of Major Pavement Work ........................................................ 10
Figure 4: Lane Miles of Major Pavement Work Completed .......................... 10
REFERENCES ............................................................................................................................ 11
APPENDICES
A. Deficient Pavement Sections Needing Future Restoration ............................................. A-1

1
CURRENT STATUS OF THE STATE HIGHWAY SYSTEM
Description of System
There are approximately 38,566 centerline (CL)
miles of roadways in New Jersey. NJDOT
maintains approximately 2,316 CL miles of
roads, commonly referred to as the state
highway system. Most of the remaining
mileage is under the jurisdiction of counties
(6,649 CL miles) and municipalities (28,539 CL
miles). Other mileage consists of toll roads
including the Garden State Parkway (173 CL
miles) and the New Jersey Turnpike (149 CL
miles) administered by the New Jersey Turnpike
Authority, the Atlantic City Expressway (46 CL
miles) administered by the South Jersey
Transportation Authority, the Palisades
Interstate Parkway (12 CL miles), and mileage
maintained by bridge authorities (33 CL miles).
Finally, park roads account for approximately
649 CL miles.
To get a better idea of pavement quantities, lane
miles rather than centerline miles are used (1
mile of a 2 lane road represents 2 lane miles).
As shown in Figure 1 below, NJDOT maintains
about 10% of the total statewide lane mileage,
but approximately 41% of all traffic, including
a high percentage of heavy trucks, is carried on
NJDOT maintained roads.

2
Assessment of the State Highway System
Evaluation of the New Jersey state highway system is based upon data collected on state
maintained roads and stored in the Pavement Management System. Analysis of this data to assess
current pavement conditions considers the following functional adequacy indices:
IRI (International Roughness Index) estimates roughness as perceived by vehicle
occupants by using lasers to determine the actual variations in the pavement surface from
a perfectly flat condition, measured in inches per mile.
SDI (Surface Distress Index) assesses surface distress and visible deterioration by
evaluating cracking, patching, faulting, shoulder drop, and joint deterioration. SDI is
reported on a scale of 0 to 5 (5 is a perfect pavement free of any distress).
Rut Depth measures depths of grooves primarily in vehicle wheel paths.
Skid Number measures the pavement surface frictional characteristics.
While all of the indices listed above are considered in selecting locations and types of pavement
treatments, IRI and SDI are most indicative of functional adequacy and are used to evaluate the
system status. IRI is a national standard supported by the Federal Highway Administration and
SDI is a New Jersey standard used for many years in roadway assessment.
The analyses discussed herein utilized 2013 road data to evaluate the state highway system
consisting of approximately 2316 centerline miles of roadway. In terms of pavement quantities,
this amounts to 8403 lane miles of mainline roadway, 4086 miles of shoulders, and 563 miles of
ramps that are state owned and maintained. The criteria shown in Table 1 below were used to
evaluate the mainline roadway condition.
FIGURE 1
NJ Roadway System Breakdown by Lane Miles
County Roads
22%NJDOT
Maintained
Roads
10%
Parks
1%
Other (Including
Toll & Bridge
Authorities)
3%
Municipal Roads
64%

3
TABLE 1 - CONDITION CRITERIA
Analysis results are presented in tabular form in Table 2 and graphically in Figure 2 below.
† Note: Mileage in Table 2 represents tested mileage which is slightly less than system mileage
(4661 out of 4662 and 8402 out of 8403) due to inaccessibility of some areas for testing.
Status
Condition Index Criteria (IRI = International Roughness
Index, in/mi; SDI = Surface Distress Index, 0 – 5 Scale)
Engineering Significance
Deficient (Poor)
IRI > 170 OR SDI ≤ 2.4
These roads are overdue for treatment. Drivers on these roads are likely to notice that they are driving on a rough surface, which puts stress on their vehicles. These pavements may have deteriorated to such an extent that they affect the speed of free flow traffic. Flexible pavements may have large potholes and deep cracks. These roads often show significant signs of wear and deterioration, and may have significant distress in the underlying foundation. Roads in this condition will generally be most costly to rehabilitate.
Fair
(95 ≤ IRI ≤ 170 And SDI > 2.4)
OR
(IRI < 95 And 2.4 < SDI < 3.5)
These roads exhibit minimally acceptable ride quality that is noticeably inferior to those of new pavements and may be barely tolerable for high-speed traffic. These pavements may show some signs of deterioration such as rutting, map cracking and extensive patching. Most importantly, roads in this category are in jeopardy and should immediately be programmed for some cost-effective treatment that will restore them to a good condition and avoid costly rehabilitation in the near future.
Good IRI < 95 AND SDI ≥ 3.5 These roads exhibit good ride quality with little or no signs of deterioration. A proactive preventive maintenance strategy is necessary to keep roads in this category as long as possible.
TABLE 2
Functional Adequacy of NJ State Highway System
(Based on Roughness and Distress)
Condition Road Miles
(Two Directions)
Lane Miles
(Two Directions)
% of Total System
Lane Miles
Deficient by Roughness Alone 521.2 882.7 10%
Deficient by Roughness & Distress 507.6 840.7 10%
Deficient by Distress Alone 1101.5 1845.7 22%
Total Deficient 2130.3 3569.1 42%
Total Fair/Mediocre 1391.9 2484.5 30%
Total Good 1138.8 2348.1 28%
Total State System 4661.0† 8401.7† 100%
Source: NJDOT Pavement Management System, 2013 Data

4
FIGURE 2
These results underscore the severity of the functional deficiency (42% of the system). Similar
analyses using data collected over the last 13 years show that while the overall deficiency has
remained significant, efforts over the past several years have begun to reduce deficiencies (see
Figure 3 below).

5
FIGURE 3

6
PAVEMENT FUNDING
Programmed funding in fiscal year 2014 for pavement activities is detailed in Table 3 below. Costs
for individual projects awarded in FY 2014 are shown on pages 6 through 10.
TABLE 3
Programmed Pavement Funding for Fiscal Year 2014
(Individual costs for projects awarded in FY 2014 are shown on pages 6 through 10)
Program Category Description Funding
(Millions)
Highway Capital
Maintenance -
Betterments
(State Funding)
This is an ongoing program of minor improvements
to the state highway system for miscellaneous
maintenance repair contracts, repair parts,
miscellaneous needs for emergent projects,
handicap ramps, and drainage
rehabilitation/maintenance.
$10
Highway Capital
Maintenance -
Pavement
Preservation (Fed. Funding)
This program provides funding for eligible federal
pavement preservation activities which help to keep
New Jersey's highway system in a state of good
repair.
$6
Highway Resurfacing
- Operations Projects (State Funding)
This is a comprehensive program of providing
renewed riding surfaces to state highways to
prolong the life of the pavement and provide a
smoother ride for users of the system.
$75
Highway Resurfacing
/ Rehab &
Reconstruct - Capital
Program Mgt.
Projects (State & Fed. Funding)
This program funds larger scale projects
administered through Capital Program Management
which are primarily involved with pavement
restoration.
$111
Totals $202

7
WORK COMPLETED IN FISCAL YEAR 2014 The Department’s Operations Division administers highway capital maintenance and selected
resurfacing projects. Alternatively, resurfacing and rehabilitation/reconstruction projects which
are more involved with regards to required project documents and scoping are administered
through the Capital Program Management Division. Each of these types of projects which result
in significant pavement system improvements is broken down and described by program
categories in the sections which follow.
Fiscal Year 2014 Highway Capital Maintenance Projects
As described in Table 3, Highway Capital Maintenance dollars were spent in fiscal year 2014 on
pavement-related maintenance work administered through the Operations Division of NJDOT. In-
house maintenance crews regularly performed a variety of maintenance tasks to extend the life of
pavement and address emergency conditions, including the following:
Sweeping and drain cleaning to keep water away from travel lanes.
Patching potholes to keep the riding surface intact and prevent intrusion of moisture into
the pavement layers.
Quick-set concrete to patch and repair bridge decks.
In addition, specialized maintenance work was performed through contracts awarded and
administered through Operations, including the following:

8
“If-And-Where” resurfacing contracts statewide administered through Regional
Operations personnel to quickly address emergency conditions.
Crack sealing and longitudinal joint patching to prolong pavement life.
Diamond grinding of concrete pavement to improve ride quality, skid resistance, wet
weather visibility and to reduce tire noise.
9
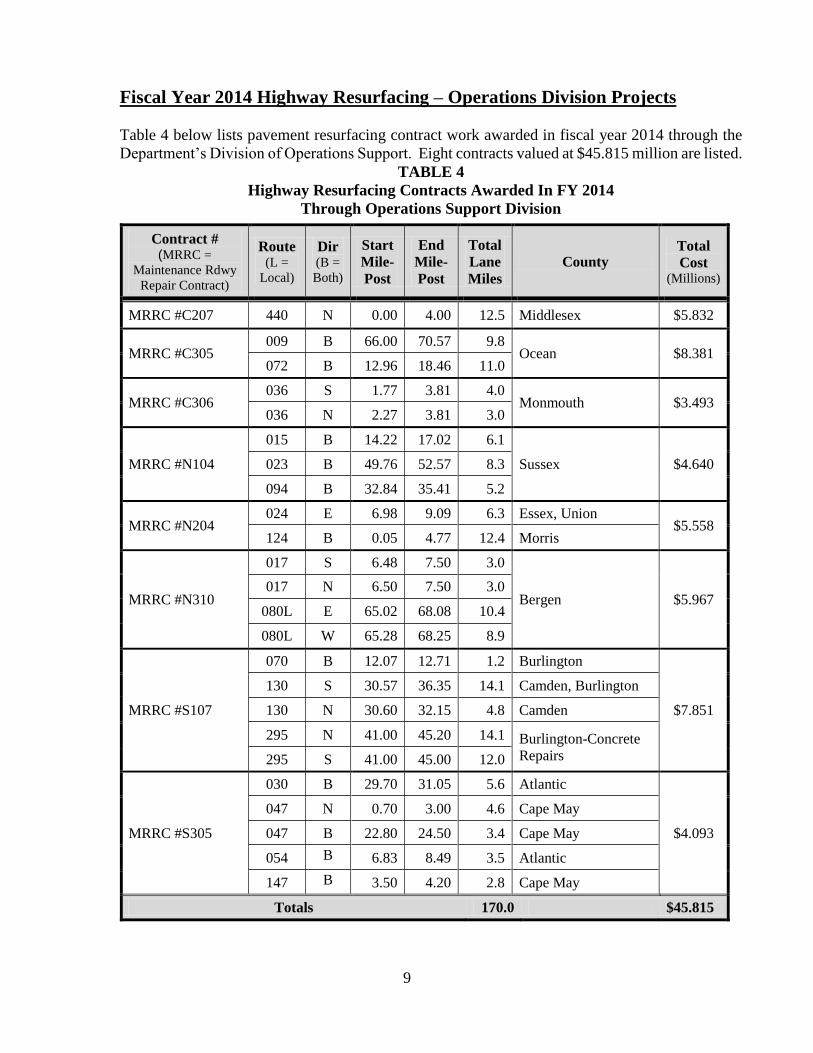
Fiscal Year 2014 Highway Resurfacing – Operations Division Projects
Table 4 below lists pavement resurfacing contract work awarded in fiscal year 2014 through the
Department’s Division of Operations Support. Eight contracts valued at $45.815 million are listed.
TABLE 4
Highway Resurfacing Contracts Awarded In FY 2014
Through Operations Support Division
Contract # (MRRC =
Maintenance Rdwy
Repair Contract)
Route (L =
Local)
Dir (B =
Both)
Start
Mile-
Post
End
Mile-
Post
Total
Lane
Miles
County Total
Cost (Millions)
MRRC #C207 440 N 0.00 4.00 12.5 Middlesex $5.832
MRRC #C305 009 B 66.00 70.57 9.8
Ocean $8.381 072 B 12.96 18.46 11.0
MRRC #C306 036 S 1.77 3.81 4.0
Monmouth $3.493 036 N 2.27 3.81 3.0
MRRC #N104
015 B 14.22 17.02 6.1
Sussex $4.640 023 B 49.76 52.57 8.3
094 B 32.84 35.41 5.2
MRRC #N204 024 E 6.98 9.09 6.3 Essex, Union
$5.558 124 B 0.05 4.77 12.4 Morris
MRRC #N310
017 S 6.48 7.50 3.0
Bergen $5.967 017 N 6.50 7.50 3.0
080L E 65.02 68.08 10.4
080L W 65.28 68.25 8.9
MRRC #S107
070 B 12.07 12.71 1.2 Burlington
$7.851
130 S 30.57 36.35 14.1 Camden, Burlington
130 N 30.60 32.15 4.8 Camden
295 N 41.00 45.20 14.1 Burlington-Concrete
Repairs 295 S 41.00 45.00 12.0
MRRC #S305
030 B 29.70 31.05 5.6 Atlantic
$4.093
047 N 0.70 3.00 4.6 Cape May
047 B 22.80 24.50 3.4 Cape May
054 B 6.83 8.49 3.5 Atlantic
147 B 3.50 4.20 2.8 Cape May
Totals 170.0 $45.815

10
FY 2014 Hwy Resurfacing/Rehab/Reconstuct-Capital Program Mgt Projects This funding category includes pavement projects administered through Capital Program
Management. These projects are more involved than those administered through the Operations
Division with regards to required project design, documentation and scoping. This program
consists primarily of resurfacing/rehabilitation/reconstruction of highway pavements, but may also
include selected repair activities, upgrades to walks/curbing and guardrails, application of long-
life pavement markings and raised pavement markers, and safety improvements. Table 5 below
lists 10 highway resurfacing/rehab/reconstruct projects awarded in fiscal year 2014 administered
through Capital Program Management valued at $50.323 million.
TABLE 5
Hwy Resurfacing/Rehab/Reconstruct Projects Awarded in FY 2014
Administered Through Capital Program Management
Project Description
DOT
UPC
No.
Route (L=
Local)
Dir (B=
Both)
Start
Mile-
Post
End
Mile-
Post
Lane
Miles County
Fund-
ing
Source
Cost (Millions)
Rt 18 from CR 547 to
Rt 34, Resurfacing 133240
018 N 13.50 18.76 10.6 Monmouth State $5.784
018 S 13.57 17.33 7.4
Rt 31 from Grayrocks
Rd to Bryants Rd (CR
634)
113420 031 B 32.50 40.90 21.8 Hunterdon,
Warren Federal $8.250
Rt 33 from
Manalapan Brook to
Halls Mills Rd.
113060 033 B 24.30 29.00 18.8 Monmouth Federal $7.000
Rt 35 SB from Cliff
Ave to Rt 9,
Resurfacing
133820 035 S 47.30 49.38 4.6 Middlesex State $2.900
Rt 72 from Rt 70 to
County Rt 532,
Pavement
114100 072 B 0.00 6.00 12.0 Burlington Federal $4.900
Rt 122 from Dalton
St to Rt 22,
Resurfacing
133340 122 B 0.80 2.40 3.2 Warren State $1.407
Rt 173 from I-78 to
Fox Hill Lane,
Pavement
123380 173 B 0.00 8.10 22.5 Warren,
Hunterdon State $6.588
Rt 173 & 173Z from
Strotz Rd to Rt 78,
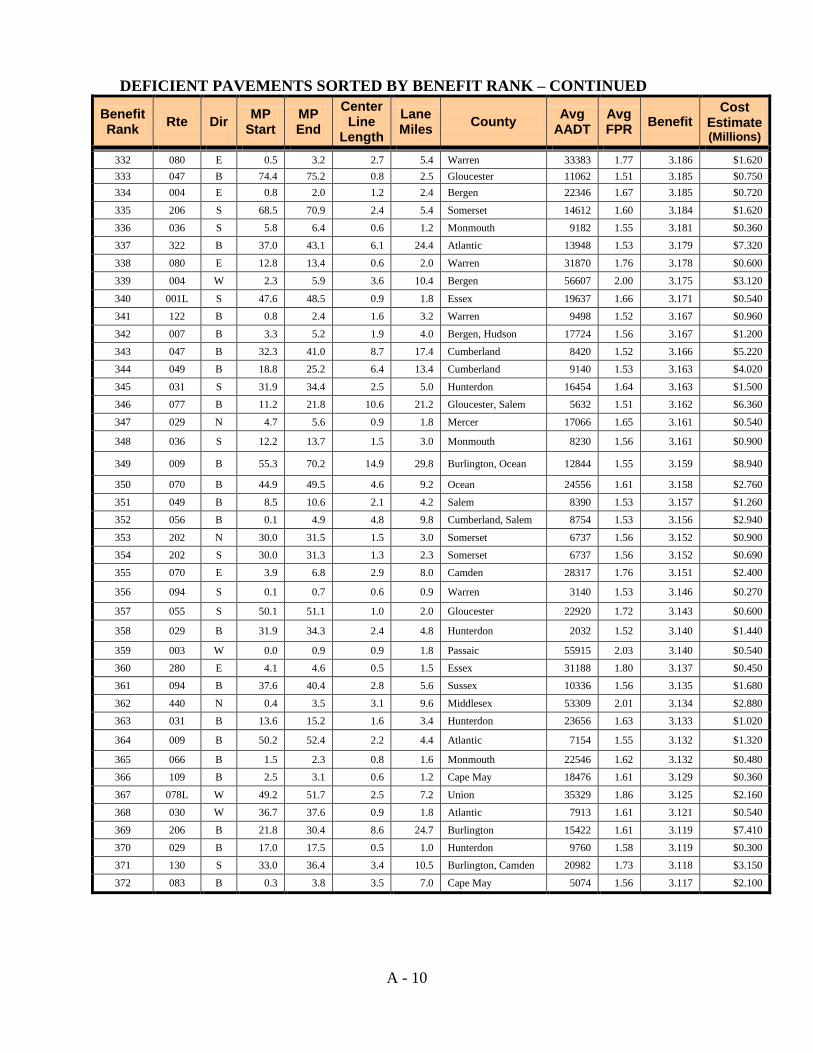
Resurfacing
133350 173 B 8.10 11.70 7.7 Hunterdon,
Somerset State $3.300
173Z B 1.12 1.67 1.2
Rt 202 from CR 637
to Rd to Rt 287,
Resurfacing
133360 202 B 20.33 26.20 23.4 Somerset State $8.612
Rt 206 Nassau St to
Arreton Rd, Pavement 123450 206 B 53.90 56.60 5.6 Mercer State $1.582
Total 138.8 $50.323

11
FY 2014 Pavement Preservation Preventive Maintenance Projects
NJDOT has significantly increased the use of preventive maintenance treatments in FY 2014.
Instead of waiting until pavements deteriorate to a poor condition requiring conventional
resurfacing or rehabilitation treatments, preventive maintenance treatments are applied at a
fraction of the cost to roadway sections in good or fair condition. While the majority of the
pavement funding is still applied to conventional restoration of deficient pavements, the preventive
maintenance strategy applied to non-deficient pavements slows the rate of deterioration and allows
NJDOT to reduce the backlog of deficient pavements with the funding available.
In FY 2014, microsurfacing and a related treatment called slurry seal were utilized. These
processes involve sealing the entire pavement surface with a special mixture of polymer modified
asphalt emulsion, mineral aggregate, mineral filler, water, and other additives, properly
proportioned, mixed, and spread on the paved surface.
Projects were completed in FY 2014 through both the Capital Program Management and
Operations branches of NJDOT. These projects are listed in Tables 6 and 7 below.
TABLE 6
Preventive Maintenance Projects Awarded in FY 2014
Administered Through Capital Program Management
Project
Description
Treat-
ment
DOT
UPC
No.
Route Dir (B=
Both)
Start
Mile-
Post
End
Mile-
Post
Lane
Miles County
Cost (Millions)
Rt 287 SB from
North Maple Ave to
South St & Rt 24
from Rt 287 to JFK
Ramp
Micro-
surface 143430
024 W 0.00 3.10 6.9 Morris
$3.751 024 E 1.00 6.98 12.3 Morris,
Essex
287 S 30.30 35.40 15.9 Morris
Rt 47 from
Woodcock Lane to
Jupiter Drive
Slurry
Seal 143410
047 B 10.24 17.40 14.4 Cape May
$2.875
047 B 18.90 20.56 3.4 Cape May
047 B 21.00 22.80 3.6 Cape May
047 B 24.60 38.10 27.0 Cumber-
land
Rt 94 from Rt 46 to
Old Coach Road
Slurry
Seal 143420
094 B 0.77 8.23 14.8 Warren
$2.490 094 B 13.8 21.75 16.0
Warren,
Sussex
094 B 24.91 27.70 5.6 Sussex
094 B 36.41 37.25 1.6 Sussex
Total 121.5 $9.116

12
TABLE 7
Preventive Maintenance Projects Awarded in FY 2014
Administered Through Operations Support Division
Project
Description
Treat-
ment Route
Dir (B=
Both)
Start
Mile-
Post
End
Mile-
Post
Lane
Miles County
Cost (Millions)
Rt 55 NB (FHWA
Pvmt Preservation
Contract-South,
2014), DP #14413
Micro-
surface 055 N 34.30 48.40 28.4
Cumberland,
Salem,
Gloucester
$3.472
Microsurfacing
Contract, Various
Locations (State
Funding)
Micro-
surface
031 B 28.80 31.70 11.6 Hunterdon
$4.482 035 N 34.50 38.70 8.7 Monmouth
078 W 17.90 23.00 15.8 Hunterdon
078 E 17.90 31.00 38.6 Hunterdon
Total 103.1 $7.954

13
MULTI-YEAR SUMMARY OF MAJOR PAVEMENT WORK
Figure 4 below shows the lane miles of mainline pavement that received restoration over the last
10 fiscal years. Note that the 2013 reduction reflects the large expenditure for relatively
limited lane miles on the three Route 35 reconstruction projects after Hurricane Sandy.
Figure 4

14
REFERENCES
1. New Jersey Department of Transportation, Capital Investment Strategy FY 2013-2022, March
2012.
2. New Jersey Department of Transportation, FY 2014 – 2023 Statewide Transportation
Improvement Program, October 1, 2013.
3. New Jersey Department of Transportation, Pavement Management System.
4. New Jersey Department of Transportation, Transportation Capital Program, Fiscal Year
2014.

A - 1
APPENDIX A
DEFICIENT PAVEMENT SECTIONS
NEEDING FUTURE RESTORATION

A - 2
APPENDIX A
DEFICIENT PAVEMENTS NEEDING FUTURE RESTORATION
508 Candidate Projects Sorted By Benefit Rank Notes:
(1) Candidate projects are based on 2013 Pavement Management Database. Minimum project length = 0.5 mile. (2) Many of the projects shown below are already programmed for future work and are awaiting funding.
(2) AADT = Average Annual Daily Traffic. FPR = Final Pavement Rating (0-5 scale, 5 = perfect pavement).
(3) Benefit = 0.9(5.0-Avg FPR) + 0.1(Traffic Factor) and Traffic Factor = (5/60000)(Avg AADT), with Max = 5.0 (4) For undivided routes (Dir = B): FPR and Benefit shown are the most critical set of values in either direction.
(5) In Rte designation, L=local, B=business, 095M = NJDOT maintained portion of Interstate 95.
Benefit Rank
Rte Dir MP
Start MP End
Center Line
Length
Lane Miles
County Avg
AADT Avg FPR
Benefit Cost
Estimate (Millions)
1 009 S 132.7 136.0 3.3 9.5 Middlesex 32280 0.40 4.411 $2.850
2 009 S 122.6 123.9 1.3 3.9 Middlesex 29908 0.40 4.393 $1.170
3 009 S 114.4 116.8 2.4 5.5 Monmouth 14346 0.25 4.393 $1.650
4 080 E 54.0 58.2 4.2 16.7 Passaic 58532 0.73 4.331 $5.010
5 009 N 126.4 129.7 3.3 9.4 Middlesex 38312 0.60 4.279 $2.820
6 130 S 73.0 74.2 1.2 2.4 Middlesex 12742 0.37 4.276 $0.720
7 035 S 6.8 8.9 2.1 4.2 Ocean 8486 0.33 4.271 $1.260
8 001 S 12.2 14.0 1.8 5.8 Middlesex 30346 0.62 4.196 $1.740
9 009 S 110.6 111.7 1.1 2.2 Monmouth 25141 0.57 4.192 $0.660
10 046 E 67.0 68.5 1.5 3.3 Bergen 27174 0.62 4.170 $0.990
11 168 B 9.8 10.8 1.0 2.5 Camden 16900 0.45 4.169 $0.750
12 440 N 25.3 26.2 0.9 1.8 Hudson 28444 0.64 4.164 $0.540
13 023 N 10.2 19.7 9.5 22.6 Morris, Passaic 27490 0.63 4.160 $6.780
14 009 S 131.0 131.8 0.8 2.4 Middlesex 37872 0.76 4.133 $0.720
15 287 N 39.2 40.3 1.1 4.4 Morris 23005 0.63 4.123 $1.320
16 440 N 23.5 24.3 0.8 1.6 Hudson 28444 0.71 4.101 $0.480
17 047 B 3.4 4.4 1.0 2.2 Cape May 18846 0.54 4.091 $0.660
18 130 S 80.3 81.9 1.6 3.2 Middlesex 19884 0.64 4.088 $0.960
19 035 S 3.3 5.5 2.2 4.6 Ocean 7236 0.52 4.088 $1.380
20 040 E 61.6 63.6 2.0 4.0 Atlantic 16674 0.62 4.085 $1.200
21 046 E 42.3 46.3 4.0 9.0 Morris 14590 0.62 4.062 $2.700
22 035 N 25.2 28.5 3.3 6.6 Monmouth 14138 0.62 4.060 $1.980
23 030 B 7.8 13.6 5.8 24.0 Camden 26772 0.62 4.051 $7.200
24 027 N 33.4 34.0 0.6 1.1 Union 6703 0.57 4.046 $0.330
25 130 S 76.3 78.7 2.4 4.8 Middlesex 17002 0.67 4.036 $1.440
26 139U E 0.1 0.8 0.7 1.4 Hudson 12350 0.63 4.036 $0.420
27 023 B 0.0 3.2 3.2 11.8 Essex 18794 0.61 4.029 $3.540
28 001L N 48.2 51.1 2.9 5.8 Essex 27681 0.83 3.982 $1.740
29 040 B 60.5 61.6 1.1 4.4 Atlantic 29768 0.74 3.960 $1.320
30 047 S 0.8 3.4 2.6 5.1 Cape May 11303 0.71 3.952 $1.530
31 009 B 99.1 101.3 2.2 4.4 Ocean 23352 0.72 3.950 $1.320
32 004 E 2.8 5.7 2.9 8.4 Bergen 60269 1.17 3.944 $2.520
33 027 B 4.9 10.8 5.9 13.3 Middlesex, Somerset
17472 0.70 3.941 $3.990
34 009 S 112.4 113.2 0.8 2.1 Monmouth 23692 0.85 3.930 $0.630
35 047 B 18.4 20.6 2.2 4.4 Cape May 10708 0.68 3.929 $1.320
36 001 N 39.9 40.5 0.6 1.8 Union 29774 0.91 3.928 $0.540

A - 3
DEFICIENT PAVEMENTS SORTED BY BENEFIT RANK - CONTINUED
Benefit Rank
Rte Dir MP
Start MP End
Center Line
Length
Lane Miles
County Avg
AADT Avg FPR
Benefit Cost
Estimate (Millions)
37 003 W 4.1 10.3 6.2 19.9 Bergen, Hudson,
Passaic 57730 1.17 3.924 $5.970
38 171 B 0.4 1.3 0.9 2.4 Middlesex 14744 0.71 3.922 $0.720
39 001 N 34.8 35.7 0.9 2.0 Middlesex 29063 0.91 3.919 $0.600
40 030 B 13.9 18.1 4.2 15.7 Camden 19686 0.74 3.912 $4.710
41 130 N 62.8 65.1 2.3 4.6 Mercer 14976 0.81 3.900 $1.380
42 159 B 0.6 1.3 0.7 1.4 Essex 18190 0.76 3.895 $0.420
43 029 N 18.1 18.7 0.6 1.2 Hunterdon 4370 0.73 3.882 $0.360
44 009W B 8.8 11.2 2.4 4.8 Bergen 5726 0.71 3.880 $1.440
45 057 B 0.1 2.9 2.8 5.6 Warren 12854 0.75 3.880 $1.680
46 027 S 33.4 34.1 0.7 1.2 Union 6601 0.75 3.880 $0.360
47 015 B 14.2 15.1 0.9 1.8 Sussex 22798 0.80 3.877 $0.540
48 179 B 0.6 7.5 6.9 15.5 Hunterdon 6402 0.73 3.870 $4.650
49 009 S 104.5 105.8 1.3 2.6 Monmouth 22049 0.91 3.866 $0.780
50 009 N 130.7 132.7 2.0 4.4 Middlesex 37006 1.05 3.863 $1.320
51 040 E 56.6 57.1 0.5 1.0 Atlantic 16734 0.86 3.862 $0.300
52 440 N 21.5 22.8 1.3 2.4 Hudson 21344 0.93 3.844 $0.720
53 015 S 2.6 4.3 1.7 4.4 Morris 25365 0.98 3.834 $1.320
54 159 W 0.0 0.6 0.6 1.0 Essex, Morris 9095 0.83 3.830 $0.300
55 001 S 23.2 24.2 1.0 3.0 Middlesex 38923 1.11 3.827 $0.900
56 045 B 9.5 10.4 0.9 1.8 Salem 5954 0.78 3.826 $0.540
57 046 B 69.7 70.8 1.1 4.3 Bergen 48542 0.98 3.822 $1.290
58 001 S 9.7 10.8 1.1 3.3 Mercer 40570 1.13 3.822 $0.990
59 206 B 53.9 54.5 0.6 1.4 Mercer 18436 0.87 3.797 $0.420
60 023 S 13.2 16.3 3.1 10.0 Morris 28542 1.05 3.789 $3.000
61 021 B 1.3 2.3 1.0 4.2 Essex 46852 1.01 3.789 $1.260
62 001 S 40.1 41.7 1.6 4.8 Union 29805 1.07 3.787 $1.440
63 001 S 31.6 32.3 0.7 2.1 Middlesex 38602 1.15 3.785 $0.630
64 042 N 13.5 14.3 0.8 2.4 Camden 76196 1.35 3.783 $0.720
65 071 B 7.7 10.0 2.3 8.0 Monmouth 12512 0.86 3.782 $2.400
66 173Z B 1.1 1.7 0.6 1.2 Hunterdon 6504 0.83 3.782 $0.360
67 047 B 50.5 52.4 1.9 3.8 Cumberland, Gloucester
9920 0.84 3.781 $1.140
68 009 N 117.2 119.2 2.0 4.0 Monmouth 28567 1.06 3.780 $1.200
69 030 B 40.5 46.2 5.7 22.8 Atlantic 17746 0.88 3.780 $6.840
70 015 S 6.3 8.7 2.4 5.1 Morris 21452 1.00 3.778 $1.530
71 033 B 1.4 7.8 6.4 16.1 Mercer 17098 0.88 3.776 $4.830
72 003 E 0.0 2.3 2.3 6.9 Passaic 56933 1.33 3.774 $2.070
73 017 S 20.9 26.6 5.7 17.1 Bergen 48514 1.26 3.774 $5.130
74 023 B 35.6 39.2 3.6 7.8 Sussex 15478 0.89 3.766 $2.340
75 042 S 3.4 6.3 2.9 11.2 Gloucester 20248 1.00 3.766 $3.360
76 027 B 20.9 33.4 12.5 39.8 Middlesex, Union 20784 0.91 3.764 $11.940
77 003 E 6.0 8.0 2.0 6.5 Bergen 66144 1.37 3.763 $1.950
78 001 S 26.4 27.6 1.2 3.4 Middlesex 53636 1.32 3.756 $1.020
79 130 N 78.1 82.3 4.2 8.4 Middlesex 18649 1.01 3.746 $2.520

A - 4
DEFICIENT PAVEMENTS SORTED BY BENEFIT RANK – CONTINUED
Benefit Rank
Rte Dir MP
Start MP End
Center Line
Length
Lane Miles
County Avg
AADT Avg FPR
Benefit Cost
Estimate (Millions)
80 047 B 22.6 25.0 2.4 4.8 Cape May,
Cumberland 2914 0.86 3.741 $1.440
81 003 E 8.8 10.4 1.6 5.2 Hudson 36797 1.19 3.739 $1.560
82 022 E 20.0 31.4 11.4 22.8 Hunterdon, Somerset 15243 0.99 3.735 $6.840
83 027 B 12.8 15.4 2.6 9.4 Middlesex 21712 0.96 3.726 $2.820
84 001T W 0.3 1.2 0.9 1.8 Essex, Hudson 35059 1.19 3.718 $0.540
85 029 S 18.2 18.7 0.5 0.9 Hunterdon 4268 0.91 3.715 $0.270
86 046 W 67.1 68.1 1.0 2.0 Bergen 27174 1.13 3.713 $0.600
87 030 E 2.6 4.2 1.6 4.1 Camden 30480 1.16 3.712 $1.230
88 009 N 112.5 113.0 0.5 1.0 Monmouth 23692 1.10 3.705 $0.300
89 033 B 35.9 37.0 1.1 4.4 Monmouth 16008 0.96 3.703 $1.320
90 094 B 0.7 14.4 13.7 27.4 Warren 6246 0.92 3.701 $8.220
91 080L E 63.5 68.4 4.9 15.7 Bergen 37684 1.24 3.700 $4.710
92 206 B 62.9 64.5 1.6 3.2 Somerset 25750 1.01 3.698 $0.960
93 009W B 0.8 2.9 2.1 8.4 Bergen 24462 1.01 3.694 $2.520
94 070 B 19.1 44.3 25.2 50.4 Burlington, Ocean 12826 0.96 3.691 $15.120
95 001L S 50.0 51.0 1.0 2.0 Essex 25522 1.14 3.689 $0.600
96 159 E 0.1 0.6 0.5 0.9 Essex, Morris 9095 0.99 3.687 $0.270
97 094 B 28.0 35.6 7.6 15.2 Sussex 10968 0.96 3.685 $4.560
98 001 S 34.6 35.4 0.8 2.7 Middlesex 32962 1.21 3.682 $0.810
99 038 W 0.0 9.6 9.6 22.3 Burlington, Camden 25166 1.14 3.681 $6.690
100 020 S 0.2 4.0 3.8 8.7 Passaic 35042 1.24 3.679 $2.610
101 040 B 36.3 43.6 7.3 14.8 Atlantic 8550 0.95 3.679 $4.440
102 030 B 46.8 48.9 2.1 8.4 Atlantic 19820 1.01 3.676 $2.520
103 001 S 54.7 57.4 2.7 5.4 Hudson 28355 1.18 3.676 $1.620
104 023 B 3.9 4.9 1.0 3.2 Essex, Passaic 24130 1.04 3.664 $0.960
105 130 N 46.1 46.8 0.7 2.0 Burlington 16620 1.09 3.661 $0.600
106 001 N 47.8 48.4 0.6 1.2 Essex 19645 1.12 3.660 $0.360
107 033B B 3.8 6.6 2.8 5.6 Monmouth 10340 0.98 3.657 $1.680
108 082 B 2.9 4.4 1.5 6.0 Union 29964 1.08 3.656 $1.800
109 195 E 1.2 1.8 0.6 1.3 Mercer 25397 1.18 3.654 $0.390
110 030 E 52.0 54.0 2.0 4.4 Atlantic 19198 1.12 3.649 $1.320
111 154 B 0.0 1.5 1.5 3.0 Camden 21196 1.05 3.647 $0.900
112 001 N 40.9 45.4 4.5 13.0 Union 35750 1.28 3.644 $3.900
113 001 N 12.0 14.5 2.5 7.3 Middlesex 29973 1.23 3.642 $2.190
114 001 N 36.3 36.8 0.5 1.3 Middlesex 38444 1.32 3.632 $0.390
115 287 S 0.5 3.2 2.7 9.9 Middlesex 59978 1.52 3.630 $2.970
116 001 S 8.6 9.2 0.6 2.4 Mercer 40570 1.34 3.629 $0.720
117 041 B 0.0 0.5 0.5 1.0 Gloucester 12880 1.03 3.626 $0.300
118 063 B 0.0 3.0 3.0 8.9 Bergen 19944 1.07 3.622 $2.670
119 017 N 17.6 26.8 9.2 27.6 Bergen 50015 1.44 3.622 $8.280
120 130 S 62.5 64.7 2.2 4.4 Mercer 14976 1.12 3.619 $1.320

A - 5
DEFICIENT PAVEMENTS SORTED BY BENEFIT RANK – CONTINUED
Benefit Rank
Rte Dir MP
Start MP End
Center Line
Length
Lane Miles
County Avg
AADT Avg FPR
Benefit Cost
Estimate (Millions)
121 042 N 3.6 7.4 3.8 7.9 Camden, Gloucester 26052 1.22 3.618 $2.370
122 009 S 124.7 128.5 3.8 11.3 Middlesex 38628 1.34 3.617 $3.390
123 094 B 15.0 22.5 7.5 15.0 Sussex 6870 1.02 3.614 $4.500
124 033 E 24.0 29.8 5.8 11.1 Monmouth 9758 1.08 3.613 $3.330
125 021 B 3.2 4.0 0.8 3.2 Essex 74248 1.34 3.607 $0.960
126 001 N 8.0 9.2 1.2 3.6 Mercer 40570 1.37 3.606 $1.080
127 046 W 32.2 33.3 1.1 2.2 Morris 15404 1.14 3.600 $0.660
128 031 B 34.9 38.2 3.3 6.7 Hunterdon 23958 1.12 3.591 $2.010
129 020 N 0.2 4.0 3.8 8.4 Passaic 35042 1.34 3.589 $2.520
130 057 B 5.8 21.1 15.3 30.9 Warren 13360 1.08 3.586 $9.270
131 001 N 49.9 54.7 4.8 9.6 Essex, Hudson 29650 1.29 3.583 $2.880
132 027 B 34.1 38.3 4.2 16.2 Essex, Union 13492 1.08 3.580 $4.860
133 295 S 39.6 40.5 0.9 2.7 Burlington 50960 1.50 3.579 $0.810
134 001 N 19.7 21.4 1.7 3.6 Middlesex 30341 1.31 3.576 $1.080
135 045 B 27.7 28.4 0.7 2.7 Gloucester 9464 1.07 3.576 $0.810
136 005 B 1.6 2.3 0.7 1.8 Bergen 9746 1.07 3.576 $0.540
137 181 B 0.0 1.5 1.5 3.4 Morris 5432 1.05 3.574 $1.020
138 033 W 24.4 30.0 5.6 11.1 Monmouth 9398 1.12 3.572 $3.330
139 028 W 22.9 25.0 2.1 4.1 Union 13845 1.16 3.570 $1.230
140 076 S 0.9 2.0 1.1 4.8 Camden 72087 1.59 3.566 $1.440
141 080 W 0.6 3.5 2.9 5.8 Warren 32821 1.35 3.562 $1.740
142 038 E 0.0 16.8 16.8 40.7 Burlington, Camden 22048 1.25 3.556 $12.210
143 078 E 14.7 16.2 1.5 4.5 Hunterdon 45222 1.47 3.556 $1.350
144 206 B 50.1 53.5 3.4 7.3 Mercer 15244 1.12 3.551 $2.190
145 046 B 0.8 6.8 6.0 12.4 Warren 8548 1.10 3.548 $3.720
146 022 W 44.1 47.0 2.9 8.3 Somerset 32436 1.36 3.547 $2.490
147 018 N 39.5 40.7 1.2 3.3 Middlesex 39038 1.42 3.543 $0.990
148 130 N 30.7 31.6 0.9 2.7 Camden 20645 1.25 3.543 $0.810
149 054 B 9.8 10.7 0.9 1.8 Atlantic 12992 1.12 3.542 $0.540
150 080 W 36.0 39.5 3.5 14.0 Morris 38158 1.42 3.536 $4.200
151 030 E 36.4 40.5 4.1 8.2 Atlantic 8632 1.15 3.536 $2.460
152 079 B 10.1 12.1 2.0 4.0 Monmouth 10870 1.12 3.536 $1.200
153 046 E 0.1 0.8 0.7 1.4 Warren 4460 1.11 3.534 $0.420
154 029 S 2.7 9.4 6.7 14.0 Mercer 14296 1.21 3.533 $4.200
155 440 S 22.1 23.5 1.4 2.8 Hudson 27373 1.33 3.531 $0.840
156 295 S 38.3 39.1 0.8 2.4 Burlington 44258 1.49 3.529 $0.720
157 017 B 0.0 3.5 3.5 7.9 Bergen 33512 1.24 3.528 $2.370
158 018 S 30.3 40.7 10.4 26.3 Middlesex 29111 1.35 3.527 $7.890
159 050 B 16.8 18.3 1.5 3.0 Atlantic 6714 1.12 3.524 $0.900
160 001 S 36.4 36.9 0.5 1.4 Middlesex 38444 1.44 3.522 $0.420
161 280 W 0.0 4.3 4.3 8.8 Essex, Morris 32496 1.39 3.521 $2.640
162 001 B 57.4 58.5 1.1 4.4 Hudson 29096 1.22 3.521 $1.320
163 047 N 0.8 3.0 2.2 4.4 Cape May 11316 1.19 3.520 $1.320

A - 6
DEFICIENT PAVEMENTS SORTED BY BENEFIT RANK – CONTINUED
Benefit Rank
Rte Dir MP
Start MP End
Center Line
Length
Lane Miles
County Avg
AADT Avg FPR
Benefit Cost
Estimate (Millions)
164 202 S 63.0 65.4 2.4 7.2 Passaic 22515 1.30 3.514 $2.160
165 019 N 2.4 2.9 0.5 1.2 Passaic 22724 1.31 3.507 $0.360
166 206 B 60.5 62.3 1.8 4.2 Somerset 22290 1.21 3.507 $1.260
167 080 E 44.3 52.9 8.6 25.5 Essex, Morris,
Passaic 52624 1.59 3.505 $7.650
168 033 E 22.3 23.5 1.2 2.4 Monmouth 14728 1.24 3.504 $0.720
169 017 S 5.9 8.4 2.5 7.5 Bergen 33291 1.42 3.502 $2.250
170 049 B 36.5 37.2 0.7 1.4 Cumberland 15028 1.18 3.499 $0.420
171 036 B 6.4 9.4 3.0 6.0 Monmouth 13238 1.17 3.499 $1.800
172 067 B 0.0 0.7 0.7 2.8 Bergen 21652 1.21 3.497 $0.840
173 035 S 47.3 49.3 2.0 4.4 Middlesex 14206 1.25 3.496 $1.320
174 049 B 38.6 53.7 15.1 30.2 Atlantic, Cape May, Cumberland
6614 1.15 3.494 $9.060
175 166 B 0.1 2.3 2.2 4.1 Ocean 24335 1.23 3.492 $1.230
176 001T E 1.2 2.5 1.3 3.6 Hudson 32802 1.43 3.489 $1.080
177 031 B 1.2 8.6 7.4 24.6 Mercer 19244 1.21 3.487 $7.380
178 202 B 31.6 33.0 1.4 3.0 Somerset 13474 1.19 3.487 $0.900
179 046 W 44.2 44.8 0.6 1.2 Morris 13036 1.25 3.486 $0.360
180 009 B 46.5 49.6 3.1 6.2 Atlantic 6760 1.16 3.484 $1.860
181 072 B 19.6 21.2 1.6 3.5 Ocean 13608 1.20 3.474 $1.050
182 094 B 36.3 37.1 0.8 1.6 Sussex 10504 1.19 3.472 $0.480
183 009 B 81.4 87.4 6.0 12.5 Ocean 19250 1.23 3.472 $3.750
184 046 B 7.5 10.2 2.7 5.4 Warren 7810 1.18 3.472 $1.620
185 071 B 0.1 1.8 1.7 3.4 Monmouth 16452 1.22 3.468 $1.020
186 030 E 48.9 51.2 2.3 5.3 Atlantic 14481 1.28 3.466 $1.590
187 322 W 46.5 50.1 3.6 7.2 Atlantic 12642 1.27 3.460 $2.160
188 035 B 29.5 32.8 3.3 13.2 Monmouth 32206 1.31 3.458 $3.960
189 078 E 26.9 28.7 1.8 5.4 Somerset 48135 1.60 3.457 $1.620
190 042 N 12.0 12.9 0.9 2.7 Gloucester 63808 1.72 3.455 $0.810
191 019 S 0.0 2.9 2.9 8.1 Passaic 18843 1.34 3.454 $2.430
192 028 E 23.5 25.9 2.4 4.8 Union 14498 1.30 3.453 $1.440
193 038 B 16.8 19.2 2.4 9.6 Burlington 29356 1.30 3.453 $2.880
194 001 S 42.3 45.1 2.8 7.7 Union 38839 1.53 3.451 $2.310
195 027 B 0.1 3.2 3.1 6.4 Mercer, Middlesex 11788 1.22 3.451 $1.920
196 094 B 40.9 43.1 2.2 4.4 Sussex 9330 1.21 3.448 $1.320
197 045 B 25.0 25.5 0.5 2.0 Gloucester 15788 1.25 3.443 $0.600
198 152 B 0.0 3.1 3.1 6.2 Atlantic 12254 1.23 3.442 $1.860
199 035 B 22.7 24.6 1.9 3.9 Monmouth 22552 1.29 3.433 $1.170
200 037 E 3.8 12.9 9.1 26.8 Ocean 16511 1.34 3.431 $8.040
201 035 S 12.8 14.3 1.5 2.9 Ocean 10515 1.29 3.428 $0.870
202 077 B 0.0 2.6 2.6 5.3 Cumberland 15014 1.26 3.426 $1.590
203 088 B 0.6 2.0 1.4 2.8 Ocean 22424 1.30 3.424 $0.840
204 046 B 17.3 22.4 5.1 10.9 Morris, Warren 12560 1.25 3.423 $3.270
205 046 E 59.6 60.4 0.8 2.0 Passaic 42335 1.59 3.423 $0.600

A - 7
DEFICIENT PAVEMENTS SORTED BY BENEFIT RANK – CONTINUED
Benefit Rank
Rte Dir MP
Start MP End
Center Line
Length
Lane Miles
County Avg
AADT Avg FPR
Benefit Cost
Estimate (Millions)
206 046 B 24.5 27.0 2.5 10.0 Morris 26326 1.32 3.422 $3.000
207 035 B 52.2 54.9 2.7 10.8 Middlesex 20544 1.29 3.421 $3.240
208 035 N 1.7 3.8 2.1 5.3 Ocean 5432 1.25 3.417 $1.590
209 440 S 0.0 1.8 1.8 6.2 Middlesex 58410 1.74 3.417 $1.860
210 053 B 0.0 1.1 1.1 3.2 Morris 13240 1.27 3.414 $0.960
211 009 N 123.3 125.7 2.4 7.2 Middlesex 32261 1.51 3.413 $2.160
212 046 E 70.4 72.1 1.7 3.3 Bergen 35918 1.54 3.412 $0.990
213 202 N 20.4 26.2 5.8 11.5 Somerset 30638 1.49 3.410 $3.450
214 023 N 22.0 25.7 3.7 7.4 Morris, Passaic 15535 1.36 3.404 $2.220
215 202 S 20.2 24.1 3.9 7.9 Somerset 31432 1.51 3.402 $2.370
216 032 E 0.1 1.2 1.1 2.2 Middlesex 13157 1.34 3.400 $0.660
217 034 N 0.1 7.7 7.6 15.6 Monmouth 15827 1.37 3.399 $4.680
218 206 B 65.8 66.4 0.6 1.3 Somerset 28640 1.36 3.399 $0.390
219 091 B 0.3 2.2 1.9 3.8 Middlesex 14756 1.30 3.396 $1.140
220 034 B 13.1 22.3 9.2 20.4 Monmouth 13164 1.29 3.396 $6.120
221 046 E 22.4 24.7 2.3 4.6 Morris 9919 1.32 3.395 $1.380
222 022 E 41.1 42.3 1.2 2.4 Somerset 24742 1.46 3.395 $0.720
223 439 B 2.2 2.7 0.5 1.9 Union 21504 1.33 3.393 $0.570
224 009W B 6.6 7.7 1.1 2.3 Bergen 6752 1.26 3.390 $0.690
225 168 S 0.0 0.7 0.7 1.4 Gloucester 5394 1.28 3.390 $0.420
226 018 N 34.5 38.5 4.0 11.6 Middlesex 30142 1.51 3.389 $3.480
227 009 B 32.9 34.2 1.3 2.6 Atlantic 15416 1.31 3.388 $0.780
228 035 S 14.7 15.9 1.2 2.4 Monmouth 10200 1.33 3.386 $0.720
229 130 S 48.1 49.9 1.8 3.6 Burlington 16620 1.40 3.382 $1.080
230 026 B 0.2 2.5 2.3 6.8 Middlesex 15776 1.32 3.380 $2.040
231 173 B 8.5 11.7 3.2 6.4 Hunterdon 11622 1.30 3.379 $1.920
232 046 W 45.5 46.3 0.8 2.4 Morris 17180 1.41 3.376 $0.720
233 017 N 3.5 4.7 1.2 2.9 Bergen 16756 1.41 3.374 $0.870
234 072 B 0.0 19.3 19.3 38.6 Burlington, Ocean 9208 1.30 3.371 $11.580
235 019 N 0.0 1.5 1.5 3.7 Passaic 16544 1.41 3.365 $1.110
236 138 W 1.3 3.5 2.2 4.6 Monmouth 14164 1.39 3.364 $1.380
237 173 B 4.0 8.1 4.1 14.4 Hunterdon 11622 1.32 3.361 $4.320
238 070 W 2.2 3.8 1.6 3.8 Camden 26253 1.51 3.356 $1.140
239 206 N 68.9 70.7 1.8 4.9 Somerset 14441 1.41 3.353 $1.470
240 138 W 0.0 0.9 0.9 1.8 Monmouth 21880 1.48 3.351 $0.540
241 295 S 2.9 4.3 1.4 2.8 Salem 13280 1.41 3.342 $0.840
242 080 E 4.7 8.5 3.8 12.8 Warren 27063 1.54 3.341 $3.840
243 010 E 1.2 2.5 1.3 2.6 Morris 14045 1.42 3.341 $0.780
244 035 B 34.0 34.5 0.5 2.0 Monmouth 32422 1.44 3.339 $0.600
245 033 B 38.0 39.9 1.9 7.6 Monmouth 19540 1.38 3.338 $2.280
246 206 B 88.5 95.0 6.5 14.0 Morris 21264 1.39 3.336 $4.200
247 035 N 14.0 16.0 2.0 4.0 Monmouth, Ocean 10294 1.39 3.334 $1.200

A - 8
DEFICIENT PAVEMENTS SORTED BY BENEFIT RANK – CONTINUED
Benefit Rank
Rte Dir MP
Start MP End
Center Line
Length
Lane Miles
County Avg
AADT Avg FPR
Benefit Cost
Estimate (Millions)
248 676 S 2.4 3.2 0.8 2.4 Camden 34460 1.62 3.333 $0.720
249 040 B 14.0 14.9 0.9 1.8 Salem 12132 1.35 3.332 $0.540
250 202 S 24.8 26.3 1.5 2.5 Somerset 27729 1.55 3.332 $0.750
251 010 B 19.0 20.4 1.4 5.6 Essex 17002 1.38 3.332 $1.680
252 037 W 6.0 10.5 4.5 13.2 Ocean 16966 1.46 3.328 $3.960
253 202 N 7.4 11.4 4.0 8.0 Hunterdon 18414 1.48 3.326 $2.400
254 036 S 1.9 3.7 1.8 3.6 Monmouth 18674 1.48 3.325 $1.080
255 080 W 4.9 6.4 1.5 4.5 Warren 27491 1.56 3.324 $1.350
256 031 B 23.3 25.2 1.9 5.0 Hunterdon 25200 1.42 3.323 $1.500
257 046 W 24.2 24.7 0.5 1.0 Morris 11536 1.42 3.320 $0.300
258 035 S 1.7 2.9 1.2 3.3 Ocean 5494 1.36 3.317 $0.990
259 029 B 9.4 15.3 5.9 11.8 Mercer 11382 1.37 3.317 $3.540
260 017 N 7.3 9.0 1.7 4.5 Bergen 38677 1.68 3.312 $1.350
261 173 B 0.3 3.3 3.0 6.0 Warren 9386 1.37 3.306 $1.800
262 049 B 31.7 36.1 4.4 8.8 Cumberland 12150 1.38 3.306 $2.640
263 001 S 28.6 29.8 1.2 3.6 Middlesex 39039 1.69 3.306 $1.080
264 022 E 37.4 39.2 1.8 4.0 Somerset 27034 1.58 3.304 $1.200
265 001 N 16.0 17.0 1.0 2.3 Middlesex 26891 1.58 3.304 $0.690
266 093 B 0.1 1.0 0.9 2.7 Bergen 21906 1.43 3.304 $0.810
267 031 B 43.0 43.5 0.5 1.7 Warren 14648 1.40 3.297 $0.510
268 046 E 32.2 33.3 1.1 2.0 Morris 15404 1.48 3.296 $0.600
269 031 B 38.7 42.6 3.9 9.1 Hunterdon, Warren 18336 1.42 3.296 $2.730
270 080 E 39.8 41.6 1.8 7.2 Morris 46488 1.77 3.294 $2.160
271 206 B 54.6 56.7 2.1 4.2 Mercer 18496 1.43 3.293 $1.260
272 080 E 8.9 10.5 1.6 5.0 Warren 24579 1.57 3.290 $1.500
273 073 B 10.9 13.0 2.1 8.4 Camden 20648 1.44 3.289 $2.520
274 045 B 15.1 17.3 2.2 4.4 Gloucester 9048 1.39 3.288 $1.320
275 322 B 17.8 24.2 6.4 12.8 Gloucester 13320 1.41 3.285 $3.840
276 080L W 44.1 45.5 1.4 2.8 Morris 35650 1.68 3.282 $0.840
277 295 S 1.3 2.5 1.2 2.6 Salem 12651 1.47 3.278 $0.780
278 130 B 0.1 3.3 3.2 6.4 Salem 12550 1.42 3.278 $1.920
279 034 B 23.0 24.8 1.8 3.7 Middlesex,
Monmouth 23100 1.47 3.277 $1.110
280 053 B 2.0 4.5 2.5 5.0 Morris 15270 1.43 3.274 $1.500
281 040 B 47.0 51.2 4.2 8.6 Atlantic 22232 1.46 3.274 $2.580
282 023 N 5.6 6.1 0.5 1.1 Passaic 38919 1.72 3.274 $0.330
283 050 B 9.9 16.2 6.3 12.6 Atlantic 7536 1.40 3.272 $3.780
284 044 B 2.6 9.1 6.5 13.4 Gloucester 4742 1.39 3.272 $4.020
285 033 W 18.1 20.7 2.6 5.2 Middlesex,
Monmouth 15094 1.51 3.269 $1.560
286 018 N 6.8 9.1 2.3 4.6 Monmouth 19874 1.55 3.267 $1.380
287 009 B 23.4 27.5 4.1 8.2 Cape May 8516 1.41 3.266 $2.460
288 035 S 24.6 27.9 3.3 6.3 Monmouth 13708 1.50 3.266 $1.890
289 070 W 4.6 7.0 2.4 6.6 Camden 28459 1.64 3.266 $1.980

A - 9
DEFICIENT PAVEMENTS SORTED BY BENEFIT RANK – CONTINUED
Benefit Rank
Rte Dir MP
Start MP End
Center Line
Length
Lane Miles
County Avg
AADT Avg FPR
Benefit Cost
Estimate (Millions)
290 018 S 16.3 17.4 1.1 2.2 Monmouth 20141 1.56 3.264 $0.660
291 206 B 106.4 114.2 7.8 17.8 Sussex 16138 1.45 3.262 $5.340
292 070 W 44.3 44.8 0.5 0.9 Ocean 8812 1.46 3.259 $0.270
293 202 B 36.5 47.0 10.5 22.9 Morris, Somerset 11058 1.43 3.259 $6.870
294 038 W 14.4 16.8 2.4 5.1 Burlington 15943 1.53 3.258 $1.530
295 138 E 0.1 3.4 3.3 6.5 Monmouth 16912 1.54 3.254 $1.950
296 130 N 47.3 51.2 3.9 7.8 Burlington 16620 1.54 3.253 $2.340
297 130 N 25.3 26.9 1.6 3.8 Camden, Gloucester 13338 1.51 3.253 $1.140
298 018 N 14.7 17.3 2.6 5.2 Monmouth 18925 1.56 3.252 $1.560
299 073 S 33.2 34.1 0.9 2.1 Burlington 18343 1.56 3.249 $0.630
300 022 E 4.0 4.5 0.5 1.0 Warren 18111 1.56 3.247 $0.300
301 010 E 3.4 7.5 4.1 8.8 Morris 19777 1.58 3.247 $2.640
302 040 B 8.2 10.1 1.9 3.8 Salem 16280 1.47 3.244 $1.140
303 040 B 10.8 13.3 2.5 5.0 Salem 13430 1.46 3.244 $1.500
304 004 E 8.3 10.8 2.5 6.9 Bergen 43862 1.81 3.240 $2.070
305 080L E 44.2 46.1 1.9 4.1 Morris 34483 1.72 3.240 $1.230
306 007 B 6.3 8.2 1.9 7.6 Essex 14624 1.47 3.237 $2.280
307 033 E 19.2 21.2 2.0 4.0 Monmouth 15418 1.55 3.237 $1.200
308 109 N 1.5 2.5 1.0 2.0 Cape May 8597 1.49 3.234 $0.600
309 018 N 29.6 33.9 4.3 8.6 Middlesex, Monmouth
22405 1.61 3.234 $2.580
310 035 B 55.4 57.9 2.5 10.0 Middlesex 22232 1.51 3.234 $3.000
311 079 B 0.1 4.6 4.5 9.0 Monmouth 16568 1.48 3.233 $2.700
312 009W B 4.7 6.0 1.3 2.6 Bergen 6752 1.44 3.228 $0.780
313 080 E 23.5 24.0 0.5 1.5 Morris 31720 1.71 3.228 $0.450
314 047 B 13.9 17.1 3.2 6.4 Cape May 9292 1.46 3.225 $1.920
315 034 B 10.2 12.0 1.8 3.6 Monmouth 17360 1.50 3.223 $1.080
316 047 B 47.3 47.8 0.5 1.2 Cumberland 17604 1.50 3.219 $0.360
317 029 N 6.5 9.2 2.7 5.4 Mercer 9389 1.51 3.219 $1.620
318 082 B 1.7 2.2 0.5 2.0 Union 27708 1.55 3.219 $0.600
319 047 B 42.0 42.6 0.6 2.6 Cumberland 30028 1.56 3.218 $0.780
320 183 B 0.8 1.8 1.0 2.0 Morris, Sussex 13420 1.49 3.216 $0.600
321 322 E 45.9 48.2 2.3 4.6 Atlantic 12432 1.54 3.215 $1.380
322 015 B 15.5 16.7 1.2 2.8 Sussex 22996 1.54 3.209 $0.840
323 046 B 39.4 40.1 0.7 2.4 Morris 20872 1.54 3.204 $0.720
324 036 N 22.9 23.7 0.8 1.6 Monmouth 16875 1.60 3.203 $0.480
325 322 B 43.5 45.9 2.4 9.6 Atlantic 23916 1.56 3.198 $2.880
326 073 B 9.0 10.0 1.0 4.0 Camden 14904 1.52 3.197 $1.200
327 009 B 42.7 43.8 1.1 2.3 Atlantic 6854 1.48 3.196 $0.690
328 040 W 4.1 5.3 1.2 2.4 Salem 7184 1.52 3.194 $0.720
329 202 S 8.8 11.0 2.2 4.5 Hunterdon 18392 1.63 3.191 $1.350
330 440 S 24.1 24.6 0.5 1.0 Hudson 28444 1.72 3.189 $0.300
331 130 B 3.8 8.9 5.1 10.2 Gloucester, Salem 5696 1.48 3.188 $3.060
A - 10
DEFICIENT PAVEMENTS SORTED BY BENEFIT RANK – CONTINUED
Benefit Rank
Rte Dir MP
Start MP End
Center Line
Length
Lane Miles
County Avg
AADT Avg FPR
Benefit Cost
Estimate (Millions)
332 080 E 0.5 3.2 2.7 5.4 Warren 33383 1.77 3.186 $1.620
333 047 B 74.4 75.2 0.8 2.5 Gloucester 11062 1.51 3.185 $0.750
334 004 E 0.8 2.0 1.2 2.4 Bergen 22346 1.67 3.185 $0.720
335 206 S 68.5 70.9 2.4 5.4 Somerset 14612 1.60 3.184 $1.620
336 036 S 5.8 6.4 0.6 1.2 Monmouth 9182 1.55 3.181 $0.360
337 322 B 37.0 43.1 6.1 24.4 Atlantic 13948 1.53 3.179 $7.320
338 080 E 12.8 13.4 0.6 2.0 Warren 31870 1.76 3.178 $0.600
339 004 W 2.3 5.9 3.6 10.4 Bergen 56607 2.00 3.175 $3.120
340 001L S 47.6 48.5 0.9 1.8 Essex 19637 1.66 3.171 $0.540
341 122 B 0.8 2.4 1.6 3.2 Warren 9498 1.52 3.167 $0.960
342 007 B 3.3 5.2 1.9 4.0 Bergen, Hudson 17724 1.56 3.167 $1.200
343 047 B 32.3 41.0 8.7 17.4 Cumberland 8420 1.52 3.166 $5.220
344 049 B 18.8 25.2 6.4 13.4 Cumberland 9140 1.53 3.163 $4.020
345 031 S 31.9 34.4 2.5 5.0 Hunterdon 16454 1.64 3.163 $1.500
346 077 B 11.2 21.8 10.6 21.2 Gloucester, Salem 5632 1.51 3.162 $6.360
347 029 N 4.7 5.6 0.9 1.8 Mercer 17066 1.65 3.161 $0.540
348 036 S 12.2 13.7 1.5 3.0 Monmouth 8230 1.56 3.161 $0.900
349 009 B 55.3 70.2 14.9 29.8 Burlington, Ocean 12844 1.55 3.159 $8.940
350 070 B 44.9 49.5 4.6 9.2 Ocean 24556 1.61 3.158 $2.760
351 049 B 8.5 10.6 2.1 4.2 Salem 8390 1.53 3.157 $1.260
352 056 B 0.1 4.9 4.8 9.8 Cumberland, Salem 8754 1.53 3.156 $2.940
353 202 N 30.0 31.5 1.5 3.0 Somerset 6737 1.56 3.152 $0.900
354 202 S 30.0 31.3 1.3 2.3 Somerset 6737 1.56 3.152 $0.690
355 070 E 3.9 6.8 2.9 8.0 Camden 28317 1.76 3.151 $2.400
356 094 S 0.1 0.7 0.6 0.9 Warren 3140 1.53 3.146 $0.270
357 055 S 50.1 51.1 1.0 2.0 Gloucester 22920 1.72 3.143 $0.600
358 029 B 31.9 34.3 2.4 4.8 Hunterdon 2032 1.52 3.140 $1.440
359 003 W 0.0 0.9 0.9 1.8 Passaic 55915 2.03 3.140 $0.540
360 280 E 4.1 4.6 0.5 1.5 Essex 31188 1.80 3.137 $0.450
361 094 B 37.6 40.4 2.8 5.6 Sussex 10336 1.56 3.135 $1.680
362 440 N 0.4 3.5 3.1 9.6 Middlesex 53309 2.01 3.134 $2.880
363 031 B 13.6 15.2 1.6 3.4 Hunterdon 23656 1.63 3.133 $1.020
364 009 B 50.2 52.4 2.2 4.4 Atlantic 7154 1.55 3.132 $1.320
365 066 B 1.5 2.3 0.8 1.6 Monmouth 22546 1.62 3.132 $0.480
366 109 B 2.5 3.1 0.6 1.2 Cape May 18476 1.61 3.129 $0.360
367 078L W 49.2 51.7 2.5 7.2 Union 35329 1.86 3.125 $2.160
368 030 W 36.7 37.6 0.9 1.8 Atlantic 7913 1.61 3.121 $0.540
369 206 B 21.8 30.4 8.6 24.7 Burlington 15422 1.61 3.119 $7.410
370 029 B 17.0 17.5 0.5 1.0 Hunterdon 9760 1.58 3.119 $0.300
371 130 S 33.0 36.4 3.4 10.5 Burlington, Camden 20982 1.73 3.118 $3.150
372 083 B 0.3 3.8 3.5 7.0 Cape May 5074 1.56 3.117 $2.100

A - 11
DEFICIENT PAVEMENTS SORTED BY BENEFIT RANK – CONTINUED
Benefit Rank
Rte Dir MP
Start MP End
Center Line
Length
Lane Miles
County Avg
AADT Avg FPR
Benefit Cost
Estimate (Millions)
373 047 B 69.9 70.6 0.7 1.4 Gloucester 14724 1.61 3.114 $0.420
374 012 B 9.8 11.4 1.6 3.2 Hunterdon 12928 1.60 3.113 $0.960
375 070 E 44.3 44.8 0.5 1.0 Ocean 8812 1.62 3.112 $0.300
376 023 B 49.7 50.3 0.6 1.7 Sussex 3420 1.56 3.110 $0.510
377 094 B 25.0 27.7 2.7 5.4 Sussex 11208 1.60 3.109 $1.620
378 028 B 17.3 18.4 1.1 2.2 Union 11286 1.60 3.108 $0.660
379 206 B 19.1 20.7 1.6 3.2 Burlington 15716 1.62 3.105 $0.960
380 168 N 0.0 0.7 0.7 1.4 Gloucester 5394 1.60 3.102 $0.420
381 202 B 26.3 28.5 2.2 4.4 Somerset 29734 1.69 3.101 $1.320
382 109 S 2.0 2.5 0.5 0.8 Cape May 8521 1.64 3.098 $0.240
383 068 B 1.5 3.7 2.2 4.4 Burlington 6732 1.59 3.094 $1.320
384 029 B 19.8 21.7 1.9 4.6 Hunterdon 5884 1.59 3.091 $1.380
385 007 B 9.4 10.1 0.7 1.4 Essex 12416 1.63 3.089 $0.420
386 109 B 1.4 1.9 0.5 1.8 Cape May 16150 1.65 3.083 $0.540
387 040 B 32.0 32.7 0.7 1.4 Atlantic, Gloucester 8048 1.62 3.077 $0.420
388 046 E 6.8 7.3 0.5 1.0 Warren 4464 1.63 3.072 $0.300
389 040 B 26.8 27.3 0.5 1.0 Gloucester 11098 1.65 3.060 $0.300
390 046 W 51.4 52.2 0.8 1.2 Essex, Morris 18099 1.77 3.058 $0.360
391 168 S 8.6 9.7 1.1 2.8 Camden 9365 1.69 3.054 $0.840
392 078 E 9.5 10.4 0.9 2.7 Hunterdon 45494 2.04 3.041 $0.810
393 035 B 18.6 19.8 1.2 2.4 Monmouth 21302 1.72 3.039 $0.720
394 001 S 47.6 49.0 1.4 2.8 Essex 23054 1.84 3.037 $0.840
395 094 N 0.1 0.7 0.6 0.9 Warren 3140 1.67 3.027 $0.270
396 009 B 5.4 17.4 12.0 25.0 Cape May 11170 1.69 3.026 $7.500
397 206 B 6.3 11.1 4.8 9.6 Burlington 9096 1.69 3.017 $2.880
398 036 N 20.3 21.9 1.6 3.4 Monmouth 15223 1.80 3.004 $1.020
399 072 W 25.4 27.6 2.2 4.8 Ocean 9466 1.76 2.995 $1.440
400 035 S 34.5 38.3 3.8 8.0 Monmouth 16211 1.82 2.995 $2.400
401 037 W 12.7 13.4 0.7 1.8 Ocean 5570 1.73 2.993 $0.540
402 004 W 1.0 1.5 0.5 1.0 Bergen 17366 1.84 2.991 $0.300
403 070 E 0.3 3.4 3.1 8.5 Camden 25802 1.93 2.980 $2.550
404 030 B 4.5 6.6 2.1 4.2 Camden 29396 1.83 2.979 $1.260
405 440 N 19.0 19.8 0.8 1.6 Hudson 27072 1.95 2.974 $0.480
406 168 N 8.6 9.8 1.2 2.6 Camden 9365 1.79 2.965 $0.780
407 030 W 49.6 51.3 1.7 3.4 Atlantic 15396 1.87 2.948 $1.020
408 130 N 33.8 36.3 2.5 7.5 Burlington, Camden 21016 1.92 2.948 $2.250
409 046 B 34.3 37.4 3.1 8.0 Morris 14782 1.79 2.947 $2.400
410 206 B 99.6 103.2 3.6 8.5 Sussex 18176 1.81 2.946 $2.550
411 031 B 22.1 22.9 0.8 1.9 Hunterdon 25588 1.85 2.943 $0.570
412 047 B 67.7 68.6 0.9 1.8 Gloucester 17510 1.81 2.942 $0.540
413 156 B 0.1 1.1 1.0 2.0 Mercer 1788 1.75 2.931 $0.600
414 049 B 5.8 8.0 2.2 4.4 Salem 10494 1.80 2.923 $1.320
415 130 S 46.6 47.6 1.0 2.0 Burlington 16620 1.91 2.919 $0.600

A - 12
DEFICIENT PAVEMENTS SORTED BY BENEFIT RANK – CONTINUED
Benefit Rank
Rte Dir MP
Start MP End
Center Line
Length
Lane Miles
County Avg
AADT Avg FPR
Benefit Cost
Estimate (Millions)
416 047 B 62.9 64.3 1.4 4.7 Gloucester 8446 1.80 2.913 $1.410
417 080 W 59.6 62.5 2.9 11.1 Bergen, Passaic 57454 2.30 2.911 $3.330
418 009 N 135.2 135.9 0.7 1.5 Middlesex 27522 2.02 2.909 $0.450
419 130 S 30.6 31.5 0.9 2.7 Camden 20645 1.96 2.909 $0.810
420 030 B 18.5 32.3 13.8 55.2 Atlantic, Camden 11800 1.83 2.903 $16.560
421 009 N 114.9 116.1 1.2 2.8 Monmouth 12261 1.90 2.895 $0.840
422 130 S 26.2 27.9 1.7 5.1 Camden 17406 1.95 2.892 $1.530
423 045 B 4.2 8.3 4.1 8.2 Salem 4872 1.81 2.888 $2.460
424 076 N 1.4 2.0 0.6 3.2 Camden 79783 2.35 2.882 $0.960
425 206 B 87.5 88.1 0.6 1.8 Morris 19752 1.90 2.875 $0.540
426 070 E 49.6 50.5 0.9 1.8 Ocean 13508 1.94 2.869 $0.540
427 021 N 4.9 9.3 4.4 13.2 Essex, Passaic 32133 2.12 2.860 $3.960
428 022 W 24.1 25.3 1.2 2.4 Hunterdon 14254 1.96 2.853 $0.720
429 072 E 21.6 23.2 1.6 3.8 Ocean 16636 2.00 2.843 $1.140
430 009 B 95.1 98.8 3.7 7.4 Ocean 21692 1.95 2.839 $2.220
431 168 B 5.0 8.6 3.6 9.5 Camden 20282 1.94 2.836 $2.850
432 054 B 5.2 8.4 3.2 6.4 Atlantic 10124 1.91 2.826 $1.920
433 035 S 50.6 51.3 0.7 1.1 Middlesex 12406 1.98 2.823 $0.330
434 078L E 50.8 52.6 1.8 5.4 Union 39549 2.25 2.802 $1.620
435 022 W 37.5 41.0 3.5 7.4 Somerset 25820 2.13 2.801 $2.220
436 001 B 62.2 62.8 0.6 1.6 Bergen 37628 2.09 2.778 $0.480
437 078 W 9.5 10.1 0.6 1.8 Hunterdon 45494 2.34 2.777 $0.540
438 072 W 21.2 24.7 3.5 7.2 Ocean 15632 2.06 2.772 $2.160
439 130 N 43.6 45.2 1.6 4.8 Burlington 18440 2.09 2.771 $1.440
440 070 W 0.0 0.8 0.8 2.4 Camden 23818 2.14 2.771 $0.720
441 047 B 43.9 46.6 2.7 6.4 Cumberland 20448 2.02 2.771 $1.920
442 030 E 0.9 1.9 1.0 3.2 Camden 30128 2.22 2.753 $0.960
443 130 N 32.7 33.3 0.6 1.8 Camden 20769 2.14 2.746 $0.540
444 439 B 3.0 4.0 1.0 3.0 Union 23462 2.07 2.737 $0.900
445 022 W 52.6 54.3 1.7 3.4 Union 39176 2.32 2.736 $1.020
446 029 B 23.1 31.5 8.4 16.8 Hunterdon 2652 1.99 2.723 $5.040
447 040 W 52.4 53.7 1.3 2.6 Atlantic 17223 2.14 2.719 $0.780
448 040 B 21.7 25.0 3.3 6.7 Gloucester, Salem 10176 2.03 2.712 $2.010
449 130 S 37.6 38.9 1.3 3.9 Burlington 20216 2.18 2.709 $1.170
450 041 B 0.9 2.7 1.8 3.6 Gloucester 14328 2.07 2.693 $1.080
451 040 E 3.8 5.7 1.9 3.8 Salem 7263 2.08 2.692 $1.140
452 036 N 2.3 3.2 0.9 1.8 Monmouth 18013 2.20 2.674 $0.540
453 001 S 50.0 50.6 0.6 1.8 Essex 27977 2.30 2.666 $0.540
454 030 B 33.1 33.6 0.5 2.0 Atlantic 12112 2.12 2.641 $0.600
455 012 B 0.9 4.9 4.0 9.3 Hunterdon 5952 2.10 2.639 $2.790
456 031 B 46.1 48.9 2.8 6.4 Warren 10604 2.12 2.636 $1.920
457 024 W 6.6 9.0 2.4 7.2 Essex, Union 47632 2.52 2.629 $2.160
458 055 S 21.8 24.6 2.8 5.6 Cumberland 7343 2.16 2.621 $1.680

A - 13
DEFICIENT PAVEMENTS SORTED BY BENEFIT RANK – CONTINUED
Benefit Rank
Rte Dir MP
Start MP End
Center Line
Length
Lane Miles
County Avg
AADT Avg FPR
Benefit Cost
Estimate (Millions)
459 079 B 5.4 7.6 2.2 4.4 Monmouth 16276 2.17 2.614 $1.320
460 031 N 32.0 34.4 2.4 4.6 Hunterdon 16485 2.25 2.613 $1.380
461 072 E 25.7 27.4 1.7 3.4 Ocean 9466 2.19 2.611 $1.020
462 004 W 10.0 10.5 0.5 1.1 Bergen 42289 2.49 2.607 $0.330
463 130 N 67.7 72.7 5.0 10.0 Mercer, Middlesex 9882 2.20 2.605 $3.000
464 168 B 2.0 3.6 1.6 3.2 Camden 12430 2.17 2.603 $0.960
465 130 S 8.9 12.1 3.2 6.4 Gloucester 4311 2.16 2.595 $1.920
466 021 N 12.7 14.4 1.7 3.4 Passaic 31355 2.43 2.576 $1.020
467 322 E 4.2 4.9 0.7 1.4 Gloucester 9002 2.23 2.567 $0.420
468 287 N 53.0 58.3 5.3 15.9 Bergen, Morris,
Passaic 44034 2.56 2.563 $4.770
469 055 N 33.2 34.3 1.1 2.2 Cumberland 17299 2.36 2.524 $0.660
470 048 B 0.3 4.2 3.9 7.8 Salem 4056 2.22 2.522 $2.340
471 021 S 12.8 14.3 1.5 3.0 Passaic 31271 2.50 2.515 $0.900
472 036 N 12.8 14.0 1.2 2.4 Monmouth 8768 2.31 2.494 $0.720
473 080L W 65.1 68.1 3.0 9.2 Bergen 35187 2.56 2.493 $2.760
474 009 N 107.5 110.5 3.0 6.0 Monmouth 23004 2.45 2.489 $1.800
475 030 E 54.8 57.0 2.2 4.9 Atlantic 21355 2.44 2.480 $1.470
476 031 N 27.4 29.2 1.8 3.6 Hunterdon 13012 2.38 2.466 $1.080
477 287 S 48.3 54.1 5.8 18.7 Morris, Passaic 42441 2.66 2.460 $5.610
478 206 B 64.8 65.4 0.6 1.4 Somerset 28640 2.40 2.458 $0.420
479 130 N 8.9 11.7 2.8 5.6 Gloucester 3884 2.33 2.439 $1.680
480 287 S 60.7 67.2 6.5 15.1 Bergen 39067 2.67 2.420 $4.530
481 057 B 3.2 3.8 0.6 1.2 Warren 12522 2.37 2.416 $0.360
482 021 S 9.0 10.0 1.0 3.0 Passaic 29710 2.59 2.414 $0.900
483 080 E 28.4 31.8 3.4 10.2 Morris 40830 2.71 2.402 $3.060
484 287 N 47.2 49.1 1.9 5.7 Morris 39167 2.70 2.400 $1.710
485 047 B 66.4 67.3 0.9 1.8 Gloucester 10380 2.39 2.396 $0.540
486 030 W 38.1 39.1 1.0 2.0 Atlantic 9099 2.43 2.385 $0.600
487 030 W 52.7 53.9 1.2 2.4 Atlantic 19198 2.54 2.374 $0.720
488 030 W 54.5 55.8 1.3 2.6 Atlantic 21023 2.56 2.370 $0.780
489 095M N 2.4 3.5 1.1 3.3 Mercer 28482 2.64 2.360 $0.990
490 009 N 105.2 106.0 0.8 1.7 Monmouth 22753 2.60 2.352 $0.510
491 078 E 51.9 52.9 1.0 2.0 Union 38872 2.76 2.338 $0.600
492 095M S 2.2 3.3 1.1 3.3 Mercer 27411 2.66 2.338 $0.990
493 206 B 123.9 129.3 5.4 10.8 Sussex 6696 2.45 2.320 $3.240
494 168 B 0.7 1.2 0.5 1.1 Camden, Gloucester 10788 2.48 2.317 $0.330
495 022 E 49.4 51.0 1.6 3.2 Union 18351 2.62 2.295 $0.960
496 088 B 8.4 9.4 1.0 2.9 Ocean 14688 2.53 2.281 $0.870
497 010 W 0.7 1.2 0.5 1.0 Morris 14045 2.60 2.273 $0.300
498 036 N 14.6 19.9 5.3 10.8 Monmouth 11455 2.58 2.271 $3.240
499 206 B 114.8 116.0 1.2 2.4 Sussex 15322 2.56 2.260 $0.720
500 044 B 1.0 2.1 1.1 2.2 Gloucester 1536 2.50 2.253 $0.660

A - 14
DEFICIENT PAVEMENTS SORTED BY BENEFIT RANK – CONTINUED
Benefit Rank
Rte Dir MP
Start MP End
Center Line
Length
Lane Miles
County Avg
AADT Avg FPR
Benefit Cost
Estimate (Millions)
501 047 B 53.2 54.2 1.0 2.0 Gloucester 8296 2.54 2.252 $0.600
502 130 N 58.4 60.2 1.8 3.6 Mercer 13072 2.63 2.245 $1.080
503 023 B 50.9 52.5 1.6 4.8 Sussex 3420 2.53 2.237 $1.440
504 010 W 3.8 4.7 0.9 1.8 Morris 18200 2.69 2.229 $0.540
505 055 N 25.2 27.0 1.8 3.6 Cumberland 8036 2.61 2.217 $1.080
506 055 N 27.4 30.4 3.0 6.0 Cumberland 11843 2.67 2.199 $1.800
507 078 W 18.1 18.7 0.6 2.2 Hunterdon 25514 2.85 2.145 $0.660
508 055 S 25.4 26.1 0.7 1.4 Cumberland 7446 2.92 1.932 $0.420
Totals 3,182.6 $954.780