prepared by: new jersey department of transportation ... 2010 hwy resurfacing – capital program...
TRANSCRIPT
Prepared by:
New Jersey Department of Transportation
March 2011

DEPARTMENT OF TRANSPORTATIONP.O. Box 600
Trenton, New Jersey 08625-0600CHRIS CHRISTIE JAMES S. SIMPSON
Governor Commissioner
KIM GUADAGNOLt. Governor
“IMPROVING LIVES BY IMPROVING TRANSPORTATION”New Jersey Is An Equal Opportunity Employer • Printed on Recycled and Recyclable Paper
Dear New Jersey Citizens:
In compliance with N.J.S.A. 27:1B-21.23 and 21.24, I am pleased to submit the Department’s Reporton New Jersey’s state maintained pavement system for fiscal year 2010. The state highway network isone of New Jersey’s largest assets and preserving our pavement investment continues to be a highpriority for the Department. The state highway system carries approximately 41% of the state’svehicular travel and is an essential element of New Jersey’s economy. A comprehensive PavementManagement Plan is utilized to make the most effective use of available resources. This plan includesa mix of pavement treatments ranging from preventive maintenance to rehabilitation andreconstruction, taking advantage of the Department’s expedited project delivery system.
The Department strives to maintain the roadway infrastructure in a state of good repair and addressdeficiencies. Funding for pavement projects continues to be a major constraint to networkimprovement. By using combined State and federal AARA funds, improvements have been made tothe highway network, slightly reducing New Jersey’s percentage of deficient pavements. TheDepartment has established a goal of reducing this deficiency to no more than 20% of the network,which analysis indicates requires an average investment of approximately $290 million per year over a10 year period. Eliminating the backlog of deficient pavements entirely would require an averageinvestment of approximately $600 million per year, over the next 10 years.
The funds needed to meet our pavement investment goals are supported by the ChristieAdministration’s Transportation Capital Program. The proposed FY 2012 Capital Program includesan investment of $284 million in highway rehabilitation, reconstruction, resurfacing and capitalmaintenance. With this investment rate the Department expects to improve pavements from a currentcondition of 50% acceptable to nearly 80% acceptable over the next 10 years. This will meet theDepartment’s 10-year asset management goal for pavement.
This report highlights work completed through the Plan in fiscal year 2010. Additionally, incompliance with statutory mandates, Appendix A of this report details pavement segments of the statehighway system in need of major repair in the future.

ii
TABLE OF CONTENTS
Page
CURRENT STATUS OF STATE HIGHWAY SYSTEM ........................................................ 1 Description of System................................................................................................... 1
Figure 1: NJ Roadway System, Breakdown By Lane Miles ............................ 1 Assessment of the State Highway System.................................................................... 2
Table 1: Condition Criteria ............................................................................... 2 Table 2: Functional Adequacy of NJ State Hwy System - 2009 Data.............. 3 Figure 2: Functional Adequacy of NJ State Hwy System - 2009 Data ............ 3 Figure 3: Multi-Year Status of State Highway System .................................... 4
PAVEMENT PRESERVATION FUNDING ............................................................................. 5 Table 3: FY 2010 Pavement Preservation Funding ...................................................... 5
WORK COMPLETED IN FISCAL YEAR 2010 ...................................................................... 6 FY 2010 Highway Capital Maintenance Projects......................................................... 6 FY 2010 Highway Resurfacing – Operations Division Projects .................................. 6
Table 4: Contracts ............................................................................................. 7 FY 2010 Hwy Resurfacing – Capital Program Mgt. Projects (Regular Funding)........ 8
Table 5: Projects ............................................................................................... 8 FY 2010 Hwy Resurfacing – Capital Program Mgt. Projects (Stimulus Funding) ...... 9
Table 6: Projects ............................................................................................... 9 FY 2010 Highway Rehab & Reconstruction – Capital Program Mgt. Projects ......... 10
Table 7: Projects ............................................................................................. 10 Multi-Year Summary of Major Pavement Work ........................................................ 10
Figure 4: Lane Miles of Major Pavement Work Completed .......................... 10
REFERENCES............................................................................................................................ 11
APPENDICESA. Deficient Pavement Sections Needing Future Restoration ............................................. A-1

1
CURRENT STATUS OF THE STATE HIGHWAY SYSTEM
Description of System
There are approximately 38,566 centerline(CL) miles of roadways in New Jersey.NJDOT maintains approximately 2,316 CLmiles of roads, commonly referred to as thestate highway system. Most of the remainingmileage is under the jurisdiction of counties(6,649 CL miles) and municipalities (28,539CL miles). Other mileage consists of toll roadsincluding the Garden State Parkway (173 CLmiles) and the New Jersey Turnpike (149 CLmiles) administered by the New JerseyTurnpike Authority, the Atlantic CityExpressway (46 CL miles) administered by theSouth Jersey Transportation Authority, thePalisades Interstate Parkway (12 CL miles),and mileage maintained by bridge authorities(33 CL miles). Finally, park roads account forapproximately 649 CL miles.
To get a better idea of pavement quantities,lane miles rather than centerline miles are used(1 mile of a 2 lane road represents 2 lanemiles). As shown in Figure 1 below, NJDOTmaintains about 10% of the total statewide lanemileage, but approximately 41% of all traffic,including a high percentage of heavy trucks, iscarried on NJDOT maintained roads.
FIGURE 1NJ Roadway System Breakdown by Lane Miles
County Roads22%NJDOT
MaintainedRoads
10%
Parks1%
Other (IncludingToll & BridgeAuthorities)
3%
Municipal Roads64%

2
Assessment of the State Highway System
Evaluation of the New Jersey state highway system is based upon data collected on statemaintained roads and stored in the Pavement Management System. Analysis of this data toassess current pavement conditions considers the following functional adequacy indices:
IRI (International Roughness Index) estimates roughness as perceived by vehicleoccupants by using lasers to determine the actual variations in the pavement surface froma perfectly flat condition, measured in inches per mile.
SDI (Surface Distress Index) assesses surface distress and visible deterioration byevaluating cracking, patching, faulting, shoulder drop, and joint deterioration. SDI isreported on a scale of 0 to 5 (5 is a perfect pavement free of any distress).
Rut Depth measures depths of grooves primarily in vehicle wheel paths. Skid Number measures the pavement surface frictional characteristics.
While all of the indices listed above are considered in selecting locations and types of pavementtreatments, IRI and SDI are most indicative of functional adequacy and are used to evaluate thesystem status. IRI is a national standard supported by the Federal Highway Administration andSDI is a New Jersey standard used for many years in roadway assessment.
The analyses discussed herein utilized 2009 road data to evaluate the state highway systemconsisting of approximately 2316 centerline miles of roadway. In terms of pavement quantities,this amounts to 8410 lane miles of mainline roadway, 4086 miles of shoulders, and 563 miles oframps that are state owned and maintained. The criteria shown in Table 1 below were used toevaluate the mainline roadway condition.
TABLE 1 - CONDITION CRITERIA
Source: The Road Information Program, April 2004
Status
Condition Index Criteria(IRI = International Roughness
Index, in/mi; SDI = SurfaceDistress Index, 0 – 5 Scale)
Engineering Significance
Deficient(Poor) IRI > 170 OR SDI ≤ 2.4
These roads are overdue for treatment. Drivers on these roads arelikely to notice that they are driving on a rough surface, which putsstress on their vehicles. These pavements may have deteriorated tosuch an extent that they affect the speed of free flow traffic. Flexiblepavements may have large potholes and deep cracks. These roadsoften show significant signs of wear and deterioration, and may havesignificant distress in the underlying foundation. Roads in thiscondition will generally be most costly to rehabilitate.
Fair
(95 ≤ IRI ≤ 170 And SDI > 2.4)
OR
(IRI < 95 And 2.4 < SDI < 3.5)
These roads exhibit minimally acceptable ride quality that isnoticeably inferior to those of new pavements and may be barelytolerable for high-speed traffic. These pavements may show somesigns of deterioration such as rutting, map cracking and extensivepatching. Most importantly, roads in this category are in jeopardy andshould immediately be programmed for some cost-effective treatmentthat will restore them to a good condition and avoid costlyrehabilitation in the near future.
Good IRI < 95 AND SDI ≥ 3.5These roads exhibit good ride quality with little or no signs ofdeterioration. A proactive preventive maintenance strategy isnecessary to keep roads in this category as long as possible.

3
Analysis results are presented in tabular form in Table 2 and graphically in Figure 2 below.
† Note: Mileage in Table 2 represents tested mileage which is slightly less than system mileage(8402 out of 8410) due to inaccessibility of some areas for testing.
FIGURE 2
These results underscore the severity of the functional deficiency (50% of the system). Similaranalyses using data collected over the last 9 years shows that the overall deficiency has risenover time and that increased efforts will be needed to reverse this situation (see Figure 3 below).
TABLE 2Functional Adequacy of NJ State Highway System
(Based on Roughness and Distress)
Condition Lane Miles(Two Directions)
% of Total SystemLane Miles
Deficient by Roughness Alone 946.4 11%Deficient by Roughness & Distress 1033.0 13%Deficient by Distress Alone 2182.6 26%
Total Deficient 4162.0 50%Total Fair/Mediocre 2536.9 30%Total Good 1703.4 20%
Total State System 8402.3† 100%Source: NJDOT Pavement Management System, 2009 Data

4
FIGURE 3

5
PAVEMENT PRESERVATION FUNDING
Programmed funding in fiscal year 2010 for pavement preservation activities is detailed in Table3 below. Actual project costs broken down by program categories are shown on pages 7 through10.
TABLE 3Programmed Pavement Preservation Funding for Fiscal Year 2010
(Actual costs broken down by projects are shown on pages 7 through 10)
Program Category Description Funding(Millions)
Highway CapitalMaintenance -Betterments(State Funding)
This is an ongoing program of minor improvements tothe state highway system for miscellaneous maintenancerepair contracts, repair parts, miscellaneous needs foremergent projects, handicap ramps, and drainagerehabilitation/maintenance.
$10
Highway CapitalMaintenance -Pavement Preservation(Fed. Funding)
This program provides funding for eligible federalpavement preservation activities which help to keepNew Jersey's highway system in a state of good repair.
$2
Highway CapitalMaintenance -Maintenance Mgt.System & Elect.Facilities(State Funding)
The Maintenance Mgt. System provides enhanced dataaccumulation and cost management dissemination formaintenance operations and a required compatible datasource for related systems. Elect. Facilities provides forreplacement, repair, preservation, and installation ofelectrical facilities along the state highway system.
$3
Highway Resurfacing -Operations Projects(State Funding)
This is a comprehensive program of providing renewedriding surfaces to state highways to prolong the life ofthe pavement and provide a smoother ride for users ofthe system.
$60
Highway Resurfacing -Capital Program Mgt.Projects(State & Fed. Funding)
This program funds larger scale projects administeredthrough Capital Program Management which areprimarily involved with pavement resurfacing.
$22(StandardFunding)
$41(EconomicStimulus)
Highway Rehabilitation& Reconstruction -Capital Program Mgt.Projects(State & Fed. Funding)
This program funds larger scale projects administeredthrough Capital Program Management with manyactivities (e.g. bridge rehab, signal & safetyimprovements, pavement, sidewalks and curbs, etc.).
$38
Totals $176
6
WORK COMPLETED IN FISCAL YEAR 2010
The Department’s Operations Division administers highway capital maintenance and selectedresurfacing projects. Resurfacing projects which are more involved with regards to requiredproject documents and scoping and rehabilitation/reconstruction pavement restoration projectsare administered through the Capital Program Management branch. Each of these types ofprojects directly related to pavement system improvements is broken down and described byprogram categories in the sections which follow.
Fiscal Year 2010 Highway Capital Maintenance Projects
As described in Table 3, Highway Capital Maintenance dollars were spent in fiscal year 2010 onpavement-related maintenance work administered through the Operations Division of NJDOT.In-house maintenance crews regularly performed a variety of preventive maintenance tasks toextend the life of pavement, including the following:
Sweeping and drain cleaning to keep water away from travel lanes. Patching potholes to keep the riding surface intact and prevent intrusion of moisture into
the pavement layers. Quick-set concrete to patch and repair bridge decks.
In addition, specialized maintenance work was performed through contracts awarded andadministered through Operations, including the following:
“If-And-Where” resurfacing contracts statewide administered through RegionalOperations personnel to quickly address emergent conditions.
Crack sealing and longitudinal joint patching to prolong pavement life. Ultra-thin overlays, including Microsurfacing, to restore the pavement surface and
improve ride quality. Diamond grinding of concrete pavement to improve ride quality, skid resistance, wet
weather visibility and to reduce tire noise.
Fiscal Year 2010 Highway Resurfacing – Operations Division Projects
Table 4 below lists pavement resurfacing contract work awarded in fiscal year 2010 through theDepartment’s Division of Operations Support. Ten contracts valued at $60 million are listed.

7
TABLE 4Highway Resurfacing Contracts Awarded In FY 2010
Through Operations Support Division
(Note: MRRC = Maintenance Roadway Repair Contract)
Contract #(See note above) Route
Dir(B =Both)
StartMile-Post
EndMile-Post
TotalLaneMiles
CountyTotalCost
(Millions)
Maint ConcretePvmt RepairContract-Central
130 N 55.75 60.30 9.00 Burlington,Mercer
$7.756130 S 55.75 59.80 8.00 Burlington,Mercer
130 N 61.80 62.48 1.40 Mercer
MaintenanceOperationalImprov Contract
35 S 40.75 41.17 0.80 Monmouth $0.518
MRRC #C103
1 N 9.22 11.42 6.60 Mercer
$7.079
1 S 9.23 9.60 1.30 Mercer1 S 10.81 11.46 2.10 Mercer
1B B 1.50 2.73 4.80 Mercer130 B 64.81 68.00 14.40 Mercer130 S 74.14 76.23 4.20 Middlesex
MRRC #C302
9 B 113.01 114.00 4.40 Monmouth
$6.426
33 E 31.08 35.66 5.10 Monmouth33 W 31.08 35.71 5.10 Monmouth34 B 8.77 10.31 3.00 Monmouth66 W 2.28 3.17 1.80 Monmouth66 E 2.30 3.10 1.40 Monmouth
MRRC #C303
9 B 101.67 102.86 4.60 Ocean
$5.80770 B 47.09 48.41 2.60 Ocean88 B 6.50 10.02 8.00 Ocean
166 B 2.28 3.70 2.80 Ocean
MRRC #N20215 N 2.56 14.18 26.70 Morris, Sussex
$6.02015 S 8.81 14.18 10.70 Morris, Sussex15 B 17.00 19.24 4.40 Sussex
MRRC #N305
5 B 0.00 0.37 0.80 Bergen
$7.400
5 B 1.00 1.60 1.20 Bergen5 B 2.00 3.18 2.70 Bergen10 B 21.80 23.47 5.40 Essex17 S 17.14 19.60 7.50 Bergen28 B 19.80 23.30 8.60 Union67 B 0.00 1.86 7.20 Bergen
440 S 24.95 26.18 2.60 Hudson
8
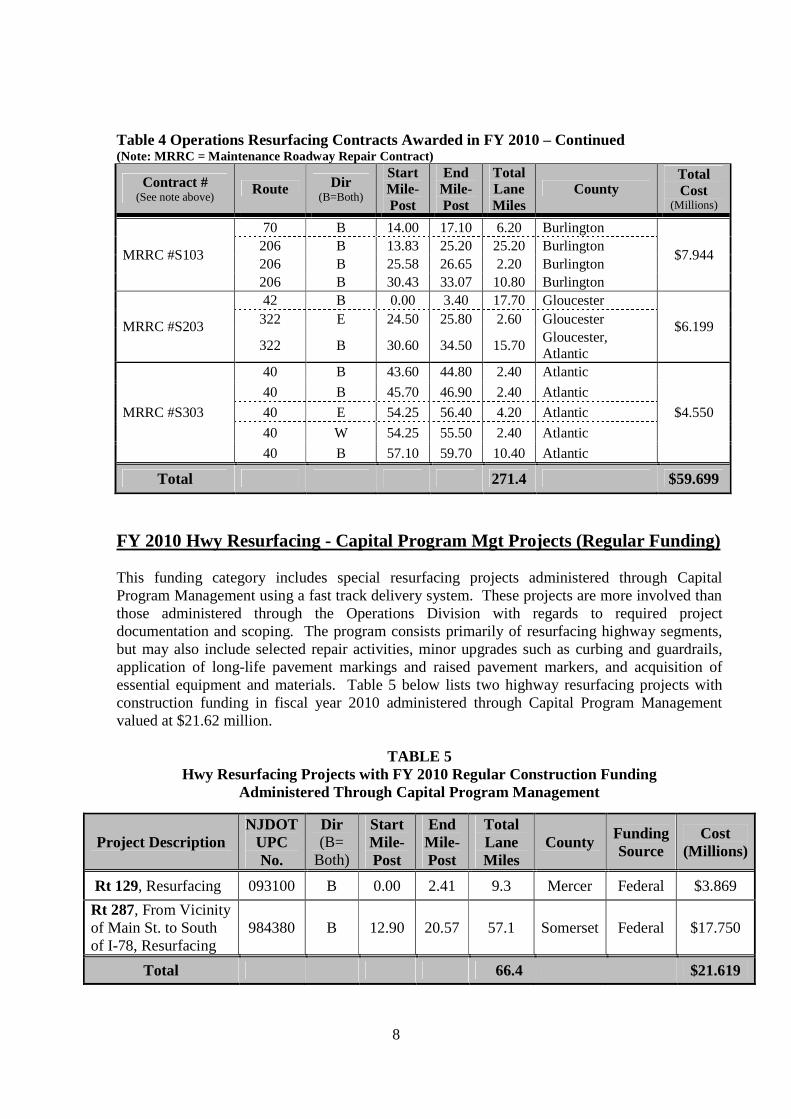
Table 4 Operations Resurfacing Contracts Awarded in FY 2010 – Continued(Note: MRRC = Maintenance Roadway Repair Contract)
Contract #(See note above)
Route Dir(B=Both)
StartMile-Post
EndMile-Post
TotalLaneMiles
CountyTotalCost
(Millions)
MRRC #S103
70 B 14.00 17.10 6.20 Burlington
$7.944206 B 13.83 25.20 25.20 Burlington206 B 25.58 26.65 2.20 Burlington206 B 30.43 33.07 10.80 Burlington
MRRC #S203
42 B 0.00 3.40 17.70 Gloucester
$6.199322 E 24.50 25.80 2.60 Gloucester
322 B 30.60 34.50 15.70 Gloucester,Atlantic
MRRC #S303
40 B 43.60 44.80 2.40 Atlantic
$4.55040 B 45.70 46.90 2.40 Atlantic40 E 54.25 56.40 4.20 Atlantic40 W 54.25 55.50 2.40 Atlantic40 B 57.10 59.70 10.40 Atlantic
Total 271.4 $59.699
FY 2010 Hwy Resurfacing - Capital Program Mgt Projects (Regular Funding)
This funding category includes special resurfacing projects administered through CapitalProgram Management using a fast track delivery system. These projects are more involved thanthose administered through the Operations Division with regards to required projectdocumentation and scoping. The program consists primarily of resurfacing highway segments,but may also include selected repair activities, minor upgrades such as curbing and guardrails,application of long-life pavement markings and raised pavement markers, and acquisition ofessential equipment and materials. Table 5 below lists two highway resurfacing projects withconstruction funding in fiscal year 2010 administered through Capital Program Managementvalued at $21.62 million.
TABLE 5Hwy Resurfacing Projects with FY 2010 Regular Construction Funding
Administered Through Capital Program Management
Project DescriptionNJDOT
UPCNo.
Dir(B=
Both)
StartMile-Post
EndMile-Post
TotalLaneMiles
County FundingSource
Cost(Millions)
Rt 129, Resurfacing 093100 B 0.00 2.41 9.3 Mercer Federal $3.869
Rt 287, From Vicinityof Main St. to Southof I-78, Resurfacing
984380 B 12.90 20.57 57.1 Somerset Federal $17.750
Total 66.4 $21.619

9
FY 2010 Hwy Resurfacing-Capital Program Mgt Projects (Stimulus Funding)
Economic stimulus funding was made available in fiscal year 2010 through the AmericanRecovery and Reinvestment Act (ARRA). NJDOT worked vigorously applying soundengineering principles and utilizing extensive data generated by the Department’s PavementManagement System to select pavement projects that could be delivered quickly and meet othercriteria set forth in this legislation. Included in Table 6 below is a list of six pavementrestoration projects valued at $41.46 million.
TABLE 6Hwy Resurfacing Projects with FY 2010 Economic Stimulus (ARRA) Funding
Administered Through Capital Program Management
ProjectDescription
NJDOTUPCNo.
Dir(B=
Both)
StartMile-Post
EndMile-Post
TotalLaneMiles
County FundingSource
Cost(Millions)
Route 18, FromSouth of Rt 34 to Rt9 SB, Resurfacing
103140N 18.90 29.50 21.2 Middlesex,
MonmouthFederal,ARRA $9.850
S 21.86 30.50 17.2
Route 37, FromRoute 70 to GardenState Parkway,Resurfacing
103080 B 0.00 6.27 30.7 Ocean Federal,ARRA $4.499
Route 37, FromEast of DouglasStreet to Route 35,Bridge DeckPatching andResurfacing
103090 B 11.43 13.43 11.4 Ocean Federal,ARRA $3.318
Route 68, North ofMt. Pleasant Rd. toSouth of AaronsonRd.
103050 B 3.80 7.60 15.1 Burlington Federal,ARRA $3.650
Route 70, East ofVermont Avenue toRoute 34
103060B 50.80 57.80 24.3 Ocean,
MonmouthFederal,ARRA $10.900
B 58.70 59.80 2.2
Route 195, FromNJ Turnpike to Eastof Imlaystown-Hightstown Road,Resurfacing
093590E 7.16 12.09 9.8
Mercer,Monmouth
Federal,ARRA $9.242
W 9.26 12.09 5.6
Total 137.5 $41.459

10
FY 2010 Highway Rehab. & Reconstruct. – Capital Program Mgt. Projects
Projects in this funding program category are generally large-scale ones and can include manyactivities in addition to pavement improvements, such as bridge rehabilitation, safetyimprovements, congestion improvements, operational improvements, traffic signals, sidewalksand curbs. Included in Table 7 below is a major interstate rehabilitation project with $38.17million funded in FY 2010.
TABLE 7Highway Rehab & Reconstruction Projects With FY 2010 Construction Funding
Administered Through Capital Program Management
ProjectDescription
NJDOTUPCNo.
Dir(B=
Both)
StartMile-Post
EndMile-Post
FY 10LaneMiles
County FundingSource
FY 10Cost
(Millions)Rt 295, FromRancocas-MountHolly Road toRoute 130, PvmntRepair andRubbilization
083240 B 44.94 56.82
35.7(SeeNote#1)
Burlington State$38.170
(See Note#2)
Total 35.7 $38.170Notes:1) Total lane miles for this project = 71.4. Approximately 35.7 lane miles are credited to FY 10.2) Project is funded over multiple fiscal years beginning 2010. Total project cost is $78.723 million.
MULTI-YEAR SUMMARY OF MAJOR PAVEMENT WORK
Figure 4 below shows the lane miles of mainline pavement that have received resurfacing orreconstruction over the last 6 years.

11
REFERENCES
1. New Jersey Department of Transportation, Capital Investment Strategy FY 2010-2019, April13, 2009.
2. New Jersey Department of Transportation, FY 2010 – 2019 Statewide TransportationImprovement Program.
3. New Jersey Department of Transportation, Long Range Transportation Plan, TransportationChoices 2025, March 2001.
4. New Jersey Department of Transportation, The New Jersey Department of TransportationStandard Specifications for Road and Bridge Construction, 2007.
5. New Jersey Department of Transportation, Transportation Capital Program, Fiscal Year2010.
6. The Road Information Program, Bumpy Roads Ahead: Cities With the Roughest Rides andStrategies to Make Our Roads Smoother, April 2004.
7. The Road Information Program, Rough Ride Ahead: Metro Areas With the Roughest Ridesand Strategies to Make Our Roads Smoother, May 2005.
8. The Road Information Program, The Condition of New Jersey’s Roads and Bridges: KeyTransportation Projects Needed in the State and the Importance of Dependable Funding,October 2000.
A - 1
APPENDIX A
DEFICIENT PAVEMENTS SECTIONS
NEEDING FUTURE RESTORATION

A - 2
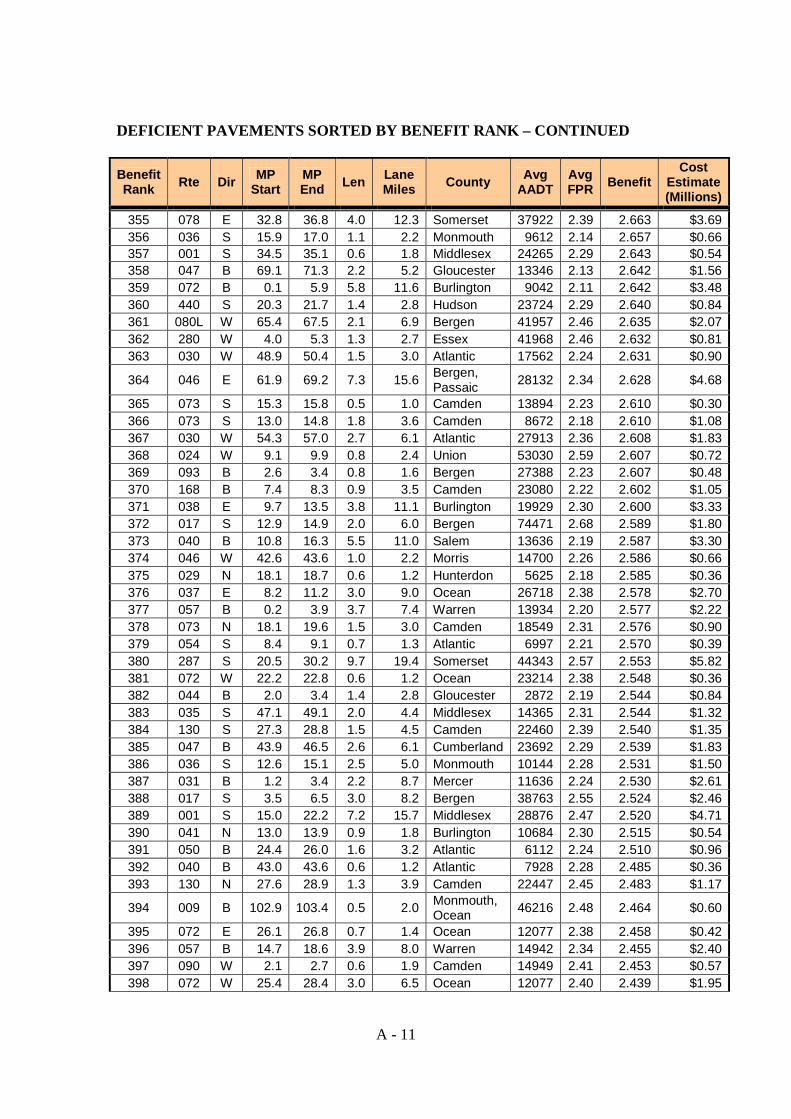
APPENDIX ADEFICIENT PAVEMENTS NEEDING FUTURE RESTORATION
438 Projects Sorted By Benefit Rank
Notes:(1) AADT = Average Annual Daily Traffic. FPR = Final Pavement Rating (0-5 scale, 5=perfect pavement)(2) Benefit = 0.9(5.0-Avg FPR) + 0.1(Traffic Factor) and Traffic Factor = (5/60000)(Avg AADT), with Max = 5.0(3) For undivided routes (Dir = B): FPR and Benefit shown are the most critical set of values in either direction.
BenefitRank Rte Dir MP
StartMPEnd Len Lane
Miles County AvgAADT
AvgFPR Benefit
CostEstimate(Millions)
1 080 E 45.6 53.0 7.4 22.0Essex,Morris,Passaic
53921 0.30 4.675 $6.60
2 001 N 15.9 16.5 0.6 1.2 Middlesex 23860 0.26 4.462 $0.363 001 S 0.6 1.2 0.6 1.5 Mercer 22608 0.41 4.324 $0.454 001 N 25.2 26.2 1.0 3.0 Middlesex 35004 0.54 4.308 $0.90
5 022 W 58.2 59.1 0.9 1.8 Essex,Union 31430 0.51 4.300 $0.54
6 206 N 97.3 98.4 1.1 2.2 Morris,Sussex 10267 0.35 4.273 $0.66
7 183 N 0.0 0.6 0.6 1.1 Morris 7779 0.37 4.233 $0.33
8 003 W 4.3 6.2 1.9 5.7 Bergen,Passaic 66928 0.85 4.231 $1.71
9 022 E 37.8 43.7 5.9 12.3 Somerset 28424 0.62 4.175 $3.6910 046 W 6.8 7.5 0.7 1.2 Warren 4663 0.41 4.172 $0.4211 139U W 0.1 0.6 0.5 1.0 Hudson 11823 0.48 4.169 $0.3012 046 B 0.8 6.8 6.0 12.4 Warren 8600 0.41 4.167 $3.72
13 022 E 45.1 47.8 2.7 5.4 Somerset,Union 31264 0.70 4.131 $1.62
14 017 S 23.1 26.4 3.3 9.9 Bergen 38011 0.80 4.100 $2.9715 124 B 4.3 5.6 1.3 2.6 Morris 16168 0.53 4.093 $0.7816 322 B 16.8 17.4 0.6 1.2 Gloucester 18486 0.54 4.088 $0.3617 033 B 12.6 14.3 1.7 3.4 Mercer 12896 0.53 4.077 $1.0218 122 B 1.4 2.4 1.0 2.0 Warren 12740 0.56 4.051 $0.60
19 130 S 67.8 74.3 6.5 13.0 Mercer,Middlesex 14993 0.64 4.049 $3.90
20 078 E 23.4 30.4 7.0 20.7 Hunterdon,Somerset 53343 0.99 4.049 $6.21
21 080 E 28.5 29.0 0.5 1.5 Morris 48065 0.95 4.045 $0.4522 033 W 24.3 28.8 4.5 9.0 Monmouth 9374 0.59 4.045 $2.70
23 130 S 33.3 36.4 3.1 9.6 Burlington,Camden 23146 0.73 4.038 $2.88
24 070 E 0.3 5.8 5.5 15.1 Camden 29133 0.79 4.034 $4.5325 124 B 10.5 11.1 0.6 2.1 Union 16444 0.62 4.013 $0.6326 130 S 42.7 46.7 4.0 11.8 Burlington 23290 0.76 4.006 $3.54
27 027 B 26.7 27.2 0.5 1.4 Middlesex,Union 20116 0.67 3.984 $0.42
28 139U E 0.1 0.7 0.6 1.2 Hudson 11823 0.68 3.983 $0.3629 030 E 48.9 50.8 1.9 4.2 Atlantic 18105 0.75 3.978 $1.2630 182 B 0.0 0.9 0.9 2.1 Warren 25356 0.71 3.966 $0.63

A - 3
DEFICIENT PAVEMENTS SORTED BY BENEFIT RANK - CONTINUED
BenefitRank Rte Dir MP
StartMPEnd Len Lane
Miles County AvgAADT
AvgFPR Benefit
CostEstimate(Millions)
31 001L S 49.0 50.5 1.5 3.0 Essex 21575 0.79 3.965 $0.90
32 031 B 34.4 40.9 6.5 14.4 Hunterdon,Warren 23706 0.70 3.965 $4.32
33 041 B 10.8 13.0 2.2 8.8 Camden 27280 0.72 3.963 $2.6434 022 E 1.1 2.4 1.3 3.6 Warren 21149 0.80 3.955 $1.0835 001 N 62.8 64.9 2.1 4.9 Bergen 24608 0.84 3.945 $1.47
36 001 S 47.4 57.4 10.0 21.9 Essex,Hudson 29630 0.90 3.940 $6.57
37 124 B 6.3 7.3 1.0 2.0 Morris 22362 0.74 3.931 $0.6038 076 S 0.7 1.7 1.0 4.3 Camden 91059 1.19 3.930 $1.2939 031 S 32.5 34.4 1.9 3.8 Hunterdon 14105 0.77 3.924 $1.1440 173 B 13.3 14.3 1.0 2.0 Hunterdon 12384 0.70 3.920 $0.6041 026 B 1.9 2.5 0.6 2.4 Middlesex 16428 0.73 3.910 $0.7242 040 W 52.3 54.3 2.0 4.0 Atlantic 20521 0.85 3.903 $1.2043 001 N 5.5 6.5 1.0 2.5 Mercer 27225 0.92 3.901 $0.7544 202 S 24.9 25.7 0.8 1.6 Somerset 37890 1.02 3.894 $0.4845 046 W 0.0 0.8 0.8 1.2 Warren 4492 0.75 3.863 $0.3646 206 B 44.5 46.9 2.4 5.3 Mercer 11414 0.77 3.852 $1.5947 030 B 40.5 48.9 8.4 33.6 Atlantic 20010 0.82 3.842 $10.0848 009 S 112.3 113.0 0.7 2.0 Monmouth 19167 0.92 3.836 $0.6049 007 B 4.2 5.2 1.0 2.2 Bergen 18230 0.84 3.822 $0.6650 440 N 20.3 21.7 1.4 2.8 Hudson 23724 0.98 3.819 $0.84
51 004 W 0.0 1.0 1.0 2.0 Bergen,Passaic 55071 1.27 3.816 $0.60
52 022 W 44.4 47.2 2.8 8.3 Somerset,Union 32227 1.06 3.810 $2.49
53 034 S 3.9 7.5 3.6 7.2 Monmouth 13941 0.90 3.809 $2.16
54 038 W 0.0 6.4 6.4 15.8 Burlington,Camden 29130 1.04 3.805 $4.74
55 001 S 62.8 64.9 2.1 4.2 Bergen 24608 1.01 3.798 $1.2656 036 S 21.8 22.3 0.5 1.0 Monmouth 20764 0.98 3.791 $0.3057 054 N 8.4 9.1 0.7 1.3 Atlantic 6997 0.87 3.774 $0.3958 003 E 0.2 1.1 0.9 2.9 Passaic 58186 1.35 3.771 $0.8759 001 N 55.7 57.3 1.6 3.2 Hudson 31673 1.10 3.770 $0.9660 080 E 53.7 58.2 4.5 17.6 Passaic 71128 1.37 3.770 $5.2861 031 B 47.2 48.2 1.0 2.0 Warren 8582 0.85 3.769 $0.6062 010 E 0.3 7.2 6.9 14.1 Morris 22366 1.03 3.761 $4.2363 050 B 11.2 18.3 7.1 14.2 Atlantic 3108 0.84 3.755 $4.2664 034 B 16.2 21.2 5.0 12.0 Monmouth 13716 0.90 3.749 $3.6065 022 W 31.6 32.1 0.5 1.0 Somerset 19919 1.02 3.744 $0.3066 001 S 35.8 38.0 2.2 6.4 Middlesex 27485 1.10 3.737 $1.92
67 206 B 56.7 59.9 3.2 6.8 Mercer,Somerset 19574 0.94 3.734 $2.04
68 045 B 25.0 26.6 1.6 5.6 Gloucester 17206 0.94 3.725 $1.6869 017 N 3.5 6.8 3.3 9.2 Bergen 39496 1.23 3.721 $2.7670 042 N 3.4 6.6 3.2 6.4 Gloucester 33108 1.17 3.720 $1.92

A - 4
DEFICIENT PAVEMENTS SORTED BY BENEFIT RANK – CONTINUED
BenefitRank Rte Dir MP
StartMPEnd Len Lane
Miles County AvgAADT
AvgFPR Benefit
CostEstimate(Millions)
71 130 S 80.3 83.1 2.8 5.6 Middlesex 20588 1.06 3.719 $1.6872 030 B 7.8 12.4 4.6 19.2 Camden 32916 1.03 3.710 $5.7673 056 B 1.3 4.8 3.5 7.0 Cumberland 13232 0.95 3.704 $2.1074 166 B 0.2 1.4 1.2 2.4 Ocean 25416 1.02 3.690 $0.7275 009 S 110.5 111.6 1.1 2.2 Monmouth 19482 1.08 3.686 $0.6676 322 E 45.9 50.3 4.4 8.8 Atlantic 12344 1.02 3.680 $2.64
77 022 E 54.8 60.5 5.7 12.6 Essex,Union 34370 1.24 3.670 $3.78
78 015 B 0.1 1.8 1.7 3.9 Morris 58572 1.20 3.666 $1.1779 009 B 81.4 90.3 8.9 19.4 Ocean 23488 1.04 3.663 $5.8280 124 B 12.5 13.3 0.8 1.7 Union 16444 1.01 3.662 $0.51
81 033 E 17.7 21.4 3.7 7.4 Middlesex,Monmouth 16799 1.09 3.659 $2.22
82 056 B 0.1 0.7 0.6 1.4 Cumberland 10350 0.98 3.657 $0.4283 046 E 6.8 7.5 0.7 1.4 Warren 4729 0.99 3.649 $0.4284 012 E 11.2 11.7 0.5 0.7 Hunterdon 7459 1.02 3.641 $0.2185 322 W 24.2 25.8 1.6 3.0 Gloucester 9992 1.05 3.640 $0.9086 130 S 76.3 78.8 2.5 5.0 Middlesex 20588 1.16 3.630 $1.50
87 027 B 2.8 4.9 2.1 4.4Mercer,Middlesex,Somerset
11396 1.02 3.630 $1.32
88 001 S 41.2 44.5 3.3 9.2 Union 38330 1.33 3.622 $2.76
89 082 B 2.8 4.3 1.5 6.0 Union 32576 1.13 3.619 $1.8090 030 E 1.6 3.2 1.6 5.8 Camden 39821 1.35 3.618 $1.7491 054 B 9.1 11.9 2.8 5.6 Atlantic 13846 1.04 3.617 $1.6892 001 N 0.7 1.3 0.6 1.2 Mercer 24957 1.22 3.609 $0.3693 154 B 0.0 1.6 1.6 3.2 Camden 19522 1.10 3.595 $0.9694 017 S 8.5 9.0 0.5 1.0 Bergen 43416 1.41 3.593 $0.3095 030 W 1.4 2.9 1.5 5.0 Camden 39830 1.38 3.591 $1.50
96 070 E 6.5 8.3 1.8 3.8 Burlington,Camden 23560 1.23 3.587 $1.14
97 010 E 11.1 18.9 7.8 17.7 Essex,Morris 21464 1.22 3.579 $5.31
98 041 B 0.0 2.8 2.8 5.6 Gloucester 14034 1.09 3.575 $1.6899 088 B 0.1 2.2 2.1 4.3 Ocean 23932 1.14 3.572 $1.29
100 028 B 6.7 12.4 5.7 17.7 Middlesex,Somerset 22648 1.14 3.571 $5.31
101 034 B 23.7 26.5 2.8 5.6 Middlesex 26014 1.16 3.564 $1.68
102 130 N 33.5 36.4 2.9 8.7 Burlington,Camden 23251 1.27 3.554 $2.61
103 046 B 41.1 42.0 0.9 2.8 Morris 21080 1.15 3.549 $0.84104 009 B 94.9 101.8 6.9 14.0 Ocean 28114 1.19 3.544 $4.20105 322 B 43.4 45.9 2.5 10.0 Atlantic 17526 1.15 3.541 $3.00106 004 W 2.0 2.9 0.9 2.8 Bergen 55071 1.58 3.539 $0.84107 033 E 37.0 37.9 0.9 1.8 Monmouth 10312 1.17 3.532 $0.54

A - 5
DEFICIENT PAVEMENTS SORTED BY BENEFIT RANK – CONTINUED
BenefitRank Rte Dir MP
StartMPEnd Len Lane
Miles County AvgAADT
AvgFPR Benefit
CostEstimate(Millions)
108 130 N 67.8 83.4 15.6 31.5 Mercer,Middlesex 18188 1.25 3.530 $9.45
109 055 N 25.3 30.1 4.8 9.6 Cumberland 12026 1.19 3.526 $2.88110 202 B 29.1 29.9 0.8 2.2 Somerset 19046 1.17 3.522 $0.66111 046 E 71.4 72.1 0.7 1.6 Bergen 27682 1.35 3.520 $0.48112 028 E 23.3 26.3 3.0 6.0 Union 8534 1.17 3.520 $1.80113 022 W 54.8 57.4 2.6 5.3 Union 37601 1.44 3.514 $1.59114 042 S 3.4 6.1 2.7 10.4 Gloucester 32999 1.41 3.508 $3.12115 202 B 44.7 45.2 0.5 1.4 Morris 17100 1.19 3.504 $0.42116 036 N 22.9 23.6 0.7 1.4 Monmouth 17588 1.27 3.499 $0.42
117 001 B 57.4 62.2 4.8 19.1 Bergen,Hudson 33602 1.27 3.498 $5.73
118 045 B 0.0 8.8 8.8 17.6 Salem 6650 1.15 3.491 $5.28119 028 B 3.1 6.2 3.1 6.6 Somerset 14014 1.19 3.490 $1.98120 095M S 2.2 3.3 1.1 3.3 Mercer 27480 1.38 3.485 $0.99
121 206 S 97.1 98.4 1.3 2.9 Morris,Sussex 10043 1.22 3.482 $0.87
122 439 B 0.0 2.1 2.1 5.1 Union 23032 1.24 3.479 $1.53123 094 B 37.2 38.7 1.5 3.0 Sussex 11966 1.19 3.478 $0.90124 012 B 4.2 9.9 5.7 11.4 Hunterdon 9226 1.18 3.473 $3.42125 020 S 0.2 3.9 3.7 8.5 Passaic 27397 1.40 3.470 $2.55126 676 S 0.0 2.2 2.2 6.5 Camden 34117 1.46 3.470 $1.95127 053 B 1.1 4.5 3.4 7.0 Morris 15776 1.22 3.466 $2.10128 029 S 8.6 9.4 0.8 1.6 Mercer 8666 1.24 3.458 $0.48129 036 B 3.9 4.8 0.9 1.8 Monmouth 25542 1.28 3.455 $0.54130 036 S 22.7 24.2 1.5 3.2 Monmouth 17588 1.34 3.444 $0.96131 179 B 3.1 7.4 4.3 8.7 Hunterdon 4162 1.19 3.443 $2.61132 206 B 86.6 91.4 4.8 12.5 Morris 21296 1.27 3.442 $3.75133 183 S 0.0 0.6 0.6 1.1 Morris 7779 1.25 3.439 $0.33134 028 E 6.2 6.7 0.5 1.0 Somerset 8796 1.26 3.438 $0.30135 078 E 4.7 5.5 0.8 2.4 Warren 40307 1.56 3.435 $0.72136 287 N 44.9 47.2 2.3 6.9 Morris 42002 1.57 3.434 $2.07137 028 B 0.2 2.6 2.4 4.8 Somerset 18128 1.27 3.432 $1.44138 073 N 28.9 30.2 1.3 2.8 Burlington 26067 1.43 3.429 $0.84139 001 N 28.5 34.9 6.4 18.7 Middlesex 36430 1.53 3.427 $5.61
140 080 W 57.3 64.5 7.2 27.4 Bergen,Passaic 59188 1.74 3.423 $8.22
141 023 N 39.2 39.7 0.5 0.5 Sussex 9333 1.29 3.414 $0.15142 130 S 60.2 62.4 2.2 4.4 Mercer 15537 1.35 3.412 $1.32143 028 B 17.3 19.8 2.5 5.0 Union 16140 1.29 3.404 $1.50144 094 B 32.9 36.3 3.4 6.8 Sussex 11908 1.27 3.403 $2.04145 010 W 0.1 7.1 7.0 13.8 Morris 22243 1.43 3.401 $4.14146 001 N 2.1 4.0 1.9 3.8 Mercer 19849 1.41 3.400 $1.14
147 206 B 0.0 11.5 11.5 23.6 Atlantic,Burlington 13866 1.29 3.393 $7.08
148 159 B 0.8 1.3 0.5 1.0 Essex 18190 1.32 3.389 $0.30149 079 B 9.4 12.1 2.7 5.4 Monmouth 14360 1.31 3.385 $1.62

A - 6
DEFICIENT PAVEMENTS SORTED BY BENEFIT RANK – CONTINUED
BenefitRank Rte Dir MP
StartMPEnd Len Lane
Miles County AvgAADT
AvgFPR Benefit
CostEstimate(Millions)
150 036 N 1.2 3.9 2.7 5.9 Monmouth 20470 1.43 3.381 $1.77151 055 N 32.9 34.3 1.4 2.8 Cumberland 14856 1.40 3.363 $0.84152 295 N 37.8 38.5 0.7 2.1 Burlington 50199 1.73 3.359 $0.63
153 027 B 34.5 38.4 3.9 15.6 Essex,Union 14812 1.34 3.357 $4.68
154 010 W 10.5 18.9 8.4 19.4 Essex,Morris 21936 1.48 3.349 $5.82
155 070 W 2.3 3.5 1.2 2.6 Camden 28118 1.54 3.347 $0.78156 070 E 44.2 45.0 0.8 1.3 Ocean 12252 1.40 3.344 $0.39
157 003 E 4.3 6.2 1.9 5.7 Bergen,Passaic 66928 1.84 3.342 $1.71
158 202 B 31.7 41.5 9.8 19.9 Morris,Somerset 10086 1.35 3.326 $5.97
159 041 S 13.0 13.9 0.9 1.8 Burlington 10684 1.41 3.323 $0.54160 009 S 114.0 115.3 1.3 3.7 Monmouth 27923 1.57 3.320 $1.11
161 038 E 0.0 6.1 6.1 14.7 Burlington,Camden 29474 1.59 3.319 $4.41
162 130 B 2.1 8.9 6.8 13.6 Gloucester,Salem 7758 1.35 3.316 $4.08
163 031 B 22.5 24.7 2.2 5.9 Hunterdon 21766 1.42 3.313 $1.77164 001 S 39.1 40.6 1.5 4.5 Union 31924 1.62 3.311 $1.35165 001 S 24.0 25.1 1.1 3.3 Middlesex 44407 1.74 3.306 $0.99166 073 S 23.6 24.3 0.7 1.4 Burlington 23747 1.55 3.306 $0.42167 033 B 35.9 37.0 1.1 4.4 Monmouth 25974 1.45 3.302 $1.32168 017 B 0.2 3.6 3.4 7.9 Bergen 72614 1.67 3.297 $2.37169 094 B 21.8 22.5 0.7 1.4 Sussex 10928 1.40 3.286 $0.42170 047 B 39.3 40.1 0.8 1.6 Cumberland 5682 1.38 3.280 $0.48171 001L N 48.3 51.1 2.8 5.6 Essex 22135 1.57 3.272 $1.68172 029 S 2.6 3.8 1.2 2.6 Mercer 22397 1.57 3.271 $0.78173 095M N 2.4 3.4 1.0 3.0 Mercer 27738 1.62 3.271 $0.90
174 023 N 20.7 23.2 2.5 5.0 Morris,Passaic 21003 1.56 3.270 $1.50
175 046 W 49.9 50.5 0.6 1.2 Morris 22464 1.58 3.270 $0.36176 055 S 21.8 25.4 3.6 7.2 Cumberland 7580 1.44 3.269 $2.16177 009 B 43.8 51.0 7.2 14.4 Atlantic 9306 1.42 3.264 $4.32178 047 N 0.8 1.5 0.7 1.4 Cape May 10734 1.47 3.264 $0.42179 202 S 5.9 6.9 1.0 2.0 Hunterdon 16207 1.53 3.260 $0.60
180 023 N 10.2 19.5 9.3 22.2 Morris,Passaic 26298 1.63 3.252 $6.66
181 322 B 25.8 30.6 4.8 19.2 Gloucester 20416 1.49 3.246 $5.76182 028 W 23.3 25.8 2.5 5.0 Union 8534 1.48 3.243 $1.71
183 023 B 1.2 4.8 3.6 12.6 Essex,Passaic 24254 1.51 3.239 $3.78
184 001 N 44.4 44.9 0.5 1.5 Union 47023 1.84 3.236 $0.45185 078 W 52.8 53.4 0.6 1.2 Union 46625 1.84 3.235 $0.36
186 046 W 60.9 69.2 8.3 17.6 Bergen,Passaic 28235 1.67 3.234 $5.28
187 045 B 9.4 10.2 0.8 1.6 Salem 8372 1.45 3.233 $0.48

A - 7
DEFICIENT PAVEMENTS SORTED BY BENEFIT RANK – CONTINUED
BenefitRank Rte Dir MP
StartMPEnd Len Lane
Miles County AvgAADT
AvgFPR Benefit
CostEstimate(Millions)
188 001 N 47.4 48.4 1.0 2.0 Essex 27373 1.67 3.229 $0.60189 202 N 50.1 50.6 0.5 1.0 Morris 13791 1.54 3.228 $0.30190 078L W 57.0 57.8 0.8 1.7 Essex 33657 1.74 3.218 $0.51191 035 B 52.2 52.8 0.6 2.4 Middlesex 24780 1.54 3.218 $0.72192 168 S 0.0 0.7 0.7 1.4 Gloucester 5923 1.48 3.214 $0.42193 056 B 7.9 9.2 1.3 5.2 Cumberland 18150 1.51 3.213 $1.56194 322 B 36.8 42.9 6.1 24.4 Atlantic 14616 1.50 3.213 $7.32195 030 E 36.4 40.5 4.1 8.2 Atlantic 9950 1.52 3.211 $2.46
196 022 E 20.9 32.0 11.1 22.2 Hunterdon,Somerset 15415 1.58 3.208 $6.66
197 130 N 46.1 46.7 0.6 1.8 Burlington 22825 1.65 3.205 $0.54198 009 S 104.4 105.7 1.3 2.6 Monmouth 18824 1.61 3.205 $0.78199 206 S 81.0 81.5 0.5 1.0 Somerset 12998 1.56 3.204 $0.30200 022 W 37.7 39.0 1.3 2.8 Somerset 34122 1.76 3.198 $0.84201 049 B 0.1 12.2 12.1 24.2 Salem 12300 1.50 3.197 $7.26202 023 B 31.6 40.9 9.3 19.4 Sussex 18132 1.53 3.197 $5.82203 023 S 39.2 39.7 0.5 0.5 Sussex 9333 1.54 3.195 $0.15204 206 N 81.0 81.5 0.5 1.0 Somerset 12998 1.57 3.194 $0.30205 033 B 37.9 41.3 3.4 13.6 Monmouth 17672 1.54 3.192 $4.08206 046 E 43.5 46.3 2.8 6.2 Morris 14700 1.59 3.192 $1.86
207 181 B 0.3 7.4 7.1 16.8 Morris,Sussex 10602 1.51 3.188 $5.04
208 023 S 12.9 19.8 6.9 18.2 Morris,Passaic 23534 1.68 3.185 $5.46
209 047 B 36.9 37.8 0.9 1.8 Cumberland 3570 1.49 3.177 $0.54210 040 B 36.2 37.2 1.0 2.0 Atlantic 7490 1.51 3.176 $0.60211 093 B 0.2 1.0 0.8 2.3 Bergen 26072 1.60 3.170 $0.69212 029 B 19.7 21.5 1.8 4.6 Hunterdon 3864 1.50 3.165 $1.38213 080L E 45.6 46.1 0.5 1.0 Morris 40463 1.86 3.164 $0.30214 179 B 1.1 2.6 1.5 3.6 Hunterdon 5286 1.51 3.164 $1.08215 206 B 55.6 56.3 0.7 1.4 Mercer 22274 1.59 3.164 $0.42216 047 B 11.4 14.0 2.6 5.2 Cape May 7680 1.52 3.162 $1.56217 018 N 6.9 7.5 0.6 1.2 Monmouth 22222 1.69 3.161 $0.36218 021 B 1.0 2.2 1.2 4.9 Essex 48794 1.72 3.159 $1.47219 018 S 39.8 40.6 0.8 2.1 Middlesex 48881 1.95 3.155 $0.63220 033 E 24.3 29.0 4.7 9.4 Monmouth 9372 1.58 3.155 $2.82221 040 E 1.8 3.6 1.8 3.6 Salem 6649 1.56 3.150 $1.08222 047 B 3.6 5.3 1.7 3.6 Cape May 15148 1.57 3.149 $1.08223 018 S 15.7 17.3 1.6 3.2 Monmouth 20509 1.69 3.149 $0.96224 070 B 19.0 27.5 8.5 17.0 Burlington 11472 1.55 3.148 $5.10225 037 E 6.0 7.0 1.0 2.7 Ocean 30211 1.78 3.148 $0.81226 206 S 70.6 71.5 0.9 1.8 Somerset 16221 1.66 3.144 $0.54227 440 S 23.0 25.0 2.0 4.3 Hudson 24731 1.74 3.142 $1.29228 063 B 0.1 2.9 2.8 8.3 Bergen 19724 1.60 3.139 $2.49229 033B B 0.0 3.0 3.0 6.6 Monmouth 9834 1.56 3.138 $1.98230 440 N 23.7 26.2 2.5 5.0 Hudson 24549 1.75 3.132 $1.50

A - 8
DEFICIENT PAVEMENTS SORTED BY BENEFIT RANK – CONTINUED
BenefitRank Rte Dir MP
StartMPEnd Len Lane
Miles County AvgAADT
AvgFPR Benefit
CostEstimate(Millions)
231 024 E 7.7 10.4 2.7 7.5 Essex,Union 49951 1.99 3.128 $2.25
232 206 B 98.4 99.6 1.2 2.9 Sussex 21912 1.63 3.127 $0.87233 130 N 44.2 45.2 1.0 3.0 Burlington 23466 1.74 3.127 $0.90234 047 B 23.1 24.3 1.2 2.4 Cape May 3338 1.54 3.125 $0.72235 045 B 27.7 28.4 0.7 2.7 Gloucester 15960 1.61 3.117 $0.81236 143 B 0.0 2.3 2.3 4.6 Camden 2196 1.55 3.114 $1.38237 046 B 69.2 70.3 1.1 4.6 Bergen 36602 1.71 3.114 $1.38
238 183 B 0.6 1.8 1.2 2.4 Morris,Sussex 14320 1.62 3.106 $0.72
239 130 N 62.5 64.9 2.4 4.8 Mercer 16216 1.70 3.103 $1.44240 049 B 52.2 53.3 1.1 2.2 Cape May 6386 1.58 3.103 $0.66241 032 W 0.1 0.6 0.5 0.9 Middlesex 13667 1.68 3.099 $0.27242 070 B 41.4 42.6 1.2 2.4 Ocean 20470 1.65 3.097 $0.72243 094 B 5.5 7.9 2.4 4.8 Warren 7058 1.60 3.094 $1.44244 284 B 0.0 7.0 7.0 14.0 Sussex 3144 1.58 3.093 $4.20245 054 B 5.8 8.4 2.6 5.2 Atlantic 11684 1.62 3.090 $1.56246 032 E 0.1 1.2 1.1 2.2 Middlesex 13546 1.70 3.086 $0.66247 094 B 12.8 13.8 1.0 2.0 Warren 5308 1.60 3.085 $0.60248 029 B 17.2 18.1 0.9 1.8 Hunterdon 11250 1.64 3.074 $0.54249 202 S 0.6 4.9 4.3 8.6 Hunterdon 6528 1.65 3.074 $2.58250 045 B 19.4 22.4 3.0 6.0 Gloucester 16518 1.66 3.073 $1.80251 083 B 0.9 1.9 1.0 2.0 Cape May 3500 1.60 3.073 $0.60252 206 B 117.7 125.8 8.1 17.3 Sussex 16550 1.66 3.072 $5.19253 049 B 27.0 35.8 8.8 17.6 Cumberland 10014 1.63 3.071 $5.28254 070 B 45.0 47.1 2.1 4.2 Ocean 14918 1.66 3.068 $1.26255 027 B 8.1 15.4 7.3 19.7 Middlesex 22984 1.70 3.064 $5.91
256 070 W 4.8 8.0 3.2 8.2 Burlington,Camden 29405 1.87 3.062 $2.46
257 049 B 12.7 25.0 12.3 24.8 Cumberland,Salem 5944 1.63 3.062 $7.44
258 070 B 39.8 40.6 0.8 1.6 Ocean 14722 1.67 3.062 $0.48259 036 B 6.5 9.4 2.9 5.8 Monmouth 14738 1.67 3.059 $1.74260 033B B 3.9 4.6 0.7 1.4 Monmouth 14484 1.67 3.059 $0.42261 068 B 0.4 1.1 0.7 1.8 Burlington 6322 1.64 3.053 $0.54262 035 B 22.2 22.7 0.5 1.5 Monmouth 18396 1.70 3.048 $0.45263 079 B 0.5 4.2 3.7 7.4 Monmouth 17034 1.70 3.042 $2.22264 206 B 126.5 127.4 0.9 1.8 Sussex 9860 1.67 3.041 $0.54265 036 S 1.4 3.8 2.4 4.9 Monmouth 20846 1.82 3.035 $1.47266 035 S 24.7 29.5 4.8 9.4 Monmouth 9257 1.72 3.030 $2.82267 078L E 52.9 53.4 0.5 1.5 Union 46968 2.07 3.027 $0.45268 001 S 27.6 28.4 0.8 2.5 Middlesex 51742 2.12 3.022 $0.75269 077 B 0.1 6.7 6.6 14.1 Cumberland 10378 1.69 3.021 $4.23270 036 N 12.0 22.3 10.3 21.0 Monmouth 12020 1.76 3.020 $6.30271 206 B 51.3 54.0 2.7 5.8 Mercer 17268 1.73 3.017 $1.74272 001 N 49.7 51.2 1.5 3.0 Essex 21575 1.85 3.016 $0.90

A - 9
DEFICIENT PAVEMENTS SORTED BY BENEFIT RANK – CONTINUED
BenefitRank Rte Dir MP
StartMPEnd Len Lane
Miles County AvgAADT
AvgFPR Benefit
CostEstimate(Millions)
273 030 B 18.0 32.0 14.0 56.0 Atlantic,Camden 20328 1.74 3.016 $16.80
274 206 B 60.4 68.5 8.1 18.2 Somerset 26912 1.81 2.986 $5.46275 440 N 22.1 23.2 1.1 2.0 Hudson 25761 1.92 2.985 $0.60276 156 B 0.1 0.7 0.6 1.2 Mercer 2298 1.70 2.984 $0.36277 018 S 30.5 35.5 5.0 10.6 Middlesex 28883 1.96 2.980 $3.18278 206 B 100.4 104.5 4.1 9.0 Sussex 17568 1.77 2.979 $2.70279 034 S 1.5 3.5 2.0 4.0 Monmouth 17979 1.86 2.973 $1.20280 034 B 21.7 23.2 1.5 4.5 Monmouth 20858 1.80 2.968 $1.35281 083 B 2.4 3.0 0.6 1.2 Cape May 3500 1.72 2.968 $0.36282 009 B 65.8 70.6 4.8 10.2 Ocean 20300 1.80 2.967 $3.06283 130 N 8.9 14.1 5.2 10.9 Gloucester 6064 1.76 2.965 $3.27
284 206 B 81.5 85.5 4.0 9.1 Morris,Somerset 21124 1.81 2.957 $2.73
285 018 N 29.5 33.1 3.6 7.2 Middlesex,Monmouth 26233 1.96 2.954 $2.16
286 045 B 11.1 17.6 6.5 13.0 Gloucester,Salem 4768 1.74 2.953 $3.90
287 173 B 2.5 11.5 9.0 24.7 Hunterdon,Warren 8984 1.77 2.942 $7.41
288 012 W 11.2 11.7 0.5 0.7 Hunterdon 7459 1.80 2.939 $0.21289 023 B 47.8 51.4 3.6 8.8 Sussex 4610 1.76 2.936 $2.64290 173 B 0.5 1.5 1.0 2.0 Warren 7964 1.78 2.932 $0.60291 040 E 4.5 5.0 0.5 1.0 Salem 6733 1.81 2.930 $0.30292 322 B 19.1 23.0 3.9 7.8 Gloucester 8346 1.79 2.927 $2.34293 021 S 10.8 12.0 1.2 3.6 Passaic 25007 1.98 2.925 $1.08
294 042 S 7.0 13.8 6.8 20.4 Camden,Gloucester 58080 2.29 2.919 $6.12
295 035 S 35.4 37.3 1.9 4.2 Monmouth 20535 1.95 2.914 $1.26296 206 B 92.9 93.9 1.0 2.0 Morris 25272 1.89 2.906 $0.60297 078 E 8.2 9.5 1.3 3.9 Hunterdon 41292 2.15 2.905 $1.17298 077 B 18.6 19.1 0.5 1.0 Gloucester 4250 1.79 2.904 $0.30299 073 N 13.5 15.3 1.8 3.6 Camden 8464 1.87 2.891 $1.08300 035 B 31.6 33.1 1.5 5.6 Monmouth 26580 1.91 2.887 $1.68301 072 E 27.4 28.7 1.3 2.6 Ocean 12077 1.91 2.886 $0.78302 017 N 11.8 16.5 4.7 13.9 Bergen 72544 2.36 2.874 $4.17303 057 B 7.8 8.4 0.6 1.2 Warren 18046 1.89 2.872 $0.36304 035 B 57.3 58.1 0.8 3.2 Middlesex 18488 1.90 2.869 $0.96305 035 B 29.5 31.0 1.5 6.0 Monmouth 24166 1.92 2.869 $1.80306 130 N 61.2 61.9 0.7 1.4 Mercer 16342 1.97 2.866 $0.42307 130 N 24.2 25.0 0.8 1.6 Gloucester 9248 1.90 2.866 $0.48308 077 B 20.1 21.5 1.4 2.8 Gloucester 4250 1.86 2.847 $0.84309 206 B 78.7 81.0 2.3 5.5 Somerset 28454 1.98 2.840 $1.65310 280 E 4.7 6.2 1.5 4.5 Essex 41274 2.23 2.839 $1.35311 029 B 27.8 34.3 6.5 13.0 Hunterdon 2136 1.86 2.838 $3.90312 022 E 34.3 35.6 1.3 3.6 Somerset 48694 2.30 2.838 $1.08313 280 W 0.2 1.3 1.1 2.2 Morris 30034 2.13 2.837 $0.66

A - 10
DEFICIENT PAVEMENTS SORTED BY BENEFIT RANK – CONTINUED
BenefitRank Rte Dir MP
StartMPEnd Len Lane
Miles County AvgAADT
AvgFPR Benefit
CostEstimate(Millions)
314 072 B 13.0 21.1 8.1 16.4 Ocean 13564 1.91 2.836 $4.92315 031 B 10.5 11.8 1.3 2.6 Mercer 12842 1.91 2.832 $0.78
316 001 N 35.9 38.5 2.6 7.5 Middlesex,Union 28071 2.12 2.826 $2.25
317 175 B 1.0 2.1 1.1 2.2 Mercer 1932 1.88 2.816 $0.66318 031 S 26.7 27.7 1.0 2.0 Hunterdon 10928 1.97 2.815 $0.60319 033 W 37.0 37.9 0.9 1.8 Monmouth 10312 1.97 2.815 $0.54320 023 B 27.4 30.6 3.2 6.7 Sussex 18520 1.96 2.811 $2.01321 046 E 57.1 60.8 3.7 10.3 Passaic 61460 2.43 2.809 $3.09322 009 B 39.8 41.8 2.0 4.4 Atlantic 14328 1.95 2.806 $1.32323 035 B 16.4 17.1 0.7 1.4 Monmouth 21644 2.00 2.791 $0.42324 018 S 44.1 45.3 1.2 3.2 Middlesex 22280 2.11 2.784 $0.96325 322 B 6.5 8.5 2.0 4.0 Gloucester 13698 1.98 2.772 $1.20326 004 E 1.5 3.3 1.8 4.8 Bergen 57263 2.45 2.771 $1.44327 033B B 5.3 6.6 1.3 2.6 Monmouth 14484 1.99 2.768 $0.78328 001 N 40.6 43.1 2.5 7.5 Union 31924 2.22 2.767 $2.25329 035 S 12.8 14.0 1.2 2.3 Ocean 14074 2.06 2.767 $0.69330 047 B 72.9 74.0 1.1 2.3 Gloucester 16244 2.00 2.766 $0.69331 009 B 10.3 10.8 0.5 1.0 Cape May 13584 1.99 2.765 $0.30332 030 W 36.4 40.5 4.1 8.2 Atlantic 9950 2.03 2.759 $2.46333 287 S 60.6 66.8 6.2 14.1 Bergen 28556 2.21 2.752 $4.23334 033 B 4.4 7.8 3.4 7.0 Mercer 15612 2.02 2.751 $2.10335 047 B 63.6 64.4 0.8 2.5 Gloucester 14388 2.02 2.746 $0.75336 070 W 0.0 0.5 0.5 1.5 Camden 24460 2.18 2.745 $0.45337 077 B 22.0 22.5 0.5 1.0 Gloucester 4250 1.97 2.744 $0.30338 073 N 23.6 24.3 0.7 1.4 Burlington 23747 2.17 2.743 $0.42339 044 B 5.8 6.6 0.8 1.6 Gloucester 7480 1.99 2.741 $0.48340 040 B 8.6 9.1 0.5 1.0 Salem 16020 2.03 2.736 $0.30341 073 B 7.5 8.9 1.4 5.6 Camden 12682 2.03 2.729 $1.68342 017 N 23.5 26.5 3.0 9.0 Bergen 36442 2.31 2.723 $2.70
343 046 B 7.5 22.2 14.7 30.1 Morris,Warren 9236 2.02 2.720 $9.03
344 076 N 1.3 2.0 0.7 3.4 Camden 91059 2.55 2.709 $1.02345 047 B 59.0 59.7 0.7 1.4 Gloucester 12376 2.05 2.707 $0.42346 034 B 14.7 15.5 0.8 1.6 Monmouth 14646 2.06 2.706 $0.48
347 033 W 18.2 19.2 1.0 2.0 Middlesex,Monmouth 14752 2.13 2.703 $0.60
348 009 B 60.0 65.1 5.1 10.2 Ocean 14972 2.07 2.701 $3.06349 287 N 20.5 21.5 1.0 2.0 Somerset 35866 2.33 2.701 $0.60
350 042 N 7.3 12.2 4.9 14.7 Camden,Gloucester 52644 2.51 2.683 $4.41
351 048 B 0.4 2.2 1.8 3.6 Salem 6310 2.06 2.673 $1.08
352 046 E 54.8 55.5 0.7 1.4 Essex,Passaic 31141 2.32 2.671 $0.42
353 001 S 11.3 12.8 1.5 5.2 Mercer,Middlesex 35971 2.37 2.670 $1.56
354 033 B 1.4 3.1 1.7 5.0 Mercer 15314 2.11 2.664 $1.50
A - 11
DEFICIENT PAVEMENTS SORTED BY BENEFIT RANK – CONTINUED
BenefitRank Rte Dir MP
StartMPEnd Len Lane
Miles County AvgAADT
AvgFPR Benefit
CostEstimate(Millions)
355 078 E 32.8 36.8 4.0 12.3 Somerset 37922 2.39 2.663 $3.69356 036 S 15.9 17.0 1.1 2.2 Monmouth 9612 2.14 2.657 $0.66357 001 S 34.5 35.1 0.6 1.8 Middlesex 24265 2.29 2.643 $0.54358 047 B 69.1 71.3 2.2 5.2 Gloucester 13346 2.13 2.642 $1.56359 072 B 0.1 5.9 5.8 11.6 Burlington 9042 2.11 2.642 $3.48360 440 S 20.3 21.7 1.4 2.8 Hudson 23724 2.29 2.640 $0.84361 080L W 65.4 67.5 2.1 6.9 Bergen 41957 2.46 2.635 $2.07362 280 W 4.0 5.3 1.3 2.7 Essex 41968 2.46 2.632 $0.81363 030 W 48.9 50.4 1.5 3.0 Atlantic 17562 2.24 2.631 $0.90
364 046 E 61.9 69.2 7.3 15.6 Bergen,Passaic 28132 2.34 2.628 $4.68
365 073 S 15.3 15.8 0.5 1.0 Camden 13894 2.23 2.610 $0.30366 073 S 13.0 14.8 1.8 3.6 Camden 8672 2.18 2.610 $1.08367 030 W 54.3 57.0 2.7 6.1 Atlantic 27913 2.36 2.608 $1.83368 024 W 9.1 9.9 0.8 2.4 Union 53030 2.59 2.607 $0.72369 093 B 2.6 3.4 0.8 1.6 Bergen 27388 2.23 2.607 $0.48370 168 B 7.4 8.3 0.9 3.5 Camden 23080 2.22 2.602 $1.05371 038 E 9.7 13.5 3.8 11.1 Burlington 19929 2.30 2.600 $3.33372 017 S 12.9 14.9 2.0 6.0 Bergen 74471 2.68 2.589 $1.80373 040 B 10.8 16.3 5.5 11.0 Salem 13636 2.19 2.587 $3.30374 046 W 42.6 43.6 1.0 2.2 Morris 14700 2.26 2.586 $0.66375 029 N 18.1 18.7 0.6 1.2 Hunterdon 5625 2.18 2.585 $0.36376 037 E 8.2 11.2 3.0 9.0 Ocean 26718 2.38 2.578 $2.70377 057 B 0.2 3.9 3.7 7.4 Warren 13934 2.20 2.577 $2.22378 073 N 18.1 19.6 1.5 3.0 Camden 18549 2.31 2.576 $0.90379 054 S 8.4 9.1 0.7 1.3 Atlantic 6997 2.21 2.570 $0.39380 287 S 20.5 30.2 9.7 19.4 Somerset 44343 2.57 2.553 $5.82381 072 W 22.2 22.8 0.6 1.2 Ocean 23214 2.38 2.548 $0.36382 044 B 2.0 3.4 1.4 2.8 Gloucester 2872 2.19 2.544 $0.84383 035 S 47.1 49.1 2.0 4.4 Middlesex 14365 2.31 2.544 $1.32384 130 S 27.3 28.8 1.5 4.5 Camden 22460 2.39 2.540 $1.35385 047 B 43.9 46.5 2.6 6.1 Cumberland 23692 2.29 2.539 $1.83386 036 S 12.6 15.1 2.5 5.0 Monmouth 10144 2.28 2.531 $1.50387 031 B 1.2 3.4 2.2 8.7 Mercer 11636 2.24 2.530 $2.61388 017 S 3.5 6.5 3.0 8.2 Bergen 38763 2.55 2.524 $2.46389 001 S 15.0 22.2 7.2 15.7 Middlesex 28876 2.47 2.520 $4.71390 041 N 13.0 13.9 0.9 1.8 Burlington 10684 2.30 2.515 $0.54391 050 B 24.4 26.0 1.6 3.2 Atlantic 6112 2.24 2.510 $0.96392 040 B 43.0 43.6 0.6 1.2 Atlantic 7928 2.28 2.485 $0.36393 130 N 27.6 28.9 1.3 3.9 Camden 22447 2.45 2.483 $1.17
394 009 B 102.9 103.4 0.5 2.0 Monmouth,Ocean 46216 2.48 2.464 $0.60
395 072 E 26.1 26.8 0.7 1.4 Ocean 12077 2.38 2.458 $0.42396 057 B 14.7 18.6 3.9 8.0 Warren 14942 2.34 2.455 $2.40397 090 W 2.1 2.7 0.6 1.9 Camden 14949 2.41 2.453 $0.57398 072 W 25.4 28.4 3.0 6.5 Ocean 12077 2.40 2.439 $1.95

A - 12
DEFICIENT PAVEMENTS SORTED BY BENEFIT RANK – CONTINUED
BenefitRank Rte Dir MP
StartMPEnd Len Lane
Miles County AvgAADT
AvgFPR Benefit
CostEstimate(Millions)
399 021 S 4.1 4.6 0.5 1.4 Essex 26311 2.53 2.438 $0.42
400 077 B 9.0 10.8 1.8 3.6 Cumberland,Salem 5800 2.32 2.437 $1.08
401 009 N 115.2 116.1 0.9 1.9 Monmouth 29608 2.58 2.421 $0.57402 073 S 20.3 21.3 1.0 2.0 Camden 18549 2.49 2.416 $0.60403 287 S 51.0 53.1 2.1 6.9 Morris 36179 2.66 2.411 $2.07404 206 N 69.4 71.5 2.1 5.1 Somerset 16221 2.48 2.408 $1.53405 022 W 19.7 25.3 5.6 10.8 Hunterdon 12829 2.45 2.400 $3.24406 130 N 25.9 26.9 1.0 2.6 Camden 14664 2.47 2.397 $0.78407 021 S 12.7 14.3 1.6 3.2 Passaic 26492 2.60 2.379 $0.96408 020 N 0.5 4.0 3.5 7.8 Passaic 26807 2.61 2.372 $2.34409 047 S 2.3 3.0 0.7 1.4 Cape May 14092 2.50 2.364 $0.42410 001 N 20.6 21.4 0.8 1.8 Middlesex 35692 2.71 2.359 $0.54411 185 S 0.0 0.6 0.6 1.2 Hudson 6261 2.45 2.351 $0.36412 001 S 4.8 5.9 1.1 2.2 Mercer 19966 2.58 2.347 $0.66413 009 B 29.0 30.5 1.5 3.0 Cape May 7644 2.43 2.347 $0.90414 073 S 17.7 19.6 1.9 3.8 Camden 18549 2.59 2.324 $1.14415 021 N 13.1 13.8 0.7 1.4 Passaic 26561 2.67 2.321 $0.42416 078 E 31.3 32.1 0.8 3.2 Somerset 38251 2.78 2.318 $0.96417 094 B 9.3 10.1 0.8 1.6 Warren 6798 2.46 2.311 $0.48418 322 W 45.9 49.1 3.2 6.4 Atlantic 10316 2.56 2.286 $1.92419 035 S 20.0 20.5 0.5 1.0 Monmouth 10707 2.57 2.277 $0.30
420 295 N 8.0 9.6 1.6 3.2 Gloucester,Salem 15258 2.63 2.264 $0.96
421 029 B 22.6 25.7 3.1 6.2 Hunterdon 2416 2.50 2.258 $1.86422 073 B 11.3 13.0 1.7 6.8 Camden 19642 2.60 2.241 $2.04423 094 B 41.3 45.8 4.5 9.0 Sussex 6726 2.54 2.239 $2.70424 047 B 32.3 34.9 2.6 5.2 Cumberland 18140 2.60 2.233 $1.56425 046 B 25.2 27.1 1.9 7.6 Morris 25272 2.64 2.231 $2.28426 009 N 107.2 109.3 2.1 4.2 Monmouth 20614 2.71 2.230 $1.26427 078 E 41.3 42.2 0.9 2.7 Somerset 47364 2.96 2.227 $0.81428 073 B 10.0 10.5 0.5 2.0 Camden 13316 2.62 2.197 $0.60429 322 B 15.2 15.8 0.6 2.1 Gloucester 18334 2.65 2.196 $0.63430 071 B 1.2 1.7 0.5 1.0 Monmouth 14588 2.63 2.194 $0.30431 147 E 1.3 2.0 0.7 1.4 Cape May 7863 2.65 2.180 $0.42432 030 E 54.9 56.2 1.3 2.6 Atlantic 28421 2.85 2.172 $0.78433 278 E 0.0 0.9 0.9 2.2 Union 12047 2.70 2.168 $0.66434 009 B 17.1 18.5 1.4 2.8 Cape May 14672 2.66 2.166 $0.84435 206 B 127.9 129.3 1.4 2.8 Sussex 7836 2.64 2.159 $0.84436 040 B 23.4 24.2 0.8 1.6 Salem 9872 2.65 2.154 $0.48437 031 N 25.9 26.8 0.9 1.8 Hunterdon 10928 2.83 2.046 $0.54438 040 W 4.3 5.0 0.7 1.4 Salem 6733 2.79 2.042 $0.42
Totals 2705.6 $811.95